
- Mark as New
- Bookmark
- Subscribe
- Mute
- Subscribe to RSS Feed
- Permalink
- Report Inappropriate Content
Greetings,
I receive the following error when trying to view the hardware status of my ESXi 6.5 hosts via vCenter 6.5 appliance.
a general system error occurred retrieve ipmi sel request to host failed
This started to occur after I updated the drivers and providers for my MegaRAID cards in the ESXi hosts. I did not receive this error prior to making these changes. I can monitor hardware status without any errors if I log directly into the ESXi hosts.
Any help would be much appreciated. Thanks!
-
All forum topics -
Previous Topic -
Next Topic
1 Solution

- Mark as New
- Bookmark
- Subscribe
- Mute
- Subscribe to RSS Feed
- Permalink
- Report Inappropriate Content
I had this issue as well till yesterday. I think it is related to the fact, that somehow the loglevel of the vpxa is set to verbose. I always had to restart vpxa to allow this feature to work again for a short time.
Now I have set the loglevel of vpxa to info and some other loglevels reduced to info, too. Now the hardware sensors can be queried via vcenter webclient for one whole day without the need to reboot vpxa and I hope, that this remains so for the future.
May be that will help you, too.
15 Replies
- Mark as New
- Bookmark
- Subscribe
- Mute
- Subscribe to RSS Feed
- Permalink
- Report Inappropriate Content
ESXi 6.5.0 (Build 5310538)
Supermicro X9DR3-F
Here is the log from one of the ESXi hosts.
2017-07-13T23:19:53.287Z cpu0:65536)VisorFSTar: 1954: ipmi_ipm.v00 for 0xa17f bytes
2017-07-13T23:19:53.287Z cpu0:65536)VisorFSTar: 1954: ipmi_ipm.v01 for 0x1417f bytes
2017-07-13T23:19:53.287Z cpu0:65536)VisorFSTar: 1954: ipmi_ipm.v02 for 0x1917f bytes
2017-07-13T23:20:21.052Z cpu1:65890)Activating Jumpstart plugin ipmi.
2017-07-13T23:20:21.063Z cpu2:66368)Loading module ipmi …
2017-07-13T23:20:21.066Z cpu2:66368)Elf: 2043: module ipmi has license VMware
2017-07-13T23:20:21.068Z cpu2:66368)ipmi: SMBIOS IPMI Entry: Address: 0x0, System Interface: 0, Alignment: 1, Map Type: 1
2017-07-13T23:20:21.068Z cpu2:66368)ipmi: KCS Memory Map: Command Address: 0x41000dc38001 Data Address: 0x41000dc38000.
2017-07-13T23:20:21.515Z cpu0:66368)WARNING: ipmi: WriteStartPhase:217: ipmi: Timed out waiting for IBF to clear in write start phase.. Error: Timeout
2017-07-13T23:20:21.515Z cpu0:66368)WARNING: ipmi: SysIntKcs_ProcessRequest:577: ipmi: Failure in KCS write start phase. Error: Timeout
2017-07-13T23:20:21.515Z cpu0:66368)WARNING: ipmi: GetDeviceId:735: ipmi: Failed to process Get Device ID request. Error: Timeout
2017-07-13T23:20:21.956Z cpu1:66368)WARNING: ipmi: WriteStartPhase:217: ipmi: Timed out waiting for IBF to clear in write start phase.. Error: Timeout
2017-07-13T23:20:21.956Z cpu1:66368)WARNING: ipmi: SysIntKcs_ProcessRequest:577: ipmi: Failure in KCS write start phase. Error: Timeout
2017-07-13T23:20:21.956Z cpu1:66368)WARNING: ipmi: GetDeviceId:735: ipmi: Failed to process Get Device ID request. Error: Timeout
2017-07-13T23:20:22.402Z cpu1:66368)WARNING: ipmi: WriteStartPhase:217: ipmi: Timed out waiting for IBF to clear in write start phase.. Error: Timeout
2017-07-13T23:20:22.402Z cpu1:66368)WARNING: ipmi: SysIntKcs_ProcessRequest:577: ipmi: Failure in KCS write start phase. Error: Timeout
2017-07-13T23:20:22.402Z cpu1:66368)WARNING: ipmi: GetDeviceId:735: ipmi: Failed to process Get Device ID request. Error: Timeout
2017-07-13T23:20:22.402Z cpu1:66368)WARNING: ipmi: IpmiDriver_Init:208: ipmi: IPMI Device failed to respond to the GET DEVICE ID request. Error: Timeout
2017-07-13T23:20:22.402Z cpu1:66368)WARNING: ipmi: CreateIpmiDrivers:1256: ipmi: Failed to initialize IPMI driver. Error: Timeout
2017-07-13T23:20:22.402Z cpu1:66368)ipmi: No valid IPMI devices were discovered based upon PCI, ACPI or SMBIOS entries, attempting to discover IPMI devices at defaul
t locations
2017-07-13T23:20:22.402Z cpu1:66368)ipmi: KCS Port Map: Command Port: 0xca3 Data Port: 0xca2
2017-07-13T23:20:22.403Z cpu1:66368)Mod: 4968: Initialization of ipmi succeeded with module ID 81.
2017-07-13T23:20:22.403Z cpu1:66368)ipmi loaded successfully.
2017-07-13T23:20:22.410Z cpu1:65890)Jumpstart plugin ipmi activated.
VMB: 323: name: /ipmi_ipm.v00
VMB: 323: name: /ipmi_ipm.v01
VMB: 323: name: /ipmi_ipm.v02
TSC: 503500 cpu0:1)BootConfig: 433: ipmiEnabled = TRUE
2017-07-14T00:45:49.301Z cpu0:65536)VisorFSTar: 1954: ipmi_ipm.v00 for 0xa17f bytes
2017-07-14T00:45:49.302Z cpu0:65536)VisorFSTar: 1954: ipmi_ipm.v01 for 0x1417f bytes
2017-07-14T00:45:49.302Z cpu0:65536)VisorFSTar: 1954: ipmi_ipm.v02 for 0x1917f bytes
2017-07-14T00:46:17.420Z cpu5:65890)Activating Jumpstart plugin ipmi.
2017-07-14T00:46:17.443Z cpu7:66368)Loading module ipmi …
2017-07-14T00:46:17.446Z cpu7:66368)Elf: 2043: module ipmi has license VMware
2017-07-14T00:46:17.448Z cpu7:66368)ipmi: SMBIOS IPMI Entry: Address: 0x0, System Interface: 0, Alignment: 1, Map Type: 1
2017-07-14T00:46:17.448Z cpu7:66368)ipmi: KCS Memory Map: Command Address: 0x41000dc22001 Data Address: 0x41000dc22000.
2017-07-14T00:46:17.903Z cpu7:66368)WARNING: ipmi: WriteStartPhase:217: ipmi: Timed out waiting for IBF to clear in write start phase.. Error: Timeout
2017-07-14T00:46:17.903Z cpu7:66368)WARNING: ipmi: SysIntKcs_ProcessRequest:577: ipmi: Failure in KCS write start phase. Error: Timeout
2017-07-14T00:46:17.903Z cpu7:66368)WARNING: ipmi: GetDeviceId:735: ipmi: Failed to process Get Device ID request. Error: Timeout
2017-07-14T00:46:18.365Z cpu7:66368)WARNING: ipmi: WriteStartPhase:217: ipmi: Timed out waiting for IBF to clear in write start phase.. Error: Timeout
2017-07-14T00:46:18.365Z cpu7:66368)WARNING: ipmi: SysIntKcs_ProcessRequest:577: ipmi: Failure in KCS write start phase. Error: Timeout
2017-07-14T00:46:18.365Z cpu7:66368)WARNING: ipmi: GetDeviceId:735: ipmi: Failed to process Get Device ID request. Error: Timeout
2017-07-14T00:46:18.792Z cpu7:66368)WARNING: ipmi: WriteStartPhase:217: ipmi: Timed out waiting for IBF to clear in write start phase.. Error: Timeout
2017-07-14T00:46:18.792Z cpu7:66368)WARNING: ipmi: SysIntKcs_ProcessRequest:577: ipmi: Failure in KCS write start phase. Error: Timeout
2017-07-14T00:46:18.792Z cpu7:66368)WARNING: ipmi: GetDeviceId:735: ipmi: Failed to process Get Device ID request. Error: Timeout
2017-07-14T00:46:18.792Z cpu7:66368)WARNING: ipmi: IpmiDriver_Init:208: ipmi: IPMI Device failed to respond to the GET DEVICE ID request. Error: Timeout
2017-07-14T00:46:18.792Z cpu7:66368)WARNING: ipmi: CreateIpmiDrivers:1256: ipmi: Failed to initialize IPMI driver. Error: Timeout
2017-07-14T00:46:18.792Z cpu7:66368)ipmi: No valid IPMI devices were discovered based upon PCI, ACPI or SMBIOS entries, attempting to discover IPMI devices at defaul
t locations
2017-07-14T00:46:18.792Z cpu7:66368)ipmi: KCS Port Map: Command Port: 0xca3 Data Port: 0xca2
2017-07-14T00:46:18.793Z cpu7:66368)Mod: 4968: Initialization of ipmi succeeded with module ID 81.
2017-07-14T00:46:18.793Z cpu7:66368)ipmi loaded successfully.
2017-07-14T00:46:18.800Z cpu5:65890)Jumpstart plugin ipmi activated.
- Mark as New
- Bookmark
- Subscribe
- Mute
- Subscribe to RSS Feed
- Permalink
- Report Inappropriate Content
- Mark as New
- Bookmark
- Subscribe
- Mute
- Subscribe to RSS Feed
- Permalink
- Report Inappropriate Content
I am still receiving this error in vCenter. I have confirmed that the clocks between all hosts are in sync. This is the only function that I am having problems with. If I log directly into the ESXi hosts I can query sensor data no problem. Could this be a driver/software issue? Would updating to ESXi 6.5 u1 possibly fix this problem?
- Mark as New
- Bookmark
- Subscribe
- Mute
- Subscribe to RSS Feed
- Permalink
- Report Inappropriate Content
It’s kind of good to know that I’m not the only one. I have no idea how to fix this problem.
I tried updating NTP settings, updating the vcenter appliance software, making sure my hosts are using the same drivers. I don’t have a support contract so I haven’t contacted support yet.
What have you tried?
- Mark as New
- Bookmark
- Subscribe
- Mute
- Subscribe to RSS Feed
- Permalink
- Report Inappropriate Content
I had this issue as well till yesterday. I think it is related to the fact, that somehow the loglevel of the vpxa is set to verbose. I always had to restart vpxa to allow this feature to work again for a short time.
Now I have set the loglevel of vpxa to info and some other loglevels reduced to info, too. Now the hardware sensors can be queried via vcenter webclient for one whole day without the need to reboot vpxa and I hope, that this remains so for the future.
May be that will help you, too.
- Mark as New
- Bookmark
- Subscribe
- Mute
- Subscribe to RSS Feed
- Permalink
- Report Inappropriate Content
I just started seeing this today myself. I have an R520 and a R730 with Enterprise iDrac on VMware 6.5U1. Been running no problem for 14 days or so, now I’m getting the Retrieve IPMI SEL request to host failed. I have a R320 with a Basic Management iDrac and everything runs fine.
- Mark as New
- Bookmark
- Subscribe
- Mute
- Subscribe to RSS Feed
- Permalink
- Report Inappropriate Content
I think the loglevel is the solution. Since setting the loglevel of vpxa to «info» the hardware status is working for almost one week without any problems.
You have to edit /etc/vmware/vpxa/vpxa.cfg on the host, which produces errrors on querying the hardware status via vcenter, to change this setting. Then restart vpxa and that’s it.
HTH
- Mark as New
- Bookmark
- Subscribe
- Mute
- Subscribe to RSS Feed
- Permalink
- Report Inappropriate Content
Is this the section I should change from «verbose» to «info» ? If so, change all instances of verbose to info?
<log>
<level>verbose</level>
<maxFileNum>10</maxFileNum>
<maxFileSize>1048576</maxFileSize>
<memoryLevel>verbose</memoryLevel>
<outputToConsole>false</outputToConsole>
<outputToFiles>false</outputToFiles>
<outputToSyslog>true</outputToSyslog>
<syslog>
<facility>local4</facility>
<ident>Vpxa</ident>
<logHeaderFile>/var/run/vmware/vpxaLogHeader.txt</logHeaderFile>
</syslog>
</log>
Thanks!
Содержание
- General system error occurred retrieve ipmi sel request to host failed
- Популярные Похожие записи:
- 2 Responses to VMware esxi 5.1: Вылез Alarm ‘Host IPMI System Event Log Status’ русская версия
- vSphere 6.5U1g Proactive HA Issue.
- LIFE IN A VIRTUAL SPACE
- Tips and tricks of managing the virtual environment
- ESXi 6.5: Retrieve IPMI SEL request to host failed [FIXED BY VENDOR]
- VMware — Dell R730 — IPMI Error
- 6 Replies
- Read these next.
- poor wifi, school’s third floor
- Need help crafting a job posting for an IT Pro
- Snap! — AI Eye Contact, Mine Batteries, Headset-free Metaverse, D&D Betrayal
- Spark! Pro series – 13th January 2023
General system error occurred retrieve ipmi sel request to host failed

VMware esxi 5.1 Вылез Alarm ‘Host IPMI System Event Log Status’ русская версия
Добрый день уважаемые читатели блога pyatilistnik.org, сегодня хочется рассказать в данной статье о ошибке VMware esxi 5 Alert Host IPMI System Event Log Status, сообщает что у ва переполнился журнал Systemevent.log, почистить его очень просто, до определенного обновления чиститься он не хотел, лишь в патчах ESXi 5.1 Update 2 (Сборка 1483097) и ESXi 5.5 Patch 1 (Сборка 1474528) это поправили и помимо графической возможности сделали еще и команду.
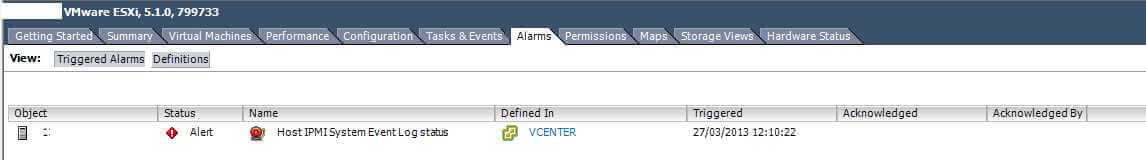
Выберем нужный хост и видим наш тревожный сигнал, что все сейчас взорвется и все такое. Посмотрели и идем дальше во вкладку Hardware staus.
VMware esxi 5.1: Вылез Alarm ‘Host IPMI System Event Log Status’ русская версия
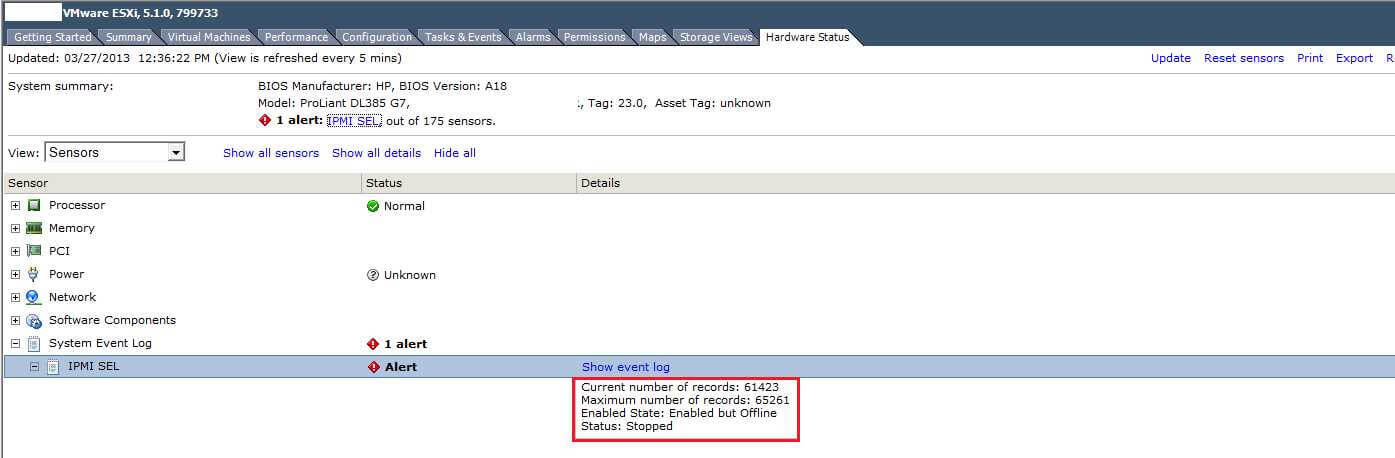
Дальше вверху выбираем System Event Log и щелкаем System Event Log, затем Reset sensors. Английская версия статьи
Популярные Похожие записи:
2 Responses to VMware esxi 5.1: Вылез Alarm ‘Host IPMI System Event Log Status’ русская версия
Подскажите пожалуйста что означает alarm и где его лучше применять, в каком контексте? И какие еще есть значения? Заранее спасибо
В сфере IT это писец, если по русски то тревога, которая требует быстрой реакции и решения.
Источник
vSphere 6.5U1g Proactive HA Issue.
Bugs are a part of life, because human made Computer, Computer never made a human. So We can expect a bugs around us. Today we will post about one of the issues that has been seen in one of my testing environment. After we upgrade our vSphere Environment to 6.5U1g we had seen some issues with enabling Proactive HA. Also Host Hardware Status become Unknown in vSphere 6.5U1g when Enabling Proactive HA with a “ESXi host has warning : A general system error occurred: Retrieve IPMI SEL request to host failed” . I have raised a production support case with VMware Support team, and we had done some log analysis together, as this is a technical post I am providing the logs for reference. Here is the vCenter Log analysis.

$zgrep “Retrieve IPMI SEL request to host failed” vpxd*|wc -l
vpxd log shows failure to login to Openwsmand
2018-05-15T11:46:35.606+07:00 info vpxd[7F1A2D49B700] [Originator@6876 sub=MoHost opID=dam-auto-generated: HardwareStatusViewMediator:dr-2009:CimMonitorPropertyProvider:200002:8475-5609-ngc:70000944-c9] WSMan Msg size 59: part:401 Unauthorized^M
–> WWW-Authenticate: Basic realm=”OPENWSMAN”!@x1ax7f
2018-05-15T11:46:35.608+07:00 warning vpxd[7F1A2D49B700] [Originator@6876 sub=Default opID=dam-auto-generated: HardwareStatusViewMediator:dr-2009:CimMonitorPropertyProvider:200002:8475-5609-ngc:70000944-c9] Closing Response processing in unexpected state: 3
2018-05-15T11:46:35.609+07:00 info vpxd[7F1A2D49B700] [Originator@6876 sub=vpxLro opID=dam-auto-generated: HardwareStatusViewMediator:dr-2009:CimMonitorPropertyProvider:200002:8475-5609-ngc:70000944-c9] [VpxLRO] — FINISH task-247756
2018-05-15T11:46:35.609+07:00 info vpxd[7F1A2D49B700] [Originator@6876 sub=Default opID=dam-auto-generated: HardwareStatusViewMediator:dr-2009:CimMonitorPropertyProvider:200002:8475-5609-ngc:70000944-c9] [VpxLRO] — ERROR task-247756 — healthStatusSystem-9239 — vim.host.HealthStatusSystem.FetchSystemEventLog: vmodl.fault.SystemError:
–> faultCause = (vmodl.MethodFault) null,
–> reason = “Retrieve IPMI SEL request to host failed”
2018-05-17T03:50:52Z : dlopen /usr/lib/libticket.so.0 failed, error: /usr/lib/libticket.so.0: cannot open shared object file: No such file or directory, exiting. 0 Success
openwsman was trying to use a library(/usr/lib/libticket.so.0) which is not present in system.”

With the help of VMware Support team they had raised a request with there internal engineering team to check this issue, VMware engineering team has pointed out that this is a bug in this version of ESXI and suggestion is to upgrade the ESXI host to update 2. Please find release notes which states that “An ESXi host might not have access to the Web Services for Management (WSMan) protocol due to failed CIM ticket authentication”
If you are not in a situation or don’t want to upgrade due to some dependencies or tight schedule you can raise a production support request with VMware GSS and they can ask for the bug fix related to this issue. Thanks and hope its been informative for you if you are running 6.5U1g in your environment.
Источник
LIFE IN A VIRTUAL SPACE
Tips and tricks of managing the virtual environment
ESXi 6.5: Retrieve IPMI SEL request to host failed [FIXED BY VENDOR]
From time to time you might want to check the host hardware health manually in Monitor>Hardware Health (vSphere Client) or Monitor>Hardware Status (vSphere Web Client).
For many months this functionality has been broken for ESXi 6.5 on DellEMC servers.

When opening the Sensors page, vpxd.log shows the following message:
info vpxd[7FBE59924700] [Originator@6876 sub=vpxLro opID=dam-auto-generated: HardwareStatusViewMediator:dr-425:CimMonitorPropertyProvider:200359:14133-31991-ngc:70004153-e9] [VpxLRO] — BEGIN task-35318 — healthStatusSystem-34 — vim.host.HealthStatusSystem.FetchSystemEventLog
error vpxd[7FBE59924700] [Originator@6876 sub=MoHost opID=dam-auto-generated: HardwareStatusViewMediator:dr-425:CimMonitorPropertyProvider:200359:14133-31991-ngc:70004153-e9] No Content-Length header, WSMan IPMI SEL operation failed
info vpxd[7FBE59924700] [Originator@6876 sub=MoHost opID=dam-auto-generated: HardwareStatusViewMediator:dr-425:CimMonitorPropertyProvider:200359:14133-31991-ngc:70004153-e9] WSMan Msg size 59: part: 401 Unauthorized
–> WWW-Authenticate: Basic realm=”OPENWSMAN”)l▒x7f
warning vpxd[7FBE59924700] [Originator@6876 sub=Default opID=dam-auto-generated: HardwareStatusViewMediator:dr-425:CimMonitorPropertyProvider:200359:14133-31991-ngc:70004153-e9] Closing Response processing in unexpected state: 3
info vpxd[7FBE59924700] [Originator@6876 sub=vpxLro opID=dam-auto-generated: HardwareStatusViewMediator:dr-425:CimMonitorPropertyProvider:200359:14133-31991-ngc:70004153-e9] [VpxLRO] — FINISH task-35318
info vpxd[7FBE59924700] [Originator@6876 sub=Default opID=dam-auto-generated: HardwareStatusViewMediator:dr-425:CimMonitorPropertyProvider:200359:14133-31991-ngc:70004153-e9] [VpxLRO] — ERROR task-35318 — healthStatusSystem-34 — vim.host.HealthStatusSystem.FetchSystemEventLog: vmodl.fault.SystemError:
–> Result:
–> (vmodl.fault.SystemError) <
–> faultCause = (vmodl.MethodFault) null,
–> faultMessage = ,
–> reason = “Retrieve IPMI SEL request to host failed”
–> msg = “”
–> >
–> Args:
–>
Many people were pointing to vpxa.cfg (here and here) as a source of the error:
It was not the end of the world, and I didn’t want to edit default log levels manually. So the issue was ignored for a while.
To my great surprise, it all went back to normal after updating hypervisor to the latest version using Dell EMC customised VMware ESXi 6.5 U1 A10 image.
Now, we can see multiple events in vpxd.log generated by VpxLRO:
info vpxd[7FBE58B08700] [Originator@6876 sub=vpxLro opID=combined(dam-auto-generated: ObjectTabbedViewMediator:dr-519,dam-auto-generated: ObjectPropertyFilter:dr-521):01-e6] [VpxLRO] — BEGIN lro-490638 — ResourceModel — cis.data.provider.ResourceModel.query
info vpxd[7FBE58B08700] [Originator@6876 sub=vpxLro opID=combined(dam-auto-generated: ObjectTabbedViewMediator:dr-519,dam-auto-generated: ObjectPropertyFilter:dr-521):01-e6] [VpxLRO] — FINISH lro-490638
info vpxd[7FBE58B08700] [Originator@6876 sub=vpxLro opID=combined(dam-auto-generated: ObjectPropertyFilter:dr-529,dam-auto-generated: ObjectPropertyFilter:dr-533):01-86] [VpxLRO] — BEGIN lro-490639 — ResourceModel — cis.data.provider.ResourceModel.query
info vpxd[7FBE58B08700] [Originator@6876 sub=vpxLro opID=combined(dam-auto-generated: ObjectPropertyFilter:dr-529,dam-auto-generated: ObjectPropertyFilter:dr-533):01-86] [VpxLRO] — FINISH lro-490639
info vpxd[7FBE5B45A700] [Originator@6876 sub=vpxLro opID=dam-auto-generated: ObjectPropertyFilter:dr-529:AssociationHostSystemAdapter:200359:14388-32550-ngc:70004210-ce] [VpxLRO] — BEGIN lro-490640 — HostProfileManager — vim.profile.ProfileManager.findAssociatedProfile
info vpxd[7FBE5B45A700] [Originator@6876 sub=vpxLro opID=dam-auto-generated: ObjectPropertyFilter:dr-529:AssociationHostSystemAdapter:200359:14388-32550-ngc:70004210-ce] [VpxLRO] — FINISH lro-490640
info vpxd[7FBE5A236700] [Originator@6876 sub=vpxLro opID=dam-auto-generated: RelatedItemsManager:dr-535:01-78] [VpxLRO] — BEGIN lro-490641 — ResourceModel — cis.data.provider.ResourceModel.query
info vpxd[7FBE5A236700] [Originator@6876 sub=vpxLro opID=dam-auto-generated: RelatedItemsManager:dr-535:01-78] [VpxLRO] — FINISH lro-490641
2018-04-12T14:02:41.702+08:00 info vpxd[7FBE5A236700] [Originator@6876 sub=vpxLro opID=dam-auto-generated: HardwareStatusViewMediator:dr-545:01-d9] [VpxLRO] — BEGIN lro-490642 — ResourceModel — cis.data.provider.ResourceModel.query
info vpxd[7FBE5A236700] [Originator@6876 sub=vpxLro opID=dam-auto-generated: HardwareStatusViewMediator:dr-545:01-d9] [VpxLRO] — FINISH lro-490642
info vpxd[7FBE5ACCB700] [Originator@6876 sub=vpxLro opID=urn:vmomi:HostSystem:host-28:9a78adfb-4c75-4b84-8d9a-65ab2cc71e51.properties:01-c1] [VpxLRO] — BEGIN lro-490643 — ResourceModel — cis.data.provider.ResourceModel.query
info vpxd[7FBE5ACCB700] [Originator@6876 sub=vpxLro opID=urn:vmomi:HostSystem:host-28:9a78adfb-4c75-4b84-8d9a-65ab2cc71e51.properties:01-c1] [VpxLRO] — FINISH lro-490643
info vpxd[7FBE5A53C700] [Originator@6876 sub=vpxLro opID=dam-auto-generated: HardwareStatusViewMediator:dr-545:CimMonitorPropertyProvider:200359:14395-32555-ngc:70004212-2b] [VpxLRO] — BEGIN task-35322 — healthStatusSystem-28 — vim.host.HealthStatusSystem.FetchSystemEventLog
info vpxd[7FBE5A53C700] [Originator@6876 sub=vpxLro opID=dam-auto-generated: HardwareStatusViewMediator:dr-545:CimMonitorPropertyProvider:200359:14395-32555-ngc:70004212-2b] [VpxLRO] — FINISH task-35322
As a result, the ‘Refresh hardware IPMI System Event Log’ task completes successfully.
Источник
VMware — Dell R730 — IPMI Error
I started getting an error in vCenter today from one of my hosts. It’s a Dell R730. Error is «A general system error occurred: Retrieve IPMI SEL request to host failed». I get another error when I try and reset the system event log. I’ve checked the Hardware Status and all senors are «Normal», there’s no Alerts and Warnings and nothing in the System event log.
If I add the Dell repository into Update Manager and scan the host, I can see iSM 3.0.1 for ESXi600, but when I look at the details for that patch, I don’t see R730 in the list, ,just R740. Would update manager show a non-compatible patch/update?
Host has been up for 14 days with no errors until now.


Actually looks like it’s not just 1 server, but 2 of my 3. 2 of the 3 have Enterprise iDrac and the one that isn’t giving an error has Basic Management iDrac.

Honestly, I would contact Vmware first, because I assume you have support with them, and see what they say. They may bounce you over to Dell and they can confirm if the devices are compatible for the update purpose. In doing generic googling for this issue, it seems that this can all go south if time is not synhcronized correctly between Vcenter, Guests and Hosts so double check all of that.
I have «Subscription Only» support through VMware. iDrac and Hosts are all set to the same NTP servers.
Restarting the Management agents on the 2 hosts fixed the issue, but I know this is just a fix, has to be some underlying issue.
Command run on the hosts: /etc/init.d/vpxa restart

Restarting the Management agents on the 2 hosts fixed the issue, but I know this is just a fix, has to be some underlying issue.
Command run on the hosts: /etc/init.d/vpxa restart
Update your Dell specific bits on the host. If you have VMware Update manager deployed add the Dell repository and blast a remediate all on that stuff.
I have the update manager and the Dell repository and there are no updates for those 2 servers.
This topic has been locked by an administrator and is no longer open for commenting.
To continue this discussion, please ask a new question.
Read these next.

poor wifi, school’s third floor
I work as a help desk technician at a high school for a school district. Teachers/students on the building’s third floor have been reporting poor wifi, with their Chromebooks/laptops etc experiencing slow connectivity and random disconnections. We hav.

Need help crafting a job posting for an IT Pro
I’d really appreciate some thoughts and advice. I’m looking to hire an IT pro to be our resident go-to for all things IT (device support, SQL Server, network admin, etc) but who also is interested in learning — or even has some experience in — the.

Snap! — AI Eye Contact, Mine Batteries, Headset-free Metaverse, D&D Betrayal
Your daily dose of tech news, in brief. Welcome to the Snap! Flashback: January 13, 1874: Adding Machine Patented (Read more HERE.) Bonus Flashback: January 13, 1990: Astronauts awakened to the song Attack of the Killer Tomatoes (Read mor.

Spark! Pro series – 13th January 2023
Happy Friday the 13th! This day has a reputation for being unlucky, but I hope that you’ll be able to turn that around and have a great day full of good luck and good fortune. Whether you’re superstitious or not, .
Источник
Operating System — VMware
-
- Forums
-
- Advancing Life & Work
- Alliances
- Around the Storage Block
- HPE Ezmeral: Uncut
- OEM Solutions
- Servers & Systems: The Right Compute
- Tech Insights
- The Cloud Experience Everywhere
- HPE Blog, Austria, Germany & Switzerland
- Blog HPE, France
- HPE Blog, Italy
- HPE Blog, Japan
- HPE Blog, Latin America
- HPE Blog, Poland
- HPE Blog, Hungary
- HPE Blog, UK, Ireland, Middle East & Africa
- Blogs
- Information
-
Forums
-
Blogs
- Advancing Life & Work
- Alliances
- Around the Storage Block
- HPE Ezmeral: Uncut
- OEM Solutions
- Servers & Systems: The Right Compute
- Tech Insights
- The Cloud Experience Everywhere
- HPE Blog, Austria, Germany & Switzerland
- Blog HPE, France
- HPE Blog, Italy
- HPE Blog, Japan
- HPE Blog, Latin America
- HPE Blog, UK, Ireland, Middle East & Africa
- HPE Blog, Poland
- HPE Blog, Hungary
-
Information
-
English
From time to time you might want to check the host hardware health manually in Monitor>Hardware Health (vSphere Client) or Monitor>Hardware Status (vSphere Web Client).
For many months this functionality has been broken for ESXi 6.5 on DellEMC servers.

When opening the Sensors page, vpxd.log shows the following message:
info vpxd[7FBE59924700] [Originator@6876 sub=vpxLro opID=dam-auto-generated: HardwareStatusViewMediator:dr-425:CimMonitorPropertyProvider:200359:14133-31991-ngc:70004153-e9] [VpxLRO] — BEGIN task-35318 — healthStatusSystem-34 — vim.host.HealthStatusSystem.FetchSystemEventLog
error vpxd[7FBE59924700] [Originator@6876 sub=MoHost opID=dam-auto-generated: HardwareStatusViewMediator:dr-425:CimMonitorPropertyProvider:200359:14133-31991-ngc:70004153-e9] No Content-Length header, WSMan IPMI SEL operation failed
info vpxd[7FBE59924700] [Originator@6876 sub=MoHost opID=dam-auto-generated: HardwareStatusViewMediator:dr-425:CimMonitorPropertyProvider:200359:14133-31991-ngc:70004153-e9] WSMan Msg size 59: part:401 Unauthorized
–> WWW-Authenticate: Basic realm=”OPENWSMAN”)l▒x7fwarning vpxd[7FBE59924700] [Originator@6876 sub=Default opID=dam-auto-generated: HardwareStatusViewMediator:dr-425:CimMonitorPropertyProvider:200359:14133-31991-ngc:70004153-e9] Closing Response processing in unexpected state: 3
info vpxd[7FBE59924700] [Originator@6876 sub=vpxLro opID=dam-auto-generated: HardwareStatusViewMediator:dr-425:CimMonitorPropertyProvider:200359:14133-31991-ngc:70004153-e9] [VpxLRO] — FINISH task-35318
info vpxd[7FBE59924700] [Originator@6876 sub=Default opID=dam-auto-generated: HardwareStatusViewMediator:dr-425:CimMonitorPropertyProvider:200359:14133-31991-ngc:70004153-e9] [VpxLRO] — ERROR task-35318 — healthStatusSystem-34 — vim.host.HealthStatusSystem.FetchSystemEventLog: vmodl.fault.SystemError:
–> Result:
–> (vmodl.fault.SystemError) {
–> faultCause = (vmodl.MethodFault) null,
–> faultMessage = <unset>,
–> reason = “Retrieve IPMI SEL request to host failed”
–> msg = “”
–> }
–> Args:
–>
Many people were pointing to vpxa.cfg (here and here) as a source of the error:
<log>
<level>verbose</level>
<maxFileNum>10</maxFileNum>
<maxFileSize>1048576</maxFileSize>
<memoryLevel>verbose</memoryLevel>
<outputToConsole>false</outputToConsole>
<outputToFiles>false</outputToFiles>
<outputToSyslog>true</outputToSyslog>
<syslog>
<facility>local4</facility>
<ident>Vpxa</ident>
<logHeaderFile>/var/run/vmware/vpxaLogHeader.txt</logHeaderFile>
</syslog>
</log>
It was not the end of the world, and I didn’t want to edit default log levels manually. So the issue was ignored for a while.
To my great surprise, it all went back to normal after updating hypervisor to the latest version using Dell EMC customised VMware ESXi 6.5 U1 A10 image.
Now, we can see multiple events in vpxd.log generated by VpxLRO:
info vpxd[7FBE58B08700] [Originator@6876 sub=vpxLro opID=combined(dam-auto-generated: ObjectTabbedViewMediator:dr-519,dam-auto-generated: ObjectPropertyFilter:dr-521):01-e6] [VpxLRO] — BEGIN lro-490638 — ResourceModel — cis.data.provider.ResourceModel.query
info vpxd[7FBE58B08700] [Originator@6876 sub=vpxLro opID=combined(dam-auto-generated: ObjectTabbedViewMediator:dr-519,dam-auto-generated: ObjectPropertyFilter:dr-521):01-e6] [VpxLRO] — FINISH lro-490638
info vpxd[7FBE58B08700] [Originator@6876 sub=vpxLro opID=combined(dam-auto-generated: ObjectPropertyFilter:dr-529,dam-auto-generated: ObjectPropertyFilter:dr-533):01-86] [VpxLRO] — BEGIN lro-490639 — ResourceModel — cis.data.provider.ResourceModel.query
info vpxd[7FBE58B08700] [Originator@6876 sub=vpxLro opID=combined(dam-auto-generated: ObjectPropertyFilter:dr-529,dam-auto-generated: ObjectPropertyFilter:dr-533):01-86] [VpxLRO] — FINISH lro-490639
info vpxd[7FBE5B45A700] [Originator@6876 sub=vpxLro opID=dam-auto-generated: ObjectPropertyFilter:dr-529:AssociationHostSystemAdapter:200359:14388-32550-ngc:70004210-ce] [VpxLRO] — BEGIN lro-490640 — HostProfileManager — vim.profile.ProfileManager.findAssociatedProfile
info vpxd[7FBE5B45A700] [Originator@6876 sub=vpxLro opID=dam-auto-generated: ObjectPropertyFilter:dr-529:AssociationHostSystemAdapter:200359:14388-32550-ngc:70004210-ce] [VpxLRO] — FINISH lro-490640
info vpxd[7FBE5A236700] [Originator@6876 sub=vpxLro opID=dam-auto-generated: RelatedItemsManager:dr-535:01-78] [VpxLRO] — BEGIN lro-490641 — ResourceModel — cis.data.provider.ResourceModel.query
info vpxd[7FBE5A236700] [Originator@6876 sub=vpxLro opID=dam-auto-generated: RelatedItemsManager:dr-535:01-78] [VpxLRO] — FINISH lro-490641
2018-04-12T14:02:41.702+08:00 info vpxd[7FBE5A236700] [Originator@6876 sub=vpxLro opID=dam-auto-generated: HardwareStatusViewMediator:dr-545:01-d9] [VpxLRO] — BEGIN lro-490642 — ResourceModel — cis.data.provider.ResourceModel.queryinfo vpxd[7FBE5A236700] [Originator@6876 sub=vpxLro opID=dam-auto-generated: HardwareStatusViewMediator:dr-545:01-d9] [VpxLRO] — FINISH lro-490642
info vpxd[7FBE5ACCB700] [Originator@6876 sub=vpxLro opID=urn:vmomi:HostSystem:host-28:9a78adfb-4c75-4b84-8d9a-65ab2cc71e51.properties:01-c1] [VpxLRO] — BEGIN lro-490643 — ResourceModel — cis.data.provider.ResourceModel.query
info vpxd[7FBE5ACCB700] [Originator@6876 sub=vpxLro opID=urn:vmomi:HostSystem:host-28:9a78adfb-4c75-4b84-8d9a-65ab2cc71e51.properties:01-c1] [VpxLRO] — FINISH lro-490643
info vpxd[7FBE5A53C700] [Originator@6876 sub=vpxLro opID=dam-auto-generated: HardwareStatusViewMediator:dr-545:CimMonitorPropertyProvider:200359:14395-32555-ngc:70004212-2b] [VpxLRO] — BEGIN task-35322 — healthStatusSystem-28 — vim.host.HealthStatusSystem.FetchSystemEventLog
info vpxd[7FBE5A53C700] [Originator@6876 sub=vpxLro opID=dam-auto-generated: HardwareStatusViewMediator:dr-545:CimMonitorPropertyProvider:200359:14395-32555-ngc:70004212-2b] [VpxLRO] — FINISH task-35322
As a result, the ‘Refresh hardware IPMI System Event Log’ task completes successfully.

Bugs are a part of life, because human made Computer, Computer never made a human. So We can expect a bugs around us. Today we will post about one of the issues that has been seen in one of my testing environment. After we upgrade our vSphere Environment to 6.5U1g we had seen some issues with enabling Proactive HA. Also Host Hardware Status become Unknown in vSphere 6.5U1g when Enabling Proactive HA with a “ESXi host has warning : A general system error occurred: Retrieve IPMI SEL request to host failed” . I have raised a production support case with VMware Support team, and we had done some log analysis together, as this is a technical post I am providing the logs for reference. Here is the vCenter Log analysis.

“from vc log
$zgrep “Retrieve IPMI SEL request to host failed” vpxd*|wc -l
56
vpxd log shows failure to login to Openwsmand
vpxd-779.log.gz
2018-05-15T11:46:35.606+07:00 info vpxd[7F1A2D49B700] [Originator@6876 sub=MoHost opID=dam-auto-generated: HardwareStatusViewMediator:dr-2009:CimMonitorPropertyProvider:200002:8475-5609-ngc:70000944-c9] WSMan Msg size 59: part:401 Unauthorized^M
–> WWW-Authenticate: Basic realm=”OPENWSMAN”!@x1ax7f
2018-05-15T11:46:35.608+07:00 warning vpxd[7F1A2D49B700] [Originator@6876 sub=Default opID=dam-auto-generated: HardwareStatusViewMediator:dr-2009:CimMonitorPropertyProvider:200002:8475-5609-ngc:70000944-c9] Closing Response processing in unexpected state: 3
2018-05-15T11:46:35.609+07:00 info vpxd[7F1A2D49B700] [Originator@6876 sub=vpxLro opID=dam-auto-generated: HardwareStatusViewMediator:dr-2009:CimMonitorPropertyProvider:200002:8475-5609-ngc:70000944-c9] [VpxLRO] — FINISH task-247756
2018-05-15T11:46:35.609+07:00 info vpxd[7F1A2D49B700] [Originator@6876 sub=Default opID=dam-auto-generated: HardwareStatusViewMediator:dr-2009:CimMonitorPropertyProvider:200002:8475-5609-ngc:70000944-c9] [VpxLRO] — ERROR task-247756 — healthStatusSystem-9239 — vim.host.HealthStatusSystem.FetchSystemEventLog: vmodl.fault.SystemError:
–> Result:
–> (vmodl.fault.SystemError) {
–> faultCause = (vmodl.MethodFault) null,
–> faultMessage = <unset>,
–> reason = “Retrieve IPMI SEL request to host failed”
–> msg = “”
–> }
–> Args:
–>
syslog entry
2018-05-17T03:50:52Z : dlopen /usr/lib/libticket.so.0 failed, error: /usr/lib/libticket.so.0: cannot open shared object file: No such file or directory, exiting. 0 Success
openwsman was trying to use a library(/usr/lib/libticket.so.0) which is not present in system.”

With the help of VMware Support team they had raised a request with there internal engineering team to check this issue, VMware engineering team has pointed out that this is a bug in this version of ESXI and suggestion is to upgrade the ESXI host to update 2. Please find release notes which states that “An ESXi host might not have access to the Web Services for Management (WSMan) protocol due to failed CIM ticket authentication”
https://docs.vmware.com/en/VMware-vSphere/6.5/rn/vsphere-esxi-65u2-release-notes.html
If you are not in a situation or don’t want to upgrade due to some dependencies or tight schedule you can raise a production support request with VMware GSS and they can ask for the bug fix related to this issue. Thanks and hope its been informative for you if you are running 6.5U1g in your environment.

Published by sajag007
Experienced Delivery Lead with a demonstrated history of working in the IT industry. Strong operations professional skilled in IT Infrastructure Specially within Private Cloud Servers & Network Architecture, Engagement Management and Program Management.
View all posts by sajag007


Иногда на хостах в vCenter возникает ошибка переполнения лога: Host IPMI system event log status. Через web-интерфейс избавиться от этой ошибки не удаётся. Очень раздражает и мешает отслеживать другие ошибки.
Быстрое лекарство через SSH на хосте:
localcli hardware ipmi sel clearПосле выполнения команды System Event Log очищается.
Инструкция от VMware
Подробности здесь: https://kb.vmware.com/s/article/1033725
Симптомы ошибки
Ошибка периодически повторятся на хостах ESX/ESXi.
Acknowledging на время убирает ошибку.
Что нужно сделать админу?
Нужно на гипервизоре очистить файл журнала системных событий IPMI, расположенный в /var/log/ipmi.
Причина ошибки
Файл журнала системных событий IPMI переполняется.
Как устранить ошибку?
Убедитесь, что на хосте ESXi правильные настройки NTP.
Очистите файл журнала, для этого:
- Войдите в vCenter.
- Выберите проблемный хост ESXi.
- Перейдите на вкладку Hardware Status.
- Нажмите System Event log.
- Нажмите Reset Event Log. Красная ошибка при этом должна пропасть.
- Нажмите Reset Sensors, чтобы сбросить датчики хоста.
Начиная с ESXi 5.1 U2 можно использовать командную строку localcli для очистки журналов SEL IPMI, для этого:
- Войдите на хост по SSH.
- Выполните команду:
localcli hardware ipmi sel clearЕсли журнал не очищается в ESX — перезапустите агенты управления и sfcbd-watchdog:
/etc/init.d/sfcbd-watchdog restartЕсли журнал не очищается в ESXi — перезапустите агенты управления.
Автор: spions on 3 апреля 2015

После новогоднего обновления кластера VMWare, собранного на лезвиях proliant bl460c g7, с ESXi 5.1 до версии 5.5, в консоли vCenter образовалась совсем не новогодняя елка из ошибок. Заход в iLo лезвий подтвердил, что с оборудованием все в порядке.
Проблемы были явно не связаны между собой: разное количество сенсоров на лезвиях, ошибки в конвертации градус Фаренгейта в градусы Цельсия, ошибки на явно рабочих дисках, — все это подтолкнуло посмотреть в сторону IPMI.
IPMI (от англ. Intelligent Platform Management Interface) — интеллектуальный интерфейс управления платформой, предназначенный для автономного мониторинга и управления функциями, встроенными непосредственно в аппаратное и микропрограммное обеспечения серверных платформ.
Решение проблемы оказалось подробно описанное в Knowledge Base VMWare.
The Host IPMI System Event Log Status alarm is triggered repeatedly in VMware vCenter Server 4.x and 5.x (1033725)
Если коротко, то в vcenter в «Hardware Status» были очищены «System Event log«, похожая операция была сделана в iLo лезвий.
После выполнения двух команд:
~ # localcli hardware ipmi sel clear
~ # /etc/init.d/sfcbd-watchdog restart
была выполнена команда «Reset Sensors» все там же в vcenter в «Hardware Status».
Как результат количество датчиков стало одинаковым и все ошибки исчезли, что соответствует реальному положению дел.
Вы можете оставить комментарий ниже.
-
#2
To determine why the log has filled up, investigate the hardware.
To resolve this issue, stop the alarm from triggering repeatedly and clear the IPMI System Event.log file and reset the sensors.
To clear the IPMI System Event.log file and reset the sensors:
1 Open vCenter Server using vSphere Client.
2 In the vCenter Server Inventory, select the ESXi/ESX host.
3 Click the Hardware Status tab.
4 Click System Event log under View.
5 Click Reset Event Log. The red alert is removed from the System Event log.
6 Click Reset Sensors to reset the host sensors.
Introduced in ESXi 5.1 Update 2 (Build Number: 1483097) and ESXi 5.5 Patch 1 (Build Number: 1474528), there is a new localcli command line to clear the IPMI SEL logs:
Код:
localcli hardware ipmi sel clearTo run localcli command on the ESXi 5.1 or 5.5 host:
Connect to the ESXi host through SSH. For more information, see Using Tech Support Mode in ESXi 4.1 and ESXi 5.x (1017910).
Run this command:
Код:
localcli hardware ipmi sel clear