|
|
Needs Expansion |

Contents
- Introduction
- Target Audience
-
System Logs
- Authorization Log
- Daemon Log
- Debug Log
- Kernel Log
- Kernel Ring Buffer
- System Log
-
Application Logs
- Apache HTTP Server Logs
- CUPS Print System Logs
- Rootkit Hunter Log
- Samba SMB Server Logs
- X11 Server Log
-
Non-Human-Readable Logs
- Login Failures Log
- Last Logins Log
- Login Records Log
-
System Logging Daemon (syslogd)
- Configuration of syslogd
- Echoing Messages to syslogd With Logger
- Log Rotation
-
Essential Commands
- Getting Started
- Editing Files
- Viewing Files
- Viewing the Beginning of Files
- Viewing the End of Files
- Watching a Changing File
- Searching Files
-
Resources
- Local System Resources
- WWW Resources
Introduction
One of the things which makes GNU/Linux a great operating system is that virtually anything and everything happening on and to the system may be logged in some manner. This information is invaluable for using the system in an informed manner, and should be one of the first resources you use to trouble-shoot system and application issues. The logs can tell you almost anything you need to know, as long as you have an idea where to look first.
Your Ubuntu system provides vital information using various system log files. These log files are typically plain ASCII text in a standard log file format, and most of them sit in the traditional system log subdirectory /var/log. Many are generated by the system log daemon, syslogd on behalf of the system and certain applications, while some applications generate their own logs by writing directly to files in /var/log.
This guide talks about how to read and use several of these system log files, how to use and configure the system logging daemon, syslogd, and how log rotation works. See the Resources section for additional information.
Target Audience
This guide will be simple enough to use if you have any experience using the console and editing text files using a text editor. See the end of this document for some essential commands that may help you find your way around these files if you’re relatively new to the command line.
System Logs
System logs deal primarily with the functioning of the Ubuntu system, not necessarily with additional applications added by users. Examples include authorization mechanisms, system daemons, system messages, and the all-encompassing system log itself, syslog.
The Authorization Log tracks usage of authorization systems, the mechanisms for authorizing users which prompt for user passwords, such as the Pluggable Authentication Module (PAM) system, the sudo command, remote logins to sshd and so on. The Authorization Log file may be accessed at /var/log/auth.log. This log is useful for learning about user logins and usage of the sudo command.
Use grep to cut down on the volume. For example, to see only information in the Authorization Log pertaining to sshd logins, use this:
grep sshd /var/log/auth.log | less
Daemon Log
A daemon is a program that runs in the background, generally without human intervention, performing some operation important to the proper running of your system. The daemon log at /var/log/daemon.log and contains information about running system and application daemons such as the Gnome Display Manager daemon gdm, the Bluetooth HCI daemon hcid, or the MySQL database daemon mysqld. This can help you trouble-shoot problems with a particular daemon.
Again, use grep to find specific information, plugging in the name of the daemon you’re interested in.
Debug Log
The debug log at /var/log/debug and provides detailed debug messages from the Ubuntu system and applications which log to syslogd at the DEBUG level.
Kernel Log
The kernel log at /var/log/kern.log provides a detailed log of messages from the Ubuntu Linux kernel. These messages may prove useful for trouble-shooting a new or custom-built kernel, for example.
Kernel Ring Buffer
The kernel ring buffer is not really a log file per se, but rather an area in the running kernel you can query for kernel bootup messages via the dmesg utility. To see the messages, use this:
dmesg | less
Or to search for lines that mention the Plug & Play system, for example, use grep like this:
dmesg | grep pnp | less
By default, the system initialization script /etc/init.d/bootmisc.sh sends all bootup messages to the file /var/log/dmesg as well. You can view and search this file the usual way.
System Log
The system log typically contains the greatest deal of information by default about your Ubuntu system. It is located at /var/log/syslog, and may contain information other logs do not. Consult the System Log when you can’t locate the desired log information in another log. It also contains everything that used to be in /var/log/messages.
Application Logs
Many applications also create logs in /var/log. If you list the contents of your /var/log subdirectory, you will see familiar names, such as /var/log/apache2 representing the logs for the Apache 2 web server, or /var/log/samba, which contains the logs for the Samba server. This section of the guide introduces some specific examples of application logs, and information contained within them.
Apache HTTP Server Logs
The default installation for Apache2 on Ubuntu creates a log subdirectory: /var/log/apache2. Within this subdirectory are two log files with two distinct purposes:
-
/var/log/apache2/access.log — records of every page served and every file loaded by the web server.
-
/var/log/apache2/error.log — records of all error conditions reported by the HTTP server
By default, every time Apache accesses a file or page, the access logs record the IP address, time and date, browser identification string, HTTP result code and the text of the actual query, which will generally be a GET for a page view. Look at the Apache documentation for a complete rundown; quite a lot can be gleaned from this file, and indeed many statistical packages exist that perform analyses of these logs.
Also, every time any error occurs, Apache adds a line to the error log. If you run PHP with error and warning messages disabled, this can be your only way to identify bugs.
CUPS Print System Logs
The Common Unix Printing System (CUPS) uses the default log file /var/log/cups/error_log to store informational and error messages. If you need to solve a printing issue in Ubuntu, this log may be a good place to start.
Rootkit Hunter Log
The Rootkit Hunter utility (rkhunter) checks your Ubuntu system for backdoors, sniffers and rootkits, which are all signs of compromise of your system. The log rkhunter uses is located at /var/log/rkhunter.log.
Samba SMB Server Logs
The Server Message Block Protocol (SMB) server, Samba is popularly used for sharing files between your Ubuntu computer and other computers which support the SMB protocol. Samba keeps three distinct types of logs in the subdirectory /var/log/samba:
-
log.nmbd — messages related to Samba’s NETBIOS over IP functionality (the network stuff)
-
log.smbd — messages related to Samba’s SMB/CIFS functionality (the file and print sharing stuff)
-
log.[IP_ADDRESS] — messages related to requests for services from the IP address contained in the log file name, for example, log.192.168.1.1.
X11 Server Log
The default X11 Windowing Server in use with Ubuntu is the Xorg X11 server, and assuming your computer has only one display defined, it stores log messages in the file /var/log/Xorg.0.log. This log is helpful for diagnosing issues with your X11 environment.
Non-Human-Readable Logs
Some log files found in the /var/log subdirectory are designed to be readable by applications, not necessarily by humans. Some examples of such log files which appear in /var/log follow.
Login Failures Log
The login failures log located at /var/log/faillog is actually designed to be parsed and displayed by the faillog command. For example, to print recent login failures, use this:
faillog
Last Logins Log
The last logins log at /var/log/lastlog should not typically be parsed and examined by humans, but rather should be used in conjunction with the lastlog command. For example to see a listing of logins with the lastlog command, displayed one page per screen with the less command, use the following command:
lastlog | less
Login Records Log
The file /var/log/wtmp contains login records, but unlike /var/log/lastlog above, /var/log/wtmp is not used to show a list of recent logins, but is instead used by other utilities such as the who command to present a listed of currently logged in users. This command will show the users currently logged in to your machine:
who
System Logging Daemon (syslogd)
The system logging daemon syslogd, also known as sysklogd, awaits logging messages from numerous sources and routes the messages to the appropriate file or network destination. Messages logged to syslogd usually contain common elements like system hostnames and time-stamps in addition to the specific log information.
Configuration of syslogd
The syslogd daemon’s configuration file is /etc/syslog.conf. Each entry in this file consists of two fields, the selector and the action. The selector field specifies a facility to be logged, such as for example the auth facility which deals with authorization, and a priority level to log such information at, such as info, or warning. The action field consists of a target for the log information, such as a standard log file (i.e. /var/log/syslog), or the hostname of a remote computer to send the log information to.
Echoing Messages to syslogd With Logger
A neat utility exists in the logger tool, which allows one to place messages into the System Log (i.e. /var/log/syslog) arbitrarily. For example, assume your user name is buddha, and you would like to enter a message into the syslog about a particularly delicious pizza you’re eating, you could use a command such as the following at a terminal prompt:
logger This Pizza from Vinnys Gourmet Rocks
and you would end up with a line in the /var/log/syslog file like this:
Jan 12 23:34:45 localhost buddha: This Pizza from Vinnys Gourmet Rocks
You can even specify a tag the messages come from, and redirect the output standard error too.
#
# sample logger error jive
#
logmsg="/usr/bin/logger -s -t MyScript "

# announce what this script is, even to the log
$logmsg "Directory Checker FooScript Jive 1.0"

# test for the existence of Fred's home dir on this machine
if [ -d /home/fred ]; then
   $logmsg "I. Fred's Home Directory Found"
else
   $logmsg "E. Fred's Home Directory was NOT Found. Boo Hoo."
   exit 1
fi
Executing this script as chkdir.sh on the machine butters where Fred does not have a home directory, /home/fred, gives the following results:
bumpy@butters:~$./chkdir.sh
MyScript: Directory Checker FooScript Jive 1.0
MyScript: E. Fred's Home Directory was NOT Found. Boo Hoo.
bumpy@butters:~$tail -n 2 /var/log/syslog
Jan 12 23:23:11 localhost MyScript: Directory Checker FooScript Jive 1.0
Jan 12 23:23:11 localhost MyScript: E. Fred's Home Directory was NOT Found. Boo Hoo.
So, as you can see, we received the messages both via standard error, at the terminal prompt, and they also appear in our syslog.
Log Rotation
When viewing directory listings in /var/log or any of its subdirectories, you may encounter log files with names such as daemon.log.0, daemon.log.1.gz, and so on. What are these log files? They are ‘rotated’ log files. That is, they have automatically been renamed after a predefined time-frame, and a new original log started. After even more time the log files are compressed with the gzip utility as in the case of the example daemon.log.1.gz. The purpose of log rotation is to archive and compress old logs so that they consume less disk space, but are still available for inspection as needed. What handles this functionality? Why, the logrotate command of course! Typically, logrotate is called from the system-wide cron script /etc/cron.daily/logrotate, and further defined by the configuration file /etc/logrotate.conf. Individual configuration files can be added into /etc/logrotate.d (where the apache2 and mysql configurations are stored for example).
This guide will not cover the myriad of ways logrotate may be configured to handle the automatic rotation of any log file on your Ubuntu system. For more detail, check the Resources section of this guide.
 NOTE: You may also rotate system log files via the cron.daily script /etc/cron.daily/sysklogd instead of using logrotate. Actually, the utility savelog may produce unexpected results on log rotation which configuring logrotate seems to have no effect on. In those cases, you should check the cron.daily sysklogd script in /etc/cron.daily/sysklogd and read the savelog manual page to see if savelog is not in fact doing the rotation in a way that is not what you are specifying with logrotate.
Essential Commands
If you’re new to the console and the Linux command line, these commands will get you up and running to the point where you can work with log files at a basic level.
Getting Started
To change to the log directory, where most of these files sit, use the cd command. This saves having to type out a full path name for every subsequent command:
cd /var/log
Editing Files
You can view and edit files in GEdit or Kate, the simple text editors that come with Ubuntu and Kubuntu respectively, but these can be overkill when all you want to do is look at a file or make simple changes. The easiest editor to use from the console is nano, which is less powerful but also less complicated than vim or emacs. The command to edit a particular logfile /var/log/example.log using nano is:
nano example.log
Press Ctrl+X to exit. It will ask if you want to save your changes when you exit, but unless you run it with the sudo command the files won’t be writable. In general, you won’t want to save your changes to log files, of course.
Viewing Files
To simply look at a file, an editor is overkill. Use the less command, which pages through a file one screen at a time:
less example.log
You don’t need sudo to look at a file. Press h for help, or q to quit. The cursor keys and page up/down keys will work as expected, and the slash key («/») will do a case-sensitive search; the n key repeats the last search.
Viewing the Beginning of Files
To see the first ten lines of a file, use the head command:
head example.log
To see some other number of lines from the beginning of the file, add the -n switch, thus:
head -n 20 example.log
Viewing the End of Files
To see the final ten lines of a file, the analogous command is tail:
tail example.log
Again, the -n switch gives you control over how many lines it displays:
tail -n 20 example.log
Watching a Changing File
Also, the -f («follow») switch puts tail into a loop, constantly waiting for new additions to the file it’s displaying. This is useful for monitoring files that are being updated in real time:
tail -f example.log
Press Ctrl+C to quit the loop.
Searching Files
Because log files can be large and unwieldy, it helps to be able to focus. The grep command helps you strip out only the content you care about. To find all the lines in a file containing the word «system», for example, use this:
grep "system" example.log
To find all the lines containing «system» at the beginning of the line, use this:
grep "^system" example.log
Note the caret symbol, a regular expression that matches only the start of a line. This is less useful for standard log files, which always start with a date and time, but it can be handy otherwise. Not all files have a standard format.
Any time the result of a grep is still too long, you can pipe it through less:
grep "system" example.log | less
Resources
Additional information on system and application logs and syslogd is available via the following resources:
Local System Resources
|
man dmesg |
System manual page for the dmesg kernel ring buffer utility |
|
man faillog |
System manual page for the faillog command (and also the faillog configuration file via man 5 faillog) |
|
man grep |
System manual page for the grep pattern searching utility |
|
man head |
System manual page for the head utility |
|
man klogd |
System manual page for the kernel log daemon (klogd) |
|
man last |
System manual for the last command which shows last logged in users |
|
man less |
System manual page for the less paging utility |
|
man logger |
System manual page for the logger command-line interface to syslog utility |
|
man logrotate |
System manual page for the the logrotate utility |
|
man savelog |
System manual page for the savelog log file saving utility |
|
man syslogd |
System manual page for the system log daemon (syslogd) |
|
man syslog.conf |
System manual page for the syslogd configuration file |
|
man tail |
System manual page for the tail utility |
WWW Resources
Checking Your System Logs with awk
Syslog — Watching Your Logs
http://www.ibm.com/developerworks/linux/library/l-roadmap5/-Linux Logging
Sawing Linux Logs With Simple Tools
CategorySystem
At the time of writing, the Apache HTTP server is
used by 30.8% of all web
servers in operation. If you’re responsible for managing any system that
utilizes Apache, then you will surely interact with its logging infrastructure
on a regular basis. This tutorial will introduce you to logging in Apache and
how it can help you diagnose, troubleshoot, and quickly resolve any problem you
may encounter on your server.
You will learn where logs are stored, how to access them, and how to customize
the log output and location to fit your needs. You will also learn how to
centralize Apache logs in a log management system for easier tracing, searching,
and filtering of logs across your entire stack.
🔭 Want to centralize and monitor your Apache logs?
Head over to Logtail and start ingesting your logs in 5 minutes.
Prerequisites
To follow through with this tutorial, you should set up a Linux server that
includes a non-root user with sudo privileges. Additionally, you also need the
Apache HTTP server installed and enabled on the server, which can be done by
executing the relevant commands below.
On Debian-based distributions like Ubuntu:
sudo systemctl enable apache2
sudo systemctl start apache2
On RHEL, Fedora or CentOS:
sudo systemctl enable httpd
sudo systemctl start httpd
Please note that the rest of the commands, directory configurations, and
conventions used in this tutorial pertain to Debian-based distributions like
Ubuntu. Still, the concepts remain the same for other distributions.
Step 1 — Getting started with Apache logging
Apache logs are files that record everything the Apache web server is doing for
later analysis by the server administrator. The records of all Apache events are
placed in two different text files:
- Access Log: this file stores information about incoming requests. You’ll
find details about each request such as the requested resource, response
codes, time taken to generate the response, IP address of the client, and
more. - Error Log: this file contains diagnostic information about any errors were
encountered while processing requests.
Step 2 — Locating the Apache log files
The log files’ location depends on the operating system the Apache web server is
running. On Debian-based operating systems like Ubuntu, the access log file is
located in /var/log/apache2/access.log. On CentOS, RHEL, or Fedora, the access
log file is stored in /var/log/httpd/access_log.
A typical access log entry might look like this:
Output
::1 - - [13/Nov/2020:11:32:22 +0100] "GET / HTTP/1.1" 200 327 "-" "Mozilla/5.0 (Windows NT 10.0; Win64; x64) AppleWebKit/537.36 (KHTML, like Gecko) Chrome/86.0.4240.198 Safari/537.36"
Similarly, the error log file is located in /var/log/apache2/error.log on
Debian-based systems and /var/log/httpd/error_log on CentOS, RHEL, or Fedora.
A typical error log entry might look like this:
Output
[Thu May 06 12:03:28.470305 2021] [php7:error] [pid 731] [client ::1:51092] script '/var/www/html/missing.php' not found or unable to stat
In the next section, we’ll discuss how to view these log files from the command
line.
Step 3 — Viewing Apache Log files
One of the most common ways to view an Apache log file is through the tail
command which prints the last 10 lines from a file. When the -f option is
supplied, the command will watch the file and output its contents in real-time.
sudo tail -f /var/log/apache2/access.log
You should observe the following output on the screen:
Output
. . .

198.54.132.137 - - [04/Feb/2022:11:34:04 +0000] "GET / HTTP/1.1" 200 3477 "-" "Mozilla/5.0 (Windows NT 10.0; Win64; x64) AppleWebKit/537.36 (KHTML, like Gecko) Chrome/97.0.4692.99 Safari/537.36"
198.54.132.137 - - [04/Feb/2022:11:34:04 +0000] "GET / HTTP/1.1" 200 3477 "-" "Mozilla/5.0 (Windows NT 10.0; Win64; x64) AppleWebKit/537.36 (KHTML, like Gecko) Chrome/97.0.4692.99 Safari/537.36"
198.54.132.137 - - [04/Feb/2022:11:34:04 +0000] "GET / HTTP/1.1" 200 3477 "-" "Mozilla/5.0 (Windows NT 10.0; Win64; x64) AppleWebKit/537.36 (KHTML, like Gecko) Chrome/97.0.4692.99 Safari/537.36"
198.54.132.137 - - [04/Feb/2022:11:34:05 +0000] "GET / HTTP/1.1" 200 3476 "-" "Mozilla/5.0 (Windows NT 10.0; Win64; x64) AppleWebKit/537.36 (KHTML, like Gecko) Chrome/97.0.4692.99 Safari/537.36"
198.54.132.137 - - [04/Feb/2022:11:34:06 +0000] "GET / HTTP/1.1" 200 3476 "-" "Mozilla/5.0 (Windows NT 10.0; Win64; x64) AppleWebKit/537.36 (KHTML, like Gecko) Chrome/97.0.4692.99 Safari/537.36"
198.54.132.137 - - [04/Feb/2022:11:34:06 +0000] "GET / HTTP/1.1" 200 3476 "-" "Mozilla/5.0 (Windows NT 10.0; Win64; x64) AppleWebKit/537.36 (KHTML, like Gecko) Chrome/97.0.4692.99 Safari/537.36"
198.54.132.137 - - [04/Feb/2022:11:34:07 +0000] "GET / HTTP/1.1" 200 3476 "-" "Mozilla/5.0 (Windows NT 10.0; Win64; x64) AppleWebKit/537.36 (KHTML, like Gecko) Chrome/97.0.4692.99 Safari/537.36"
198.54.132.137 - - [04/Feb/2022:11:34:07 +0000] "GET / HTTP/1.1" 200 3476 "-" "Mozilla/5.0 (Windows NT 10.0; Win64; x64) AppleWebKit/537.36 (KHTML, like Gecko) Chrome/97.0.4692.99 Safari/537.36"
To view the entire contents of the file, you can use the cat command or open
the file in a text editor like nano or vim:
cat /var/log/apache2/access.log
You may also want to filter the log entries in the log file by a specific term.
In such cases, you should use the grep command. The first argument to grep
is the term you want to search for, while the second is the log file that will
be searched. In example below, we are filtering all the lines that contain the
word GET:
sudo grep GET /var/log/apache2/access.log
This should present the following output:
Output
. . .

198.54.132.137 - - [04/Feb/2022:11:34:04 +0000] "GET / HTTP/1.1" 200 3477 "-" "Mozilla/5.0 (Windows NT 10.0; Win64; x64) AppleWebKit/537.36 (KHTML, like Gecko) Chrome/97.0.4692.99 Safari/537.36"
198.54.132.137 - - [04/Feb/2022:11:34:04 +0000] "GET / HTTP/1.1" 200 3477 "-" "Mozilla/5.0 (Windows NT 10.0; Win64; x64) AppleWebKit/537.36 (KHTML, like Gecko) Chrome/97.0.4692.99 Safari/537.36"
198.54.132.137 - - [04/Feb/2022:11:34:05 +0000] "GET / HTTP/1.1" 200 3476 "-" "Mozilla/5.0 (Windows NT 10.0; Win64; x64) AppleWebKit/537.36 (KHTML, like Gecko) Chrome/97.0.4692.99 Safari/537.36"
198.54.132.137 - - [04/Feb/2022:11:34:06 +0000] "GET / HTTP/1.1" 200 3476 "-" "Mozilla/5.0 (Windows NT 10.0; Win64; x64) AppleWebKit/537.36 (KHTML, like Gecko) Chrome/97.0.4692.99 Safari/537.36"
198.54.132.137 - - [04/Feb/2022:11:34:06 +0000] "GET / HTTP/1.1" 200 3476 "-" "Mozilla/5.0 (Windows NT 10.0; Win64; x64) AppleWebKit/537.36 (KHTML, like Gecko) Chrome/97.0.4692.99 Safari/537.36"
198.54.132.137 - - [04/Feb/2022:11:34:07 +0000] "GET / HTTP/1.1" 200 3476 "-" "Mozilla/5.0 (Windows NT 10.0; Win64; x64) AppleWebKit/537.36 (KHTML, like Gecko) Chrome/97.0.4692.99 Safari/537.36"
198.54.132.137 - - [04/Feb/2022:11:34:07 +0000] "GET / HTTP/1.1" 200 3476 "-" "Mozilla/5.0 (Windows NT 10.0; Win64; x64) AppleWebKit/537.36 (KHTML, like Gecko) Chrome/97.0.4692.99 Safari/537.36"
Step 4 — Examining Apache access log formats
The access log records all requests that are processed by the server. You can
see what resources are being requested, the status of each request, and how long
it took to process their response. In this section, we’ll dive deeper into how
to customize the information that is displayed in this file.
Before you can derive value from reading a log file, you need to understand the
format that is being used for each of its entries. The CustomLog directive is
what controls the location and format of the Apache access log file. This
directive can be placed in the server configuration file
(/etc/apache2/apache2.conf) or in your virtual host entry. Note that defining
the same CustomLog directive in both files may cause problems.
Let’s look at the common formats used in Apache access logs and what they mean.
Common Log Format
The Common Log Format
is the standardized access log format format used by many web servers because it
is easy to read and understand. It is defined in the /etc/apache2/apache2.conf
configuration file through the LogFormat directive.
When you run the command below:
sudo grep common /etc/apache2/apache2.conf
You will observe the following output:
Output
LogFormat "%h %l %u %t "%r" %>s %O" common
The line above defines the nickname common and associates it with a particular
log format string. A log entry produced by this format will look like this:
Output
127.0.0.1 alice Alice [06/May/2021:11:26:42 +0200] "GET / HTTP/1.1" 200 3477
Here’s an explanation of the information contained in the log message above:
%h->127.0.0.1: the hostname or IP address of the client that made the
request.%l->alice: remote log name (name used to log in a user). A placeholder
value (-) will be used if it is not set.%u->Alice: remote username (username of logged-in user). A placeholder
value (-) will be used if it is not set.%t->[06/May/2021:11:26:42 +0200]: the day and time of the request."%r"->"GET / HTTP/1.1"— the request method, route, and protocol.%>s->200— the response code.%O->3477— the size of the response in bytes.
Combined Log Format
The Combined Log Format
is very similar to the Common log format but contains few extra pieces of
information.
It’s also defined in the /etc/apache2/apache2.conf configuration file:
sudo grep -w combined /etc/apache2/apache2.conf
You will observe the following output:
Output
LogFormat "%h %l %u %t "%r" %>s %O "%{Referer}i" "%{User-Agent}i"" combined
Notice that it is exactly the same as the Common Log Format, with the addition
of two extra fields. Entries produced in this format will look like this:
Output
127.0.0.1 alice Alice [06/May/2021:11:18:36 +0200] "GET / HTTP/1.1" 200 3477 "-" "Mozilla/5.0 (Windows NT 10.0; Win64; x64) AppleWebKit/537.36 (KHTML, like Gecko) Chrome/90.0.4430.93 Safari/537.36"
Here’s an explanation of the two additional fields that are not present in the
Common log format:
"%{Referer}i"->"-": the URL of the referrer (if available, otherwise
-is used)."%{User-Agent}i"->
"Mozilla/5.0 (Windows NT 10.0; Win64; x64) AppleWebKit/537.36 (KHTML, like Gecko) Chrome/90.0.4430.93 Safari/537.36":
detailed information about the user agent of the client that made the request.
Step 5 — Creating a custom log format
You can define a custom log format in the /etc/apache2/apache2.conf file by
using the LogFormat directive followed by the actual format of the output and
a nickname that will be used as an identifier for the format. After defining the
custom format, you’ll pass its nickname to the CustomLog directive and restart
the apache2 service.
In this example, we will create a log format named custom that looks like
this:
Output
LogFormat "%t %H %m %U %q %I %>s %O %{ms}T" custom
Open your /etc/apache2/apache2.conf file and place the line above below the
other LogFormat lines. It will produce access log entries with the following
details:
%t: date and time of the request.%H: the request protocol.%m: the request method.%U: the URL path requested.%q: query parameters (if any).%I: total bytes received including the request headers.%>s: final HTTP status code.%O: number of bytes sent in the response.%{ms}T: time taken to generate the response in milliseconds.
You can find all other formatting options and their description on
this page.
To enable the custom format for subsequent access log entries, you must change
the value of the CustomLog directive in your virtual hosts file and restart
the apache2 service with Systemctl.
Open up the default virtual hosts file using the command below:
sudo nano /etc/apache2/sites-available/000-default.conf
Find the following line:
Output
CustomLog ${APACHE_LOG_DIR}/access.log combined
And change it to:
Output
CustomLog ${APACHE_LOG_DIR}/access.log combined
Save the file by pressing Ctrl-O then Ctrl-X, then restart the apache2
service using the command below:
sudo systemctl restart apache2
Afterward, make the following request to your server using curl:
curl --head 'http://<your_server_ip>?name=john&age=30'
You should observe the following response:
Output
HTTP/1.1 200 OK
Date: Mon, 07 Feb 2022 14:21:45 GMT
Server: Apache/2.4.41 (Ubuntu)
Last-Modified: Mon, 07 Feb 2022 12:57:29 GMT
ETag: "2aa6-5d76d24a738bc"
Accept-Ranges: bytes
Content-Length: 10918
Vary: Accept-Encoding
Content-Type: text/html
Go ahead and view the last 10 messages in the access log file:
sudo tail /var/log/apache2/access.log
The log entry that describes the request will look like this:
Output
[07/Feb/2022:14:21:45 +0000] HTTP/1.1 HEAD /index.html ?name=john&age=30 96 200 255 0
It’s also possible to create multiple access log files by specifying the
CustomLog directive more than once. In the example below, the first line logs
into a custom.log file using the custom log format, while the second uses
the common format to write entries into access.log. Similarly, the
combined.log file contains messages formatted according to the combined log
format.
Output
CustomLog ${APACHE_LOG_DIR}/custom.log custom
CustomLog ${APACHE_LOG_DIR}/access.log common
CustomLog ${APACHE_LOG_DIR}/combined.log combined
Step 6 — Formatting your logs as JSON
Although many log management systems support the default Apache logging formats,
it might be best to log in a structured format like JSON since that’s the go-to
format for structured logging in the industry and it is universally supported.
Here’s a conversion of our custom log format into JSON:
Output
LogFormat "{ "timestamp":"%t", "protocol":"%H", "method":"%m", "request":"%U", "query":"%q", "request_size_in_bytes":"%I", "status_code":"%>s", "response_size_in_bytes":"%O", "time_taken_ms":"%{ms}T" }" json
This produces log entries with the following formatting:
Output
{
  "timestamp": "[07/Feb/2022:15:09:02 +0000]",
  "protocol": "HTTP/1.1",
  "method": "HEAD",
  "request": "/index.html",
  "query": "?name=john&age=30",
  "request_size_in_bytes": "96",
  "status_code": "200",
  "response_size_in_bytes": "255",
  "time_taken_ms": "0"
}
Step 7 — Configuring Apache error logs
The server error log contains information about any errors that the web server
encountered while processing incoming requests as well as other diagnostic
information. You can choose where the error messages will be transported to
using the ErrorLog directive in your virtual host configuration file. This
transport is usually a log file on the filesystem.
Here is an example from default virtual host configuration file
/etc/apache2/sites-available/000-default.conf:
Output
ErrorLog ${APACHE_LOG_DIR}/error.log
On Debian-based distributions, the default error log is in the
/var/log/apache2/error.log file, while in Fedora/CentOS/RHEL, it placed in the
/var/log/httpd/error_log file. If the path argument to ErrorLog is not
absolute, then it is assumed to be relative to the
ServerRoot.
A common practice is to monitor the error log continuously for any problems
during development or testing. This is easily achieved through the tail
command:
sudo tail -f /var/log/apache2/error.log
You will observe the following output:
Output
[Mon Feb 07 13:03:43.445444 2022] [core:notice] [pid 10469:tid 140561300880448] AH00094: Command line: '/usr/sbin/apache2'
[Mon Feb 07 13:07:31.528850 2022] [mpm_event:notice] [pid 10469:tid 140561300880448] AH00491: caught SIGTERM, shutting down
[Mon Feb 07 13:07:31.626878 2022] [mpm_event:notice] [pid 10864:tid 140224997284928] AH00489: Apache/2.4.41 (Ubuntu) configured -- resuming normal operations
[Mon Feb 07 13:07:31.626980 2022] [core:notice] [pid 10864:tid 140224997284928] AH00094: Command line: '/usr/sbin/apache2'
[Mon Feb 07 13:13:25.966501 2022] [mpm_event:notice] [pid 10864:tid 140224997284928] AH00491: caught SIGTERM, shutting down
[Mon Feb 07 13:13:26.049222 2022] [mpm_event:notice] [pid 11268:tid 139760377875520] AH00489: Apache/2.4.41 (Ubuntu) configured -- resuming normal operations
[Mon Feb 07 13:13:26.049318 2022] [core:notice] [pid 11268:tid 139760377875520] AH00094: Command line: '/usr/sbin/apache2'
[Mon Feb 07 15:08:50.856388 2022] [mpm_event:notice] [pid 11268:tid 139760377875520] AH00491: caught SIGTERM, shutting down
[Mon Feb 07 15:08:50.940561 2022] [mpm_event:notice] [pid 12096:tid 140473452194880] AH00489: Apache/2.4.41 (Ubuntu) configured -- resuming normal operations
[Mon Feb 07 15:08:50.940669 2022] [core:notice] [pid 12096:tid 140473452194880] AH00094: Command line: '/usr/sbin/apache2'
Aside from logging directly to a file, you can also forward your logs to a
Syslog. You can do this by
specifying syslog
instead of a file path as the argument to ErrorLog:
Step 8 — Customizing the error log format
Like the Apache access logs, the format of the error messages can be controlled
through the ErrorLogFormat directive, which should be placed in the main
config file or virtual host entry. It looks like this:
Output
ErrorLogFormat "[%{u}t] [%l] [pid %P:tid %T] [client %a] %M"
The above configuration produces a log entry in the following format:
Output
[Mon Feb 07 15:52:57.234792 2022] [error] [pid 24372:tid 24507] [client 20.113.27.135:34579] AH01276: Cannot serve directory /var/www/html/: No matching DirectoryIndex (index.html) found, and server-generated directory index forbidden by Options directive
Here’s an explanation of the formatting options used above:
%{u}t: the current time, including microseconds. %l: the log level of the
message. %P: the process identifier. %T: the thread identifier. %a: the
client IP address. %M: the actual log message.
Note that when the data for a formatting option is not available in a particular
event, it will be omitted from the log entirely as the Apache error log doesn’t
use placeholder values for missing parameters.
You can find a complete description of all the available error formatting
options in the
Apache docs.
Step 9 — Customizing the error log level
In the virtual host configuration file, you can also control the level of
messages that will be entered into the error log through the
LogLevel directive.
When you specify a particular value, messages from all other levels of higher
severity will be logged as well. For example, when LogLevel error is
specified, messages with a severity of crit, alert, and emerg will also be
logged.
These are the levels available in increasing order of severity:
trace1—trace8: trace messages (lowest severity).debug: messages used for debugging.info: informational messages.notice: normal but significant conditions.warn: warnings.error: error conditions that doesn’t necessarily require immediate action.crit: critical conditions that requires prompt action.alert: errors that require immediate action.emerg: system is unusable.
If the LogLevel directive is not set, the server will set the log level to
warn by default.
Step 10 — Centralizing your Apache logs
Storing your Apache logs on the filesystem may suffice for development
environments or single-server deployments, but when multiple servers are
involved, it may be more convenient to centralize all your logs in a single
location so that you can automatically parse, filter, and search log data from
all sources in real-time.
In this section, we’ll demonstrate how you can centralize your Apache logs in a
log management service through Vector,
a high-performance tool for building observability pipelines. The following
instructions assume that you’ve signed up for a free
Logtail account and retrieved your source
token.
Go ahead and follow the relevant
installation instructions for Vector
for your operating system. On Ubuntu, you may run the following commands to
install the Vector CLI:
curl -1sLf 'https://repositories.timber.io/public/vector/cfg/setup/bash.deb.sh' | sudo -E bash
After Vector is installed, confirm that it is up and running through
systemctl:
You should observe that it is active and running:
Output
● vector.service - Vector
     Loaded: loaded (/lib/systemd/system/vector.service; enabled; vendor preset: enabled)
     Active: active (running) since Tue 2022-02-08 10:52:59 UTC; 48s ago
       Docs: https://vector.dev
    Process: 18586 ExecStartPre=/usr/bin/vector validate (code=exited, status=0/SUCCESS)
   Main PID: 18599 (vector)
      Tasks: 3 (limit: 2275)
     Memory: 6.8M
     CGroup: /system.slice/vector.service
             └─18599 /usr/bin/vector
Otherwise, go ahead and start it with the command below.
sudo systemctl start vector
Afterwards, change into a root shell and append your Logtail vector
configuration for Apache into the /etc/vector/vector.toml file using the
command below. Don’t forget to replace the <your_logtail_source_token>
placeholder below with your source token.
wget -O ->> /etc/vector/vector.toml
    https://logtail.com/vector-toml/apache2/<your_logtail_source_token>
Then restart the vector service:
sudo systemctl restart vector
You will observe that your Apache logs will start coming through in Logtail:
Conclusion
In this tutorial, you learned about the different types of logs that the Apache
web server stores, where you can find those logs, and how to view their
contents. We also discussed Apache access and error log formatting and how to
create your custom log formats, including a structured JSON format. Finally, we
considered how you can manage all your Apache logs in one place by using the
Vector CLI to stream each entry to a log management service.
Don’t forget to read the docs to
find out more about all the logging features that Apache has to offer. Thanks
for reading!
Centralize all your logs into one place.
Analyze, correlate and filter logs with SQL.
Create actionable
dashboards.
Share and comment with built-in collaboration.
Got an article suggestion?
Let us know
![]()
![]()
![]()
Next article
How to View and Configure NGINX Access & Error Logs
Learn how to view and configure nginx access and error logs
→
![]()
This work is licensed under a Creative Commons Attribution-NonCommercial-ShareAlike 4.0 International License.
Apache – the technology that powers the web. I’m not sure if that is correct, but I think that we wouldn’t see the world wide web in its current shape without it. Launched in 1995 and since April 1996, it has been the most popular web server around the world.
Because of handling your users’ requests, Apache serves as the front application. It is crucial to understand what your server is doing, what file users are accessing, from where they came, and much, much more.
The visibility that Apache logs give you is invaluable in understanding the traffic coming to your application, the errors that happen, and the performance of the user-facing elements. Today, we will look into what the Apache web server logs are, how to interpret them, and how to analyze them easily.
What Are Apache Logs?
Apache logs are text files that contain all the information on what the Apache server is doing. They provide insight into which resources were accessed, when they were accessed, who accessed them, and metrics related to that. They also include information about the errors that happened, resource mapping process, the final resolution of the connection, and many, many more.
In general, the whole Apache logging process comes in multiple phases. First, you need to store the logs somewhere for historical analytical purposes. Second, you need to analyze the logs and parse them to retrieve useful information and metrics. And finally, you may want to graph the data as the visual representation is easier to analyze and understand for a human person.
What Is the Apache Access Log?
The Apache access logs are text files that include information about all the requests processed by the Apache server. You can expect to find information like the time of the request, the requested resource, the response code, time it took to respond, and the IP address used to request the data.
Apache Access Logs Location
The location of the Apache server access log differs depending on the operating system that you are using.
- On Red Hat, CentOS, or Fedora Linux, the access logs can be found in the
/var/log/httpd/access_logby default. - On Debian and Ubuntu, you can expect to find the Apache logs in the
/var/log/apache2/access.logand - FreeBSD will have the Apache server access logs stored in
/var/log/httpd-access.logfile.
You can configure its location using the CustomLog directive, for example:
CustomLog "/var/log/httpd-access.log"
Apache Access Log Format Configuration
Before we learn about the different log formats, let’s discuss what the Apache HTTP can do when it comes to formatting. There are two most common access log types that you can use and that the Apache server will translate to meaningful information:
- Common Log Format
- Combined Log Format
The log formatting directives are used in combination with the LogFormat option:
LogFormat "%t %h %m "%r"" custom
The above line tells that the “%t %h %m ”%r”” format should be used and assigned to an alias called custom. After that, we can use the custom alias when defining Apache logging. For example:
CustomLog "logs/my_custom_log" custom
The above section will tell Apache to write logs in the logs/my_custom_log file with the format defined by the custom alias. The above configuration will result in logging:
- time of the request thanks to the %t directive,
- remote hostname thanks to the %h directive,
- HTTP method thanks to the %m directive,
- the first line of the request surrounded by double quotes thanks to the %r directive.
Of course, there are way more directives that can be used and the complete list can be found in the mod_log_config documentation of the Apache server.
Common Log Format
The Apache Common Log Format is one of the two most common log formats used by HTTP servers. You can expect it to see its definition to look similar to the following line:
LogFormat "%h %l %u %t "%r" %>s %b" common
Here’s how an access log from that log file looks like:
10.1.2.3 - rehg [10/Nov/2021:19:22:12 -0000] "GET /sematext.png HTTP/1.1" 200 3423
As you can see the following elements are present:
- %h, resolved into 10.1.2.3 – the IP address of the remote host that made the request.
- %l, remote log name provided by identd, in our case a hyphen is provided, which is a value that we can expect to be logged in a case when the information provided by the logging directive is not found or can’t be accessed.
- %u, resolved into rehg, the user identifier determined by the HTTP authentication.
- %t, the date and time of the request with the time zone, in the above case it is [10/Nov/2021:19:22:12 -0000]
- ”%r”, the first line of the request inside double quotes, in the above case it is: “GET /sematext.png HTTP/1.1”
- %>s, the status code reported to the client. This information is crucial because it determines whether the request was successful or not.
- %b, the size of the object sent to the client, in our case the object was the sematext.png file and its size was 3423 bytes.
Combined Log Format
The Apache Combined Log Format is another format often used with access logs. It’s very similar to the Common Log Format but includes two additional headers – the referrer and the user agent. Its definition looks as follows:
LogFormat "%h %l %u %t "%r" %>s %b "%{Referer}i" "%{User-agent}i"" combined
And the example log line produced by the above log line looks like this:
10.1.2.3 - grah [12/Nov/2021:14:25:32 -0000] "GET /sematext.png HTTP/1.1" 200 3423 "http://www.sematext.com/index.html" "Mozilla/5.0 (Windows NT 10.0; Win64; x64) AppleWebKit/537.36 (KHTML, like Gecko) Chrome/79.0.3945.74 Safari/537.36 Edg/79.0.309.43"
Custom Log Format
There is one more thing that we should discuss when it comes to Apache Server logging configuration – the CustomLog directive. We’ve already seen that configuration directive, but let’s discuss that in greater details.
Multiple Access Logs
It is possible to have multiple Apache access logs at the same time without any additional effort. We may want a limited set of information available in some files for quick scanning and the full log using the Combined Log Format if we need the complete information. For example, we could have three access log files – one that includes time, user agent, and the status code, the second that includes the time, IP address, and referrer used, and the third – the Common Log Format.
To do that we need to include multiple CustomLog sections in our configuration file:
LogFormat "%h %l %u %t "%r" %>s %b" common
CustomLog logs/agent_log "%t %{User-agent}i %>s"
CustomLog logs/referer_log "%t %h %{Referer}i"
CustomLog logs/access_log common
You can see that this time we didn’t use three separate LogFormat configuration options, but we’ve specified the apache log format in the CustomLog format line. This is also possible and very convenient when the formatting of the log lines is used only in that given file.
Conditional Logs
There are cases when you would like to write logs only when a certain condition is met. This is what Apache Server calls conditional logging. It is done by using the CustomLog directive and environment variables. For example, if you would like to log all requests accessing your PNG files in a separate file you can do that the following way:
SetEnvIf Request_URI .png$ png-image-log
CustomLog "png-access.log" common env=png-image-log
Logs Rotation and Piped Logs
Depending on the logging configuration and the traffic that your Apache servers are handling, logging can be extensive. All the logs that you keep on the machine take space and if you are not using a log centralization solution like Sematext Logs, you will have to deal with space and management of logs.
Let’s talk about log rotation first. Log rotation is a process of creating a new log file that the Apache HTTP server will start writing to and renaming the old log file, so it is no longer updated. The log rotation happens when you gracefully restart the server. That means that without any kind of client requests processing interruption a new log file is created. In production environments, you would like to restart the Apache servers though.
That’s why the Apache server supports piped logs. Instead of writing the log events to a file, you use the piped logs to send the log events to a different application that will handle the log processing – for example to rotatelogs:
CustomLog "|/usr/local/apache/bin/rotatelogs /var/log/access.log 86400" common
The rotatelogs application comes with Apache server and is capable of rotating logs without the need of restarting the server. The above example will result in rotating the /var/log/access.log file every 24 hours.
How to Read Apache Access Logs
Apache server access logs are just simple text files. They can be easily opened by any tool that can read such files. On Linux-based systems, this can be the cat command-line tool or tail if you want to monitor the log lines as they go.
There are two caveats, though. The first is access policies. You may not have access to the machines running Apache HTTP server and even if you do, you may not have read access to the appropriate log directories. The second is distribution. It is not uncommon to have multiple Apache servers distributed across multiple data centers. In such a case, it is way easier to use a dedicated observability tool such as Sematext Logs that will provide not only the option to look into the raw files but also aggregated information into the key metrics derived for them.
Understanding Apache Access Logs
Our Apache access logs files are easy to read and not hard to understand either. Just remember about the patterns that you’ve used in your configuration. We’ve already covered the common patterns that you can encounter in the Apache log files. Keep in mind that understanding the log files is even easier with log analysis tools that do the parsing for you and give you an aggregated view of the data which is easier to understand.
What Is the Apache Error Log?
So far, we’ve talked about the Apache access log that gives us information on the accessed resources. But it is not the only thing that we should be interested in. We should also care about everything related to errors. In fact, the error log is the most important log file for the Apache HTTP server.
The Apache error log is where all the errors that happened during the processing of the requests. The most important thing, though, is that the error log will contain information on what went wrong during the Apache server startup and it is very likely that it will also contain hints on how to fix the issue.
Apache Errors Logs Location
Where the Apache error log is stored differs depending on the operating system on which it is running.
- On Red Hat, CentOS, or Fedora Linux, the access logs can be found in the
/var/log/httpd/error_logby default. - On Debian and Ubuntu, you can expect to find the Apache logs in the
/var/log/apache2/error.log - FreeBSD will have the Apache server access logs in
/var/log/httpd-error.logfile.
You can configure its location using the ErrorLog directive, for example:
ErrorLog "/var/log/httpd-error.log"
Apache Error Log Format Configuration
Similar to the Apache access log, you can adjust the format of the error log. The Apache error log format is configured by using the ErrorLogFormat element, for example:
ErrorLogFormat “[%{u}t] [%-m:%l] [pid %P:tid %T] [client %a] %M”
The above configuration would produce an Apache error log entry similar to the following one:
[Wed Nov 10 10:21:23.811033 2021] [core:error] [pid 22308:tid 3212342123] [client 10.1.2.3] File does not exist: /usr/local/apache2/htdocs/favicon.ico
In the above example the following formatting options were used:
- %{u}t – the current time including microseconds,
- %-m – the module that produced the error,
- %l – the level of the log event,
- %P – process identifier,
- %T – thread identifier,
- %M – the actual log message.
The full description of the available formatting options is available in the official Apache Server documentation.
Log Levels
In addition to what we discussed so far there is one other thing worth mentioning – the level of log events. The LogLevel directive allows specifying the level of log messages on a per-module basis. For example, if we would like the main log level for all events to be set to the info level but have the error level only for the rewrite module, we could have a configuration directive as follows:
LogLevel info rewrite:error
The following logging levels are described in Apache server documentation:
- emerg
- alert
- crit
- error
- warn
- notice
- info
- debug
- trace1 – trace8
The emerg one is the log event that says that the system is unstable and the trace levels are used for very low-level information logging that you can probably skip.
How to View Apache Error Logs
Viewing the Apache server error logs is just as simple as opening the text file. The error logs are not different from the access logs, so they are just simple text files. You can use whatever tools you want to look into them. But keep in mind that looking into logs from multiple Apache servers distributed across multiple data centers can be challenging. That’s why we strongly suggest using log aggregation tools, such as Sematext Logs, for that job.
Apache Log File Management and Analysis with Sematext
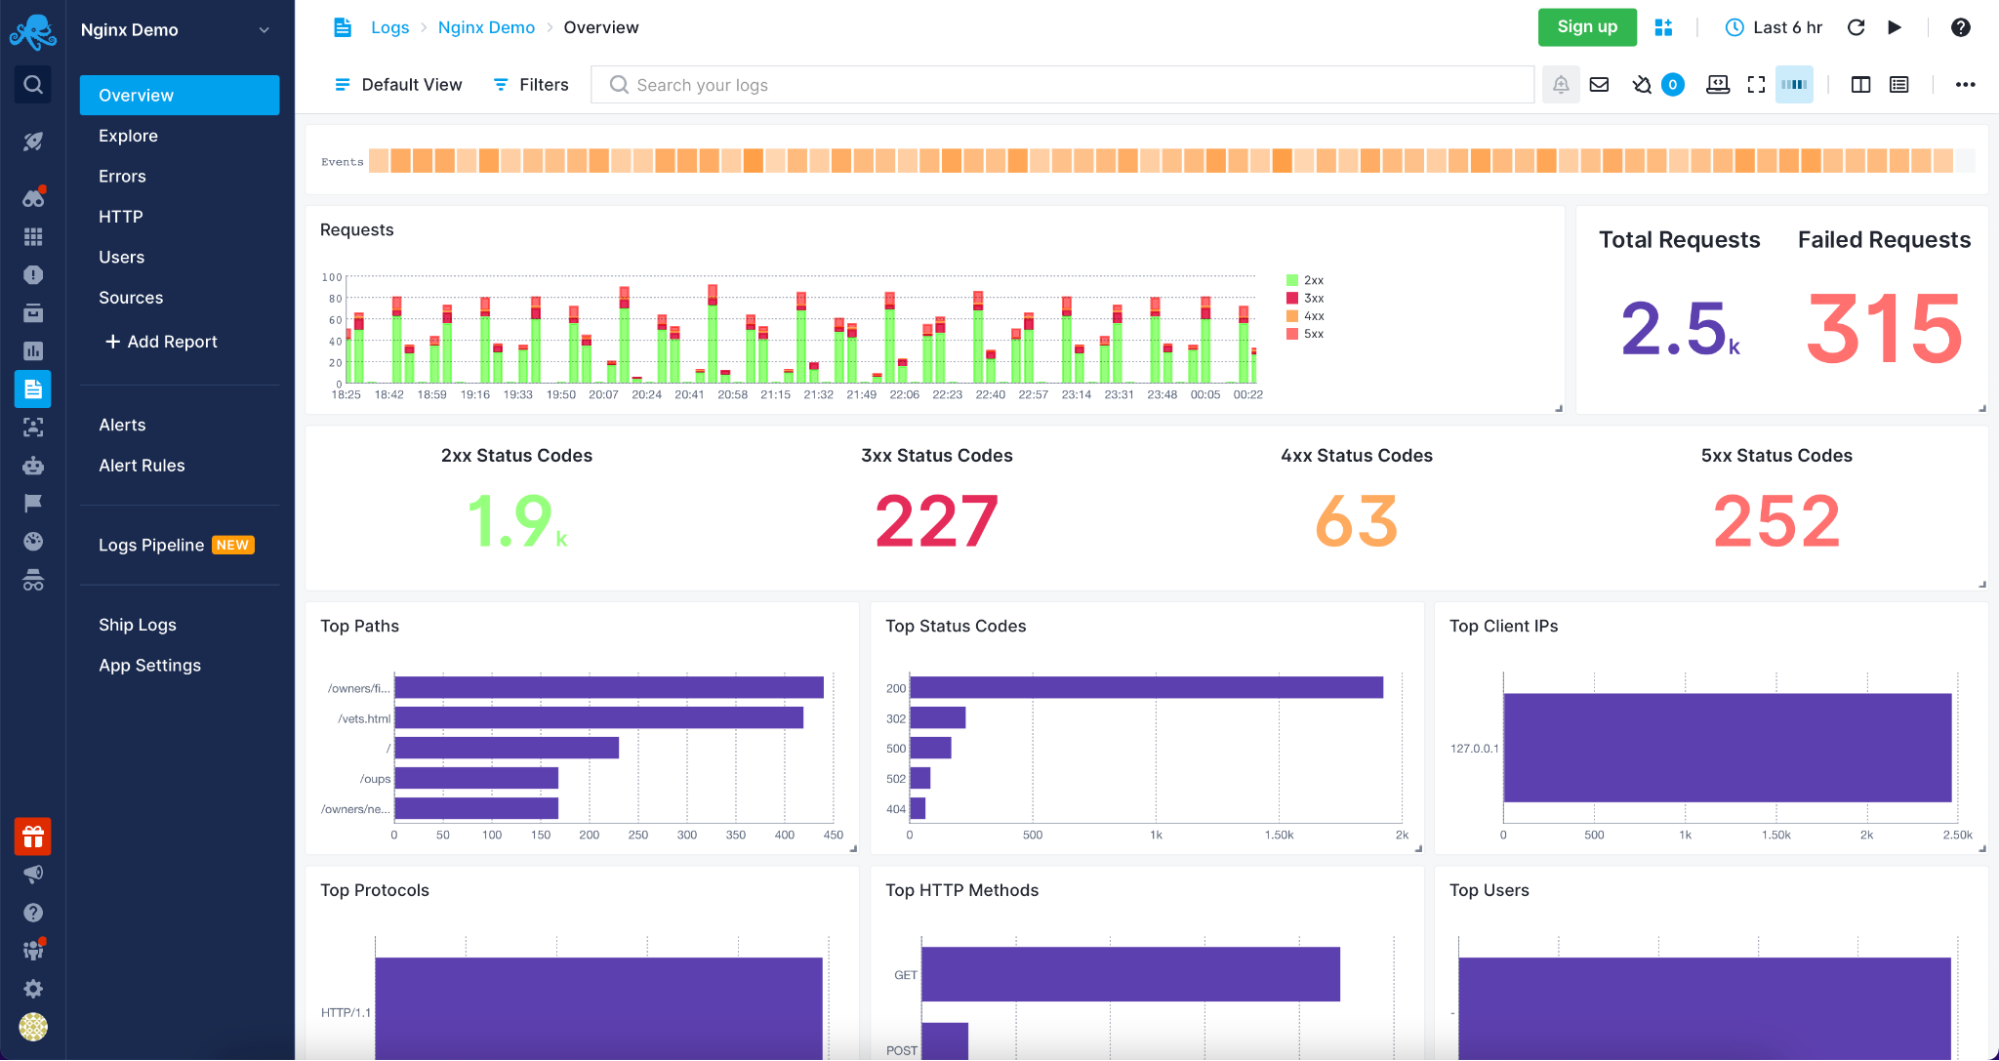
Sematext Cloud Logs – Apache Overview
Understanding and analyzing your Apache servers logs was never easier than with Sematext Logs. The only thing that you need to do is create an account with Sematext, create the Apache Logs App and install the Sematext Agent. You will be guided through the process of setting up the automatic Logs Discovery for your Logs. Your logs will be parsed and sent to the Sematext Logs giving you access to a variety of pre-built reports tailored for your Apache HTTP server.
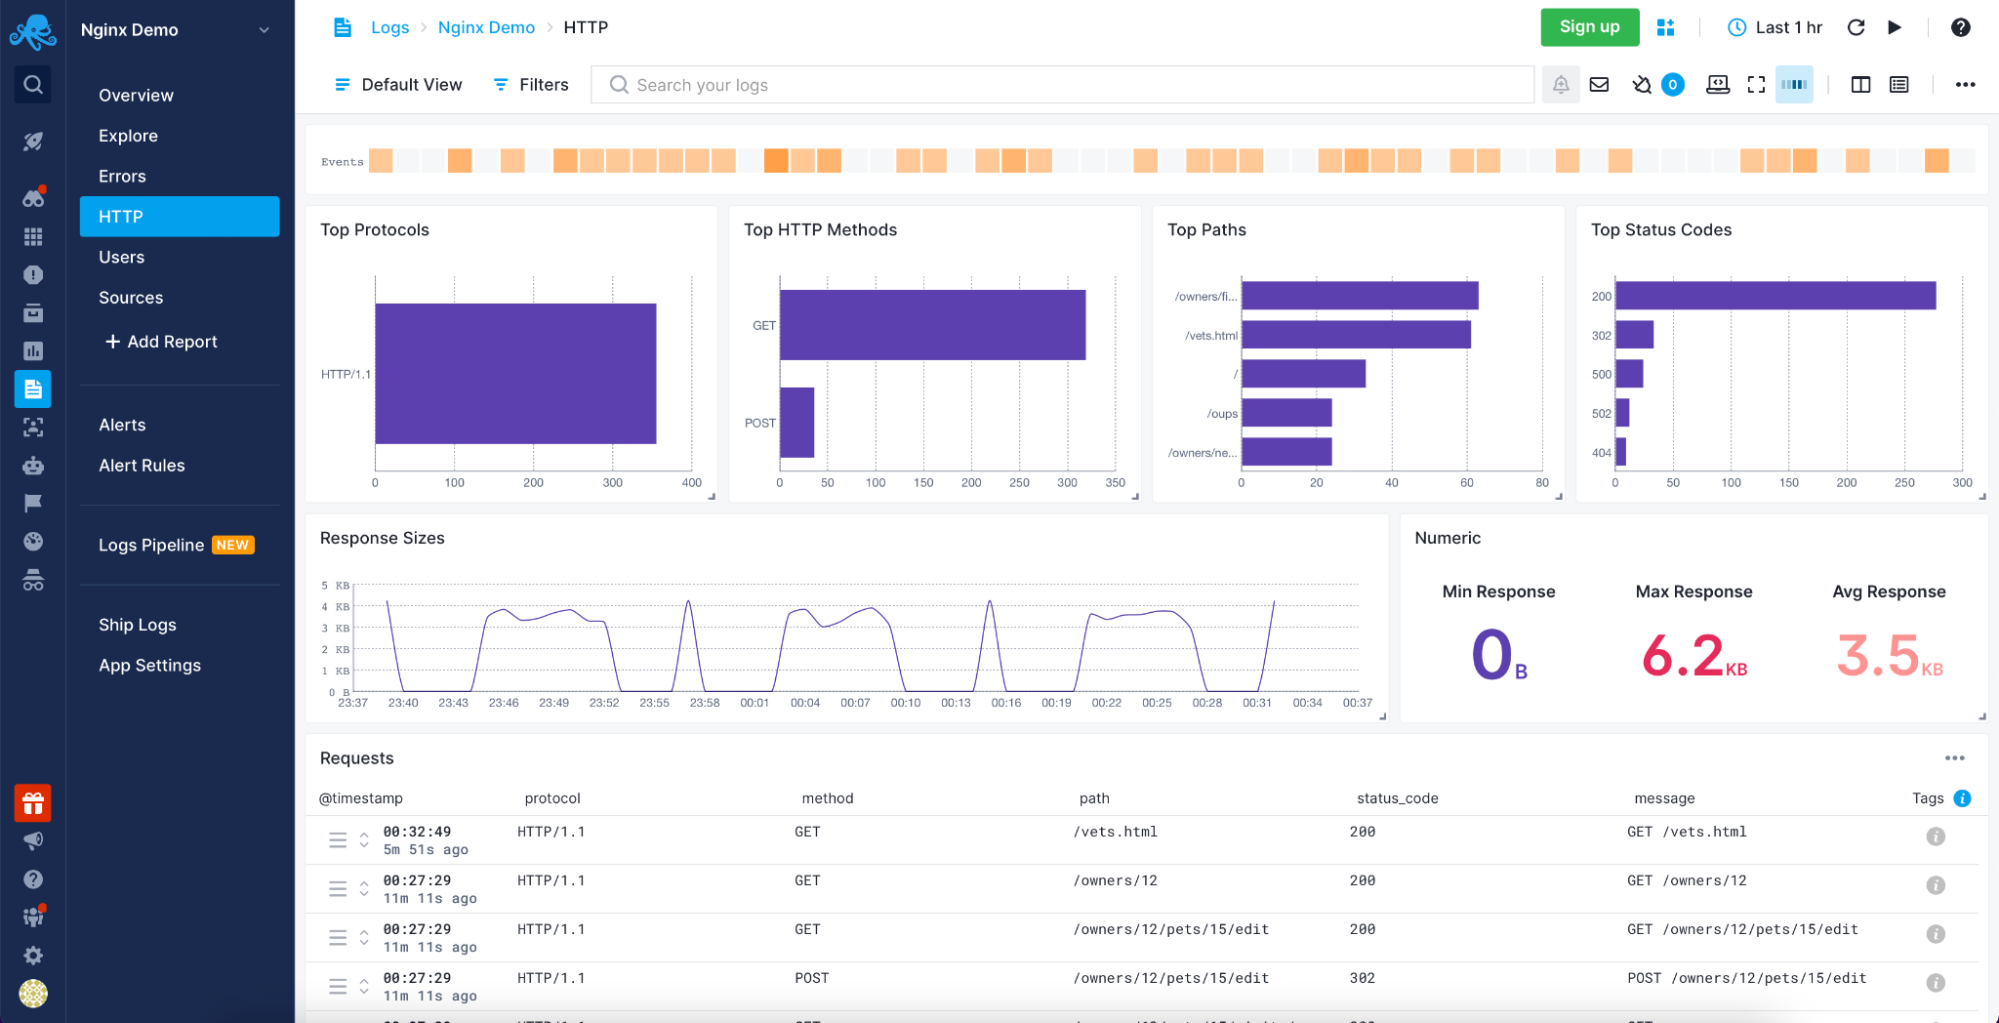
Sematext Logs – Apache HTTP Information
Sematext Logs is part of the Sematext Cloud full-stack monitoring solution providing you with all you need when it comes to observability. With Sematext Cloud, you get an overview of your Apache servers, errors report, HTTP report, including top HTTP methods and paths with an average response size visualization and requests table. You can see your users with the top User Agents used to access resources served by your Apache servers and, finally, the sources for the data. All within a single Apache Logs monitoring in Sematext Cloud.
Still not sure which open-source search engine to use? Check out this quick video comparing Apache Solr and Elasticsearch below:
Conclusion
Analyzing your Apache servers logs is invaluable in understanding the traffic coming to your application, the errors that happen, and the performance of the user-facing elements. A log management tool such as Sematext Logs does this job for you.
More than understanding server logs, knowing what resources were accessed, who accessed them, and how long it took to process the request is crucial to understanding your user’s behavior. You also need to be sure that you are aware of every error that happens so that you can react as soon as possible. Combining that with the need for distributed infrastructures to handle a large number of concurrent users and provide high availability, using an observability tool is a necessity.
Having Apache metrics and logs in the same place, being able to slice and dice them, being alerted when issues appear and having insight into every piece of your environment is no longer something good to have but need to have. All of that and more is provided by Sematext Cloud, an observability platform with dedicated Apache server logs and metrics support. Built with simplicity in mind and requiring no credit card, nothing stops you from giving it a try to see how it can improve your log management and log analysis processes.
Introduction
Apache is part of the LAMP stack of software for Linux (Linux, Apache, MySQL, PHP). Apache is responsible for serving web pages to people looking at your website.
The server grants access for visits to your website, and it keeps an access log. These records, or log files, can be a valuable source of information about your website, usage, and audience.
In this tutorial, you will learn how to view Apache access log files.

Prerequisites
- A Linux system running Apache web services
- A user account with root (sudo) access
- Terminal window (Ctrl-Alt-T in Ubuntu, Alt-F2 in CentOS)
Viewing Apache Access Logs
Use cPanel to Download Raw Access Files
If you’re logged in to a web server with cPanel, you can download the Apache access logs through a graphical interface.
1. Look for the section labeled Metrics.
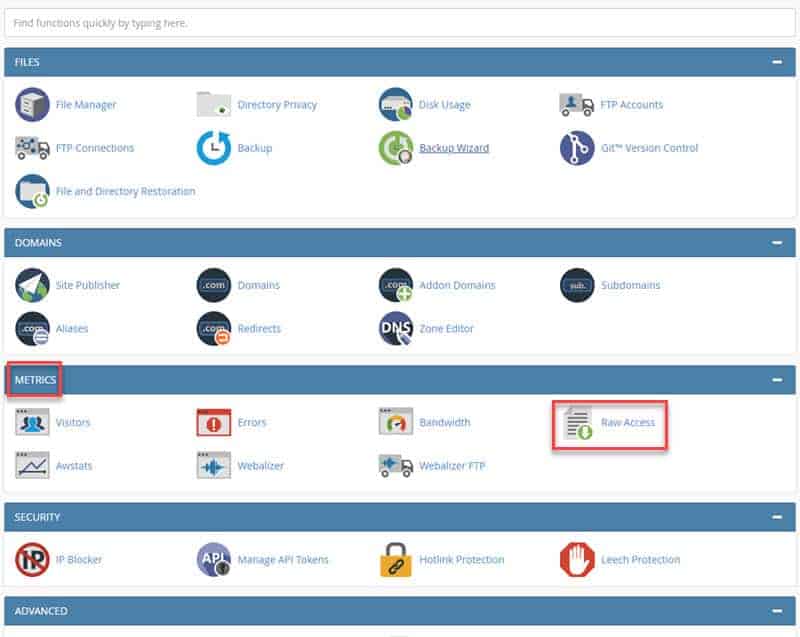
2. Click Raw Access. If archiving is enabled, raw Apache log files can be downloaded at the bottom of the page. They will look like standard hyperlinks, labeled for the website you’re managing.
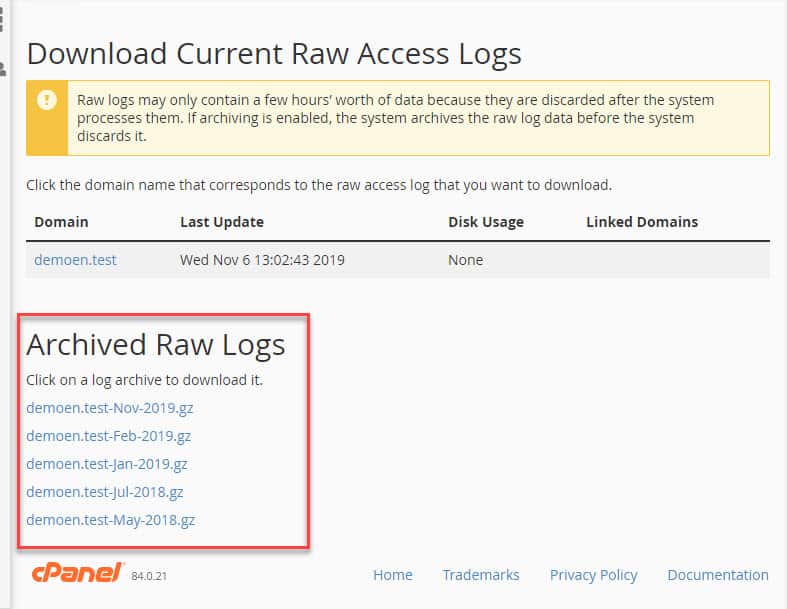
Clicking the hyperlink will prompt you to save or open the file. These log files are compressed using gzip, so if you’re not using a Linux system, you might need a decompression tool. Save the file to a location of your liking.
3. Locate the file in your OS, then right-click > extract. A new file should appear without the .gz extension.
4. Right-click > edit to open the file in your favorite text editor to view the contents.
Using Terminal Commands to Display Local Access Logs
If you’re working on the machine that hosts Apache, or if you’re logged into that machine remotely, you can use the terminal to display and filter the contents of the access logs.
By default, you can find the Apache access log file at the following path:
- /var/log/apache/access.log
- /var/log/apache2/access.log
- /etc/httpd/logs/access_log
Use the GUI or the terminal with the cd command to navigate your system to find where the logs are stored.
Step 1: Display the Last 100 Entries of the Access Log
In the terminal window, enter the following:
sudo tail -100 /var/log/apache2/access.logThe tail command tells the machine to read the last part of the file, and the -100 command directs it to display the previous 100 entries.
The final part, /var/log/apache2/access.log tells the machine where to look for the log file. If your log file is in a different place, make sure to substitute your machine’s path to the Apache log files.
Step 2: Display a Specific Term from Access Logs
Sometimes, you only want to display a specific type of entry in the log. You can use the grep command to filter your report by certain keywords.
For example, enter the following into a terminal:
sudo grep GET /var/log/apache2/access.logLike the previous command, this looks at the /var/log/apache2/access.log file to display the contents of the access log. The grep command tells the machine to only display entries with the GET request.
You can substitute other Apache commands as well. For example, if you’re looking to monitor access to .jpg images, you could substitute .jpg for GET. As before, use the actual path to your server’s log file.
In addition to the access log, you can use the previously mentioned terminal commands to view the error log.
Enter the following command in the terminal:
sudo tail -100 /var/log/apache2/error.logIf you found your access log file in another location, your error log file will be in the same location. Make sure you type the correct path.
Interpreting the Access Log in Apache
When you open your access log file for the first time, you may feel overwhelmed.
There’s a lot of information about HTTP requests, and some text editors (and the terminal) will wrap the text to the next line. This can make it confusing to read, but each piece of information is displayed in a specific order.
The conventional method for expressing the format of access log files is:
"%h %l %u %t "%r" %>s %b "%{Referer}i" "%{User-agent}i""This is a code for the most common things in each line of the log.
Each % sign corresponds to a piece of information in the log:
%h– The client’s IP address (the source of the access request).%l– This next entry may simply be a hyphen — that means no information was retrieved. This is the result of checkingidentdon the client.%u– Client’suserid, if the access request required http authentication.%t– Timestamp of the incoming request.%r– Request line that was used. This tells you the http method (GET, POST, HEAD, etc.), the path to what was requested, and the http protocol being used.%>s– Status code that was returned from the server to the client.%b– Size of the resource that was requested."%{Referer}i"– This tells you if the access came from clicking a link on another website, or other ways that the client was referred to your page."%{User-agent}i"– Tells you information about the entity making the request, such as web browser, operating system, website source (in the case of a robot), etc.
Just read across the line in your log file, and each entry can be decoded as above. If there is no information, the log will display a hyphen. If you’re working on a preconfigured server, your log file may have more or less information. You can also create a custom log format by using the custom log module.
For more information about decoding log formats, see this page.
How to Use Data in Apache Log Files
Apache log analysis gives you the opportunity to measure the ways that clients interact with your website.
For example, you might look at a timestamp to figure out how many access requests arrive per hour to measure traffic patterns. You could look at the user agent to find out if particular users are logging in to a website to access a database or create content. You could even track failed authentications to monitor various types of cybersecurity attacks against your system.
The apache error log can be used similarly. Often, it’s simply used to see how many 404 errors are being generated. A 404 error happens when a client requests a missing resource, and this can alert you on broken links or other errors within the page. However, it can also be used to find configuration glitches or even warnings about potential server problems.
Conclusion
This guide provided methods for extracting data to view Apache access log files.
The access.log file is an excellent resource for measuring the ways that clients are interacting with your server. The error.log file can help you troubleshoot issues with your website.
25 ноября, 2015 11:53 дп
15 508 views
| Комментариев нет
Ubuntu
Веб-сервер Apache может предоставлять администратору много полезной информации о своей работе, а также о проблемах и ошибках, которые нужно устранить.
Вовремя настроенное журналирование позволяет в дальнейшем избежать неожиданных проблем с веб-сервером. Информация, хранящаяся в логах (или журналах) сервера, помогает быстро оценить ситуацию и устранить ошибки. Apache предоставляет очень гибкий механизм журналирования.
Данное руководство знакомит с возможностями журналирования Apache и предназначенными для этого инструментами.
Примечание: В данном руководстве используется Apache2 на сервере Ubuntu 12.04, но инструкции подойдут и для других дистрибутивов.
Уровни логирования
Apache делит все уведомляющие сообщения на категории в зависимости от важности соощения.
Для этого существуют уровни логирования. К примеру, наиболее важные сообщения, уведомляющие о критических ошибках и сбоях, существует уровень emerg. А сообщения уровня info просто предоставляют полезные подсказки.
Существуют следующие уровни логирования:
- emerg: критическая ситуация, аварийный сбой, система находится в нерабочем состоянии.
- alert: сложная предаварийная ситуация, необходимо срочно принять меры.
- crit: критические проблемы, которые необходимо решить.
- error: произошла ошибка.
- warn: предупреждение; в системе что-то произошло, но причин для беспокойства нет.
- notice: система в норме, но стоит обратить внимание на её состояние.
- info: важная информация, которую следует принять к сведению.
- Debug: информация для отладки, которая может помочь определить проблему.
- trace[1-8]: Трассировка информации различных уровней детализации.
При настройке логирования задаётся наименее важный уровень, который нужно вносить в лог. Что это значит? Логи фиксируют указанный уровень логирования, а также все уровни с более высоким приоритетом. К примеру, если выбрать уровень error, логи будут фиксировать уровни error, crit, alert и emerg.
Для настройки уровня логирования существует директива LogLevel. Уровень логирования по умолчанию задан в стандартном конфигурационном файле:
sudo nano /etc/apache2/apache2.conf

. . .

LogLevel warn

. . .
Как видите, по умолчанию Apache вносит в лог сообщения уровня warn (и более приоритетных уровней).
Где находятся логи Apache?
Apache может разместить свои логи, используя общесерверные настройки ведения логов. Также можно настроить индивидуальное логирование для каждого отдельного виртуального хоста.
Общесерверные настройки логирования
Чтобы узнать, где находятся стандартные логи сервера, откройте конфигурационный файл. В Ubuntu это /etc/apache2/apache2.conf:
sudo nano /etc/apache2/apache2.conf
Найдите в файле строку:
ErrorLog ${APACHE_LOG_DIR}/error.log
Данная директива указывает на расположение лога, в котором Apache хранит сообщения об ошибках. Как видите, для получения префикса пути к каталогу используется переменная среды APACHE_LOG_DIR.
Чтобы узнать значение переменной APACHE_LOG_DIR, откройте файл envvars:
sudo nano /etc/apache2/envvars

. . .

export APACHE_LOG_DIR=/var/log/apache2$SUFFIX

. . .
Согласно этому файлу, переменная APACHE_LOG_DIR настроена на каталог /var/log/apache2. Это означает, что Apache соединит это значение с директивой в конфигурационном файле apache2.conf и будет вносить данные в лог /var/log/apache2/error.log.
sudo ls /var/log/apache2

access.log  error.log  other_vhosts_access.log
Как видите, тут находится лог ошибок error.log и несколько других логов.
Логирование виртуальных хостов
Файл access.log, упомянутый в конце предыдущего раздела, не настраивается в файле apache2.conf. Вместо этого разработчики поместили соответствующую директиву в файл виртуального хоста.
Откройте и просмотрите стандартный виртуальный хост:
sudo nano /etc/apache2/sites-available/default
Пролистайте файл и найдите следующие три значения, связанные с логированием:
. . .

ErrorLog ${APACHE_LOG_DIR}/error.log

LogLevel warn

CustomLog ${APACHE_LOG_DIR}/access.log combined

. . .
Местонахождение ErrorLog совпадает с его определением в стандартном конфигурационном файле. Эта строка не обязательно должна находиться в двух отдельных файлах; при изменении местонахождения этого лога в одном из файлов ошибки не возникнет.
Пользовательские логи
В предыдущем разделе строка, описывающая access.log, использует не такую директиву, как предыдущие строки для настройки логов. Она использует CustomLog:
CustomLog ${APACHE_LOG_DIR}/access.log combined
Эта директива имеет такой синтаксис:
CustomLog log_location log_format
В данном случае log_format (формат логов) является комбинированным (combined). Эта спецификация не является внутренней спецификацией Apache; она задаёт пользовательский формат, который определен в конфигурационном файле по умолчанию.
Снова откройте конфигурационный файл по умолчанию и найдите строку, определяющую формат combined:
sudo nano /etc/apache2/apache2.conf

. . .

LogFormat "%h %l %u %t "%r" %>s %O "{Referer}i" "%{User-Agent}i"" combined

. . .
Команда LogFormat определяет пользовательский формат логов, вызываемых директивой CustomLog.
Этот формат называется комбинированным (combined).
Примечание: Подробнее о доступных форматах можно узнать здесь.
Существует еще несколько распространённых форматов, которые можно использовать в определении виртуальных хостов. Можно также создавать свои собственные форматы.
Ротация логов Apache
Ротация логов – это процесс, подразумевающий отключение устаревших или слишком объёмных лог-файлов и их архивирование (на установленный период времени). Apache может вносит в лог довольно большие объёмы данных, следовательно, во избежание заполнения дискового пространства необходимо настроить ротацию логов.
Ротация логов может быть очень простой (как, например, отключение слишком больших логов), а может иметь и более сложную конфигурацию (то есть, функционировать как система архивирования и хранения старых логов).
Рассмотрим методы настройки ротации логов Apache.
Ротация логов вручную
Перемещать логи во время работы Apache нельзя. То есть, чтобы переместить в архив устаревшие или заполненные логи и заменить их новыми, нужно перезапустить сервер.
Это можно сделать вручную. Для этого нужно переместить устаревшие файлы, а затем, перезапустив Apache, обновить настройки веб-сервера и заставить его использовать новые логи.
Ниже приведён пример из документации Apache. Возможно, понадобится добавить в начало этих команд sudo.
mv access_log access_log.old

mv error_log error_log.old

apachectl graceful

sleep 600

[post-processing of log files]
Эти команды переместят файлы, перезапустят сервер и скажут ему подождать 600 секунд. Таким образом Apache сможет использовать старые лог-файлы, чтобы завершить регистрацию старых запросов. В течение этого времени новые запросы будут записаны в новые лог-файлы.
Имейте в виду: ротация логов вручную очень ненадёжна в больших серверных средах.
Утилита logrotate
По умолчанию система Ubuntu настраивает ротацию логов при помощи утилиты logrotate.
Данная программа может выполнять ротацию логов при соблюдении определенных критериев. Просмотреть события, включающие Logrotate для ротации логов, можно в файле /etc/logrotate.d/apache2:
sudo nano /etc/logrotate.d/apache2
В нём находится несколько параметров logrotate. Обратите внимание на первую строку:
/var/log/apache2/*.log {
Это значит, что logrotate будет выполнять ротацию только тех логов, которые находятся в /var/log/apache2. Имейте это в виду, если вы выбрали другой каталог для хранения в конфигурации Apache.
Как видите, логи ротируются еженедельно. Также тут есть раздел кода, перезапускающий Apache после ротации:
postrotate

/etc/init.d/apache2 reload > /dev/null

endscript
Эти строки автоматически перезапускают веб-сервер Apache после завершения ротации.
Примечание: К сожалению, настройки данного файла не охвачены в данном руководстве.
Ротация логов по каналам
Использование каналов вместо файлов – простой способ передать обработку вывода программе логирования. Это также решает проблему ротации логов, поскольку ротация может выполняться с помощью программы на серверной стороне (а не самим сервером Apache).
Чтобы логи обрабатывались программой логирования, принимающей стандартный вывод, замените следующую строку следующим образом:
CustomLog "| logging_program logging_program_parameters" combined
Apache запустит программу логирования во время загрузки и перезапустит её в случае ошибки или сбоя.
Для ротации логов можно использовать разные программы, но по умолчанию Apache поставляется с rotatelogs. Чтобы настроить эту программу, используйте:
CustomLog "| /path/to/rotatelog /path/of/log/to/rotate number_of_seconds_between_rotations" log_level
Аналогичную конфигурацию можно создать и для других программ.
Заключение
Конечно, это руководство охватывает только основы логирования Apache.
Правильная настройка механизмов логирования и разумное управление лог-файлами сэкономят немало времени и сил в случае возникновения проблем с сервером. Имея быстрый доступ к информации, которая поможет определить проблемы, можно в кратчайшие сроки исправить все ошибки.
Также очень важно следить за логами сервера, чтобы случайно не подвергнуть опасности конфиденциальную информацию.
Tags: Apache, Apache 2, Logrotate, Ubuntu 12.04