Issue
You are opening your application and an «Application Error» message is displayed.
Resolution
«Application Error» or similar is always caused by your own application code. Routing errors will normally only surface themselves within the logs of your application.
To track this kind of issue down you should look at your logs:
$ heroku logs --tail --app your_app_name
In most cases, you will be able to see the cause of the error there. To learn more about logging, please see our Logging article on DevCenter.
If you can’t see the source of the error straight away, try restarting your app from another terminal window or via the Heroku Dashboard:
$ heroku restart
There are some errors which only occur when the app is rebooting so you will need to restart the app to see these log messages appear.
For most apps, we also recommend enabling one of the free logging addons from https://elements.heroku.com/addons#logging to make sure that your historical log data is being saved. Many of these have searchable web interfaces which can be helpful in tracking issues over time.
If you find an error message that you don’t understand, try checking out the following resources:
- Heroku Error Codes (H12, R14, R15, H10, H14 etc.) — https://devcenter.heroku.com/articles/error-codes
- Postgres Errors — https://devcenter.heroku.com/articles/postgres-logs-errors
- Language/App errors — Stack Overflow http://stackoverflow.com/
Ask on Stack Overflow
Engage with a community of passionate experts to get the answers you need
Ask on Stack Overflow
Last updated November 07, 2022
Table of Contents
- H10 — App crashed
- H11 — Backlog too deep
- H12 — Request timeout
- H13 — Connection closed without response
- H14 — No web dynos running
- H15 — Idle connection
- H16 — (No Longer in Use)
- H17 — Poorly formatted HTTP response
- H18 — Server Request Interrupted
- H19 — Backend connection timeout
- H20 — App boot timeout
- H21 — Backend connection refused
- H22 — Connection limit reached
- H23 — Endpoint misconfigured
- H24 — Forced close
- H25 — HTTP Restriction
- H26 — Request Error
- H27 — Client Request Interrupted
- H28 — Client Connection Idle
- H31 — Misdirected Request
- H80 — Maintenance mode
- H81 — Blank app
- H82 — You’ve used up your dyno hour pool
- H83 — Planned Service Degradation
- H99 — Platform error
- R10 — Boot timeout
- R12 — Exit timeout
- R13 — Attach error
- R14 — Memory quota exceeded
- R15 — Memory quota vastly exceeded
- R16 — Detached
- R17 — Checksum error
- R99 — Platform error
- L10 — Drain buffer overflow
- L11 — Tail buffer overflow
- L12 — Local buffer overflow
- L13 — Local delivery error
- L14 — Certificate validation error
- L15 — Tail buffer temporarily unavailable
Whenever your app experiences an error, Heroku will return a standard error page with the HTTP status code 503. To help you debug the underlying error, however, the platform will also add custom error information to your logs. Each type of error gets its own error code, with all HTTP errors starting with the letter H and all runtime errors starting with R. Logging errors start with L.
H10 — App crashed
A crashed web dyno or a boot timeout on the web dyno will present this error.
2010-10-06T21:51:04-07:00 heroku[web.1]: State changed from down to starting
2010-10-06T21:51:07-07:00 app[web.1]: Starting process with command: `bundle exec rails server -p 22020`
2010-10-06T21:51:09-07:00 app[web.1]: >> Using rails adapter
2010-10-06T21:51:09-07:00 app[web.1]: Missing the Rails 2.3.5 gem. Please `gem install -v=2.3.5 rails`, update your RAILS_GEM_VERSION setting in config/environment.rb for the Rails version you do have installed, or comment out RAILS_GEM_VERSION to use the latest version installed.
2010-10-06T21:51:10-07:00 heroku[web.1]: Process exited
2010-10-06T21:51:12-07:00 heroku[router]: at=error code=H10 desc="App crashed" method=GET path="/" host=myapp.herokuapp.com fwd=17.17.17.17 dyno= connect= service= status=503 bytes=
H11 — Backlog too deep
When HTTP requests arrive faster than your application can process them, they can form a large backlog on a number of routers. When the backlog on a particular router passes a threshold, the router determines that your application isn’t keeping up with its incoming request volume. You’ll see an H11 error for each incoming request as long as the backlog is over this size. The exact value of this threshold may change depending on various factors, such as the number of dynos in your app, response time for individual requests, and your app’s normal request volume.
2010-10-06T21:51:07-07:00 heroku[router]: at=error code=H11 desc="Backlog too deep" method=GET path="/" host=myapp.herokuapp.com fwd=17.17.17.17 dyno= connect= service= status=503 bytes=
The solution is to increase your app’s throughput by adding more dynos, tuning your database (for example, adding an index), or making the code itself faster. As always, increasing performance is highly application-specific and requires profiling.
H12 — Request timeout
For more information on request timeouts (including recommendations for resolving them), take a look at our article on the topic.
An HTTP request took longer than 30 seconds to complete. In the example below, a Rails app takes 37 seconds to render the page; the HTTP router returns a 503 prior to Rails completing its request cycle, but the Rails process continues and the completion message shows after the router message.
2010-10-06T21:51:07-07:00 app[web.2]: Processing PostController#list (for 75.36.147.245 at 2010-10-06 21:51:07) [GET]
2010-10-06T21:51:08-07:00 app[web.2]: Rendering template within layouts/application
2010-10-06T21:51:19-07:00 app[web.2]: Rendering post/list
2010-10-06T21:51:37-07:00 heroku[router]: at=error code=H12 desc="Request timeout" method=GET path="/" host=myapp.herokuapp.com fwd=17.17.17.17 dyno=web.1 connect=6ms service=30001ms status=503 bytes=0
2010-10-06T21:51:42-07:00 app[web.2]: Completed in 37000ms (View: 27, DB: 21) | 200 OK [http://myapp.heroku.com/]
This 30-second limit is measured by the router, and includes all time spent in the dyno, including the kernel’s incoming connection queue and the app itself.
See Request Timeout for more, as well as a language-specific article on this error:
- H12 — Request Timeout in Ruby (MRI)
H13 — Connection closed without response
This error is thrown when a process in your web dyno accepts a connection but then closes the socket without writing anything to it.
2010-10-06T21:51:37-07:00 heroku[router]: at=error code=H13 desc="Connection closed without response" method=GET path="/" host=myapp.herokuapp.com fwd=17.17.17.17 dyno=web.1 connect=3030ms service=9767ms status=503 bytes=0
One example where this might happen is when a Unicorn web server is configured with a timeout shorter than 30s and a request has not been processed by a worker before the timeout happens. In this case, Unicorn closes the connection before any data is written, resulting in an H13.
An example of an H13 can be found here.
H14 — No web dynos running
This is most likely the result of scaling your web dynos down to 0 dynos. To fix it, scale your web dynos to 1 or more dynos:
$ heroku ps:scale web=1
Use the heroku ps command to determine the state of your web dynos.
2010-10-06T21:51:37-07:00 heroku[router]: at=error code=H14 desc="No web processes running" method=GET path="/" host=myapp.herokuapp.com fwd=17.17.17.17 dyno= connect= service= status=503 bytes=
H15 — Idle connection
The dyno did not send a full response and was terminated due to 55 seconds of inactivity. For example, the response indicated a Content-Length of 50 bytes which were not sent in time.
2010-10-06T21:51:37-07:00 heroku[router]: at=error code=H15 desc="Idle connection" method=GET path="/" host=myapp.herokuapp.com fwd=17.17.17.17 dyno=web.1 connect=1ms service=55449ms status=503 bytes=18
H16 — (No Longer in Use)
Heroku no longer emits H16 errors
H17 — Poorly formatted HTTP response
Our HTTP routing stack has no longer accepts responses that are missing a reason phrase in the status line. ‘HTTP/1.1 200 OK’ will work with the new router, but ‘HTTP/1.1 200’ will not.
This error message is logged when a router detects a malformed HTTP response coming from a dyno.
2010-10-06T21:51:37-07:00 heroku[router]: at=error code=H17 desc="Poorly formatted HTTP response" method=GET path="/" host=myapp.herokuapp.com fwd=17.17.17.17 dyno=web.1 connect=1ms service=1ms status=503 bytes=0
H18 — Server Request Interrupted
An H18 signifies that the socket connected, and some data was sent; The error occurs in cases where the socket was destroyed before sending a complete response, or if the server responds with data before reading the entire body of the incoming request.
2010-10-06T21:51:37-07:00 heroku[router]: sock=backend at=error code=H18 desc="Server Request Interrupted" method=GET path="/" host=myapp.herokuapp.com fwd=17.17.17.17 dyno=web.1 connect=1ms service=1ms status=503 bytes=0
An example of an H18 can be found here.
H19 — Backend connection timeout
A router received a connection timeout error after 5 seconds of attempting to open a socket to a web dyno. This is usually a symptom of your app being overwhelmed and failing to accept new connections in a timely manner. For Common Runtime apps, if you have multiple dynos, the router will retry multiple dynos before logging H19 and serving a standard error page. Private Space routers can’t reroute requests to another web dyno.
If your app has a single web dyno, it is possible to see H19 errors if the runtime instance running your web dyno fails and is replaced. Once the failure is detected and the instance is terminated your web dyno will be restarted somewhere else, but in the meantime, H19s may be served as the router fails to establish a connection to your dyno. This can be mitigated by running more than one web dyno.
2010-10-06T21:51:07-07:00 heroku[router]: at=error code=H19 desc="Backend connection timeout" method=GET path="/" host=myapp.herokuapp.com fwd=17.17.17.17 dyno=web.1 connect=5001ms service= status=503 bytes=
H20 — App boot timeout
The router will enqueue requests for 75 seconds while waiting for starting processes to reach an “up” state. If after 75 seconds, no web dynos have reached an “up” state, the router logs H20 and serves a standard error page.
2010-10-06T21:51:07-07:00 heroku[router]: at=error code=H20 desc="App boot timeout" method=GET path="/" host=myapp.herokuapp.com fwd=17.17.17.17 dyno= connect= service= status=503 bytes=
The Ruby on Rails asset pipeline can sometimes fail to run during git push, and will instead attempt to run when your app’s dynos boot. Since the Rails asset pipeline is a slow process, this can cause H20 boot timeout errors.
This error differs from R10 in that the H20 75-second timeout includes platform tasks such as internal state propagation, requests between internal components, slug download, unpacking, container preparation, etc… The R10 60-second timeout applies solely to application startup tasks.
If your application requires more time to boot, you may use the boot timeout tool to increase the limit. However, in general, slow boot times will make it harder to deploy your application and will make recovery from dyno failures slower, so this should be considered a temporary solution.
H21 — Backend connection refused
A router received a connection refused error when attempting to open a socket to your web process. This is usually a symptom of your app being overwhelmed and failing to accept new connections.
For Common Runtime apps, the router will retry multiple dynos before logging H21 and serving a standard error page. Private Spaces apps are not capable of sending the requests to multiple dynos.
2010-10-06T21:51:07-07:00 heroku[router]: at=error code=H21 desc="Backend connection refused" method=GET path="/" host=myapp.herokuapp.com fwd=17.17.17.17 dyno=web.1 connect=1ms service= status=503 bytes=
H22 — Connection limit reached
A routing node has detected an elevated number of HTTP client connections attempting to reach your app. Reaching this threshold most likely means your app is under heavy load and is not responding quickly enough to keep up. The exact value of this threshold may change depending on various factors, such as the number of dynos in your app, response time for individual requests, and your app’s normal request volume.
2010-10-06T21:51:07-07:00 heroku[router]: at=error code=H22 desc="Connection limit reached" method=GET path="/" host=myapp.herokuapp.com fwd=17.17.17.17 dyno= connect= service= status=503 bytes=
H23 — Endpoint misconfigured
A routing node has detected a websocket handshake, specifically the ‘Sec-Websocket-Version’ header in the request, that came from an endpoint (upstream proxy) that does not support websockets.
2010-10-06T21:51:07-07:00 heroku[router]: at=error code=H23 desc="Endpoint misconfigured" method=GET path="/" host=myapp.herokuapp.com fwd=17.17.17.17 dyno= connect= service= status=503 bytes=
H24 — Forced close
The routing node serving this request was either shutdown for maintenance or terminated before the request completed.
2010-10-06T21:51:07-07:00 heroku[router]: at=error code=H24 desc="Forced close" method=GET path="/" host=myapp.herokuapp.com fwd=17.17.17.17 dyno=web.1 connect=1ms service=80000ms status= bytes=18
H25 — HTTP Restriction
This error is logged when a routing node detects and blocks a valid HTTP response that is judged risky or too large to be safely parsed. The error comes in four types.
Currently, this functionality is experimental, and is only made available to a subset of applications on the platform.
Invalid content length
The response has multiple content lengths declared within the same response, with varying lengths.
2014-03-20T14:22:00.203382+00:00 heroku[router]: at=error code=H25 desc="HTTP restriction: invalid content length" method=GET path="/" host=myapp.herokuapp.com request_id=3f336f1a-9be3-4791-afe3-596a1f2a481f fwd="17.17.17.17" dyno=web.1 connect=0 service=1 status=502 bytes=537
Oversized cookies
The cookie in the response will be too large to be used again in a request to the Heroku router or SSL endpoints.
2014-03-20T14:18:57.403882+00:00 heroku[router]: at=error code=H25 desc="HTTP restriction: oversized cookie" method=GET path="/" host=myapp.herokuapp.com request_id=90cfbbd2-0397-4bab-828f-193050a076c4 fwd="17.17.17.17" dyno=web.1 connect=0 service=2 status=502 bytes=537
A single header line is deemed too long (over 512kb) and the response is discarded on purpose.
2014-03-20T14:12:28.555073+00:00 heroku[router]: at=error code=H25 desc="HTTP restriction: oversized header" method=GET path="/" host=myapp.herokuapp.com request_id=ab66646e-84eb-47b8-b3bb-2031ecc1bc2c fwd="17.17.17.17" dyno=web.1 connect=0 service=397 status=502 bytes=542
Oversized status line
The status line is judged too long (8kb) and the response is discarded on purpose.
2014-03-20T13:54:44.423083+00:00 heroku[router]: at=error code=H25 desc="HTTP restriction: oversized status line" method=GET path="/" host=myapp.herokuapp.com request_id=208588ac-1a66-44c1-b665-fe60c596241b fwd="17.17.17.17" dyno=web.1 connect=0 service=3 status=502 bytes=537
H26 — Request Error
This error is logged when a request has been identified as belonging to a specific Heroku application, but cannot be delivered entirely to a dyno due to HTTP protocol errors in the request. Multiple possible causes can be identified in the log message.
The request has an expect header, and its value is not 100-Continue, the only expect value handled by the router. A request with an unsupported expect value is terminated with the status code 417 Expectation Failed.
2014-05-14T17:17:37.456997+00:00 heroku[router]: at=error code=H26 desc="Request Error" cause="unsupported expect header value" method=GET path="/" host=myapp.herokuapp.com request_id=3f336f1a-9be3-4791-afe3-596a1f2a481f fwd="17.17.17.17" dyno= connect= service= status=417 bytes=
The request has an HTTP header with a value that is either impossible to parse, or not handled by the router, such as connection: ,.
2014-05-14T17:17:37.456997+00:00 heroku[router]: at=error code=H26 desc="Request Error" cause="bad header" method=GET path="/" host=myapp.herokuapp.com request_id=3f336f1a-9be3-4791-afe3-596a1f2a481f fwd="17.17.17.17" dyno= connect= service= status=400 bytes=
Bad chunk
The request has a chunked transfer-encoding, but with a chunk that was invalid or couldn’t be parsed correctly. A request with this status code will be interrupted during transfer to the dyno.
2014-05-14T17:17:37.456997+00:00 heroku[router]: at=error code=H26 desc="Request Error" cause="bad chunk" method=GET path="/" host=myapp.herokuapp.com request_id=3f336f1a-9be3-4791-afe3-596a1f2a481f fwd="17.17.17.17" dyno=web.1 connect=1 service=0 status=400 bytes=537
H27 — Client Request Interrupted
The client socket was closed either in the middle of the request or before a response could be returned. For example, the client closed their browser session before the request was able to complete.
2010-10-06T21:51:37-07:00 heroku[router]: sock=client at=warning code=H27 desc="Client Request Interrupted" method=POST path="/submit/" host=myapp.herokuapp.com fwd=17.17.17.17 dyno=web.1 connect=1ms service=0ms status=499 bytes=0
H28 — Client Connection Idle
The client did not send a full request and was terminated due to 55 seconds of inactivity. For example, the client indicated a Content-Length of 50 bytes which were not sent in time.
2010-10-06T21:51:37-07:00 heroku[router]: at=warning code=H28 desc="Client Connection Idle" method=GET path="/" host=myapp.herokuapp.com fwd=17.17.17.17 dyno=web.1 connect=1ms service=55449ms status=499 bytes=18
H31 — Misdirected Request
The client sent a request to the wrong endpoint. This could be because the client used stale DNS information or is accessing the app through a CDN that has stale DNS information. Verify that DNS is correctly configured for your app. If a CDN is configured for the app, consider contacting your CDN provider.
If you and your app users can successfully access the app in a browser (or however the app is used), this may not be cause for concern. The errors may be caused by clients (typically web-crawlers) with cached DNS entries trying to access a now-invalid endpoint or IP address for your app.
You can verify the validity of user agent through the app log error message as shown in the example below:
error code=H31 desc="Misdirected Request" method=GET path="/" host=[host.com] request_id=[guid] fwd="[IP]" dyno= connect= service= status=421 bytes= protocol=http agent="<agent>"
H80 — Maintenance mode
This is not an error, but we give it a code for the sake of completeness. Note the log formatting is the same but without the word “Error”.
2010-10-06T21:51:07-07:00 heroku[router]: at=info code=H80 desc="Maintenance mode" method=GET path="/" host=myapp.herokuapp.com fwd=17.17.17.17 dyno= connect= service= status=503 bytes=
H81 — Blank app
No code has been pushed to this application. To get rid of this message you need to do one deploy. This is not an error, but we give it a code for the sake of completeness.
2010-10-06T21:51:07-07:00 heroku[router]: at=info code=H81 desc="Blank app" method=GET path="/" host=myapp.herokuapp.com fwd=17.17.17.17 dyno= connect= service= status=503 bytes=
H82 — You’ve used up your dyno hour pool
This error indicates that an account has exhausted its monthly dyno hour quota for Free or Eco dynos and its apps running these dynos are sleeping. You can view your app’s Free or Eco dyno usage in the Heroku dashboard.
2015-10-06T21:51:07-07:00 heroku[router]: at=info code=H82 desc="You've used up your dyno hour pool" method=GET path="/" host=myapp.herokuapp.com fwd=17.17.17.17 dyno= connect= service= status=503 bytes=
H83 — Planned Service Degradation
This indicates that your app is temporarily unavailable as Heroku makes necessary changes to support the retirement of a feature that has reached end of life. You will likely encounter an error screen when attempting to access your application and see the error below in your logs. Please reference the Heroku Changelog and the Heroku Status page for more details and the timeline of the planned service outage.
2021-10-10T21:51:07-07:00 heroku[router]: at=info code=H83 desc="Service Degradation" method=GET path="/" host=myapp.herokuapp.com fwd=17.17.17.17 dyno= connect= service= status=503 bytes=
H99 — Platform error
H99 and R99 are the only error codes that represent errors in the Heroku platform.
This indicates an internal error in the Heroku platform. Unlike all of the other errors which will require action from you to correct, this one does not require action from you. Try again in a minute, or check the status site.
2010-10-06T21:51:07-07:00 heroku[router]: at=error code=H99 desc="Platform error" method=GET path="/" host=myapp.herokuapp.com fwd=17.17.17.17 dyno= connect= service= status=503 bytes=
R10 — Boot timeout
A web process took longer than 60 seconds to bind to its assigned $PORT. When this happens, the dyno’s process is killed and the dyno is considered crashed. Crashed dynos are restarted according to the dyno manager’s restart policy.
2011-05-03T17:31:38+00:00 heroku[web.1]: State changed from created to starting
2011-05-03T17:31:40+00:00 heroku[web.1]: Starting process with command: `bundle exec rails server -p 22020 -e production`
2011-05-03T17:32:40+00:00 heroku[web.1]: Error R10 (Boot timeout) -> Web process failed to bind to $PORT within 60 seconds of launch
2011-05-03T17:32:40+00:00 heroku[web.1]: Stopping process with SIGKILL
2011-05-03T17:32:40+00:00 heroku[web.1]: Process exited
2011-05-03T17:32:41+00:00 heroku[web.1]: State changed from starting to crashed
This error is often caused by a process being unable to reach an external resource, such as a database, or the application doing too much work, such as parsing and evaluating numerous, large code dependencies, during startup.
Common solutions are to access external resources asynchronously, so they don’t block startup, and to reduce the amount of application code or its dependencies.
If your application requires more time to boot, you may use the boot timeout tool to increase the limit. However, in general, slow boot times will make it harder to deploy your application and will make recovery from dyno failures slower, so this should be considered a temporary solution.
One exception is for apps using the Java buildpack, Gradle buildpack, heroku-deploy toolbelt plugin, or Heroku Maven plugin, which will be allowed 90 seconds to bind to their assigned port.
R12 — Exit timeout
A process failed to exit within 30 seconds of being sent a SIGTERM indicating that it should stop. The process is sent SIGKILL to force an exit.
2011-05-03T17:40:10+00:00 app[worker.1]: Working
2011-05-03T17:40:11+00:00 heroku[worker.1]: Stopping process with SIGTERM
2011-05-03T17:40:11+00:00 app[worker.1]: Ignoring SIGTERM
2011-05-03T17:40:14+00:00 app[worker.1]: Working
2011-05-03T17:40:18+00:00 app[worker.1]: Working
2011-05-03T17:40:21+00:00 heroku[worker.1]: Error R12 (Exit timeout) -> Process failed to exit within 30 seconds of SIGTERM
2011-05-03T17:40:21+00:00 heroku[worker.1]: Stopping process with SIGKILL
2011-05-03T17:40:21+00:00 heroku[worker.1]: Process exited
R13 — Attach error
A dyno started with heroku run failed to attach to the invoking client.
2011-06-29T02:13:29+00:00 app[run.3]: Awaiting client
2011-06-29T02:13:30+00:00 heroku[run.3]: State changed from starting to up
2011-06-29T02:13:59+00:00 app[run.3]: Error R13 (Attach error) -> Failed to attach to process
2011-06-29T02:13:59+00:00 heroku[run.3]: Process exited
R14 — Memory quota exceeded
A dyno requires memory in excess of its quota. If this error occurs, the dyno will page to swap space to continue running, which may cause degraded process performance. The R14 error is calculated by total memory swap, rss and cache.
2011-05-03T17:40:10+00:00 app[worker.1]: Working
2011-05-03T17:40:10+00:00 heroku[worker.1]: Process running mem=1028MB(103.3%)
2011-05-03T17:40:11+00:00 heroku[worker.1]: Error R14 (Memory quota exceeded)
2011-05-03T17:41:52+00:00 app[worker.1]: Working
If you are getting a large number of R14 errors, your application performance is likely severely degraded. Resolving R14 memory errors are language specific:
- R14 — Memory Quota Exceeded in Ruby (MRI)
- Troubleshooting Memory Issues in Java Applications
- Troubleshooting Node.js Memory Use
R15 — Memory quota vastly exceeded
A dyno requires vastly more memory than its quota and is consuming excessive swap space. If this error occurs, the dyno will be forcibly killed with SIGKILL (which cannot be caught or handled) by the platform. The R15 error is calculated by total memory swap and rss; cache is not included.
2011-05-03T17:40:10+00:00 app[worker.1]: Working
2011-05-03T17:40:10+00:00 heroku[worker.1]: Process running mem=1029MB(201.0%)
2011-05-03T17:40:11+00:00 heroku[worker.1]: Error R15 (Memory quota vastly exceeded)
2011-05-03T17:40:11+00:00 heroku[worker.1]: Stopping process with SIGKILL
2011-05-03T17:40:12+00:00 heroku[worker.1]: Process exited
In Private Spaces, dynos exceeding their memory quota do not use swap space and thus do not emit R14 errors.
Private Space dynos vastly exceeding their memory quota generally will emit R15 errors but occasionally the platform may shut down the dyno before the R15 is sent, causing the error to be dropped. If an R15 is emitted it will only be visible in the app log stream but not in the dashboard Application Metrics interface. Other non-R15 types of errors from Private Space dynos are correctly surfaced in the Application Metrics interface.
For Private Space dynos vastly exceeding their memory quota the platform kills dyno processes consuming large amounts of memory, but may not kill the dyno itself.
R16 — Detached
An attached dyno is continuing to run after being sent SIGHUP when its external connection was closed. This is usually a mistake, though some apps might want to do this intentionally.
2011-05-03T17:32:03+00:00 heroku[run.1]: Awaiting client
2011-05-03T17:32:03+00:00 heroku[run.1]: Starting process with command `bash`
2011-05-03T17:40:11+00:00 heroku[run.1]: Client connection closed. Sending SIGHUP to all processes
2011-05-03T17:40:16+00:00 heroku[run.1]: Client connection closed. Sending SIGHUP to all processes
2011-05-03T17:40:21+00:00 heroku[run.1]: Client connection closed. Sending SIGHUP to all processes
2011-05-03T17:40:26+00:00 heroku[run.1]: Error R16 (Detached) -> An attached process is not responding to SIGHUP after its external connection was closed.
R17 — Checksum error
This indicates an error with runtime slug checksum verification. If the checksum does not match or there is another problem with the checksum when launch a dyno, an R17 error will occur and the dyno will fail to launch. Check the log stream for details about the error.
2016-08-16T12:39:56.439438+00:00 heroku[web.1]: State changed from provisioning to starting
2016-08-16T12:39:57.110759+00:00 heroku[web.1]: Error R17 (Checksum error) -> Checksum does match expected value. Expected: SHA256:ed5718e83475c780145609cbb2e4f77ec8076f6f59ebc8a916fb790fbdb1ae64 Actual: SHA256:9ca15af16e06625dfd123ebc3472afb0c5091645512b31ac3dd355f0d8cc42c1
2016-08-16T12:39:57.212053+00:00 heroku[web.1]: State changed from starting to crashed
If this error occurs, try deploying a new release with a correct checksum or rolling back to an older release. Ensure the checksum is formatted and calculated correctly with the SHA256 algorithm. The checksum must start with SHA256: followed by the calculated SHA256 value for the compressed slug. If you did not manually calculate the checksum and error continues to occur, please contact Heroku support.
R99 — Platform error
R99 and H99 are the only error codes that represent errors in the Heroku platform.
This indicates an internal error in the Heroku platform. Unlike all of the other errors which will require action from you to correct, this one does not require action from you. Try again in a minute, or check the status site.
L10 — Drain buffer overflow
2013-04-17T19:04:46+00:00 d.1234-drain-identifier-567 heroku logplex - - Error L10 (output buffer overflow): 500 messages dropped since 2013-04-17T19:04:46+00:00.
The number of log messages being generated has temporarily exceeded the rate at which they can be received by a drain consumer (such as a log management add-on) and Logplex, Heroku’s logging system, has discarded some messages in order to handle the rate difference.
A common cause of L10 error messages is the exhaustion of capacity in a log consumer. If a log management add-on or similar system can only accept so many messages per time period, your application may experience L10s after crossing that threshold.
Another common cause of L10 error messages is a sudden burst of log messages from a dyno. As each line of dyno output (e.g. a line of a stack trace) is a single log message, and Logplex limits the total number of un-transmitted log messages it will keep in memory to 1024 messages, a burst of lines from a dyno can overflow buffers in Logplex. In order to allow the log stream to catch up, Logplex will discard messages where necessary, keeping newer messages in favor of older ones.
You may need to investigate reducing the volume of log lines output by your application (e.g. condense multiple log lines into a smaller, single-line entry). You can also use the heroku logs -t command to get a live feed of logs and find out where your problem might be. A single dyno stuck in a loop that generates log messages can force an L10 error, as can a problematic code path that causes all dynos to generate a multi-line stack trace for some code paths.
L11 — Tail buffer overflow
A heroku logs –tail session cannot keep up with the volume of logs generated by the application or log channel, and Logplex has discarded some log lines necessary to catch up. To avoid this error you will need run the command on a faster internet connection (increase the rate at which you can receive logs) or you will need to modify your application to reduce the logging volume (decrease the rate at which logs are generated).
2011-05-03T17:40:10+00:00 heroku[logplex]: L11 (Tail buffer overflow) -> This tail session dropped 1101 messages since 2011-05-03T17:35:00+00:00
L12 — Local buffer overflow
The application is producing logs faster than the local delivery process (log-shuttle) can deliver them to logplex and has discarded some log lines in order to keep up. If this error is sustained you will need to reduce the logging volume of your application.
2013-11-04T21:31:32.125756+00:00 app[log-shuttle]: Error L12: 222 messages dropped since 2013-11-04T21:31:32.125756+00:00.
L13 — Local delivery error
The local log delivery process (log-shuttle) was unable to deliver some logs to Logplex and has discarded them. This can happen during transient network errors or during logplex service degradation. If this error is sustained please contact support.
2013-11-04T21:31:32.125756+00:00 app[log-shuttle]: Error L13: 111 messages lost since 2013-11-04T21:31:32.125756+00:00.
L14 — Certificate validation error
The application is configured with a TLS syslog drain that doesn’t have a valid TLS certificate.
You should check that:
- You’re not using a self-signed certificate.
- The certificate is up to date.
- The certificate is signed by a known and trusted CA.
- The CN hostname embedded in the certificate matches the hostname being connected to.
2015-09-04T23:28:48+00:00 heroku[logplex]: Error L14 (certificate validation): error="bad certificate" uri="syslog+tls://logs.example.com:6514/"
L15 — Tail buffer temporarily unavailable
The tail buffer that stores the last 1500 lines of your logs is temporarily unavailable. Run heroku logs again. If you still encounter the error, run heroku logs -t to stream your logs (which does not use the tail buffer).
Используя react-boilerplate собрал прогу. С ней проблем нет, она запускается и работает. Задеплоил на Хероку, без каких-либо видимых проблем. Но получил Application error. Ниже лог после деплоя
spoiler
Node.js app detected
   Creating runtime environment

   NPM_CONFIG_LOGLEVEL=error
   NODE_VERBOSE=false
   NODE_ENV=production
   NODE_MODULES_CACHE=true
   Installing binaries
   engines.node (package.json):  >=5
   engines.npm (package.json):   >=3

   Resolving node version >=5...
   Downloading and installing node 10.1.0...
   Bootstrapping npm >=3 (replacing 5.6.0)...
   npm 6.0.1 installed
   Restoring cache
   Loading 2 from cacheDirectories (default):
   - node_modules
   - bower_components (not cached - skipping)
   Building dependencies
   Installing node modules (package.json + package-lock)

   > react-boilerplate@3.5.0 preinstall /tmp/build_230c7b1d6b919fe2d3adb3c6e7724ba0
   > npm run npmcheckversion


   > react-boilerplate@3.5.0 npmcheckversion /tmp/build_230c7b1d6b919fe2d3adb3c6e7724ba0
   > node ./internals/scripts/npmcheckversion.js


   > react-boilerplate@3.5.0 postinstall /tmp/build_230c7b1d6b919fe2d3adb3c6e7724ba0
   > npm run build:dll


   > react-boilerplate@3.5.0 build:dll /tmp/build_230c7b1d6b919fe2d3adb3c6e7724ba0
   > node ./internals/scripts/dependencies.js

   up to date in 17.48s
   [!] 467 vulnerabilities found [26996 packages audited]
   Severity: 418 Low | 46 Moderate | 3 High
   Run `npm audit` for more detail

   Running heroku-postbuild

   > react-boilerplate@3.5.0 heroku-postbuild /tmp/build_230c7b1d6b919fe2d3adb3c6e7724ba0
   > npm run build


   > react-boilerplate@3.5.0 prebuild /tmp/build_230c7b1d6b919fe2d3adb3c6e7724ba0
   > npm run build:clean


   > react-boilerplate@3.5.0 build:clean /tmp/build_230c7b1d6b919fe2d3adb3c6e7724ba0
   > rimraf ./build


   > react-boilerplate@3.5.0 build /tmp/build_230c7b1d6b919fe2d3adb3c6e7724ba0
   > cross-env NODE_ENV=production webpack --config internals/webpack/webpack.prod.babel.js --color -p --progress --hide-modules --display-optimization-bailout

   Hash: 0eb898bf6ee4193afaf8
   Version: webpack 3.5.5
   Time: 12067ms
   Asset       Size  Chunks             Chunk Names
   main.6fc0e199fe5ea4638163.js     496 kB       0  [emitted]  main
   index.html  799 bytes          [emitted]
   sw.js    16.3 kB          [emitted]

   WARNING in OfflinePlugin: Cache pattern [*.chunk.js] did not match any assets
   Child html-webpack-plugin for "index.html":
   1 asset
   Child __offline_serviceworker:
   1 asset
   Caching build
   Clearing previous node cache
   Saving 2 cacheDirectories (default):
   - node_modules
   - bower_components (nothing to cache)
   Pruning devDependencies

   > pre-commit@1.2.2 uninstall node_modules/pre-commit
   > node uninstall.js

   removed 1491 packages in 17.153s
   [!] 12 vulnerabilities found [601 packages audited]
   Severity: 7 Low | 2 Moderate | 3 High
   Run `npm audit` for more detail

   Build succeeded!
   Discovering process types
   Procfile declares types     -> (none)
   Default types for buildpack -> web
   Compressing...
   Done: 30.2M
   Launching...
   Released v9
   https://todotest1991.herokuapp.com/ deployed to Heroku
Решил проверить через командную строку heroku logs —tail —app MyApp, на выходе получил следующее
spoiler
Starting process with command `npm start`
react-boilerplate@3.5.0 start /app
cross-env NODE_ENV=development no
de server
internal/modules/cjs/loader.js:573
throw err;
^
Error: Cannot find module 'glob'
at Function.Module._resolveFilename
(internal/modules/cjs/loader.js:571:15)
at Function.Module._load (internal/modules/cjs/loader.js:497:25)
at Module.require (internal/modules/cjs/loader.js:626:17)
at require (internal/modules/cjs/helpers.js:20:18)
at Object.<anonymous> (/app/internals/webpack/webpack.dev.babel.js:7:14)
at Module._compile (internal/modules/cjs/loader.js:678:30)
at Object.Module._extensions..js (internal/modules/cjs/loader.js:689:10)
at Module.load (internal/modules/cjs/loader.js:589:32)
at tryModuleLoad (internal/modules/cjs/loader.js:528:12)
at Function.Module._load (internal/modules/cjs/loader.js:520:3)
npm ERR! code ELIFECYCLE
npm ERR! errno 1
npm ERR! react-boilerplate@3.5.0 start: `cross-env NODE_ENV=development node
server`
npm ERR! Exit status 1
npm ERR! Failed at the react-boilerplate@3.5.0 start script.
npm ERR! This is probably not a problem with npm. There is likely
additional logging output above.
npm ERR!

npm ERR!     /app/.npm/_logs/2018-05-15T07_30_12_052Z-debug.log
npm ERR! A complete log of this run
can be found in:
State changed from starting to crashed
Process exited with status 1
heroku[web.1]: Process exited with status 1
heroku[router]: at=error code=H10 desc="App cra
shed" method=GET path="/" host=fast-lake-29656.herokuapp.com
request_id=6794d470
-6b00-4ed2-8f5e-892e6ade5891 fwd="145.255.9.159" dyno= connect= service=
status=
503 bytes= protocol=https
heroku[router]: at=error code=H10 desc="App cra
shed" method=GET path="/favicon.ico" host=fast-lake-29656.herokuapp.com
 request_
 id=15da6f9b-2abd-414d-88cb-849d4fd9eeec fwd="145.255.9.159" dyno= connect=
service= status=503 bytes= protocol=https
Он пишет что не может найти модуль glob, но я хз почему, т.к на локалхосте он работает без ошибок. Если нужна еще какая-либо инфа, скажите я предоставлю.
На всякий случай прикладываю, код с гитхаб.
Github
Update:
Как ниже посоветовали, я сделал следующее.
Исправил как и говорилось скрипт
"start": "cross-env NODE_ENV=production node server",
Далее сделал этоheroku config:set NPM_CONFIG_PRODUCTION=false
Далее тест командой heroku logs --tail --app fast-lake-29656
В итоге получил следующее:
Что я не понял, так это почему он 2 раза пытался cross-env NODE_ENV=development node server", запустить, и ток на 3 раз сделал как надо. И еще не ясно, откуда он захотел увидеть build в папке app, если по стандарту он сохранился на 1 уровне с ним(npm run build).
I am trying to setup a Strapi application using MongoDB and PostGres SQL. I have created a local strapi project using MongoDB and it works fine but when i follow the deployment instructions the application fails. Here’s the heroku log.
2019-10-23T09:19:15.852272+00:00 app[web.1]: at Object.get (/app/node_modules/strapi/lib/core/store.js:55:47)
2019-10-23T09:19:15.852275+00:00 app[web.1]: at module.exports (/app/plugins/content-manager/config/functions/bootstrap.js:312:42)
2019-10-23T09:19:15.852277+00:00 app[web.1]: at /app/node_modules/strapi/lib/Strapi.js:299:13
2019-10-23T09:19:15.85228+00:00 app[web.1]: at new Promise (<anonymous>)
2019-10-23T09:19:15.852282+00:00 app[web.1]: at execBootstrap (/app/node_modules/strapi/lib/Strapi.js:287:11)
2019-10-23T09:19:15.852284+00:00 app[web.1]: at /app/node_modules/strapi/lib/Strapi.js:326:44
2019-10-23T09:19:15.852286+00:00 app[web.1]: at Array.map (<anonymous>)
2019-10-23T09:19:15.852288+00:00 app[web.1]: at Strapi.bootstrap (/app/node_modules/strapi/lib/Strapi.js:326:35)
2019-10-23T09:19:15.85229+00:00 app[web.1]: at Strapi.start (/app/node_modules/strapi/lib/Strapi.js:109:18)
2019-10-23T09:19:15.853628+00:00 app[web.1]: (node:23) UnhandledPromiseRejectionWarning: TypeError: strapi.models.core_store.forge is not a function
2019-10-23T09:19:15.853632+00:00 app[web.1]: at Object.get (/app/node_modules/strapi/lib/core/store.js:55:47)
2019-10-23T09:19:15.853634+00:00 app[web.1]: at module.exports (/app/plugins/settings-manager/config/functions/bootstrap.js:17:26)
2019-10-23T09:19:15.853636+00:00 app[web.1]: at /app/node_modules/strapi/lib/Strapi.js:299:13
2019-10-23T09:19:15.853638+00:00 app[web.1]: at new Promise (<anonymous>)
2019-10-23T09:19:15.85364+00:00 app[web.1]: at execBootstrap (/app/node_modules/strapi/lib/Strapi.js:287:11)
2019-10-23T09:19:15.853642+00:00 app[web.1]: at /app/node_modules/strapi/lib/Strapi.js:326:44
2019-10-23T09:19:15.853644+00:00 app[web.1]: at Array.map (<anonymous>)
2019-10-23T09:19:15.853646+00:00 app[web.1]: at Strapi.bootstrap (/app/node_modules/strapi/lib/Strapi.js:326:35)
2019-10-23T09:19:15.853648+00:00 app[web.1]: at Strapi.start (/app/node_modules/strapi/lib/Strapi.js:109:18)
2019-10-23T09:19:15.853705+00:00 app[web.1]: (node:23) UnhandledPromiseRejectionWarning: Unhandled promise rejection. This error originated either by throwing inside of an async function without a catch block, or by rejecting a promise which was not handled with .catch(). (rejection id: 4)
2019-10-23T09:19:15.853792+00:00 app[web.1]: (node:23) [DEP0018] DeprecationWarning: Unhandled promise rejections are deprecated. In the future, promise rejections that are not handled will terminate the Node.js process with a non-zero exit code.
2019-10-23T09:19:15.853847+00:00 app[web.1]: (node:23) UnhandledPromiseRejectionWarning: TypeError: strapi.models.core_store.forge is not a function
2019-10-23T09:19:15.853851+00:00 app[web.1]: at Object.get (/app/node_modules/strapi/lib/core/store.js:55:47)
2019-10-23T09:19:15.853853+00:00 app[web.1]: at module.exports (/app/plugins/users-permissions/config/functions/bootstrap.js:96:45)
2019-10-23T09:19:15.853856+00:00 app[web.1]: at /app/node_modules/strapi/lib/Strapi.js:299:13
2019-10-23T09:19:15.853858+00:00 app[web.1]: at new Promise (<anonymous>)
2019-10-23T09:19:15.85386+00:00 app[web.1]: at execBootstrap (/app/node_modules/strapi/lib/Strapi.js:287:11)
2019-10-23T09:19:15.853862+00:00 app[web.1]: at /app/node_modules/strapi/lib/Strapi.js:326:44
2019-10-23T09:19:15.853865+00:00 app[web.1]: at Array.map (<anonymous>)
2019-10-23T09:19:15.853867+00:00 app[web.1]: at Strapi.bootstrap (/app/node_modules/strapi/lib/Strapi.js:326:35)
2019-10-23T09:19:15.853869+00:00 app[web.1]: at Strapi.start (/app/node_modules/strapi/lib/Strapi.js:109:18)
2019-10-23T09:19:15.853918+00:00 app[web.1]: (node:23) UnhandledPromiseRejectionWarning: Unhandled promise rejection. This error originated either by throwing inside of an async function without a catch block, or by rejecting a promise which was not handled with .catch(). (rejection id: 5)
2019-10-23T09:19:15.87059+00:00 app[web.1]: (node:23) UnhandledPromiseRejectionWarning: ReferenceError: config is not defined
2019-10-23T09:19:15.870594+00:00 app[web.1]: at /app/plugins/email/config/functions/bootstrap.js:68:40
2019-10-23T09:19:15.870672+00:00 app[web.1]: (node:23) UnhandledPromiseRejectionWarning: Unhandled promise rejection. This error originated either by throwing inside of an async function without a catch block, or by rejecting a promise which was not handled with .catch(). (rejection id: 7)
2019-10-23T09:19:15.872961+00:00 app[web.1]: (node:23) UnhandledPromiseRejectionWarning: ReferenceError: config is not defined
2019-10-23T09:19:15.872974+00:00 app[web.1]: at /app/plugins/upload/config/functions/bootstrap.js:70:40
2019-10-23T09:19:15.873032+00:00 app[web.1]: (node:23) UnhandledPromiseRejectionWarning: Unhandled promise rejection. This error originated either by throwing inside of an async function without a catch block, or by rejecting a promise which was not handled with .catch(). (rejection id: 9)
2019-10-23T09:19:19.34799+00:00 app[web.1]: [2019-10-23T09:19:19.347Z] warn Bootstrap is taking unusually long to execute its callback 3500 miliseconds).
2019-10-23T09:19:19.348211+00:00 app[web.1]: [2019-10-23T09:19:19.348Z] warn Perhaps you forgot to call it?
2019-10-23T09:19:19.348498+00:00 app[web.1]: [2019-10-23T09:19:19.348Z] warn Bootstrap is taking unusually long to execute its callback 3500 miliseconds).
2019-10-23T09:19:19.348768+00:00 app[web.1]: [2019-10-23T09:19:19.348Z] warn Perhaps you forgot to call it?
2019-10-23T09:19:19.349076+00:00 app[web.1]: [2019-10-23T09:19:19.349Z] warn Bootstrap is taking unusually long to execute its callback 3500 miliseconds).
2019-10-23T09:19:19.349318+00:00 app[web.1]: [2019-10-23T09:19:19.349Z] warn Perhaps you forgot to call it?
2019-10-23T09:19:19.349573+00:00 app[web.1]: [2019-10-23T09:19:19.349Z] warn Bootstrap is taking unusually long to execute its callback 3500 miliseconds).
2019-10-23T09:19:19.349869+00:00 app[web.1]: [2019-10-23T09:19:19.349Z] warn Perhaps you forgot to call it?
2019-10-23T09:19:27.92488+00:00 heroku[router]: at=error code=H20 desc="App boot timeout" method=GET path="/" host=axiscms.herokuapp.com request_id=ef45bea5-74a1-47da-8865-a23405f6b723 fwd="43.245.11.122" dyno= connect= service= status=503 bytes= protocol=https
2019-10-23T09:20:11.03839+00:00 heroku[web.1]: Error R10 (Boot timeout) -> Web process failed to bind to $PORT within 60 seconds of launch
2019-10-23T09:20:11.062476+00:00 heroku[web.1]: Stopping process with SIGKILL
2019-10-23T09:20:11.157633+00:00 heroku[web.1]: Process exited with status 137
2019-10-23T09:20:11.206006+00:00 heroku[web.1]: State changed from starting to crashed
2019-10-23T09:20:14.378667+00:00 heroku[router]: at=error code=H10 desc="App crashed" method=GET path="/" host=axiscms.herokuapp.com request_id=4e7f4266-f110-4dc2-8845-bdf1809401e8 fwd="43.245.11.122" dyno= connect= service= status=503 bytes= protocol=https
2019-10-23T09:20:19.845791+00:00 heroku[router]: at=error code=H10 desc="App crashed" method=GET path="/" host=axiscms.herokuapp.com request_id=8be3cc76-f7c9-44d6-8c38-968b9d16c8f0 fwd="43.245.11.122" dyno= connect= service= status=503 bytes= protocol=https
2019-10-23T09:20:21.444922+00:00 heroku[router]: at=error code=H10 desc="App crashed" method=GET path="/favicon.ico" host=axiscms.herokuapp.com request_id=f4745e6d-7fce-4f95-a144-c63ec099edff fwd="43.245.11.122" dyno= connect= service= status=503 bytes= protocol=https
2019-10-23T09:30:42.415021+00:00 heroku[router]: at=error code=H10 desc="App crashed" method=GET path="/" host=axiscms.herokuapp.com request_id=4a7f8593-40f7-4804-8382-dc867bd70253 fwd="43.245.11.122" dyno= connect= service= status=503 bytes= protocol=https
2019-10-23T09:30:44.36151+00:00 heroku[router]: at=error code=H10 desc="App crashed" method=GET path="/favicon.ico" host=axiscms.herokuapp.com request_id=dd01f943-b8a4-45cd-867e-3ec97c01f73b fwd="43.245.11.122" dyno= connect= service= status=503 bytes= protocol=https
I’ve just completed Chapter 8 of the Hartl Rails Tutorial and wanted to deploy my application onto Heroku.
After running the below code in the Cloud 9 IDE terminal, I kept getting an Application Error page on my Heroku view.
$ bundle exec rake test
$ git push
$ git push heroku
$ heroku run rake db:migrate
Application Error page on Heroku:

After perusing the internet for a solution, I found a YouTube video that explains how to find the errors that could lead to an Application Error. You can view the video here.
On the Application Error page, it says:
If you are the application owner, check your logs for details.
To check your logs, enter this into your terminal:
$ heroku logs --tail
This will be similar to what your logs will look like:
2015-08-11 .. +00:00 heroku[run.8473]: State changed from starting to up
2015-08-11 .. +00:00 heroku[run.8473]: State changed from up to complete
2015-08-11 .. +00:00 heroku[run.8473]: Process exited with status 0
2015-08-11 .. +00:00 heroku[api]: Set maintenance mode off by yourname@email.com
2015-08-11 .. +00:00 heroku[web.1]: Unidling
2015-08-11 .. +00:00 heroku[web.1]: State changed from down to starting
2015-08-11 .. +00:00 heroku[web.1]: Starting process with command `bundle exec puma -C config/puma.rbbu`
2015-08-11 .. +00:00 app[web.1]: /app/vendor/bundle/ruby/2.0.0/gems/puma-2.11.1/lib/puma/configuration.rb:179:in `read': No such file or directory - config/puma.rbbu (Errno::ENOENT)
2015-08-11 .. +00:00 app[web.1]: from /app/vendor/bundle/ruby/2.0.0/gems/puma-2.11.1/lib/puma/configuration.rb:179:in `_load_from'
2015-08-11 .. +00:00 app[web.1]: from /app/vendor/bundle/ruby/2.0.0/gems/puma-2.11.1/lib/puma/configuration.rb:40:in `load'
2015-08-11 .. +00:00 app[web.1]: from /app/vendor/bundle/ruby/2.0.0/gems/puma-2.11.1/lib/puma/cli.rb:308:in `parse_options'
2015-08-11 .. +00:00 app[web.1]: from /app/vendor/bundle/ruby/2.0.0/gems/puma-2.11.1/bin/puma:10:in `<top (required)>'
2015-08-11 .. +00:00 app[web.1]: from /app/vendor/bundle/ruby/2.0.0/gems/puma-2.11.1/lib/puma/cli.rb:453:in `run'
2015-08-11 .. +00:00 app[web.1]: from /app/vendor/bundle/ruby/2.0.0/bin/puma:23:in `load'
2015-08-11 .. +00:00 app[web.1]: from /app/vendor/bundle/ruby/2.0.0/bin/puma:23:in `<main>'
2015-08-11 .. +00:00 heroku[web.1]: State changed from starting to crashed
2015-08-11 .. +00:00 heroku[web.1]: State changed from crashed to starting
2015-08-11 .. +00:00 heroku[web.1]: Process exited with status 1
2015-08-11 .. +00:00 heroku[web.1]: Starting process with command `bundle exec puma -C config/puma.rbbu`
2015-08-11 .. +00:00 app[web.1]: /app/vendor/bundle/ruby/2.0.0/gems/puma-2.11.1/lib/puma/configuration.rb:179:in `read': No such file or directory - config/puma.rbbu (Errno::ENOENT)
2015-08-11 .. +00:00 app[web.1]: from /app/vendor/bundle/ruby/2.0.0/gems/puma-2.11.1/lib/puma/configuration.rb:179:in `_load_from'
2015-08-11 .. +00:00 app[web.1]: from /app/vendor/bundle/ruby/2.0.0/gems/puma-2.11.1/lib/puma/configuration.rb:40:in `load'
2015-08-11 .. +00:00 app[web.1]: from /app/vendor/bundle/ruby/2.0.0/gems/puma-2.11.1/lib/puma/cli.rb:308:in `parse_options'
2015-08-11 .. +00:00 app[web.1]: from /app/vendor/bundle/ruby/2.0.0/gems/puma-2.11.1/lib/puma/cli.rb:453:in `run'
2015-08-11 .. +00:00 app[web.1]: from /app/vendor/bundle/ruby/2.0.0/gems/puma-2.11.1/bin/puma:10:in `<top (required)>'
2015-08-11 .. +00:00 app[web.1]: from /app/vendor/bundle/ruby/2.0.0/bin/puma:23:in `load'
2015-08-11 .. +00:00 app[web.1]: from /app/vendor/bundle/ruby/2.0.0/bin/puma:23:in `<main>'
2015-08-11 .. +00:00 heroku[web.1]: State changed from starting to crashed
2015-08-11 .. +00:00 heroku[web.1]: Process exited with status 1
2015-08-11 .. +00:00 heroku[router]: at=error code=H10 desc="App crashed" method=GET path="/" host=salty-cove-3725.herokuapp.com request_id=fdda059e-0ce2-486a-b855-fedcb612368d
2015-08-11 .. +00:00 heroku[router]: at=error code=H10 desc="App crashed" method=GET path="/favicon.ico" host=salty-cove-3725.herokuapp.com request_id=5e08ce0d-b815-4278-be4c-5e5ce636352d
2015-08-11 .. +00:00 heroku[web.1]: State changed from crashed to starting
2015-08-11 .. +00:00 heroku[web.1]: Starting process with command `bundle exec puma -C config/puma.rbbu`
2015-08-11 .. +00:00 app[web.1]: /app/vendor/bundle/ruby/2.0.0/gems/puma-2.11.1/lib/puma/configuration.rb:179:in `read': No such file or directory - config/puma.rbbu (Errno::ENOENT)
2015-08-11 .. +00:00 app[web.1]: from /app/vendor/bundle/ruby/2.0.0/gems/puma-2.11.1/lib/puma/configuration.rb:179:in `_load_from'
2015-08-11 .. +00:00 app[web.1]: from /app/vendor/bundle/ruby/2.0.0/gems/puma-2.11.1/lib/puma/configuration.rb:40:in `load'
2015-08-11 .. 00:00 app[web.1]: from /app/vendor/bundle/ruby/2.0.0/gems/puma-2.11.1/lib/puma/cli.rb:453:in `run'
2015-08-11 .. +00:00 app[web.1]: from /app/vendor/bundle/ruby/2.0.0/gems/puma-2.11.1/lib/puma/cli.rb:308:in `parse_options'
2015-08-11 .. +00:00 app[web.1]: from /app/vendor/bundle/ruby/2.0.0/gems/puma-2.11.1/bin/puma:10:in `<top (required)>'
2015-08-11 .. +00:00 app[web.1]: from /app/vendor/bundle/ruby/2.0.0/bin/puma:23:in `load'
2015-08-11 .. +00:00 app[web.1]: from /app/vendor/bundle/ruby/2.0.0/bin/puma:23:in `<main>'
2015-08-11 .. +00:00 heroku[web.1]: Process exited with status 1
2015-08-11 .. +00:00 heroku[web.1]: State changed from starting to crashed
2015-08-11 .. +00:00 heroku[router]: at=error code=H10 desc="App crashed" method=GET path="/" host=salty-cove-3725.herokuapp.com request_id=188280eb-4424-4a09-8a77-5d8831450666
2015-08-11 .. +00:00 heroku[router]: at=error code=H10 desc="App crashed" method=GET path="/favicon.ico" host=salty-cove-3725.herokuapp.com request_id=4a0567fe-7819-40da-9aa2-cec5b341d48e
2015-08-11 .. +00:00 heroku[api]: Starting process with command `rails console` by heeycutie@yahoo.com
2015-08-11 .. +00:00 heroku[run.3262]: Awaiting client
2015-08-11 .. +00:00 heroku[run.3262]: Starting process with command `rails console`
2015-08-11 .. +00:00 heroku[run.3262]: State changed from starting to up
2015-08-11 .. +00:00 heroku[run.3262]: State changed from up to complete
2015-08-11 .. +00:00 heroku[run.3262]: Process exited with status 0
Looking through the logs, I found this first problem:
2015-08-11 .. +00:00 app[web.1]: /app/vendor/bundle/ruby/2.0.0/gems/puma-2.11.1/lib/puma/configuration.rb:179:in `read': No such file or directory - config/puma.rbbu (Errno::ENOENT)
It was trying to find a file named puma.rbbu in my /config folder, and the file wasn’t there. To address this, I set out to find the file.
Opening up my /config folder in Cloud 9, I saw that my puma file was named puma.rb, not puma.rbbu. I renamed the puma.rb file extension to puma.rbbu and then pushed the repository up to Heroku again.
This time it worked! My app is online and running here: https://salty-cove-3725.herokuapp.com/
Just a note:
I had my application on Bitbucket in a private repository. I had originally thought this was the reason why I was getting the Application Error page. I moved my Bitbucket repo over to Github into a public repo to test out if this was the case. The Application Error page still showed up. So it doesn’t matter whether your app is public or private. As long as you pushed your project onto Heroku successfully, something else is causing the error.

on
June 18, 2019

If you are hosting your application with Heroku, and find yourself faced with an unexplained error in your live system. What would you do next? Perhaps you don’t have a dedicated DevOps team, so where would you start your investigation? With Scout APM of course! We are going to show you how you can use Scout to find out exactly where the problem lies within your application code. We are going to walk through two of the most common Heroku error codes and show you how to diagnose the problem with Scout quickly and efficiently.
Heroku’s Error Logging System
First of all let’s take a look at how a typical error occurs for Heroku users and then we will look at how we can use Scout to debug the problem. Any errors that occur in Heroku result in an Application error page being displayed to the user with a HTTP 503 status code indicating “service unavailable”. You have probably seen this page many times before if you are a frequent Heroku user.
As a developer, this doesn’t give us much to go on unfortunately. But we can see the specifics of the error, by digging into Heroku’s logging system. We can view these logs on the Activity tab of the Heroku Dashboard or by using the Heroku CLI application:
$ heroku logs --tailHeroku uses the letters H, R and L in its error codes to differentiate between HTTP errors, runtime errors, and logging errors respectively. A full list of all the different types of errors that Heroku reports can be found here. As you can see from the screenshot below, the error being shown by Heroku in this case is a H12 error.

From Error Code to Solution, with Scout
So now that we’ve checked the logs and found out what type of error occurred, we can cross reference this with the Heroku’s documentation and just fix it, right? Well, not really. You see, these error descriptions are a little vague, don’t you think? They clearly tell us what happened but they don’t really tell us why they happened. This is the job of an Application Performance Monitoring (APM) tool like Scout. When you need to know why and where, Scout should be your go-to tool.
Fortunately, the Heroku logs do tell us when the error occurred and what type of error occurred, so now let’s jump into Scout APM and investigate what happened at that time of the error using two common example scenarios.
Example 1 — H12: Request timeout
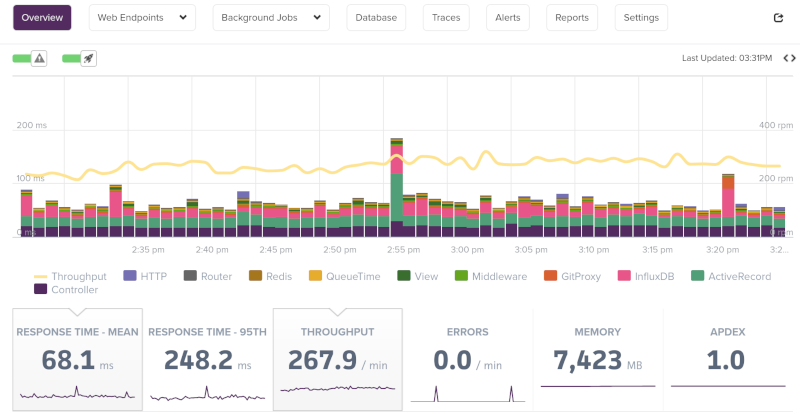
Heroku throws this error when a request takes longer than 30 seconds to complete. In Scout, any request that takes longer than 30 seconds to complete should show up very clearly on the main overview page as a spike in the chart, because this type of response time would be dramatically different from your usual traffic. So that would be the first place to start your investigation.
Once you have found the relevant spike on the chart, drag and drop a box around it, and a handy list of endpoints that occurred within that spike will be presented to you. Pick the endpoint you think is the culprit and then pick a trace on that endpoint which occurred at the same time of the error.
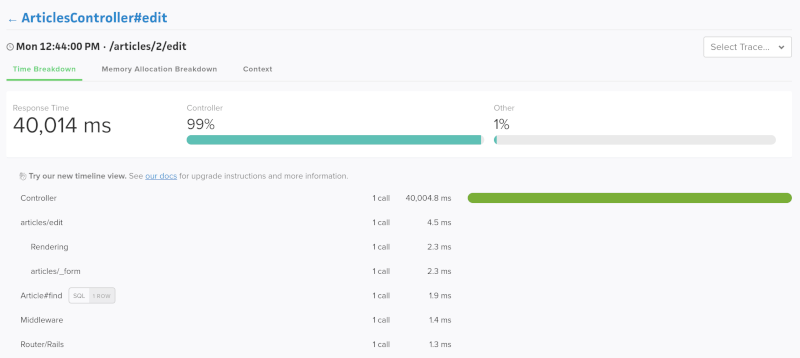
At this point, we can examine the trace and see a breakdown of where time or memory was spent during this trace, organized by layer. For example, we might see that a large portion of time was spent on a database query that originated from a line of code in one or our models, and if that is the case then we can see a backtrace of that query and the line of application code.
But in this specific example below, we can see that a large proportion of the time is actually being spent in the Edit action of the Articles controller. In fact, we can see that it took 40 seconds to process this controller action, and this is the reason that Heroku timed out with a H12 error code.
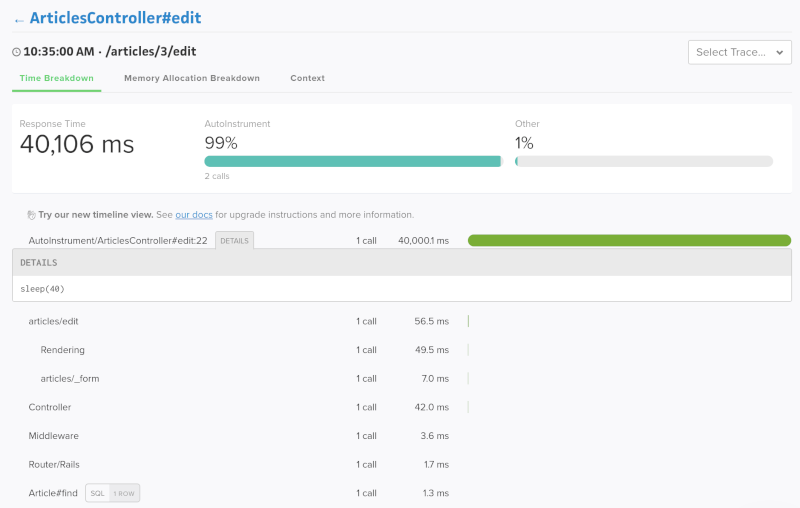
We can debug this particular example even further by enabling the AutoInstrument feature, which further breaks down uninstrumented controller time, line-by-line. Now we can see an exact line of code within our controller and a backtrace which shows where our problem lies. Here we can see that the reason that this application ran for 40 seconds was because of a call to sleep(40) on line 22 of the edit action. Now this line of code was obviously put there just for demonstrative purposes, but it gives you an idea of the level of detail that you can get to when given very little information to go on.
Other ideas for H12 errors
- Have you ever experienced somebody telling you that they have had a timeout error on an endpoint but after accessing the endpoint yourself, everything looks fine? Perhaps you keep seeing this error message intermittently, at certain times of the day or only from certain users, but no matter what you do, you just can’t recreate the problem yourself. Maybe Scout’s traces by context can help you diagnose here.
- The Trace index page allows you to view traces by different criteria, and even by custom context criteria that you can define yourself. For example, you could view all the traces associated with a particular user, or maybe even all users on large pricing plans. Once you have found the offending trace, you can follow similar steps to what we described earlier to get to the root cause.
Example 2 — R14: Memory quota exceeded
Probably the most common Heroku error code you will come across is the R14 “Memory quota exceeded” error. This error (and it’s older brother R15 “Memory quota vastly exceeded”) occur when your application exceeds its server’s allocated amount of memory. The amount of memory your server is allocated depends on which Heroku plan you are on.

When your application runs out of memory and the R14 error occurs, the server will start to page to swap space, and you will start to see a performance slowdown across your entire application. If it continues to increase and reaches 2x your quota then an R15 will occur and your server will be shutdown.
This is a great example of an error message that you might come across but are unable to debug without an APM tool. But fear not because analysing memory bloat is an area where Scout really shines in comparison to its competitors.
The first place that you can look for memory anomalies is on the main overview page of Scout, you can choose to show memory as a sparkline on the graph. In our example shown below, you can see how the memory usage shot upwards rapidly at a certain point in time. Furthermore, our Memory Bloat Insights feature (towards the bottom of the screenshot) identified ArticlesController#index as a potential issue to investigate.
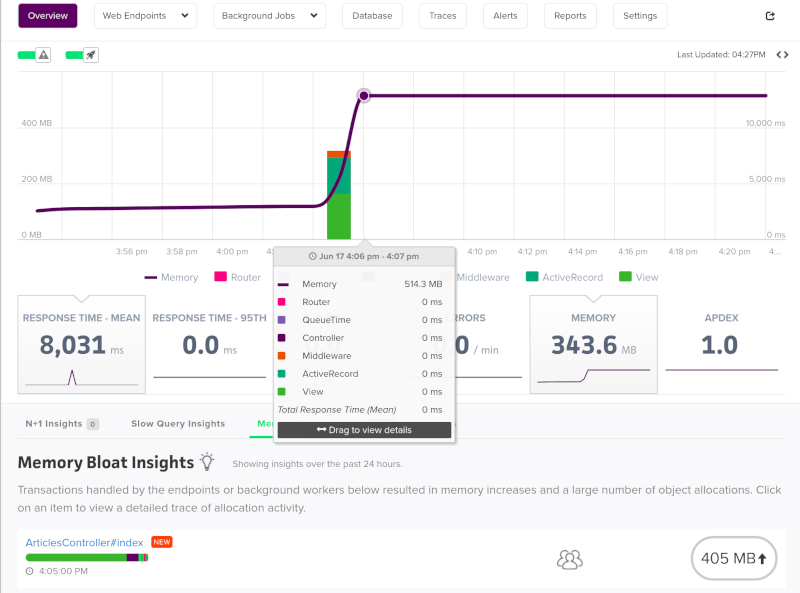
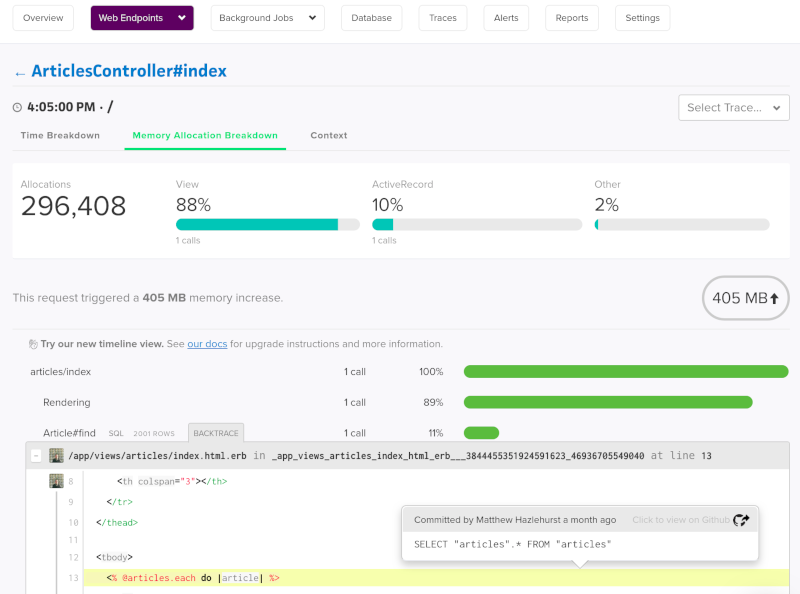
When we take a look at the trace that occurred at this time (shown below), we can clearly see which layers are using all this memory (the View layer). Also we can determine from the backtrace that the cause is that there is no filter or pagination on the query, and so all records are being loaded onto a single page.
Other ideas for R14 errors
- A great example of a hard-to-trackdown memory issue is when only large users are generating R14 errors. In this case, viewing by context on the Traces page will help you find this issue.
- Looking at the Web Endpoints index page, you can filter by Max Allocations to find endpoints using a lot of memory. This gives you a different approach to finding endpoints to investigate rather than using the main overview page’s timeline.
- If you want to read more about the causes of memory bloat, and how you can use Scout to fix memory bloat issues, take a look at this article.
What’s next?
Are you using Heroku and coming across a different sort of Heroku error that we didn’t cover here? Contact us today on support and we’ll show you how to debug the problem with Scout APM! And for reading this far, click on Doggo for some free swag!
Heroku is a fantastic platform for hosting your applications, that’s why it is so popular amongst developers. But it is also clear to see how useful an APM tool is for debugging critical production issues when they arise and overall application performance health monitoring. So definitely sign up for a free trial today if you are not currently using Scout!
I’m trying to open the data collector app on Heroku. So far I’ve been able to attach the postgresql database, successfully build, and deploy the application. However, when I open the application on Heroku I am redirected to the application error page and instructed to check Heroku logs in my terminal.
Here is my app.py code with the URI to my localhost and Heroku postgresql server blocked for security purposes.


Here is the redirected page:

The error I’m getting says:
2020-01-21T20:12:01.811870+00:00 heroku[router]: at=error code=H10 desc=»App crashed» method=GET path=»/» host=metriccollector.herokuapp.com request_id=e2be3305-16db-4442-93f0-82d288604bbf fwd=»161.202.65.101″ dyno= connect= service= status=503 bytes= protocol=https
2020-01-21T20:12:03.907259+00:00 heroku[router]: at=error code=H10 desc=»App crashed» method=GET path=»/favicon.ico» host=metriccollector.herokuapp.com request_id=b8ee663a-7d83-420f-b9d4-f9c85c68bbe3 fwd=»161.202.65.101″ dyno= connect= service= status=503 bytes= protocol=https


I’ve tried deleting the pushed application on Heroku and re-pushed the same application on Heroku. But, I keep receiving the same error. I can’t figure out how to resolve this issue. Please help!