Introduction
While you are learning statistics, you will often have to focus on a sample rather than the entire population. This is because it is extremely costly, difficult and time-consuming to study the entire population. The best you can do is to take a random sample from the population – a sample that is a ‘true’ representative of it. You then carry out some analysis using the sample and make inferences about the population.
Since the inferences are made about the population by studying the sample taken, the results cannot be entirely accurate. The degree of accuracy depends on the sample taken – how the sample was selected, what the sample size is, and other concerns. Common sense would say that if you increase the sample size, the chances of error will be less because you are taking a greater proportion of the population. A larger sample is likely to be a closer representative of the population than a smaller one.
Let’s consider an example. Suppose you want to study the scores obtained in an examination by students in your college. It may be time-consuming for you to study the entire population, i.e. all students in your college. Hence, you take out a sample of, say, 100 students and find out the average scores of those 100 students. This is the sample mean. Now, when you use this sample mean to infer about the population mean, you won’t be able to get the exact population means. There will be some “margin of error”.
You will now learn the answers to some important questions: What is margin of error, what are the method of calculating margins of error, how do you find the critical value, and how to decide on t-score vs z-scores. Thereafter, you’ll be given some margin of error practice problems to make the concepts clearer.
What is Margin of Error?
The margin of error can best be described as the range of values on both sides (above and below) the sample statistic. For example, if the sample average scores of students are 80 and you make a statement that the average scores of students are 80 ± 5, then here 5 is the margin of error.
Calculating Margins of Error
For calculating margins of error, you need to know the critical value and sample standard error. This is because it’s calculated using those two pieces of information.
The formula goes like this:
margin of error = critical value * sample standard error.
How do you find the critical value, and how to calculate the sample standard error? Below, we’ll discuss how to get these two important values.
How do You find the Critical Value?
For finding critical value, you need to know the distribution and the confidence level. For example, suppose you are looking at the sampling distribution of the means. Here are some guidelines.
- If the population standard deviation is known, use z distribution.
- If the population standard deviation is not known, use t distribution where degrees of freedom = n-1 (n is the sample size). Note that for other sampling distributions, degrees of freedom can be different and should be calculated differently using appropriate formula.
- If the sample size is large, then use z distribution (following the logic of Central Limit Theorem).
It is important to know the distribution to decide what to use – t-scores vs z-scores.
Caution – when your sample size is large and it is not given that the distribution is normal, then by Central Limit Theorem, you can say that the distribution is normal and use z-score. However, when the sample size is small and it is not given that the distribution is normal, then you cannot conclude anything about the normality of the distribution and neither z-score nor t-score can be used.
When finding the critical value, confidence level will be given to you. If you are creating a 90% confidence interval, then confidence level is 90%, for 95% confidence interval, the confidence level is 95%, and so on.
Here are the steps for finding critical value:
Step 1: First, find alpha (the level of significance). alpha =1 – Confidence level.
For 95% confidence level, alpha =0.05
For 99% confidence level, alpha =0.01
Step 2: Find the critical probability p*. Critical probability will depend on whether we are creating a one-sided confidence interval or a two-sided confidence interval.
For two-sided confidence interval, p*=1-dfrac { alpha }{ 2 }
For one-sided confidence interval, p*=1-alpha
Then you need to decide on using t-scores vs z-scores. Find a z-score having a cumulative probability of p*. For a t-statistic, find a t-score having a cumulative probability of p* and the calculated degrees of freedom. This will be the critical value. To find these critical values, you should use a calculator or respective statistical tables.
Sample Standard Error
Sample standard error can be calculated using population standard deviation or sample standard deviation (if population standard deviation is not known). For sampling distribution of means:
Let sample standard deviation be denoted by s, population standard deviation is denoted by sigma and sample size be denoted by n.
text {Sample standard error}=dfrac { sigma }{ sqrt { n } }, if sigma is known
text {Sample standard error}=dfrac { s }{ sqrt { n } }, if sigma is not known
Depending on the sampling distributions, the sample standard error can be different.
Having looked at everything that is required to create the margin of error, you can now directly calculate a margin of error using the formula we showed you earlier:
Margin of error = critical value * sample standard error.
Some Relationships
1. Confidence level and marginal of error
As the confidence level increases, the critical value increases and hence the margin of error increases. This is intuitive; the price paid for higher confidence level is that the margin of errors increases. If this was not so, and if higher confidence level meant lower margin of errors, nobody would choose a lower confidence level. There are always trade-offs!
2. Sample standard deviation and margin of error
Sample standard deviation talks about the variability in the sample. The more variability in the sample, the higher the chances of error, the greater the sample standard error and margin of error.
3. Sample size and margin of error
This was discussed in the Introduction section. It is intuitive that a greater sample size will be a closer representative of the population than a smaller sample size. Hence, the larger the sample size, the smaller the sample standard error and therefore the smaller the margin of error.
Margin of Error Practice Problems
Example 1
25 students in their final year were selected at random from a high school for a survey. Among the survey participants, it was found that the average GPA (Grade Point Average) was 2.9 and the standard deviation of GPA was 0.5. What is the margin of error, assuming 95% confidence level? Give correct interpretation.
Step 1: Identify the sample statistic.
Since you need to find the confidence interval for the population mean, the sample statistic is the sample mean which is the average GPA = 2.9.
Step 2: Identify the distribution – t, z, etc. – and find the critical value based on whether you need a one-sided confidence interval or a two-sided confidence interval.
Since population standard deviation is not known and the sample size is small, use a t distribution.
text {Degrees of freedom}=n-1=25-1=24.
alpha=1-text {Confidence level}=1-0.95=0.05
Let the critical probability be p*.
For two-sided confidence interval,
p*=1-dfrac { alpha }{ 2 } =1-dfrac { 0.05 }{ 2 } =0.975.
The critical t value for cumulative probability of 0.975 and 24 degrees of freedom is 2.064.
Step 3: Find the sample standard error.
text{Sample standard error}=dfrac { s }{ sqrt { n } } =dfrac { 0.5 }{ sqrt { 25 } } =0.1
Step 4: Find margin of error using the formula:
Margin of error = critical value * sample standard error
= 2.064 * 0.1 = 0.2064
Interpretation: For a 95% confidence level, the average GPA is going to be 0.2064 points above and below the sample average GPA of 2.9.
Example 2
400 students in Princeton University are randomly selected for a survey which is aimed at finding out the average time students spend in the library in a day. Among the survey participants, it was found that the average time spent in the university library was 45 minutes and the standard deviation was 10 minutes. Assuming 99% confidence level, find the margin of error and give the correct interpretation of it.
Step 1: Identify the sample statistic.
Since you need to find the confidence interval for the population mean, the sample statistic is the sample mean which is the mean time spent in the university library = 45 minutes.
Step 2: Identify the distribution – t, z, etc. and find the critical value based on whether the need is a one-sided confidence interval or a two-sided confidence interval.
The population standard deviation is not known, but the sample size is large. Therefore, use a z (standard normal) distribution.
alpha=1-text{Confidence level}=1-0.99=0.01
Let the critical probability be p*.
For two-sided confidence interval,
p*=1-dfrac { alpha }{ 2 } =1-dfrac { 0.01 }{ 2 } =0.995.
The critical z value for cumulative probability of 0.995 (as found from the z tables) is 2.576.
Step 3: Find the sample standard error.
text{Sample standard error}=dfrac { s }{ sqrt { n } } =dfrac { 10 }{ sqrt { 400 } } =0.5
Step 4: Find margin of error using the formula:
Margin of error = critical value * sample standard error
= 2.576 * 0.5 = 1.288
Interpretation: For a 99% confidence level, the mean time spent in the library is going to be 1.288 minutes above and below the sample mean time spent in the library of 45 minutes.
Example 3
Consider a similar set up in Example 1 with slight changes. You randomly select X students in their final year from a high school for a survey. Among the survey participants, it was found that the average GPA (Grade Point Average) was 3.1 and the standard deviation of GPA was 0.7. What should be the value of X (in other words, how many students you should select for the survey) if you want the margin of error to be at most 0.1? Assume 95% confidence level and normal distribution.
Step 1: Find the critical value.
alpha=1-text{Confidence level}=1-0.95=0.05
Let the critical probability be p*.
For two-sided confidence interval,
p*=1-dfrac { alpha }{ 2 } =1-dfrac { 0.05 }{ 2 } =0.975.
The critical z value for cumulative probability of 0.975 is 1.96.
Step 3: Find the sample standard error in terms of X.
text{Sample standard error}=dfrac { s }{ sqrt { X } }=dfrac { 0.7 }{ sqrt { X } }
Step 4: Find X using margin of error formula:
Margin of error = critical value * sample standard error
0.1=1.96*dfrac { 0.7 }{ sqrt { X } }
This gives X=188.24.
Thus, a sample of 189 students should be taken so that the margin of error is at most 0.1.
Conclusion
The margin of error is an extremely important concept in statistics. This is because it is difficult to study the entire population and the sampling is not free from sampling errors. The margin of error is used to create confidence intervals, and most of the time the results are reported in the form of a confidence interval for a population parameter rather than just a single value. In this article, you made a beginning by learning answering questions like what is margin of error, what is the method of calculating margins of errors, and how to interpret these calculations. You also learned to decide whether to use t-scores vs z-scores and gained information about finding critical values. Now you know how to use margin of error for constructing confidence intervals, which are widely used in statistics and econometrics.
Let’s put everything into practice. Try this Statistics practice question:

Looking for more Statistics practice?
You can find thousands of practice questions on Albert.io. Albert.io lets you customize your learning experience to target practice where you need the most help. We’ll give you challenging practice questions to help you achieve mastery in Statistics.
Start practicing here.
Are you a teacher or administrator interested in boosting Statistics student outcomes?
Learn more about our school licenses here.
If you want to solve some confidence interval problems, you’re in the right place. Our 95% confidence interval calculator will help you calculate this confidence interval and provide you with the essential knowledge! Read on to learn:
- What is the
95%confidence interval formula; - What is the interpretation of the
95%confidence interval (or any chosen one, to be honest); and - What is the p-value for the
95percent confidence interval?
95% confidence interval — formula and interpretation
To calculate a 95% confidence interval, we first need to calculate the standard error. We can use the formula:
SE=σnSE=frac{σ}{sqrt{n}}
where:
- SESE — the standard error;
- σσ — the standard deviation; and
- nn — number of measurements (the size of the sample).
Now let’s estimate the margin of error.
ME=SE×Z(0.95)ME = SE × Z(0.95)
- MEME — margin of error;
- Z(0.95)Z(0.95) — z-score for
95%confidence level; you’ll find this value in the statistical tables.
The only thing left is to count the lower and upper bounds of our confidence interval. To do this, we will add and subtract the margin of error to the mean (average) — μμ.
upper bound=μ+MEtext{upper} text{bound} = μ + ME
lower bound=μ−MEtext{lower} text{bound} = μ — ME
Interpretation of the 95% confidence interval
How should you understand the results? Let’s imagine George wants to calculate the mean height of his family members. Some relatives live very far, and George cannot measure them all. But he managed to get 30 measurements, and the average height of those measurements was 172 cm (5 ft 7 in). He found out, that the 95% confidence interval range is 161-183 cm (5 ft 3 in — 6 ft). Based on those measurements, he can be 95% sure that any family member’s height falls between 162-183 cm.
Using 95% confidence interval calculator
To use our tool:
- Look at the calculator panel on the left side of the screen.
- First, fill in the sample mean (average) — x̅.
- Now, fill in the standard deviation (
s). - Input the sample size (
n). - As it is the
95percent confidence interval calculator, the confidence interval value is already there. But remember — you might change it any time. - The Z-score row will change accordingly to your chosen confidence interval.
- Enjoy the results! You might now see the margin of error, the
95%confidence interval bounds, but also a chart displaying the data.
Confidence interval calculators
FAQ
How do I calculate a 95% confidence interval?
To count the 95% confidence interval:
- First, calculate the standard error (
SE) and the margin of error (ME).
SE = σ/√n
ME = SE × Z(0.95)
where σ is the standard deviation, n — sample size, Z(0.95) — z-score for 95% confidence interval. - Then determine the confidence interval range, using ME and μ — the calculated average (mean).
upper bound = μ + ME
lower bound = μ — ME
What is the p-value at 95 percent confidence interval?
The uncorrected p-value at 95% confidence interval is 0.05.
From Wikipedia, the free encyclopedia
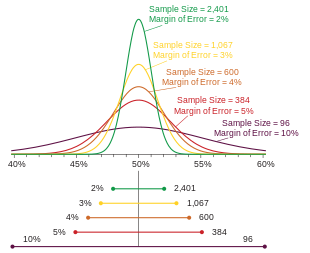
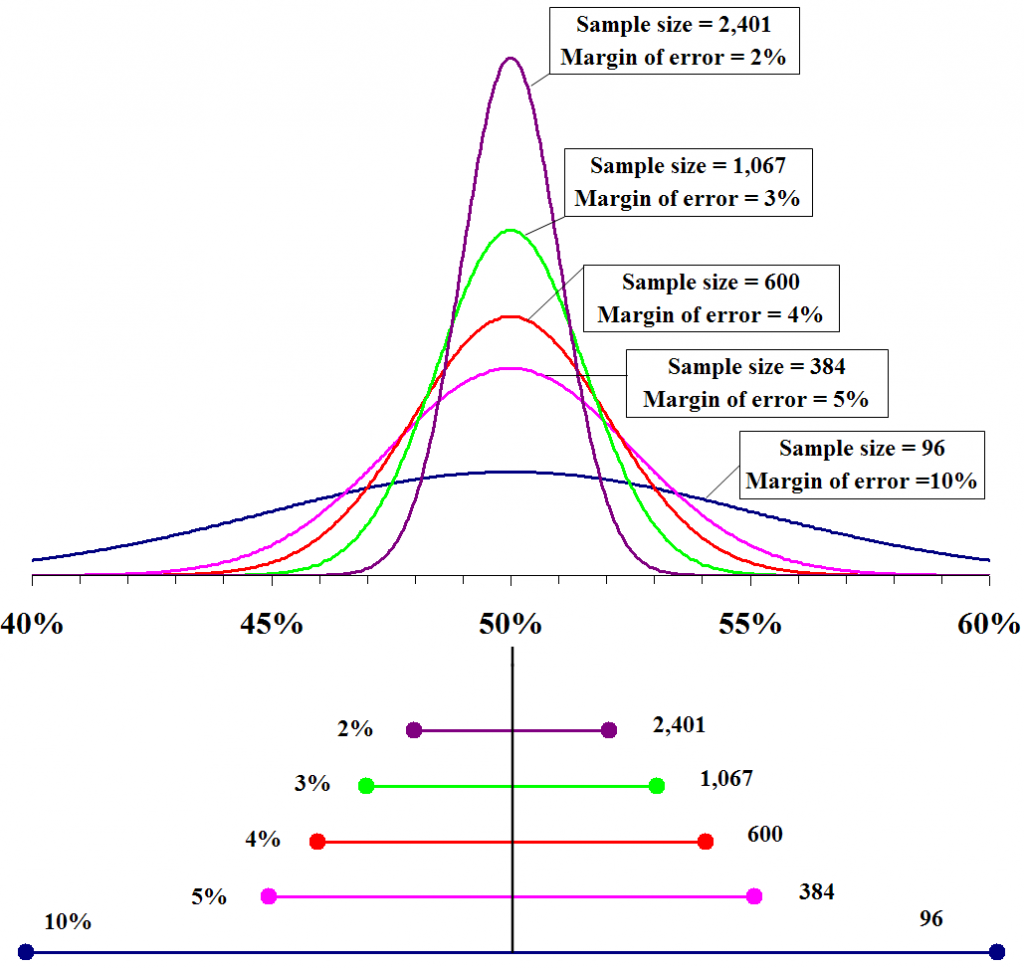
Probability densities of polls of different sizes, each color-coded to its 95% confidence interval (below), margin of error (left), and sample size (right). Each interval reflects the range within which one may have 95% confidence that the true percentage may be found, given a reported percentage of 50%. The margin of error is half the confidence interval (also, the radius of the interval). The larger the sample, the smaller the margin of error. Also, the further from 50% the reported percentage, the smaller the margin of error.
The margin of error is a statistic expressing the amount of random sampling error in the results of a survey. The larger the margin of error, the less confidence one should have that a poll result would reflect the result of a census of the entire population. The margin of error will be positive whenever a population is incompletely sampled and the outcome measure has positive variance, which is to say, the measure varies.
The term margin of error is often used in non-survey contexts to indicate observational error in reporting measured quantities.
Concept[edit]
Consider a simple yes/no poll  as a sample of
  respondents drawn from a population
  reporting the percentage
  of yes responses. We would like to know how close is to the true result of a survey of the entire population
  , without having to conduct one. If, hypothetically, we were to conduct poll over subsequent samples of respondents (newly drawn from ), we would expect those subsequent results
  to be normally distributed about
  . The margin of error describes the distance within which a specified percentage of these results is expected to vary from .
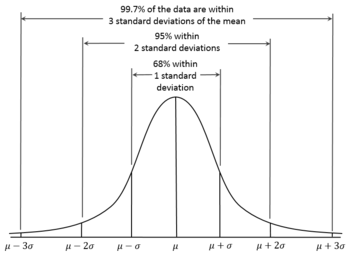
According to the 68-95-99.7 rule, we would expect that 95% of the results will fall within about two standard deviations ( ) either side of the true mean . This interval is called the confidence interval, and the radius (half the interval) is called the margin of error, corresponding to a 95% confidence level.
Generally, at a confidence level  , a sample sized of a population having expected standard deviation
  has a margin of error

where  denotes the quantile (also, commonly, a z-score), and
  is the standard error.
Standard deviation and standard error[edit]
We would expect the normally distributed values to have a standard deviation which somehow varies with . The smaller , the wider the margin. This is called the standard error  .
.
For the single result from our survey, we assume that  , and that all subsequent results together would have a variance
  .
.

Note that  corresponds to the variance of a Bernoulli distribution.
Maximum margin of error at different confidence levels[edit]
For a confidence level , there is a corresponding confidence interval about the mean  , that is, the interval
 ![{displaystyle [mu -z_{gamma }sigma ,mu +z_{gamma }sigma ]}](https://wikimedia.org/api/rest_v1/media/math/render/svg/a4568060e0cffbc8dfb793aa2ef4617c89cb9e94) within which values of should fall with probability . Precise values of are given by the quantile function of the normal distribution (which the 68-95-99.7 rule approximates).
within which values of should fall with probability . Precise values of are given by the quantile function of the normal distribution (which the 68-95-99.7 rule approximates).
Note that is undefined for  , that is,
  is undefined, as is
  .
.
|
|
|
|
|
|
|---|---|---|---|---|
| 0.68 | 0.994457883210 | 0.999 | 3.290526731492 | |
| 0.90 | 1.644853626951 | 0.9999 | 3.890591886413 | |
| 0.95 | 1.959963984540 | 0.99999 | 4.417173413469 | |
| 0.98 | 2.326347874041 | 0.999999 | 4.891638475699 | |
| 0.99 | 2.575829303549 | 0.9999999 | 5.326723886384 | |
| 0.995 | 2.807033768344 | 0.99999999 | 5.730728868236 | |
| 0.997 | 2.967737925342 | 0.999999999 | 6.109410204869 |
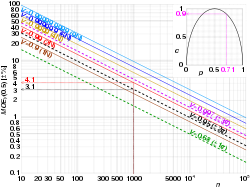
Since  at
at  , we can arbitrarily set
  , calculate
  , , and
  to obtain the maximum margin of error for at a given confidence level and sample size , even before having actual results. With


Also, usefully, for any reported 

Specific margins of error[edit]
If a poll has multiple percentage results (for example, a poll measuring a single multiple-choice preference), the result closest to 50% will have the highest margin of error. Typically, it is this number that is reported as the margin of error for the entire poll. Imagine poll reports  as
as 
 (as in the figure above)


As a given percentage approaches the extremes of 0% or 100%, its margin of error approaches ±0%.
Comparing percentages[edit]
Imagine multiple-choice poll reports as  . As described above, the margin of error reported for the poll would typically be
  , as
, as  is closest to 50%. The popular notion of statistical tie or statistical dead heat, however, concerns itself not with the accuracy of the individual results, but with that of the ranking of the results. Which is in first?
If, hypothetically, we were to conduct poll over subsequent samples of respondents (newly drawn from ), and report result  , we could use the standard error of difference to understand how
  is expected to fall about
  . For this, we need to apply the sum of variances to obtain a new variance,
  ,
,

where  is the covariance of
  and
and  .
.
Thus (after simplifying),


Note that this assumes that  is close to constant, that is, respondents choosing either A or B would almost never chose C (making and close to perfectly negatively correlated). With three or more choices in closer contention, choosing a correct formula for becomes more complicated.
Effect of finite population size[edit]
The formulae above for the margin of error assume that there is an infinitely large population and thus do not depend on the size of population , but only on the sample size . According to sampling theory, this assumption is reasonable when the sampling fraction is small. The margin of error for a particular sampling method is essentially the same regardless of whether the population of interest is the size of a school, city, state, or country, as long as the sampling fraction is small.
In cases where the sampling fraction is larger (in practice, greater than 5%), analysts might adjust the margin of error using a finite population correction to account for the added precision gained by sampling a much larger percentage of the population. FPC can be calculated using the formula[1]

…and so, if poll were conducted over 24% of, say, an electorate of 300,000 voters,


Intuitively, for appropriately large ,


In the former case, is so small as to require no correction. In the latter case, the poll effectively becomes a census and sampling error becomes moot.
See also[edit]
- Engineering tolerance
- Key relevance
- Measurement uncertainty
- Random error
References[edit]
- ^ Isserlis, L. (1918). «On the value of a mean as calculated from a sample». Journal of the Royal Statistical Society. Blackwell Publishing. 81 (1): 75–81. doi:10.2307/2340569. JSTOR 2340569. (Equation 1)
Sources[edit]
- Sudman, Seymour and Bradburn, Norman (1982). Asking Questions: A Practical Guide to Questionnaire Design. San Francisco: Jossey Bass. ISBN 0-87589-546-8
- Wonnacott, T.H.; R.J. Wonnacott (1990). Introductory Statistics (5th ed.). Wiley. ISBN 0-471-61518-8.
External links[edit]
- «Errors, theory of», Encyclopedia of Mathematics, EMS Press, 2001 [1994]
- Weisstein, Eric W. «Margin of Error». MathWorld.

The margin of error is an essential concept for understanding the accuracy and reliability of survey data. In this article, we’ll take a closer look at its definition and its calculation while providing examples of how it’s used in research. We’ll also discuss the importance of considering the margin of error when interpreting survey results and how it can affect the conclusions drawn from the data. So, whether you’re experienced or just starting your journey, this article is a must-read for anyone looking to master the art of margin of error and ensure the accuracy and reliability of their research. Let’s get started!
What is a Margin of Error?
Definition:
The margin of error in statistics is the degree of error in results received from random sampling surveys. A higher margin of error in statistics indicates less likelihood of relying on the results of a survey or poll, i.e. the confidence on the results will be lower to represent a population. It is a very vital tool in market research as it depicts the confidence level the researchers should have in the data obtained from surveys.
A confidence interval is the level of unpredictability with a specific statistic. Usually, it is used in association with the margin of errors to reveal the confidence a statistician has in judging whether the results of an online survey or online poll are worthy to represent the entire population.
A lower margin of error indicates higher confidence levels in the produced results.
When we select a representative sample to estimate full population, it will have some element of uncertainty. We need to infer the real statistic from the sample statistic. This means our estimate will be close to the actual figure. Considering margin of error further improves this estimate.
A well-defined population is a prerequisite for calculating the margin of error. In statistics, a “population” comprises of all the elements of a particular group that a researcher intends to study and collect data. This error can be significantly high if the population is not defined or in cases where the sample selection process is not carried out properly.
Every time a researcher conducts a statistical survey, a margin of error calculation is required. The universal formula for a sample is the following:
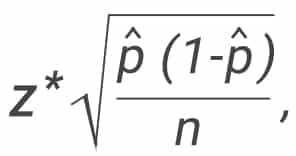
where:
p̂ = sample proportion (“P-hat”).
n = sample size
z = z-score corresponds to your desired confidence levels.
Are you feeling a bit confused? Don’t worry! you can use our margin of error calculator.
Example for margin of error calculation
For example, wine-tasting sessions conducted in vineyards depend on the quality and taste of the wines presented during the session. These wines represent the entire production and depending on how well the visitors receive them, the feedback from them is generalized to the entire production.
The wine tasting will be effective only when visitors do not have a pattern, i.e. they’re chosen randomly. Wine goes through a process to be palatable and similarly, the visitors also must go through a process to provide effective results.
The measurement components prove whether the wine bottles are worthy to represent the entire winery’s production or not. If a statistician states that the conducted survey will have a margin of error of plus or minus 5% at a 93% confidence interval. This means that if a survey was conducted 100 times with vineyard visitors, feedback received will be within a percentage division either higher or lower than the percentage that’s accounted 93 out of 100 times.
In this case, if 60 visitors report that the wines were extremely good. As the margin of error is plus or minus 5% in a confidence interval is 93%, in 100 visitors, it’s safe to conclude that the visitors who comment that the wines were “extremely good” will be 55 or 65 (93%) of the time.
To explain this further, let’s take an example of a survey on volunteering was sent to 1000 respondents out of which 500 agreed to the statement in the survey saying that volunteering makes life better. Calculate margin of error for 95% confidence level.
Step 1: Calculate P-hat by dividing the number of respondents who agreed with the statement in the survey to the total number of respondents. In this case, = 500/1000 = 50%
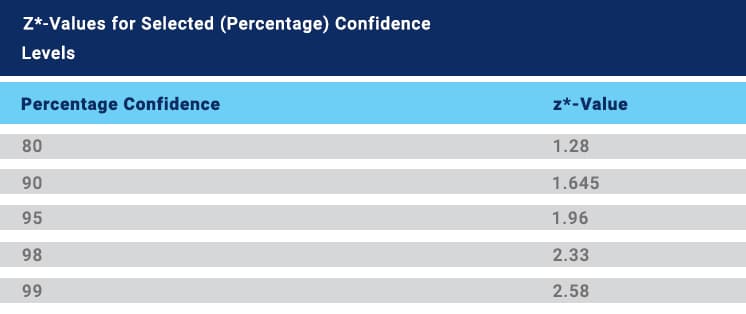
Step 2: Find z-score corresponding to 95% confidence level. In this case, z score is 1.96
Step 3: Calculate by putting these values in the formula
Step 4: Convert to a percentage
Margin of error in sample sizes:
In probability sampling, each member of a population has a probability of being selected to be a part of the sample. In this method, researchers and statisticians can select members from their area of research so that the margin of error in data received from these samples is as minimum as possible.
In non-probability sampling, samples are formed based on cost-effectiveness or convenience and not on the basis of application and because of this selection process, some sections of the population may get excluded. Surveys will be effective only on filtering members according to interests and application to the survey being conducted.
The industrial standard for confidence level is 95% and these are the margin of error percentages for certain survey sample sizes:
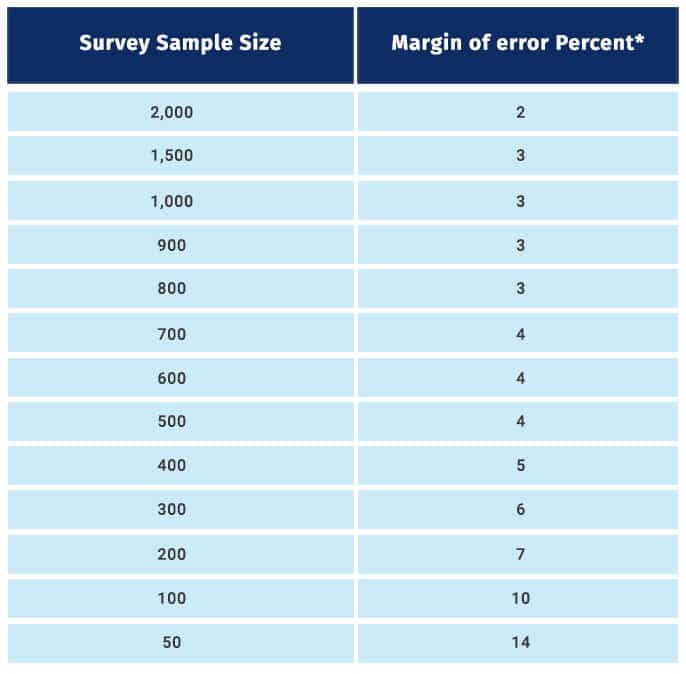
As indicated in this table, to reduce the margin of error to half, for instance, from 4 to 2, the sample size has been increased considerably, from 500 to 2000. As you must have observed, the sample size is inversely proportional to it. Till sample sizes of 1500, there is a significant decrease in it, but beyond that, this decrease reduces.
Ready to take your research game to the next level? Join QuestionPro and elevate your surveys from ho-hum to oh-wow! With our user-friendly platform, you’ll be able to create professional-grade surveys in no time. Plus, with features like customizable templates, advanced analytics, and real-time data collection, you’ll have everything you need to gather accurate, reliable data. So, don’t miss out on the fun. Join QuestionPro today for free and start discovering what your customers, employees, and communities really think. No credit card is needed.
In a
confidence interval, the range of values above and below the
sample statistic is called the margin of error.
For example, suppose we wanted to know the percentage of adults that
exercise daily. We could devise a
sample design to ensure that our sample estimate will not
differ from the true population value by more than,
say, 5 percent 90 percent of the time
(the
confidence level). In this example, the margin of error would be 5 percent.
How to Compute the Margin of Error
The margin of error can be defined by either of the following
equations.
Margin of error = Critical value x Standard deviation of the statistic
Margin of error = Critical value x Standard error of the statistic
If you know the standard deviation of the statistic, use the first
equation to compute the margin of error. Otherwise, use the second
equation. In a previous lesson, we described
how to compute the standard deviation and standard error.
How to Find the Critical Value
The critical value is a factor used to compute
the margin of error. This section describes how to find the
critical value, when the
sampling distribution
of the statistic is
normal
or nearly normal.
When the sampling distribution is nearly normal, the critical value can be expressed as a
t score or as a
z-score.
To find the critical value, follow these steps.
T-Score vs. Z-Score
Should you express the critical value as a t statistic or as a z-score? One way to answer
this question focuses on the population standard deviation.
- If the population standard deviation is unknown, use the t statistic.
Another approach focuses on sample size.
- If the sample size is small, use the t statistic.
In practice, researchers employ a mix of the above guidelines. On this site, we use z-scores
when the population standard deviation is known and the sample size is large.
Otherwise, we use t statistics, unless the sample size is small and the underlying
distribution is not normal.
Warning: If the sample size is small and the population distribution is not normal,
we cannot be confident that the sampling distribution of the statistic will be normal. In this
situation, neither the t statistic nor the z-score should be used to compute critical values.
You can use the
Normal Distribution Calculator
to find the critical z-score, and the
t Distribution Calculator to find
the critical t statistic. You can also use a graphing calculator or
standard statistical tables (found in the appendix of
most introductory statistics texts).
Test Your Understanding
Problem 1
Nine hundred (900) high school freshmen were randomly selected for
a national survey. Among survey participants, the mean grade-point
average (GPA) was 2.7, and the standard deviation was 0.4. What
is the margin of error, assuming a 95% confidence level?
(A) 0.013
(B) 0.025
(C) 0.500
(D) 1.960
(E) None of the above.
Solution
The correct answer is (B). To compute the margin of error, we
need to find the
critical value and the standard error of the mean.
To find the critical value, we take the following steps.
- Find the critical value.
Since we don’t know the population standard deviation, we’ll express the
critical value as a t statistic. For this problem, it will
be the t statistic having 899 degrees of freedom and
a cumulative probability equal to 0.975. Using the
t Distribution Calculator,
we find that the critical value is about 1.96.

Next, we find the standard error of the mean, using the following
equation:
SEx = s / sqrt( n )
SEx = 0.4 / sqrt( 900 ) = 0.4 / 30 = 0.013
And finally, we compute the margin of error (ME).
ME = Critical value x Standard error
ME = 1.96 * 0.013 = 0.025
This means we can be 95% confident that the mean grade point average
in the population is 2.7 plus or minus 0.025, since the margin of error
is 0.025.
Note: The larger the sample size, the more closely the t distribution
looks like the normal distribution. For this problem, since the sample size is very large, we would have
found the same result with a z-score as we found with a t statistic. That is,
the critical value would still have been about 1.96. The choice of t statistic versus z-score does not
make much practical difference when the sample size is very large.
The margin of error is an important measure in statistics. The degree of error in random sampling surveys is known as the margin of error. It expresses random sampling error in the results of a survey. It depicts the confidence that the researchers should have in the data obtained from the survey. It tells the variance from the actual population in terms of the percentage points. A 95% confidence interval with a 4% margin of error, for instance, indicates that your statistic will, 95% of the time, be within 4% of the true population figure. A wider margin of error in statistics denotes a reduced chance of relying on a survey’s or poll’s findings, meaning that there will be less trust in the results’ ability to accurately reflect a community.
What is a Margin of Error?
A margin of error tells you how many percentages points our results differ from the real value. The margin of error is defined as the range of values below and above the sample statistic in a confidence interval. The confidence interval is a way to show what the uncertainty is with a certain statistic.
Importance of Margin of Error
The importance of Magin of Error is discussed below in this article:
- The margin of error indicates how close the results would be if the whole population was surveyed instead of a sample population.
- The higher the margin of error, the lesser the chances of relying upon the results of the survey.
- If the margin of error is low, it means that the results obtained from the sample are highly reliable and will be very close to the ones obtained when surveying the complete population.
- The margin of error is a very important measure from the market viewpoint.
- It is a crucial tool for market research since it shows the amount of assurance that should be placed in survey data by the researchers.
- It is used to show how confident a statistician is in determining whether or not the outcomes of an online survey or online poll are representative of the full population.
Calculation of Margin of Error
Each person in a population has a chance of being chosen to be a part of the sample when using probability sampling. By using this technique, statisticians and researchers may choose participants who have expertise in their particular field of study, ensuring the lowest possible margin of error for the data drawn from these samples. Non-probability sampling excludes some segments of the population due to the selection technique used to create the samples, which is based on convenience or cost-effectiveness rather than applicability. Only by separating respondents into groups based on their interests and relevance to the poll at hand will surveys be effective.
In terms of sample size, the formula is given by,
M.O.E. = 1 / √(n)
where,
M.O.E. denotes the margin of error
n is the sample size
The formula is not widely used as it does not give accurate results it only takes the sample size into consideration and not any other parameters. But in terms of z-index and sample size, the formula is given by,
M.O.E.= z × σ / √(n)
where,
z denotes the z-index
n is the sample size
σ is the population standard deviation
Thus, the margin of error is the product of the critical value and the standard deviation. In the above formula, the z score is calculated using the confidence level given in the question. Some widely used z scores and confidence levels are shown below:
|
Confidence level |
Z-score |
|---|---|
|
90% |
1.645 |
|
95% |
1.96 |
|
99% |
2.575 |
How to Calculate Margin of Error?
Follow the steps discussed below to calculate the Magin of Error.
Step 1: Find the critical value i.e. either a t-score or a z-score. In general, for small sample sizes (under 30) use a t-score otherwise, use a z-score.
Step 2: Find the Standard Deviation or the Standard Error.
Step 3: Multiply the critical value from Step 1 by the standard deviation or standard error from Step 2.
Example: If your critical value is 1.645 and your standard error is 0.26, then:
Margin of Error = 1.645 × 0.26
= 0.4277
Solved Examples on Margin of Error
Example 1: A random sample of 50 students has average pocket money of 2500 and a standard deviation of 567. Find the margin of error if c = 0.95.
Solution:
Given, n = 50
σ = 567
For c = 0.95 i.e. 95% confidence level, z = 1.96
M.O.E = 1.96 × 567 / √(50)
M.O.E. = 157.16
Example 2: 600 students were surveyed, and it was found that the average CGPA of the students was 8.7, with a population standard deviation of 0.2. Calculate the margin of error for the 90% confidence level.
Solution:
Given, n = 600
σ = 0.2
For confidence level of 90%, z = 1.645
M.O.E = 1.645 × 0.2 / √(600)
M.O.E. = 0.013
Example 3: In a survey, it was found that the average salary of 5000 employees was 350000, with a population standard deviation of 0.3. What is the margin of error at a 99% confidence level?
Solution:
Given, n = 5000
σ = 0.3
For 99% confidence level, z = 2.575
M.O.E = 2.575 × 0.3 / √(5000)
M.O.E. = 0.0109
Example 4: Find the margin of error when a population of 400 people is surveyed.
Solution:
Given, sample size = 400
∴M.O.E. = 1 / √(400)
= 1/20
= 0.05
FAQs on Margin of Error
Question 1: What do you mean by the margin of error?
Solution:
The margin of error shows how similar the findings would be if the entire population had been polled as opposed to just a sample.
Question 2: How is the z-value determined in statistics?
Solution:
Z-score is a metric that quantifies how closely a value relates to the mean of a set of values. Standard deviations of data from their mean are used to calculate Z-score.
Question 3: Can the margin of error have a negative value?
Solution:
The level of accuracy needed in a survey is called the margin of error. For example, a 8% margin of error indicates that the actual results’ variation might be either negative or positive eight points.
Question 4: How can we figure out the margin of error with an 85% level of confidence?
Solution:
It is known that the error value is 0.0219 or z-value, is 1.96 for a 95% confidence level. As a result, the method above may be used to calculate the margin of error at a 85% confidence level.
Related Resources
- Statistics Formulas
- Variance and Standard Deviation
- Frequency Distributions

Do you wonder if your survey results are close to the population you’re studying? You can easily find it out by calculating the margin of error using a margin of error calculator.
But, what is a margin of error and why must you calculate it? Find out in this blog.
What is the margin of error in a survey?
In statistical terms, the Margin of Error, also known by its synonym confidence interval, is the degree of error in the result that will differ from the real population value.
In simple words, it tells you if the amount of people you’re surveying is enough for you to feel confident about the accuracy of the data you collect.
The Margin of Error is the range of values above and below the statistical data in a confidence interval. It is a way of showing what the uncertainty in statistics is.
With a small margin of error, there are more confidence levels in your survey results, no matter if the survey focused on market research, customer experience, or patient experience.
Similarly, a higher margin of error means a lower confidence level reflected in the result of a survey.
Confidence interval reveals if the confidence level of a survey a researcher has in the result is appropriate to represent the real population or not.
For example, a 95% confidence level with a 3% margin of error implies that your statistical data will be above or below 3% points over the real population value 95% of the time.
This means that if 60% of responders reply “yes” to a survey with a margin of error of +/- 3%, then responders between 57 to 63% of the total population think “yes” as the answer.
The most commonly acceptable margin of error used by most survey researchers falls between 4% and 8% at the 95% confidence level. It is affected by sample size, population size, and percentage.
When is margin of error used?
The margin of error is used when researchers have a random or probability sample.
In other words, the survey respondents have been selected at random from the population as a whole and every population member has a known, non-zero probability of being included.
For example, a theatre group has a complete list of everyone who has purchased tickets to their shows in the past year. If they randomly select a sample of that population for a survey, they can calculate the margin of error on the percent of people who reported being a fan of the group.
It’s not ideal to use the margin of error if the sample has been selected in a non-random way, for example when you use an opt-in research panel.
How to Calculate Margin of Error
For every statistical survey calculation of margin of error is required. The universal formula used for the calculation is Here, ‘p-hat’ is Sample Proportion
‘N’ is Sample Size
‘Z’ is Z-Score
- Calculate “p-hat” by dividing the number of responders who agree with the statement of your survey by the total population of the survey.
For Example, 600/1000 = 60%
2. Find the z-score in correspondence to the confidence level of the survey.
If the confidence level is 99%, the z-score is 2.58
3. Put these parameters in the formula to calculate.

For instance, if a pizza brand is thinking of working on new flavors. So they conduct a survey on a population chosen randomly for better results.
In this case, the survey is conducted with a margin of error of is a “+ or – 3%” at a 95% level of confidence. This implies that if the survey is conducted 100 times, the statistical result will be within the percentage degree of higher or lower than the percentage that is reported 95 out of 100 times.
The brand then finds out that 50% of the participants respond by saying the new flavor is “very good”. This means that with the confidence level of 95% and margin of error of plus or minus 3%, it is safe to assume that the participants who said the pizza flavors are “very good” will range between 47 to 53% most (95%) of time.
To calculate the Margin of error for this, let’s gather the values. The total population is 1000 while only 500 agreed to the new flavors of the pizza. So the sample size is 500. With the confidence level of 95%, put all the values on the formula.
You will receive the margin of error was plus/minus 3%
You can also calculate the margin of error if the parameters from a population or statistics are available to you.
- Margin of Error = Critical Value X Standard Deviation from the population
- Margin of Error = Critical Value X standard Error of a sample
The critical value is either the “t-score” or “z-score” of your statistical data.
Also, in case you don’t know the population standard deviation, you can use a t-score, and in case it is known you can use a z-score.
What is sample size and how does it affect the margin of error?
Sample size is the number of people whose responses you receive.
As we learned, determining the margin of error helps us understand whether the sample size of the survey is appropriate.
If the margin of error appears too big, you may want to increase the size of the sample so that the attitudes of the population surveyed match those of the total population more closely.
This is why it is important to send surveys to a large population because not everyone will respond. Probably 15% of the randomly chosen people will respond.
So, it is better to keep the margin of error and confidence level in balance with a large population.
Here are the types of sampling methods you can consider:
- Probability Sampling: In this type of sample size any individual has the chance of being chosen. Researchers, in order to keep the margin of error as minimum as possible, can choose participants from their area of research.
- Non-probability Sampling: In this sample, participants are selected based on cost-effectiveness and convenience. Some sections of the population may as well be excluded.
If the margin of error is bigger, the researcher needs to increase the size of the sample. As seen in the table the margin of error decreases with the increase in sample size.

A sample size of 50 has a margin of error of +/- 14%. The difference in the decreasing margin of error is quite significant from sample sizes 50 to 1500. After that the difference in decreasing margin of error reduces.
Now that you know how margin of error is calculated and how it affects your results, let’s learn how to reduce it to improve the reliability of your data.
How to reduce the margin of error in your survey results
Reducing your margin of error is a sure way of increasing the reliability of your surveys and ensuring more accurate results.
Here are the steps that you need to take to reduce the margin error in your surveys:
Step-1: Define your population
Identify the sample for your total population so you’re able to know whether your margin of error is the right one.
Step-2: Decide the level of accuracy you want in your survey
Establish the accuracy percentage you would like to achieve with your survey by measuring both the margin of error and the confidence level of your sample.
Step-3: Define the sample size
Decide how many people would you need to survey for your research project? Remember to consider as part of your sample only the respondents that completed the survey.
Step-4: Define the response rate
Response rate is the percentage of actual respondents among those who received your survey. Make an educated guess. If you’re sampling a random population, a conservative guess is about 10% to 15% will complete the survey. Look at your past surveys to check what your usual rate is.
Now you know the number of people to survey!
After you’ve followed these steps, you’ll arrive at the total number of people to survey.
From the percentage derived in step-4, you’ll know how many people you need to send the survey to so as to get enough completed responses.
The margin of error calculator is a way of measuring how effective is your survey. The narrower the margin of error, the more confidence you can have in the results. The broader the margin of error, the further the opinions from the total population.
How Voxco can help?
No matter the survey or research project, Voxco Insights has the tools and capabilities you need to derive actionable insights from your data.