Table of Contents
- Find Windows 10 / 11 Errors Logs Using Event Viewer
- Find Windows 10 / 11 Errors Log Using Powershell
- Find Windows 10 / 11 Crashes and Error Logs using Reliability Monitor
- Find Windows 10 / 11 crashes log with the help of Windows Memory Dump File
- Find Windows 10 / 11 Crashes and Error Logs using Third-Party Software
- How to Fix Crash in Windows 10 and Windows 11?
macOS, Linux, and Windows OS are the three operating systems that have the most number of users worldwide. If you want to know which operating system crashes the most, you should ask any tech nerd. Then everyone will say that there is no operating system that does not crash, but the Windows operating system has the most crashes, freezes, and hangs out of all operating systems.
There are several potential causes of a computer crash, some of which are flaws with the hardware, some with the operating system, and still others with software. Some of the popular and well-known issues are :
1 Virus and malware.
2 Corrupted OS and third party Software
3 Outdated and Corrupted Drivers.
4 Insufficient and low capacity hardware resources like CPU, RAM, and Harddisk.
5 Overheating Systems, Faulty Manufacturing.
6 InCompatible Software
7 Unreliable or unstable source of power supply
Actually finding errors and troubleshooting errors is a difficult task. Instead of doing random things from random advice which may be poorly stated the problem, the best solution is to try and read this blog thoroughly which helps you to understand the problem and solve it accordingly.
One thing to note is that finding and fixing crashes may take time. Some can be fixed soon and some may take days. These steps mentioned here help in identifying and narrowing down the problem that you are facing with your pc.
Find Windows 10 / 11 Errors Logs Using Event Viewer
When your hardware or software of the system crashes, hangs, or freezes then the operating system generates and maintains a crash log record to identify the causes of the crashes. Windows Operating System maintains this log-in Event Viewer.
Event Viewer captures all the information like how your system software and drivers are loaded. That captured information can be of various types like errors types, informational types, warning types, success audit types, alert types, notice types, and debug types failure audit types. Though there are a large amount of data in logs, our mission should be to find and filter specific problem.
Event Severity Types:
There are mainly 3 event severity types: Information, Warning, and Error.
Informational: It indicates successful action performed in your system. Like progress status messages, success messages, informational messages, etc.
Warning: It indicates information that might create problems in the future.
Error: It indicates problems like failures of critical tasks.
Follow the below steps for finding errors in Event Viewer.
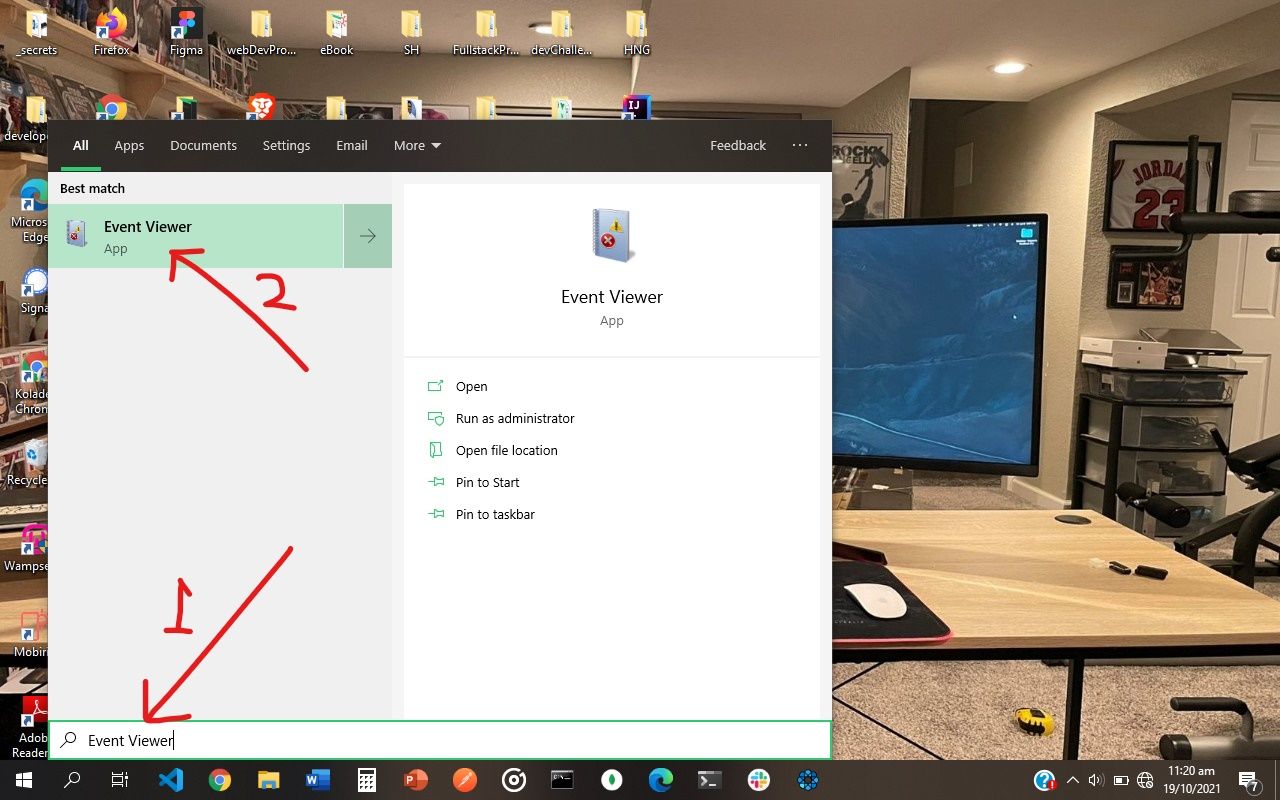
1 Goto search bar and type event and select Event Viewer from the list.

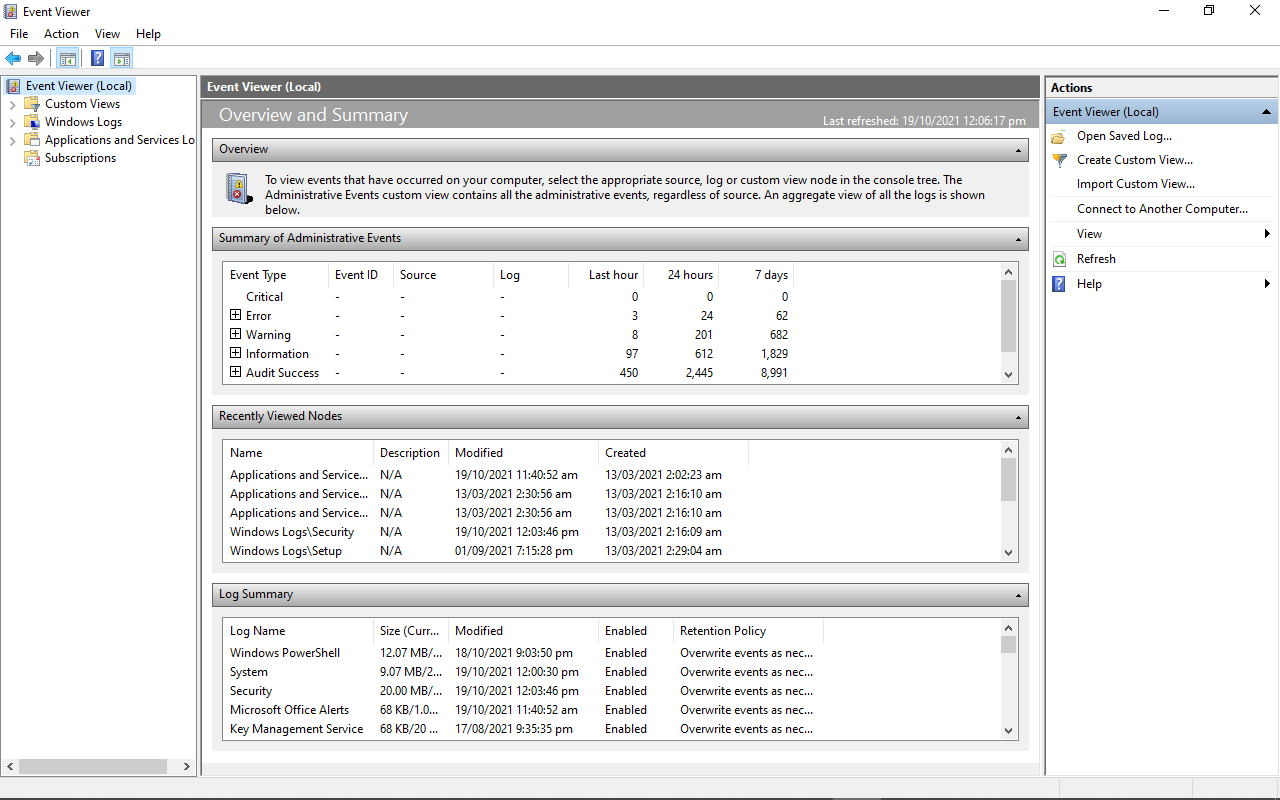
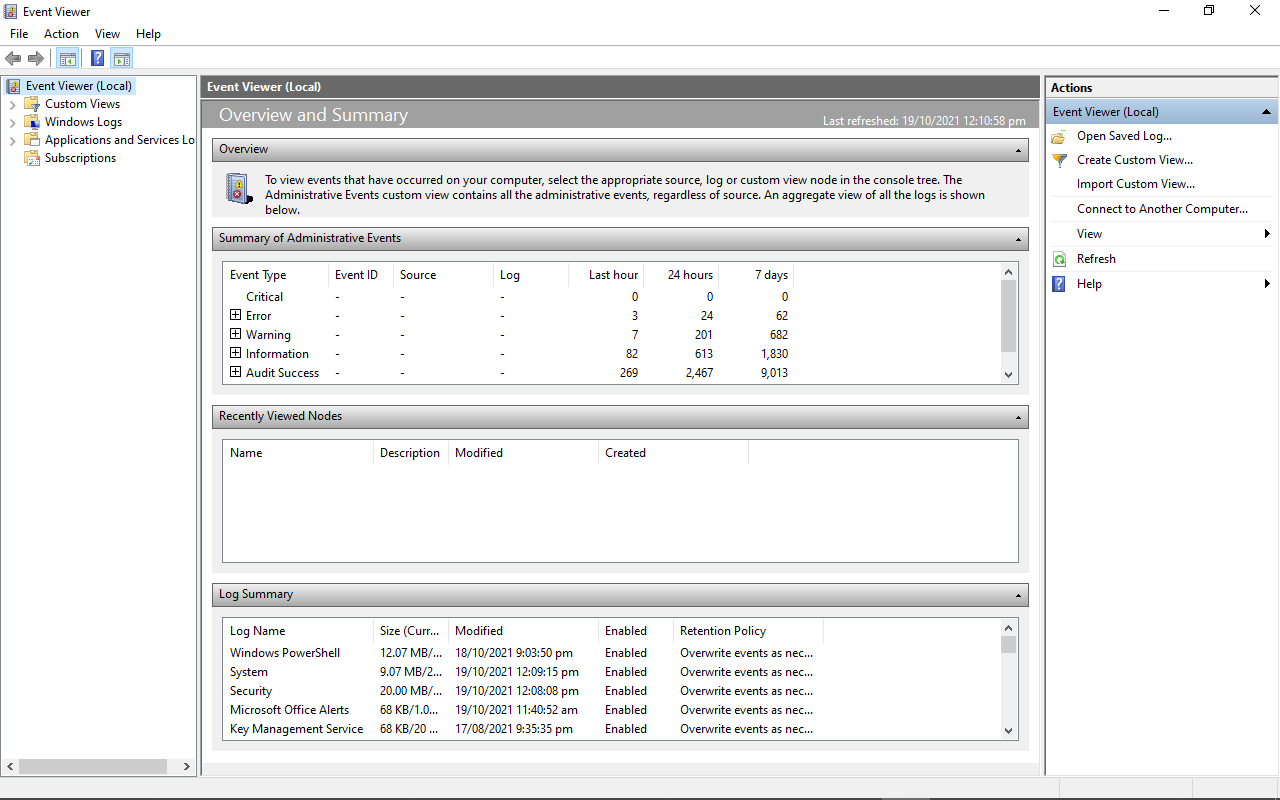
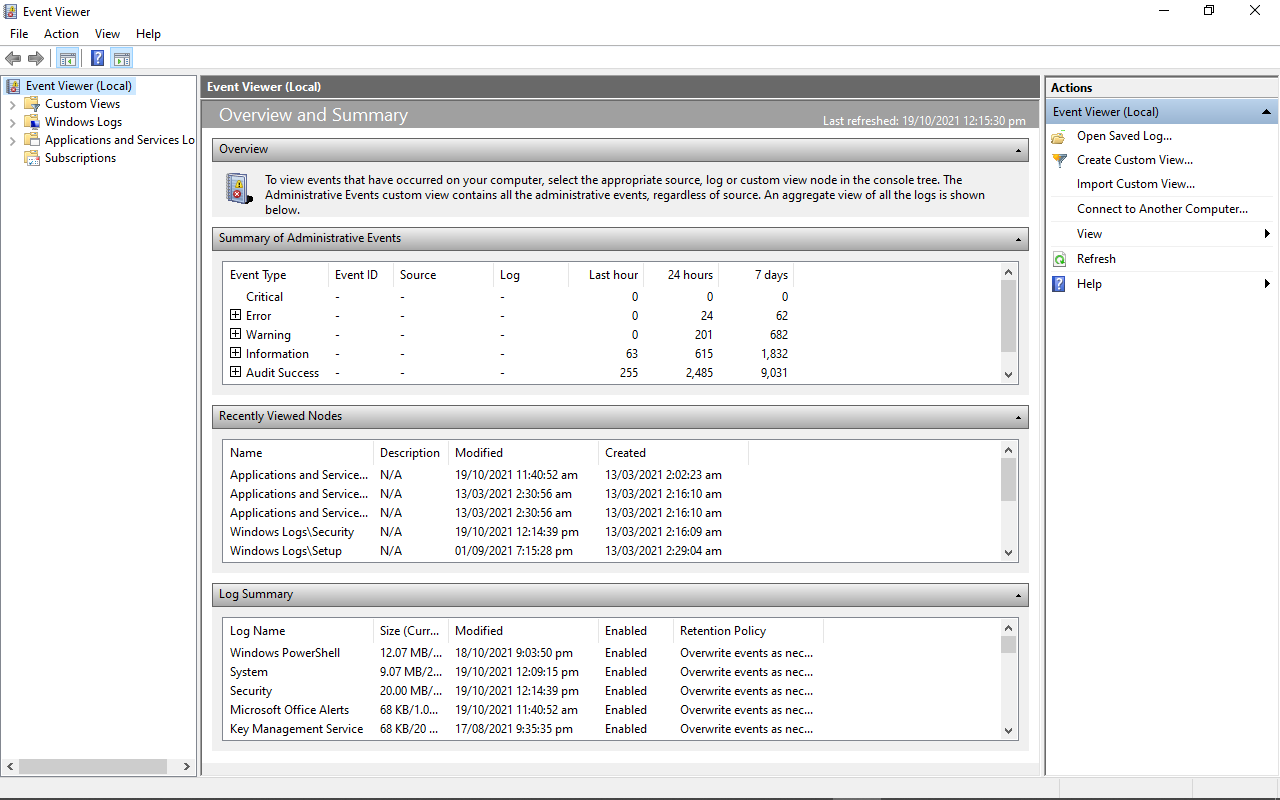
Event Viewer will be opened up as shown below.

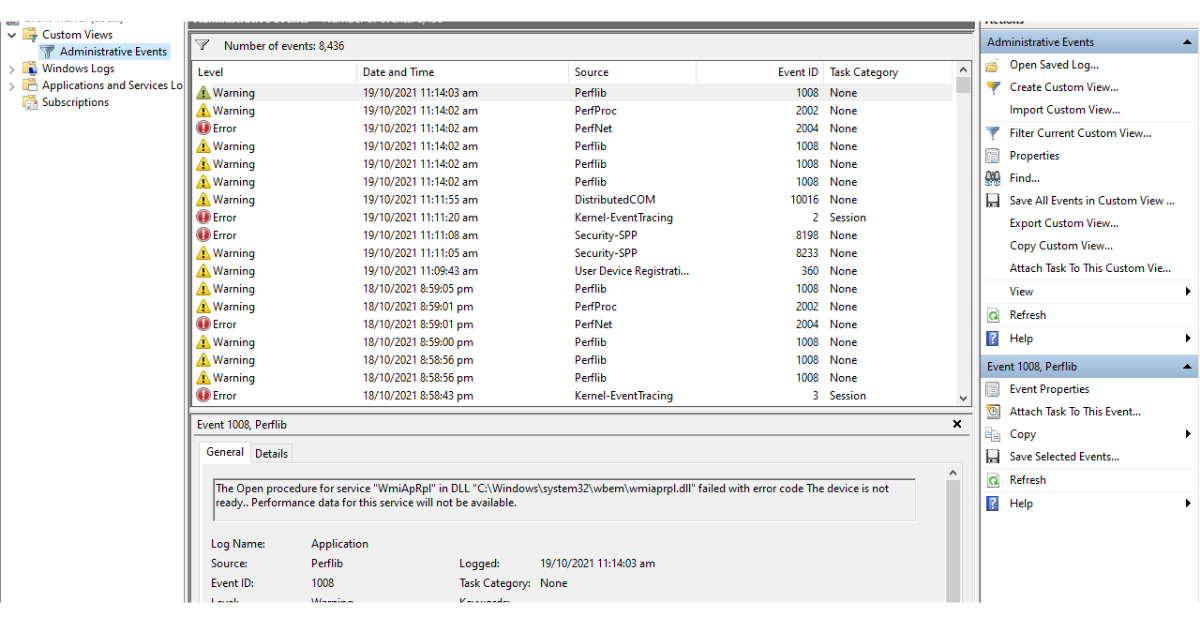
As soon as you opened the event viewer, you will get a summary of Administrative Events which provides various event type information as shown below.
Here, we can see, that within 7 days, 142 Error Levels are detected, 9 within 24 hours, and 2 within the last hour.
Similarly, you can find other event types like a warning, informational, and audit success information.
For finding out error and crashes log information, we will focus on two logs.
- Windows Logs
- Applications and Services Logs

Now, let’s find out the simple errors.
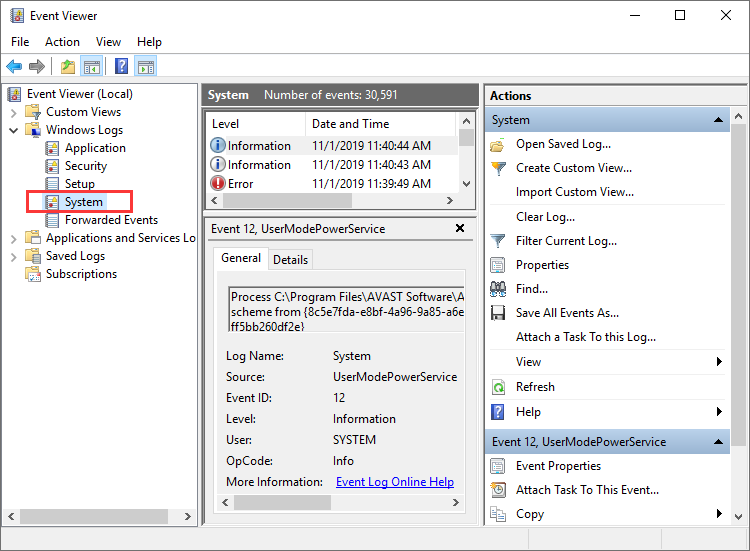
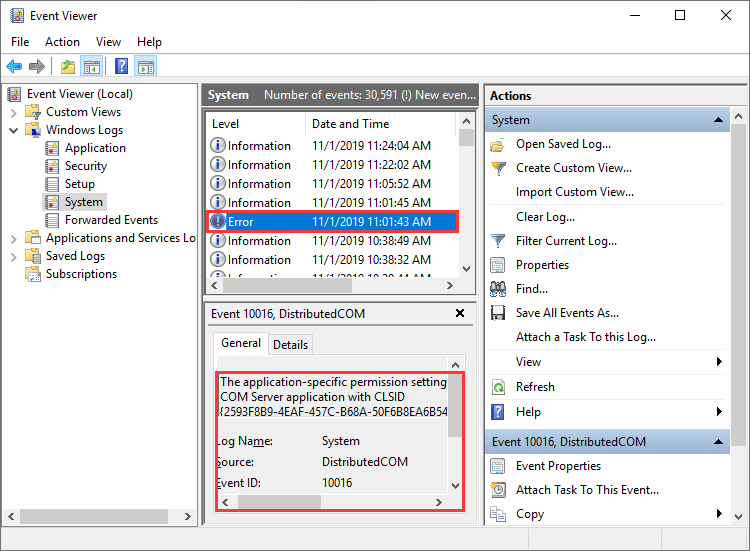
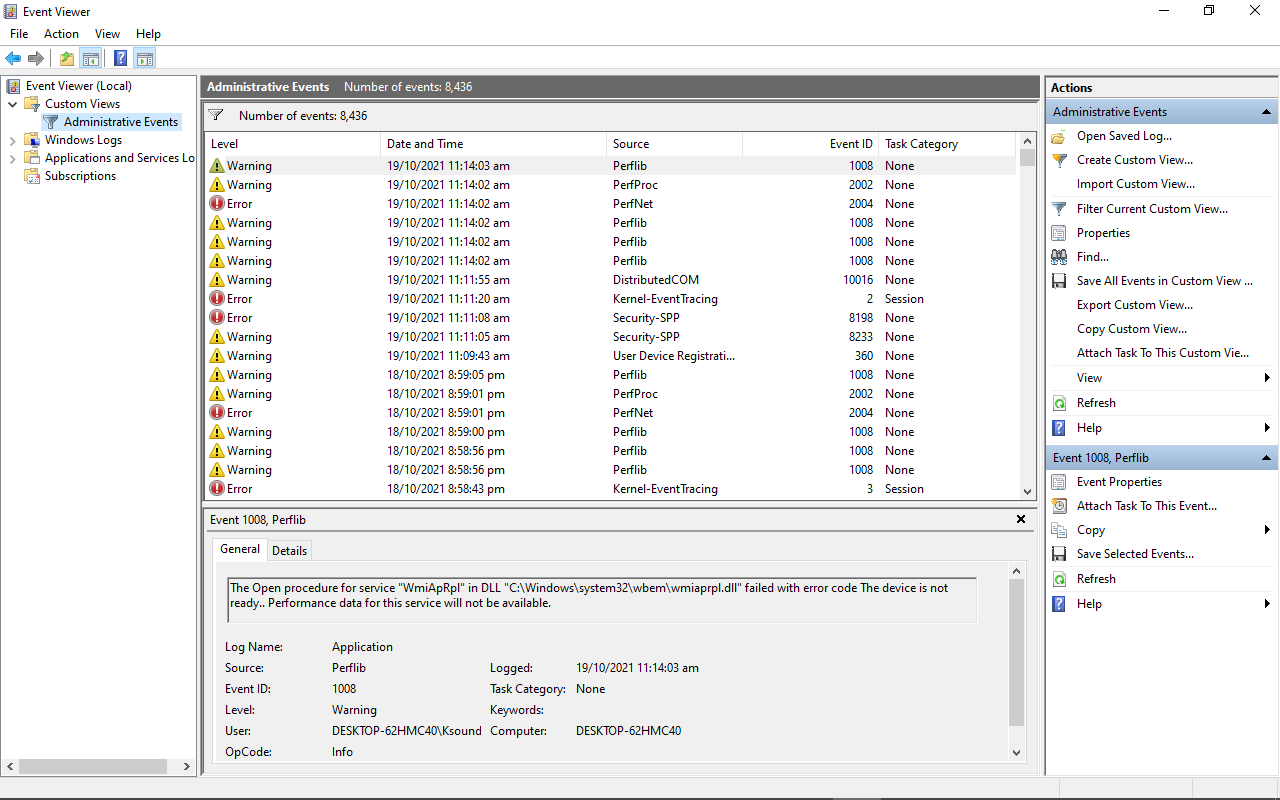
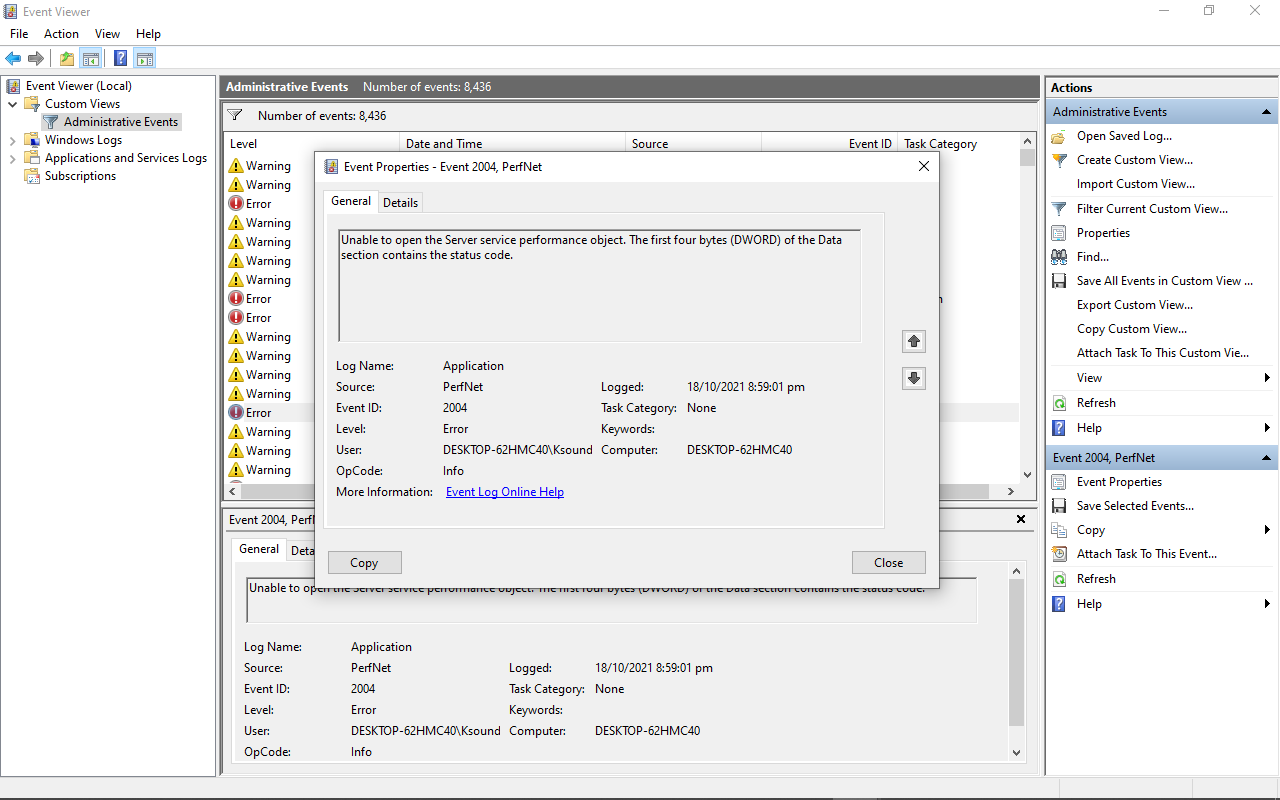
2 Under Windows Logs, click on System. Then on the main panel, you will find all the log information. Scroll down in the main panel, you will find the Error Level log as shown below.
It provides information like when was this error recorded, its Event Id, Task Category, Source from where the error occurs, etc. When you click on the error you will get general and detailed information about the error.

General Tab shows general information.
Detail Tab shows raw event data and you can view those data in Friendly View as well as XML View.
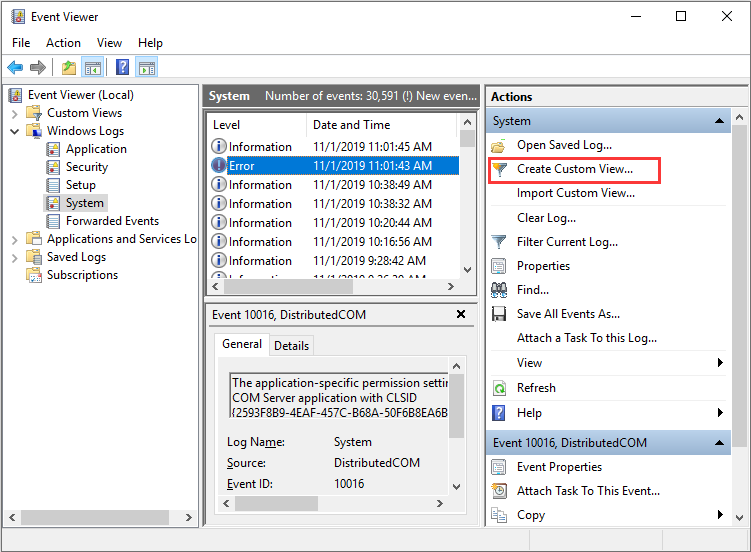
Create Custom View of Error Logs
We can create and filter the custom views of the logs so that we can view only a particular level.
1 Click on Create Custom View located at the top-right pane as shown below.

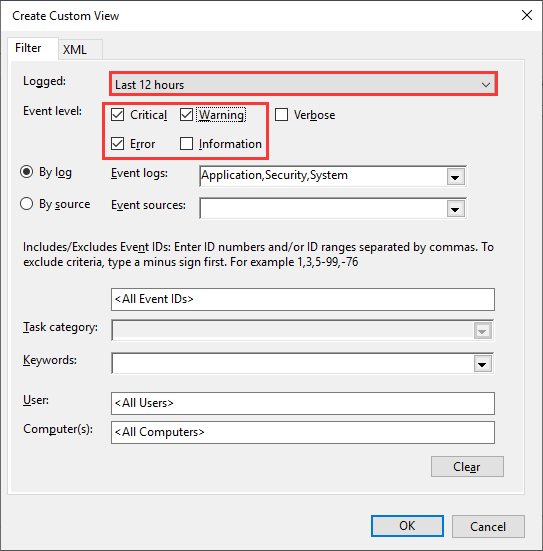
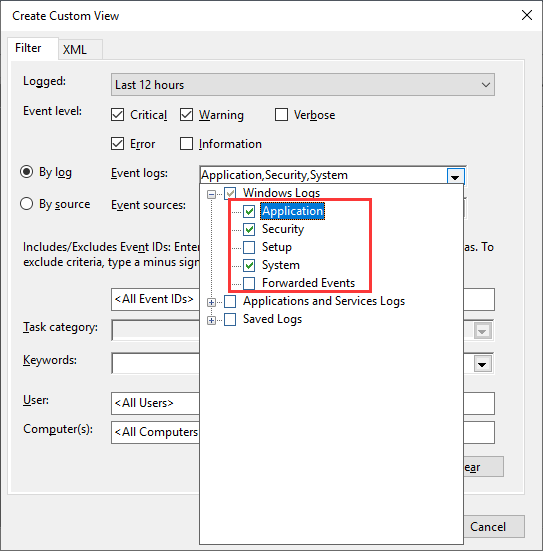
2 Select Error from Event Level and under Event Logs dropdown select Windows Logs > System and press Ok.

Here, I am filtering Error Level for System Category.
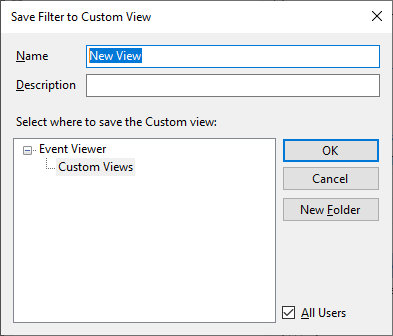
3 Give a name for Custom View. Here I have given «Windows System Error Logs» as shown below.

4 Those custom views are recorded under the Custom Views folder located at the top left pane.
As I have just created a «Windows System Error Logs» custom view, click on it. And we will get all error which is present under Windows Log > System.
We can easily archive those error and crashes in various format like .evt, .txt, .csv etc.
Find Windows 10 / 11 Errors Log Using Powershell
Powershell is a powerful Microsoft tool that provides a command-line interface for task automation and configuration management framework.
Let’s find out error logs using Powershell.
Syntax:
Get-EventLog -Log LogName | where {$_.entryType -match «LogType«}
Eg. Finding Error Level Log from Windows System records related to programs installed on the system.
Get-EventLog -Log system | where {$_.entryType -match «Error«}
 or simply
Get-EventLog -LogName System -EntryType Error
Now,
let’s get the newest 15 error log from System Event.
Get-EventLog -LogName System -Newest 15 -EntryType Error

Here, instead of 15, you can use any number.
Find Windows 10 / 11 Crashes and Error Logs using Reliability Monitor
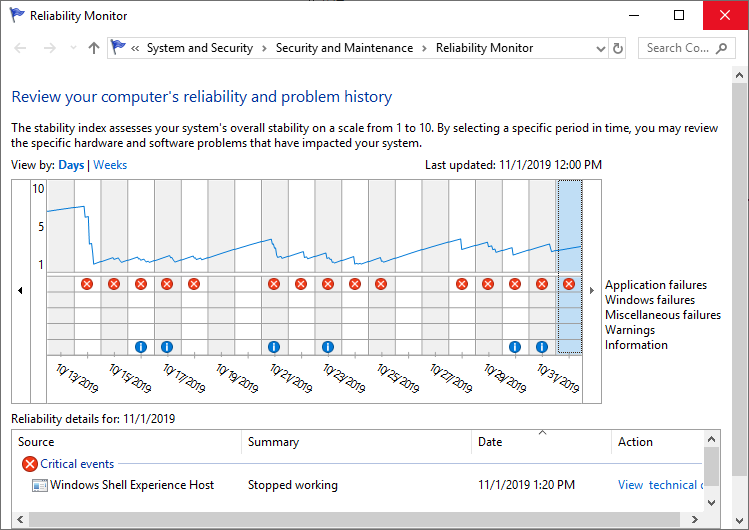
Windows 7 introduced Reliability Monitor features and later adopted them in Windows 8,8.1,10 and 11. Reliability Monitor gives a quick overview of how your system is. It describes errors, warnings, and crash information in graphical format in a much more readable way. Overall, Reliability Monitor tells about how reliable and stable your system has been.
So, let’s find Windows 10 crashes and error logs using Reliability Monitor.
1 Goto search bar and type reliability and then select «view reliability history» from the list.

Reliability Monitor looks like this:

It has a stability Score ranging from one to ten. And, according to your system, its score changes on a regular basis. The horizontal line in the figure above clearly shows that on 5/24/2021, the stability index is around 5, and the system was performing well up to 6/2/2021. The stability score then fell on 6/3/2021.
It has 4 different categories. As shown in the right red rectangle above.
- Application Failures: These tracks like unexpectedly closed the application, applications not responding information, etc.
- Windows Failures: This tracks Operating system failed to start, OS crashes, driver failure, etc.
- Miscellaneous Failures: Other failures not included in application and windows failures.
- Warnings: such as Unable to update windows etc.
- Information: such as Successful windows update.
Here in the chart, critical Errors are shown by red circles, warnings are shown by yellow triangles, and information is shown in blue circles. Note that: Warning and information are not taken while calculating the stability index.
In the graph, we can see that the first error took place on 5/24/2021, as indicated by the red X circle. This error is connected to application failures, as the graph shows. On June 5th, 2021, we can see that problems and faults relating to applications and windows have happened. On the same day, we can also see that warnings and informational messages have been displayed.
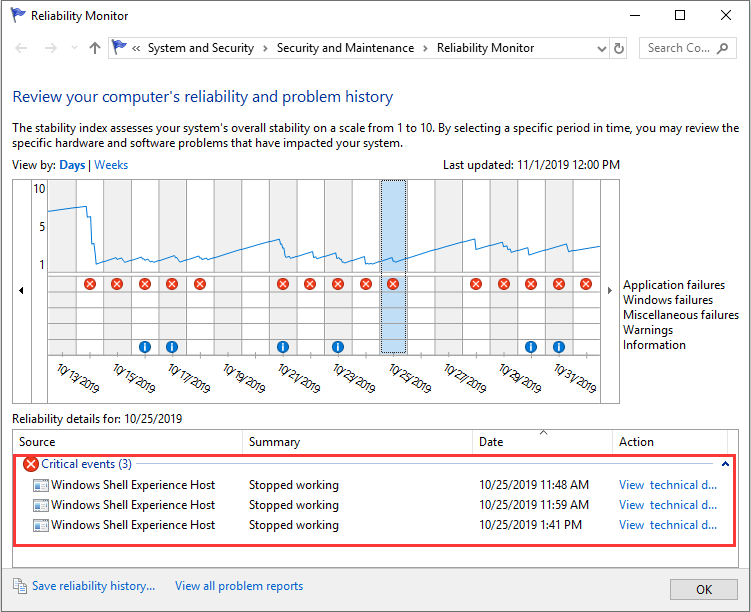
When you click on any row in the chart, you will get respective date failures(if any)/warning(if any)/information(if any) just below the chart.
When clicked on the row of date: 6/3/2021, those errors are shown as below. Here we can clearly see that system is having critical errors as Windows Hardware errors and Asus System Analysis Stopped working error. Also, it is showing Windows Update failure warning and Windows.
Find Windows 10 / 11 crashes log with the help of the Windows Memory Dump File
If your Windows system crashes and you want to record the issue and prevent/troubleshoot it from happening again, a Windows Memory dump file may be useful. It helps in the recovery of information from a crashed computer. It contains an error message associated with a blue-screen of death(BSOD). (Tested in Both Windows 10 and Windows 11)
If your system is currently running, enable a memory dump to collect memory dumps if the freeze issue occurs again.
1 Goto run and type: sysdm.cpl and press enter.

2 Click on the Advance tab
3 Under the Startup and Recovery section, click on Settings.

4 Then Check «Write an event to the system log» and uncheck «Automatically restart»
5 Select «Complete Memory Dump» if you have a large disk size otherwise select a Small memory dump(256 KB) if you have limited disk space.
6 Select «Overwrite any existing file» to overwrite the existing file.

7 Click on the Ok button.
Now when your system crashes and you want to find crashed information then you will get it at path «%SystemRoot%MEMORY.DMP»
Note: To create a memory dump file, Windows requires at least a 2 MB paging file on the boot volume.
 Find Windows 10 / 11 Crashes and Error Logs using Third-Party Software
 Find Windows 10 / 11 Crashes and Error Logs using Third-Party Software
There are lots of Windows 10 / 11 Event Logs third-party software which can be handy for you. So here is the list of some commonly used Windows 10 Event Logs Viewer for Finding Crashes and Error Logs
1 SysMon
Sysmon (System Monitor) is a component of SysInternals Tools. It is a Windows system service and device driver. Once installed, it remains resident across system reboots to monitor and log system activity to the Windows event log. It provides detailed information on what is happening in the operating system, such as process creation, network connections, and changes to file creation time.
Download
2 Splunk
Splunk Cloud Platform can be used to monitor Windows Event Log channels. Splunk universal or heavy forwarder is utilized here to collect data and send it to Splunk Cloud Platforms.

Download
3 Event Log Explorer
Event Log Explorer is a powerful software tool that allows you to observe, analyze, and monitor Windows Event Log activities. Event Log Explorer significantly simplifies and accelerates event log examination of all types, including security, system, application, setup, DNS, and others.
Download
4 LOGalyze
Logalyze is open-source software that is free and lightweight for centralized log management and network monitoring.LOGalyze can analyze server and application logs and can report data in PDF, CSV, and HTML format. It is compatible with both Linux and Windows operating systems.
It also offers powerful search capabilities and can detect real-time events in services distributed across multiple nodes.

Download
5 SnakeTail
SnakeTail is another Windows Tail log analyzer tool for monitoring large text files and Windows Event Logs with no administrative rights.
Download
How to Fix Crash in Windows 10 and Windows 11?
You can fix or reduce the crashing issue on Windows 10 or 11 by following the steps below.
1 Reboot your PC: It’s possible that simply restarting your computer will solve the problem. It will clean the memory and put a stop to any processes that are hogging your resources, such as RAM and CPU, for no apparent reason. A reboot can fix problems with hardware and peripheral devices as well.
2 Disable CPU Overclocking: There are situations when your CPU will crash due to overheating, and the overheating could be caused by an overclocked CPU. Stopping the CPU from being overclocked is therefore one technique to prevent the overheating and crashing issue.
3 Updates Driver from Guenine Source: Keeping your drivers up to date and updating those that are out of date can prevent your computer from crashing.
An obsolete driver or missing updates or corrupted updates could be responsible for a BSOD that prevents you from accessing the desktop.
If you experience crashes in your programs, such as Zoom, Skype, and games, then you probably blame this application; however, this does not always happen, and the problem could be with your driver; thus, you should update your driver as soon as you can.
4 System Restore: If you are having issues with the functionality of your Windows machine, you can use the System Restore feature to revert the system files, program files, and registry information to an earlier version themselves. If these files are damaged or corrupted in any way, using System Restore to restore them to an earlier point in time will fix the issue for you.
5 Scan your system for the error
You can try any of the below commands to scan your system.
sfc /scannow
When you use the command sfc /scannow, it will check all of the protected system files and, if any of them are corrupted, it will replace them with a cached duplicate that is stored in a compressed folder at the path %WinDir%System32dllcache
You can try DISM Command: The Dism command does a check for corruption and fixes any issues that it discovers with the operating system into which you are currently logged.
dism.exe /online /cleanup-image /restorehealth
FAQ:
1 What are the most common crashes in Windows OS?
Ans: Almost all the crashes and error logs of windows OS can be found in Event Viewer. Event Log can tell you why and when a crash occurred.
There are 3 most common crashes in Windows OS are :
- Unexpected Shutdown and restart.
- Application Hangs
- Application Level Fault.
2 Where to find startup problems?
Ans: You can find boot/startup logs in Event Viewer, Reliability Monitor, and Boot Logs.
You can look above for the Event Viewer method and reliability monitor methods. Here I will explain using Boot Logs. Actually, Boot Logs contains both Successful as well as unsuccessful information that occurs during boot. Those logs are found in the Ntbtlog.txt file.
3 What is BSOD?
BSOD stands for Blue Screen Of Death. As a name, they are a kind of fatal windows system crash displayed in Blue Screen as shown below.

BSOD signifies a system crash in which the operating system is unable to operate safely. The General Cause of BSOD is hardware and software driver issues.
4 How to fix Windows Corrupted System Files?
If there are corrupted system files in Windows, then SRC(System File Checker) can fix most of them.
- Open Command Prompt with admin privileges.
- Type the below command and press Enter
sfc /scannow
Then wait for the process to complete.
Can I Clear Error Log in Windows 11 ?
Ans: You are free to go. Windows Error Logs are small in size and can be left as it is. You should not be concerned about them at all.You are free to clear them if you wish.
Introduction
Acronis software may give errors, freeze or produce other undesired effects when there are issues with parts of the computer environment it operates in:
|
Hardware/Firmware |
Disk partitions, file systems |
Operating system, software |
|
disks disk controllers RAID controllers network interface controllers optical discs drives tape devices disk adapters data and power cables ports/connectors other physical and virtual hardware used to store, transfer, manipulate data RAM firmware of the above devices, BIOS/UEFI |
partition table (e.g. MBR, GPT) disk partitions disk volumes file systems Windows drivers |
Volume Shadow Copy Service (VSS) VSS providers VSS writers Windows Registry configuration Windows user accounts Permissions for files/folders Windows Management Interface (WMI) |
Examples of error messages in Acronis software, when you would want to check the environment:
Unable to create volume snapshot
Failed to read snapshot
Failed to read from sector…
Failed to read from disk…
Failed to write the snapshot manager volume
Various types of read and write errors
Input/Output (I/O) errors
Errors referencing \?GLOBALROOTDevice…
Cyclic redundancy check (CRC) error
Failed to enumerate directory
WMI ExecQuery failed
MFT bitmap corrupted
The semaphore timeout period has expired
Solution
Acronis has developed a free tool that automates the process of checking the environment particularly for Volume Shadow Copy Service (VSS)-related issues: Acronis VSS Doctor. This tool saves time on gathering and analyzing diagnostic information from various sources, including Windows Event Log, but it does not cover all possible root causes and applies to VSS-related issues only.
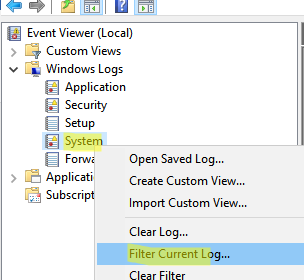
A more universal approach consists in checking Windows Event Log for issues with computer environment using Windows Event Viewer:
1. Open Windows Start Menu.
2. Type Event Viewer and press Enter:

If Windows Search does not find Event Viewer by name, press the combination of the button with Windows logo on keyboard and R, and run the command evenvwr.msc

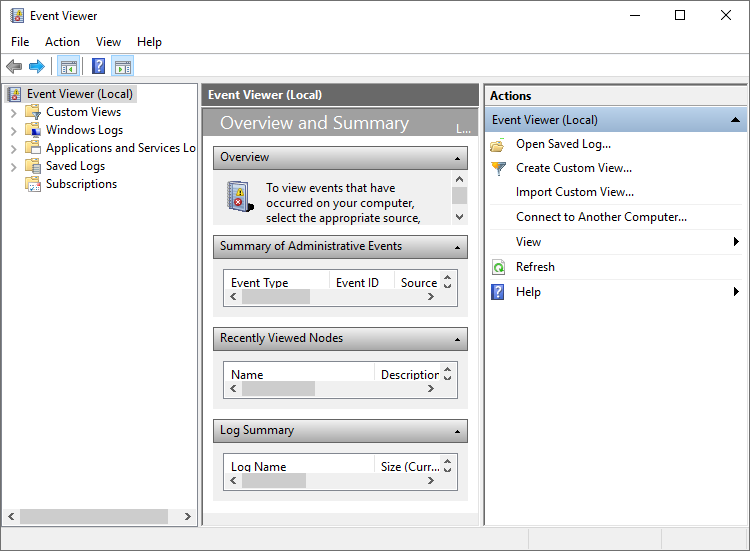
3. Windows Event Viewer will open:

4. Navigate to Windows Logs — System:

5. Click Filter Current Log… on the right panel:

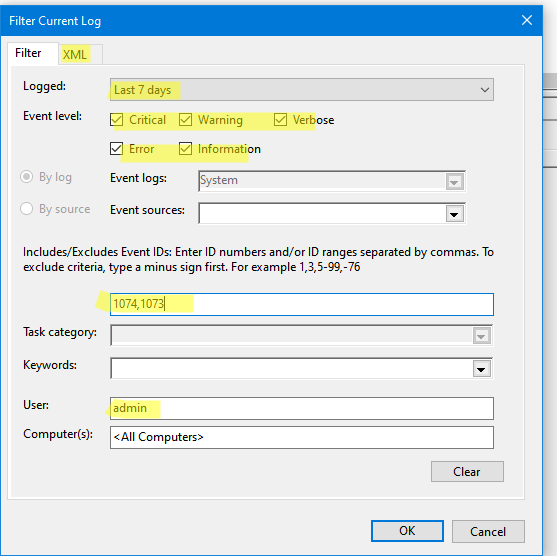
6. Mark Critical, Error and Warning checkboxes in the upper part of the window, click OK to apply the filter:

7. At this point you can click OK and review the recent warnings and errors, recorded in the System event log, and look for any information related to the issue observed in Acronis software. Pay special attention to events registered at the time the issue occurred, or just before that:

8. As there may be many unrelated events, you can narrow the search further, by applying the following suggested filter. Click Filter Current Log.. again:
9. Expand Event sources list:

10. Scroll through the list and mark the following items:
Short list (most popular sources of errors):
disk
Disk
Ntfs
Ntfs (Microsoft-Windows-Ntfs)
Ntfs (Ntfs)
Extended list (click to expand)
11. Click OK and review the filtered list of events. Your further actions will depend on what parts of the environment were reported to have issues and on their current status:

12. When troubleshooting a VSS or WMI-related issue, it is useful to also check warnings, errors and critical events under Windows Logs — Application section. In addition to troubleshooting issues with Windows environment, Application logs are also used to detect application crash and hang events.

Further troubleshooting
Look up the detailed error/warning text, as well as the Event ID number on the Internet. Issues with environment are common and are likely to have a solution or a workaround already documented or described.
If you are not sure if the found errors and warnings could be the cause of the issue with Acronis software, contact Acronis Support with a system report and screenshots of the issue with Acronis, log of the operation in Acronis (if any) and the found records in Windows Event Log.
Журнал событий Windows (Event Log) — это важный инструмент, который позволяет администратору отслеживать ошибки, предупреждения и другие информационные сообщения, которые регистрируются операционной системой, ее компонентами и различными программами. Для просмотра журнала событий Windows можно использовать графическую MMC оснастку Event Viewer (
eventvwr.msc
). В некоторых случаях для поиска информации в журналах событий и их анализа гораздо удобнее использовать PowerShell. В этой статье мы покажем, как получать информацию из журналов событий Windows с помощью командлета Get-WinEvent.
Содержание:
- Получение логов Windows с помощью Get-WinEvent
- Get-WinEvent: быстрый поиск в событиях Event Viewer с помощью FilterHashtable
- Расширенный фильтры событий Get-WinEvent с помощью FilterXml
- Получить логи Event Viewer с удаленных компьютеров
На данный момент в Windows доступны два командлета для доступа к событиям в Event Log: Get-EventLog и Get-WinEvent. В подавляющем большинстве случаев рекомендуем использовать именно Get-WinEvent, т.к. он более производителен, особенно в сценариях обработки большого количества событий с удаленных компьютеров. Командлет Get-EventLog является устаревшим и использовался для получения логов в более ранних версиях Windows. Кроме того, Get-EventLog не поддерживается в современных версиях PowerShell Core 7.x.
Получение логов Windows с помощью Get-WinEvent
Для использования команды Get-WinEvent нужно запустить PowerShell с правами администратора (при запуске Get-WinEvent от имени пользователя вы не сможете получить доступ к некоторым логам, например, к Security).
Для получения списка событий из определенного журнала, нужно указать его имя. В данном примере мы выведем последние 20 событий из журнала System:
Get-WinEvent -LogName Application -MaxEvents 20
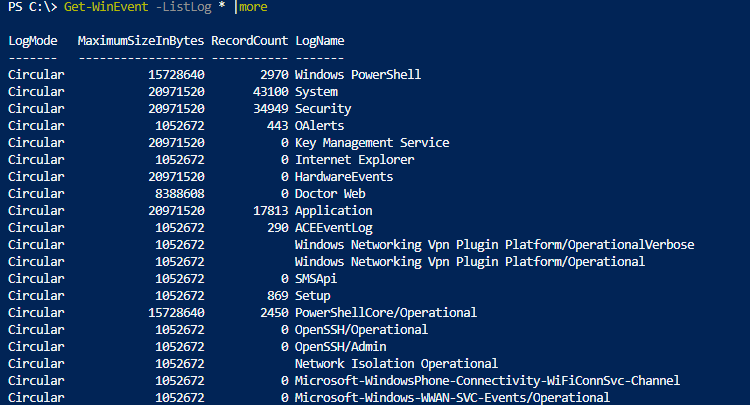
Чаще всего вам нужно будет получать информацию из журналов System, Application, Security или Setup. Но вы можете указать и другие журналы. Полный список журналов событий в Windows можно получить с помощью команды:
Get-WinEvent -ListLog *
Например, чтобы вывести события RDP подключений к компьютеру, нужно указать лог Microsoft-Windows-TerminalServices-RemoteConnectionManager/Operational:
Get-WinEvent -LogName Microsoft-Windows-TerminalServices-RemoteConnectionManager/Operational
Или получить логи SSH подключений к Windows из журнала OpenSSH/Operational:
Get-WinEvent -LogName OpenSSH/Operational
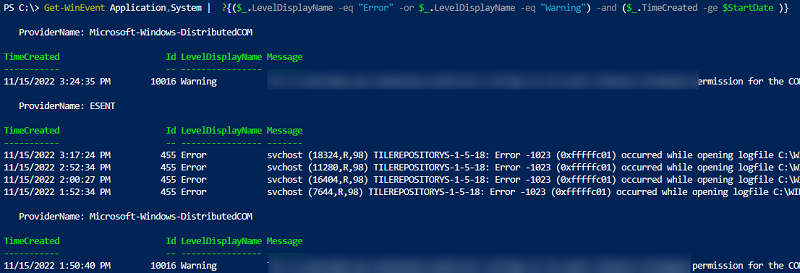
Можно выбрать события сразу из нескольких журналов. Например, чтобы получить информацию о ошибках и предупреждениях из журналов System и Application за последние 24 часа (сутки), можно использовать такой код:
$StartDate = (Get-Date) - (New-TimeSpan -Day 1)
Get-WinEvent Application,System | Where-Object {($_.LevelDisplayName -eq "Error" -or $_.LevelDisplayName -eq "Warning") -and ($_.TimeCreated -ge $StartDate )}
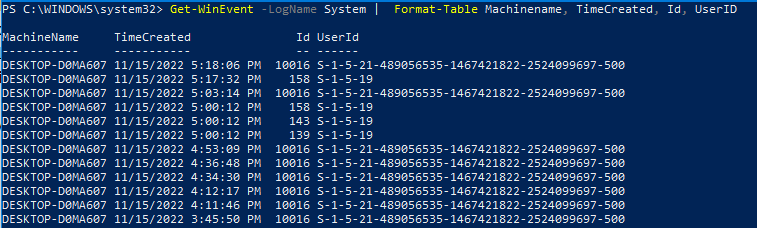
Чтобы вывести только определенные поля событий, можно использовать Select-Object или Format-Table:
Get-WinEvent -LogName System | Format-Table Machinename, TimeCreated, Id, UserID
Можно выполнить дополнительные преобразования с полученными данными. Например, в этом примере мы сразу преобразуем имя пользователя в SID:
Get-WinEvent -filterhash @{Logname = 'system'} |
Select-Object @{Name="Computername";Expression = {$_.machinename}},@{Name="UserName";Expression = {$_.UserId.translate([System.Security.Principal.NTAccount]).value}}, TimeCreated
Get-WinEvent: быстрый поиск в событиях Event Viewer с помощью FilterHashtable
Рассмотренный выше способ выбора определенных событий из журналов Event Viewer с помощью Select-Object прост для понимая, но выполняется крайне медленно. Это особенно заметно при выборке большого количества событий. В большинстве случаев для выборки событий нужно использовать фильтрацию на стороне службы Event Viewer с помощью параметра FilterHashtable.
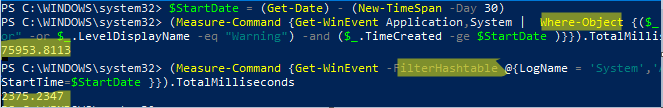
Попробуем сформировать список ошибок и предупреждений за 30 дней с помощью Where-Object и FilterHashtable. Сравнима скорость выполнения этих двух команд PowerShell с помощью Measure-Command:
$StartDate = (Get-Date).AddDays(-30)
Проверим скорость выполнения команды с Where-Object:
(Measure-Command {Get-WinEvent Application,System | Where-Object {($_.LevelDisplayName -eq "Error" -or $_.LevelDisplayName -eq "Warning") -and ($_.TimeCreated -ge $StartDate )}}).TotalMilliseconds
Аналогичная команда с FilterHashtable:
(Measure-Command {Get-WinEvent -FilterHashtable @{LogName = 'System','Application'; Level =2,3; StartTime=$StartDate }})..TotalMilliseconds
В данном примере видно, что команда выборки событий через FilterHashtable выполняется в 30 раз быстрее, чем если бы обычный Where-Object (
2.5
сек vs
76
секунд).
Если вам нужно найти события по EventID, используйте следующую команду с FilterHashtable:
Get-WinEvent -FilterHashtable @{logname='System';id=1074}|ft TimeCreated,Id,Message
В параметре FilterHashtable можно использовать фильтры по следующим атрибутам событий:
- LogName
- ProviderName
- Path
- Keywords (для поиска успешных событий нужно использовать значение 9007199254740992 или для неуспешных попыток 4503599627370496)
- ID
- Level (1=FATAL, 2=ERROR, 3=Warning, 4=Information, 5=DEBUG, 6=TRACE, 0=Info)
- StartTime
- EndTime
- UserID (SID пользователя)
- Data
Пример поиска события за определенный промежуток времени:
Get-WinEvent -FilterHashTable @{LogName='System'; StartTime=(get-date).AddDays(-7); EndTime=(get-date).AddHours(-1); ID=1234}
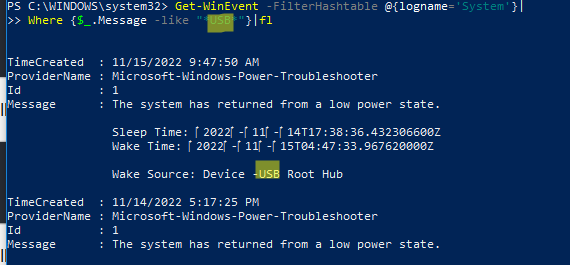
Если нужно найти определенный текст в описании события, можно использовать такую команду:
Get-WinEvent -FilterHashtable @{logname='System'}|Where {$_.Message -like "*USB*"}
Расширенный фильтры событий Get-WinEvent с помощью FilterXml
Фильтры Get-WinEvent с параметром FilterHashtable являются несколько ограниченными. Если вам нужно использовать для выборки событий сложные запросы с множеством условий, нужно использовать параметр FilterXml, который позволяет сформировать запрос на выбор событий в Event Viewer с помощью XML запроса. Как и FilterHashtable, фильтры FilterXml выполняется на стороне сервера, поэтому результат вы получите довольно быстро.
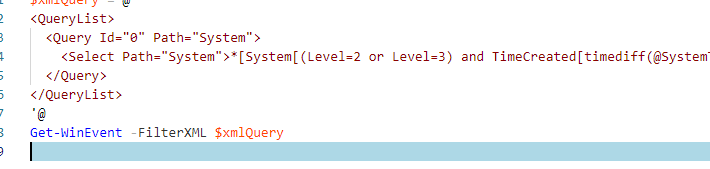
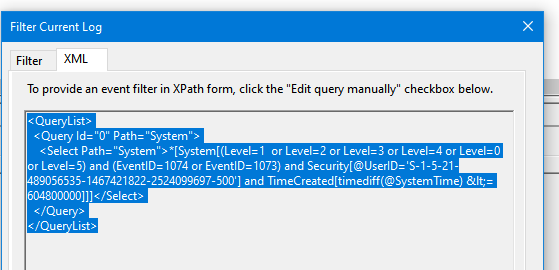
Например, аналогичный запрос для получения последних ошибок из журнала System за последние 30 дней может выглядеть так:
$xmlQuery = @'
<QueryList>
<Query Id="0" Path="System">
<Select Path="System">*[System[(Level=2 or Level=3) and TimeCreated[timediff(@SystemTime) <= 2592000000]]]</Select>
</Query>
</QueryList>
'@
Get-WinEvent -FilterXML $xmlQuery
Для построения кода сложных XML запросов можно использовать графическую консоль Event Viewer:
- Запустите
eventvwr.msc
; - Найдите журнал для которого вы хотите создать и выберите Filter Current Log;
- Выберите необходимые параметры запроса в форме. В этом примере я хочу найти события с определенными EventID за последние 7 дней от определенного пользователя;

- Чтобы получить код XML запроса для параметра FilterXML, перейдите на вкладку XML и скопируйте полученный код (CTRL+A, CTRL+C);

- Если нужно, вы можете вручную отредактировать данный запрос.
Для экспорта списка событий в CSV файл нужно использовать командлет Export-CSV:
$Events= Get-WinEvent -FilterXML $xmlQuery
$events| Export-CSV "C:psFilterSYSEvents.csv" -NoTypeInformation -Encoding UTF8
Получить логи Event Viewer с удаленных компьютеров
Для получения события с удаленного компьютер достаточно указать его имя в параметре -ComputerName:
$computer='msk-dc01'
Get-WinEvent -ComputerName $computer -FilterHashtable @{LogName="System"; StartTime=(get-date).AddHours(-24)} |   select Message,Id,TimeCreated
Можно опросить сразу несколько серверов/компьютеров и поискать на них определенные события. Список серверов можно получить из текстового файла:
$servers = Get-Content -Path C:psservers.txt
Или из Active Directory:
$servers = (Get-ADComputer -Filter 'operatingsystem -like "*Windows server*" -and enabled -eq "true"').Name
foreach ($server in $servers) {
Get-WinEvent -ComputerName $server -MaxEvents 5 -FilterHashtable @{
LogName = 'System'; ID= 1234
} | Select-Object -Property ID, MachineName
}
Здесь есть другой пример для поиска событий блокировки учетной записи пользователя на всех контроллерах домена:
$Username = 'a.ivanov'
Get-ADDomainController -fi * | select -exp hostname | % {
$GweParams = @{
‘Computername’ = $_
‘LogName’ = ‘Security’
‘FilterXPath’ = "*[System[EventID=4740] and EventData[Data[@Name='TargetUserName']='$Username']]"
}
$Events = Get-WinEvent @GweParams
$Events | foreach {$_.Computer + " " +$_.Properties[1].value + ' ' + $_.TimeCreated}
}
Logs are constantly recording what is going on on your computer. They can
provide help in tracking what happens with your machine or with troubleshooting.
Logs are kept about both actions by a person or by a running process.
In Windows, logs that are saved contain information about applications and the
operating system itself. Moreover, these logs are structured and human-readable.
For viewing the logs, Windows uses its Windows Event Viewer. This
application displays the event logs and allows the user to search, filter,
export, and analyze background info. In this article, you will learn how to use
the features provided with this program. In addition, this article will also
explore the Event Viewer’s interface and features. Finally, you will also learn
about other application that has their own event viewer built-in, and we will
talk about creating your own repeating tasks.
🔭 Want to centralize and monitor your application logs?
Head over to Logtail and start ingesting your logs in 5 minutes.
Prerequisites
- Windows 10 installed
- Administration privileges
Step 1 — Accessing Event Viewer
Event viewer is a standard component and can be accessed in several ways. The
easiest way is to type event viewer to the start menu. If you prefer using
command prompt, you can access it by running the eventvwr command.
Event viewer is also accessible through the control panels. Open the control
panels and list them all by viewing them like small or large icons. After that,
select the Administrative Tools and find Event Viewer in the folder.
The application is user-friendly and provides an intuitive interface. The main
screen is divided into three column sections:
- Navigation page
- Detail page
- Action page
You can also create your own section. We will explain how to do that later in
the tutorial.
Step 2 — Understanding Navigation Page
The navigation page, which is by default positioned on the very left, provides
you with an option to choose the event log to view. Five categories can be found
under Windows logs:
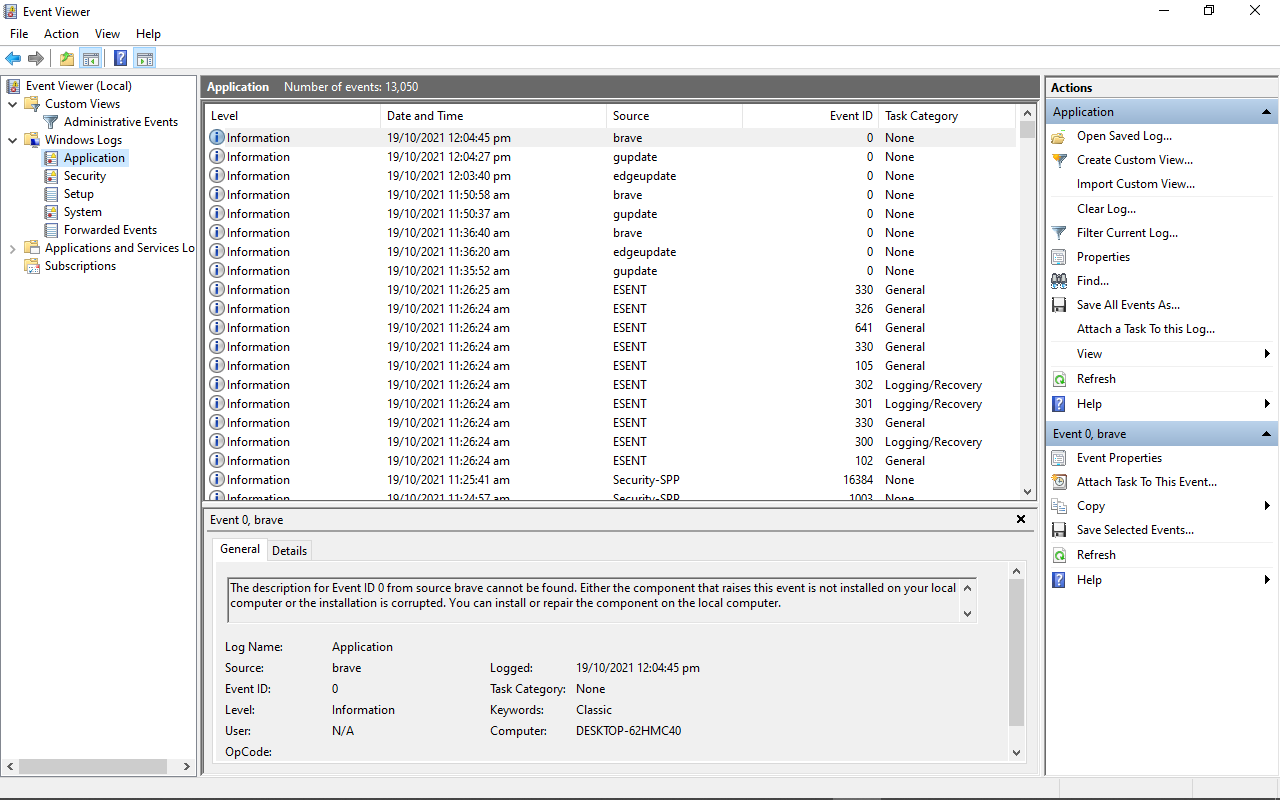
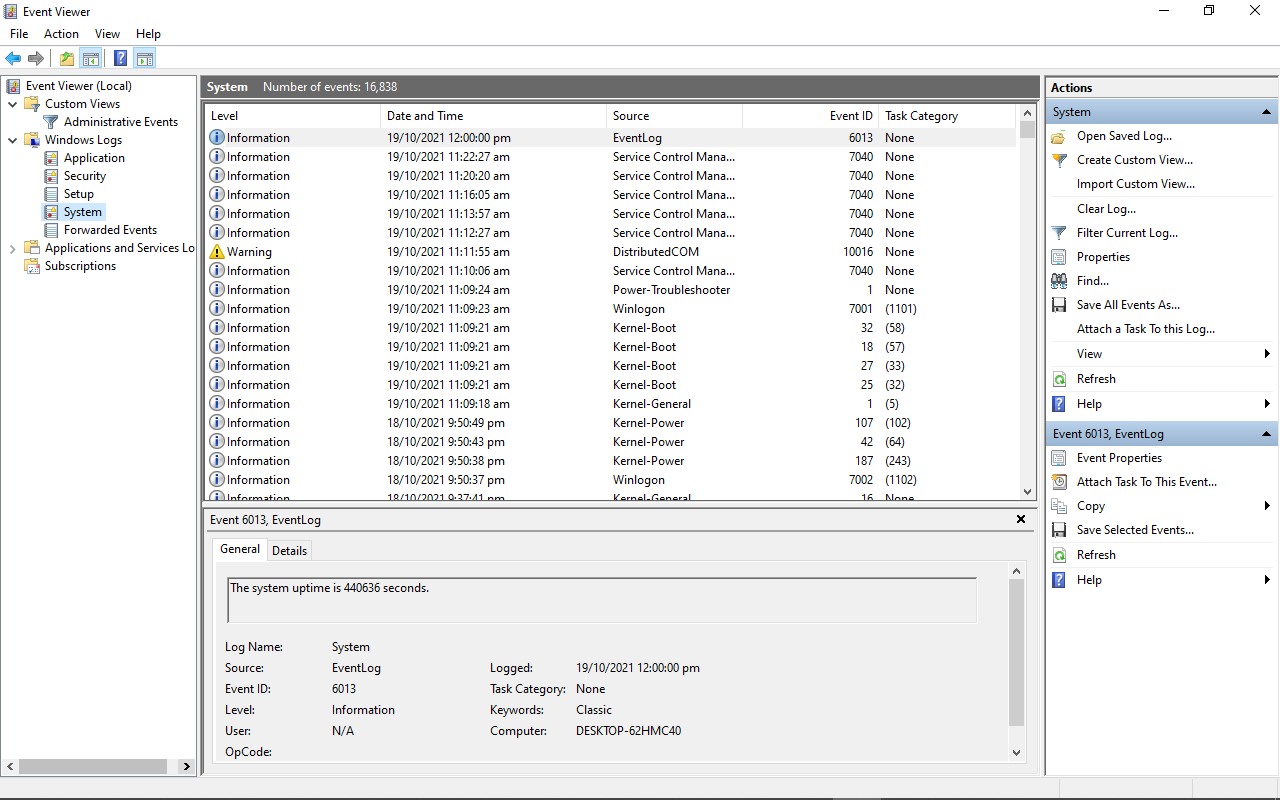
- System — Logs created by the operating system
- Application— Logged by an application hosted locally
- Setup — Logs created in the process of installing or changing the Windows
installation - Security — Logs related to logins, privileges, and other similar events
- Forwarded Events — Events forwarded by other computers
There is also a category for Applications and Services Logs, which contains
logs of the individual applications and Hardware Events. Logs from PowerShell
and other command lines will also be stored there.
Step 3 — Viewing Log Details On Detail Page
When in the default tab, this page displays the Overview and Summary. Select
some item from the previously mentioned navigation page to see more details.
There are several log levels:
- Information — Successful action
- Warning — Occurring of an event that might bring problems
- Error — Occurring of a significant problem
- Critical — Severe problem occurred
You can also see Audit successes and failures, which are associated with
security events.
Events are listed chronologically, starting with the latest event on the very
top. You can furthermore click on the columns to edit the order and groupings.
You can click on the event to view more detailed information:
You can learn more about an event by double-clicking it:
Here you can see the name of the log, source, and other information about the
log.
The following popup window also has two tabs, General and Details. The
first tab shows more information about the error as described above. The second
tab shows the raw event data. You can switch between Friendly View and XML
View.
Step 4 — Using Actions Page
The last page located by default on the right side is the Actions page,
which provides you quick access to the features available to you at the moment.
This page is divided into two parts, the first containing actions available for
the selected Navigation page. The second contains actions available to the
selected event itself.
Various options are available:
Filtering Current Log
Allows you to set criteria for events to be displayed on the Details page.
Clearing Log Events
You can choose this option if the list becomes too large. This will delete all
events stored in the current log. You can check the total number of events by
going to the top directory in the navigation page:
Exporting Log Events
You can click on the Save All Events Asor Save All Events in Custom View As
to export all of the selected events into the special event file with the
.EVTX extension.
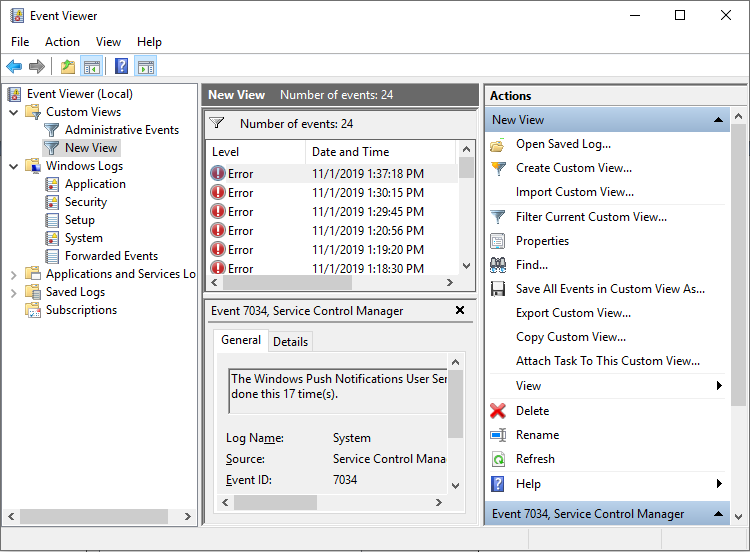
Step 5 — Creating Custom Views
Event Viewer gives you the option to create a custom view. To do so, select the
Custom Views folder on the Navigation page and click Create Custom View
on the Actions page. You can, for example, create a custom view for all Windows
Azure events with log level error that occurred in the last 12 hours:
After saving, your new view will now show in the Navigation tab.
You can also export your Custom View. Select it in the Navigation Page and find
an option called Export Custom View on the Actions Page. Enter the name for
the new .XML file you are about to create, and it is done.
You can import the custom view to any other Event Viewer by selecting the option
Import Custom View.
Navigating Summary View
The summary view is the first thing you will come in contact with when opening
the Event Viewer. It is at the top of the Navigation panel.
It includes:
- Overview
- Summary of Administrative Events — displays data and totals related to the
Event Viewer for the past week. - Recently Viewed Nodes — history of the viewed nodes filtered
chronologically while the most recent is at the top. You can double-click on
the node to open the location. - Log Summary — this section displays all of the major properties in each
log file. Double-click to get more details like the events for the viewed log.
Step 6 — Finding Other Application Logs
There are other logs with their event logging:
- DNS Manager
- IIS Access
- Task Scheduler History
- Failover Cluster Manager
- Windows Component Service
DNS Manager
If you run Windows Server that is provisioned as a DNS server, the DNS manager
is available. This manager has its list of events. From there, the DNS manager’s
event viewer works in a similar fashion as the one packed with Windows.
IIS Access
The Internet Information Services logs include info about requested URIs and
statuses. These logs are written in the location specified in the IIS Manager.
By default, the location is:
%SystemDrive%\inetpub\logs\LogFiles
Task Scheduler Library
Task scheduler schedules many sorts of background tasks and applications. The
Task Scheduler Library is associated with it, and you can view it directly from
the application:
From the summary view, you can see the overview, task status, and active tasks.
In the task status, you can view all tasks started in some period.
Double-clicking on the task will give you more information.
In the section underneath, you can see all the active tasks that are currently
enabled and have not expired. Then, by double-clicking on the summary info about
the task, which includes the task name, next run time, triggers, and location,
you can again view more information.
Using this feature, you can display details about every single task and modify
it accordingly. The action page also slightly changes, and a new section for the
selected item is viewed. You can run, end, disable, delete or export information
about the task at your will.
From the action panel, you can also create your own task by selecting the option
Create Basic Task... or adding an existing one with Import Task... After
clicking the first opinion, you are presented with a task creator wizard to add
name, description, triggers, action, and finish statement to your custom task.
Failover Cluster Manager
This is a practical built-in application when running your Windows Server. This
service allows servers to work as a cluster. When one server’s hardware fails,
it is automatically detected and replaced by the other server. All network is
then re-routed to the working instance.
This application also has its local Event Viewer. Using this event viewer, you
can discover more in the events of your clusters failing or not working as
expected.
Windows Component Service
Another application is Windows Component Service Manager. It enables us to
configure DCOM applications on Windows. You can view its logs by clicking on the
local Event Viewer:
Conclusion
Windows and applications installed or associated with the operating system keep
records of various events. Understanding and finding these events can help you
if you are a system administrator, running your Windows server, or even just a
regular user.
Now you should know how to explore and use different methods to use these logs
to your advantage. In addition, you now know how to use the task scheduler and
create your own repeating tasks using it.
Centralize all your logs into one place.
Analyze, correlate and filter logs with SQL.
Create actionable
dashboards.
Share and comment with built-in collaboration.
Got an article suggestion?
Let us know
![]()
![]()
![]()
![]()
This work is licensed under a Creative Commons Attribution-NonCommercial-ShareAlike 4.0 International License.
-
1
Open the Windows search bar. If you see the search bar next to the
menu, skip to the next step. Otherwise, press ⊞ Win+S to open it now.
-
2
Type administrative into the search bar. A list of matching results will appear.
Advertisement
-
3
Click Administrative Tools. This opens an Explorer window that contains several administrative options.
-
4
Double-click Event Viewer. It’s in the main panel. This opens the Event Viewer, where you can view different types of event logs.
-
5
Click the > next to “Windows Logs.” It’s in the left column. A list of logs that pertain to Windows will appear.
-
6
Click a log to view its contents. The log will appear in the main panel.


Advertisement
-
1
Open the Applications folder on your Mac. To do this, click the Go menu and select Applications.
-
2
Double-click the Utilities folder.[1]
-
3
Double-click Console. This opens the Console app, which is where you can view system diagnostic logs for all sorts of events.
-
4
Click All Messages. It’s near the top-left corner of the window, right above the left column. This displays all of the messages recorded by each process.
-
5
Click Errors and Faults. It’s next to the “All Messages” button. This refines the log results so it only displays errors.
-
6
Click a report under the “Reports” header. This opens reports of system or user/application events in the right panel.


Advertisement
Ask a Question
200 characters left
Include your email address to get a message when this question is answered.
Submit
Advertisement
Thanks for submitting a tip for review!
About This Article
Thanks to all authors for creating a page that has been read 21,882 times.
Is this article up to date?
-
Partition Wizard
-
Partition Magic
- How to View Windows 10 Crash Logs and Error Logs
By Irene | Follow |
Last Updated January 05, 2023
When you computer crashes, a crash log will be generated, which can help you analyze the causes of the crash. But, do you know how to view Windows 10 crash logs and error logs? If you don’t know, don’t worry. This article from MiniTool will show you how to view Windows 10 crash log with two methods.
Method 1. View Windows 10 Crash Logs with Event Viewer
To view Windows 10 crash logs, you can make use of the built-in tool Event Viewer, which keeps a log of application and system messages, errors, warnings, etc. You can follow the steps below to check Windows crash logs Windows 10 with Event Viewer.
Step 1. Type Event Viewer in the Windows 10 Cortana search box. Then right click the best match Event Viewer and choose Run as Administrator.
Step 2. Here is the main interface of Event Viewer. On the left side of the window, you can view all the Logs according to the category. To view Windows 10 crash logs such as the logs of blue screen error, just click on Windows Logs.
Step 3. Then choose System under Windows Logs.
Step 4. Find and click Error on the event list. Then you can view the detailed crash log information shown up in the bottom of the window.
You can also create a custom view so you can view the crash logs more quickly. Here are steps on how to create a custom view.
Step 1. Click on Create a Custom View on the right window. As you click on Create Custom View, a new window will pop up.
Step 2. Choose a time period you want to view. Then check the boxes next Critical, Warning and Error in the Event levels section.
Step 3. Select the By log option. Then click the drop-down menu next to Event logs, and then select Application, Security and System.
Step 4. Then click OK to save the settings.
Step 5. Name this custom view and then click OK to start to view the Windows 10 crash log.
Step 6. Then you can view all the Windows 10 crash logs during the tome period you select.
Windows Reliability Monitor also enables you to view recent system and application crashes. Here’s how to check Windows 10 crash logs with Reliability Monitor.
Method 2. View Windows 10 Crash Log with Reliability Monitor
Step 1. Type reliability in the Windows 10 Cortana search box. Then click the best match View reliability history.
Step 2. From the main interface, you can see that the Reliability Monitor window is arranged by dates. If Windows crashes or freezes, you will see a red circle with an «X» representing the failure, as shown below.
Step 3. If you want to view a certain day’s crash log, just click that day’s column and more detailed information will be displayed at the bottom. You can also double click one of the listed events to open a new window with more information.
Conclusion
Event viewer and Reliability Monitor are all good for you to check Windows 10 crash logs. Choose a tool you like and you can get all the Windows crash log information.
The Windows 10 Event Viewer is an app that shows a log detailing information about significant events on your computer. This information includes automatically downloaded updates, errors, and warnings.
In this article, you’ll learn what the event viewer is, the different logs it has, and most importantly, how to access it on a Windows 10 computer.
What is the Event Viewer?
Each program you open on your Windows 10 computer sends a notification to a particular activity log in the Event Viewer.
All other activity such as OS changes, security updates, driver quirks, hardware failure, and so on are also posted to a particular log. So you can think of the event viewer as a database that records every activity on your computer.
With the event viewer, you can troubleshoot different Windows and application issues.
If you explore the event viewer in-depth, you will see different information, warnings, and plenty of errors. Don’t freak out – this is normal. Even the best-maintained computers show plenty of errors and warnings.
There are 3 main ways you can gain access to the event viewer on Windows 10 – via the Start menu, Run dialogue, and the command line.
Step 1: Click on Start or press the WIN (Windows) key on your keyboard
Step 2: Search for “Event Viewer”
Step 3: Click on the first search result or press ENTER
You will be greeted with this page:
How to Access the Windows 10 Activity Log through the Run Dialogue
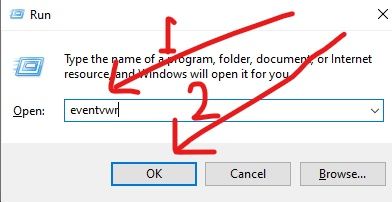
Step 1: Right-click on Start (Windows log) and select “Run”, or press WIN (Windows key) + R on your keyboard
Step 2: Type in “eventvwr” to the editor and click “Ok” or hit ENTER
How to Access the Windows 10 Activity Log through the Command Prompt
Step 1: Click on Start (Windows logo) and search for “cmd”
Step 2: Hit Enter or click on the first search result (should be the command prompt) to launch the command prompt
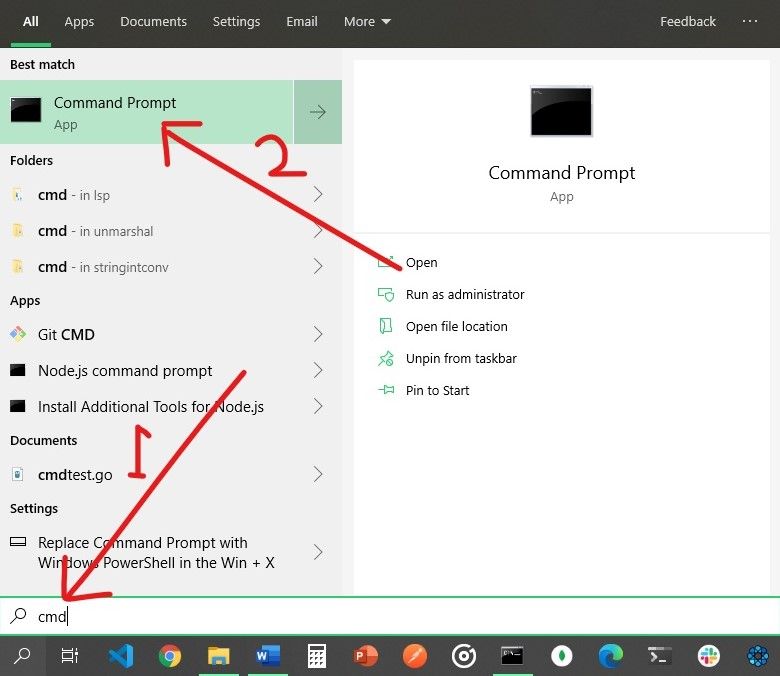
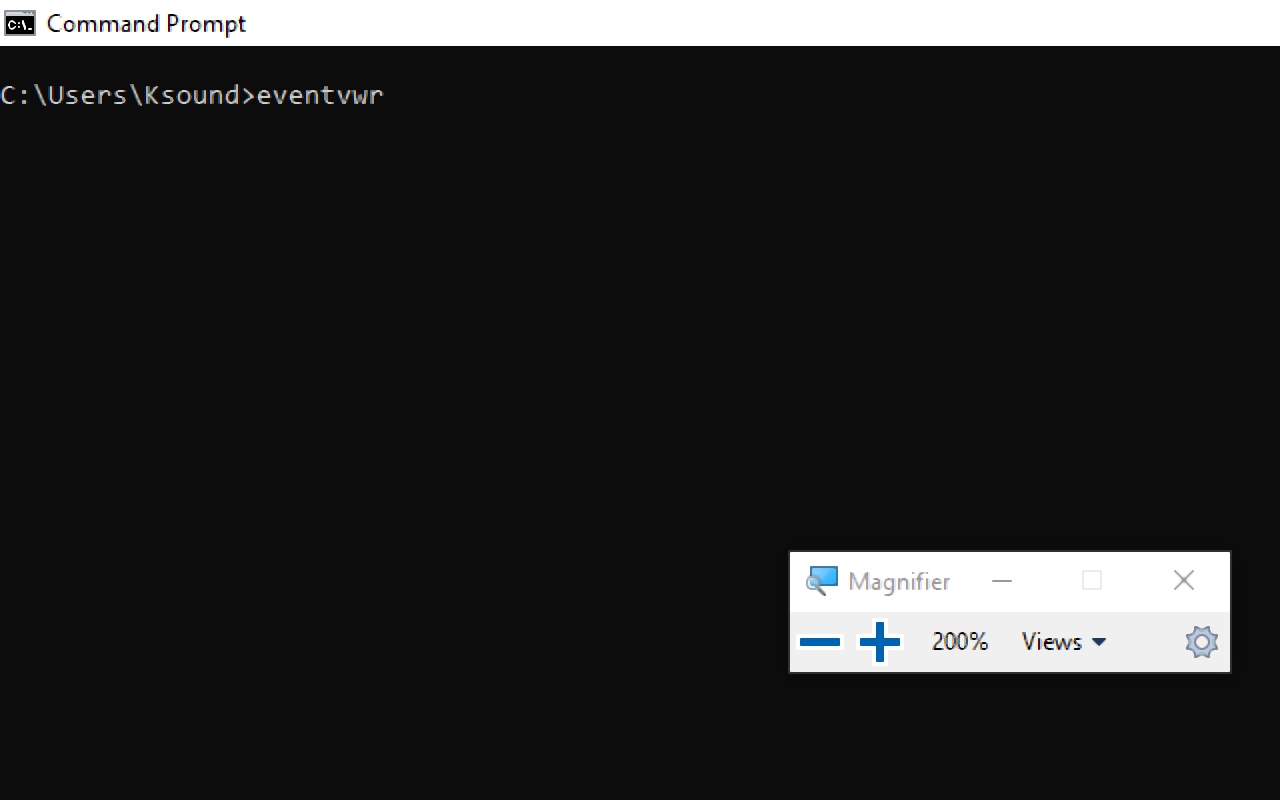
Step 3: Type in “eventvwr” and hit ENTER
Event Viewer Activity Logs
When you open the event viewer to see your computer’s activity logs, you are automatically shown the Event Viewer (Local) tab. But this might not contain the details you need, as it’s just a page you are greeted with when you open the Event Viewer.
There is lots more to the Event Viewer than this.
The Administrative Events Log
You can expand the Custom Views tab to see your computer’s administrative events, like this:
The Windows Activity Logs
You can also expand the Windows Logs to show various activities such as:
-
Application Events: Information, errors, and warning reports of program activities

-
Security Events: This shows the results of various security actions. They are called audits and each of them can be a success or a failure
-
Setup Event: this has to do with domain controllers, which is a server that verifies users on computer networks. You shouldn’t worry about them day-to-day.
-
System Events: these are reports from system files detailing the errors they have encountered
-
Forwarded Events: these are sent to your computer from other computers in the same network. They help you keep track of the event logs of other computers in the same newtwork.


In addition, there are the Application and Service logs, which show hardware and Internet Explorer activities, alongside Microsoft Office apps activities.
You can double click on an error to check its properties, and look up the event ID of the error online. This can help you discover more information on the error so you can fix it if you need to.
Conclusion
In this article, you learned about the Windows 10 Event Viewer, which is a very powerful tool Windows users should know how to use.
Apart from viewing various activity logs, it also helps you be aware of what’s happening on your computer.
Thank you for reading. If you consider this article helpful, please share it with your friends and family.
Learn to code for free. freeCodeCamp’s open source curriculum has helped more than 40,000 people get jobs as developers. Get started