Contents
Introduction
This chapter presents general troubleshooting information and a discussion of tools and techniques for troubleshooting serial connections. The chapter consists of the following sections:
-
Troubleshooting Using the show interfaces serial Command
-
Using the show controllers Command
-
Using debug Commands
-
Using Extended ping Tests
-
Troubleshooting Clocking Problems
-
Adjusting Buffers
-
Special Serial Line Tests
-
Detailed Information on the show interfaces serial Command
-
Troubleshooting T1 Problems
-
Troubleshooting E1 Problems
Prerequisites
Requirements
Readers of this document should be knowledgeable of the following definitions.
-
DTE = data terminal equipment
-
CD = Carrier Detect
-
CSU = channel service unit
-
DSU = digital service unit
-
SCTE = serial clock transmit external
-
DCE = data circuit-terminating equipment
-
CTS = clear-to-send
-
DSR = data-set ready
-
SAP = Service Advertising Protocol
-
IPX = Internetwork Packet Exchange
-
FDDI = Fiber Distributed Data Interface
-
ESF = Extended Superframe Format
-
B8ZS = binary eight-zero substitution
-
LBO = Line Build Out
Components Used
This document is not restricted to specific software and hardware versions.
The information presented in this document was created from devices in a specific lab environment. All of the devices used in this document started with a cleared (default) configuration. If you are working in a live network, ensure that you understand the potential impact of any command before using it.
Conventions
For more information on document conventions, see the Cisco Technical Tips Conventions.
Troubleshooting Using the show interfaces serial Command
The output of the show interfaces serial EXEC command displays information specific to serial interfaces. Figure 15-1 shows the output of the show interfaces serial EXEC command for a High-Level Data Link Control (HDLC) serial interface.
This section describes how to use the show interfaces serial command to diagnose serial line connectivity problems in a wide area network (WAN) environment. The following sections describe some of the important fields of the command output.
Other fields shown in the display are described in detail in the section «Detailed Information on the show interfaces serial Command,» later in this chapter.
Serial Lines: show interfaces serial Status Line Conditions
You can identify five possible problem states in the interface status line of the show interfaces serial display (see Figure 15-1):
-
Serial x is down, line protocol is down
-
Serial x is up, line protocol is down
-
Serial x is up, line protocol is up (looped)
-
Serial x is up, line protocol is down (disabled)
-
Serial x is administratively down, line protocol is down
Figure 15-1 Output of the HDLC show interface serial Command
Table 15-1: Serial Lines: show interfaces serial Status Line Conditions — This table shows the interface status conditions, possible problems associated with the conditions, and solutions to those problems.
| Status Line Condition | Possible Problem | Solution |
|---|---|---|
| Serial x is up, line protocol is up | This is the proper status line condition. No action required. | |
| Serial x is down, line protocol is down (DTE mode) |
|
|
| Serial x is up, line protocol is down (DTE mode) |
|
|
| Serial x is up, line protocol is down (DCE mode) |
|
|
| Serial x is up, line protocol is up (looped) | A loop exists in the circuit. The sequence number in the keepalive packet changes to a random number when a loop is initially detected. If the same random number is returned over the link, a loop exists. |
|
| Serial x is up, line protocol is down (disabled) |
|
|
| Serial x is administratively down, line protocol is down |
|
|
Serial Lines: Increasing Output Drops on Serial Link
Output drops appear in the output of the show interfaces serial command (see Figure 15-1) when the system is attempting to hand off a packet to a transmit buffer but no buffers are available.
Symptom: An increasing number of output drops on serial link.
Table 15-2 Serial Lines: Increasing Output Drops on Serial Link — This table outlines the possible problem that may cause this symptom and suggests solutions.
| Possible Problem | Solution |
|---|---|
| Input rate to serial interface exceeds bandwidth available on serial link |
Note: Output drops are acceptable under certain conditions. For instance, if a link is known to be overused (with no way to remedy the situation), it is often preferable to drop packets than to hold them. This is true for protocols that support flow control and can retransmit data (such as TCP/IP and Novell IPX). However, some protocols, such as DECnet and local-area transport are sensitive to dropped packets and accommodate retransmission poorly, if at all. |
Serial Lines: Increasing Input Drops on Serial Link
Input drops appear in the output of the show interfaces serial EXEC command (see Figure 15-1) when too many packets from that interface are still being processed in the system.
Symptom: An increasing number of input drops on serial link.
Table 15-3: Serial Lines: Increasing Input Drops on Serial Link — This table outlines the possible problem that may cause this symptom and suggests solutions.
| Possible Problem | Solution |
|---|---|
| Input rate exceeds the capacity of the router or input queues exceed the size of output queues |
Note: Input drop problems are typically seen when traffic is being routed between faster interfaces (such as Ethernet, Token Ring, and FDDI) and serial interfaces. When traffic is light, there is no problem. As traffic rates increase, backups start occurring. Routers drop packets during these congested periods.
|
Serial Lines: Increasing Input Errors in Excess of One Percent of Total Interface Traffic
If input errors appear in the show interfaces serial output (see Figure 15-1), there are several possible sources of those errors. The most likely sources are summarized in Table 15-4.
Note: Any input error value for cyclic redundancy check (CRC) errors, framing errors, or aborts above one percent of the total interface traffic suggests some kind of link problem that should be isolated and repaired.
Symptom: An increasing number of input errors in excess of one percent of total interface traffic.
Table 15-4: Serial Lines: Increasing Input Errors in Excess of One Percent of Total Interface Traffic
| Possible Problem | Solution |
|---|---|
The following problems can result in this symptom:
|
Note: Cisco strongly recommends not using data converters when you are connecting a router to a WAN or serial network.
|
Serial Lines: Troubleshooting Serial Line Input Errors
Table 15-5: This table describes the various types of input errors displayed by the show interfaces serial command (see Figure 15-1), possible problems that may be causing the errors and the solutions to those problems.
| Input Error Type (Field Name) | Possible Problem | Solution |
|---|---|---|
| CRC errors (CRC) | CRC errors occur when the CRC calculation does not pass-indicating that data is corrupted-for one of the following reasons:
|
|
| Framing errors (frame) | A framing error occurs when a packet does not end on an 8-bit byte boundary for one of the following reasons:
|
|
| Aborted transmission (abort) | Aborts indicate an illegal sequence of one bits (more than seven in a row). The following are possible reasons for this occurrence:
|
|
Serial Lines: Increasing Interface Resets on Serial Link
Interface resets that appear in the output of the show interfaces serial EXEC command (see Figure 15-1) are the result of missed keep-alive packets.
Symptom: An increasing number of interface resets on serial link.
Table 15-6: This table outlines the possible problems that may cause this symptom and suggests solutions.
| Possible Problem | Solution |
|---|---|
The following problems can result in this symptom:
|
When interface resets are occurring, examine other fields of the show interfaces serial command output to determine the source of the problem. Assuming that an increase in interface resets is being recorded, examine the following fields:
|
Serial Lines: Increasing Carrier Transitions Count on Serial Link
Carrier transitions appear in the output of the show interfaces serial EXEC command whenever there is an interruption in the carrier signal (such as an interface reset at the remote end of a link).
Symptom: An increasing number of carrier transitions count on serial link.
Table 15-7 outlines the possible problems that may cause this symptom and suggests solutions.
Table 15-7: Serial Lines: Increasing Carrier Transitions Count on Serial Link
| Possible Problem | Solution |
|---|---|
The following problems can result in this symptom:
|
|
Using the show controllers Command
The show controllers EXEC command is another important diagnostic tool when troubleshooting serial lines. The command syntax varies depending on the platform:
-
For serial interfaces on Cisco 7000 series routers, use the show controllers cbus EXEC command.
-
For Cisco access products, use the show controllers EXEC command.
-
For the AGS, CGS, and MGS, use the show controllers mci EXEC command.
Figure 15-2 shows the output from the show controllers cbus EXEC command. This command is used on Cisco 7000 series routers with the Fast Serial Interface Processor (FSIP) card. Check the command output to make certain that the cable to the channel service unit/digital service unit (CSU/DSU) is attached to the proper interface. You can also check the microcode version to see if it is current.
Figure 15-2: show controllers cbus Command Output
On access products such as the Cisco 2000, Cisco 2500, Cisco 3000, and Cisco 4000 series access servers and routers, use the show controllers EXEC command. Figure 15-3 shows the show controllers command output from the Basic Rate Interface (BRI) and serial interfaces on a Cisco 2503 access server. (Note that some output is not shown.)
The show controllers output indicates the state of the interface channels and whether a cable is attached to the interface. In Figure 15-3, serial interface 0 has an RS-232 DTE cable attached. Serial interface 1 has no cable attached.
Figure 15-4 shows the output of the show controllers mci command. This command is used on AGS, CGS, and MGS routers only. If the electrical interface is displayed as UNKNOWN (instead of V.35, EIA/TIA-449, or some other electrical interface type), an improperly connected cable is the likely problem. A bad applique or a problem with the internal wiring of the card is also possible. If the electrical interface is unknown, the corresponding display for the show interfaces serial EXEC command will show that the interface and line protocol are down.
Figure 15-3: show controllers Command Output
Figure 15-4: show controllers mci Command Output
Using debug Commands
The output of the various debug privileged EXEC commands provides diagnostic information relating to protocol status and network activity for many internetworking events.
 Caution: Because debugging output is assigned a high priority in the CPU process, it can render the system unusable. For this reason, use debug commands only to troubleshoot specific problems or during troubleshooting sessions with Cisco technical support staff. Moreover, it is best to use debug commands during periods of low network traffic and fewer users. Debugging during these periods decreases the likelihood that increased debug command processing overhead will affect system use. When you finish using a debug command, remember to disable it with its specific no debug command or with the no debug all command.
The following debug commands are useful when troubleshooting serial and WAN problems. More information about the function and output of each of these commands is provided in the Debug Command Reference publication:
-
debug serial interface— Verifies whether HDLC keepalive packets are incrementing. If they are not, a possible timing problem exists on the interface card or in the network.
-
debug x25 events— Detects X.25 events, such as the opening and closing of switched virtual circuits (SVCs). The resulting «cause and diagnostic» information is included with the event report.
-
debug lapb— Outputs Link Access Procedure, Balanced (LAPB) or Level 2 X.25 information.
-
debug arp— Indicates whether the router is sending information about or learning about routers (with ARP packets) on the other side of the WAN cloud. Use this command when some nodes on a TCP/IP network are responding but others are not.
-
debug frame-relay lmi— Obtains Local Management Interface (LMI) information useful for determining if a Frame Relay switch and a router are sending and receiving LMI packets.
-
debug frame-relay events— Determines if exchanges are occurring between a router and a Frame Relay switch.
-
debug ppp negotiation— Shows Point-to-Point Protocol (PPP) packets transmitted during PPP startup, where PPP options are negotiated.
-
debug ppp packet— Shows PPP packets being sent and received. This command displays low-level packet dumps.
-
debug ppp errors— Shows PPP errors (such as illegal or malformed frames) associated with PPP connection negotiation and operation.
-
debug ppp chap— Shows PPP Challenge Handshake Authentication Protocol (CHAP) and Password Authentication Protocol (PAP) packet exchanges.
-
debug serial packet— Shows Switched Multimegabit Data Service (SMDS) packets being sent and received. This display also prints error messages to indicate why a packet was not sent or was received erroneously. For SMDS, the command dumps the entire SMDS header and some payload data when an SMDS packet is transmitted or received.
Using Extended ping Tests
The ping command is a useful test available on Cisco internetworking devices as well as on many host systems. In TCP/IP, this diagnostic tool is also known as an Internet Control Message Protocol (ICMP) Echo Request.
Note: The ping command is particularly useful when high levels of input errors are being registered in the show interfaces serial display. See Figure 15-1.
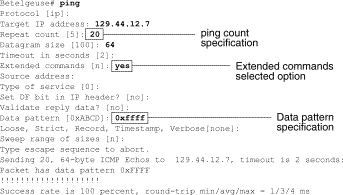
Cisco internetworking devices provide a mechanism to automate the sending of many ping packets in sequence. Figure 15-5 illustrates the menu used to specify extended ping options. This example specifies 20 successive pings. However, when testing the components on your serial line, you should specify a much larger number, such as 1000 pings.
Figure 15-5: Extended ping Specification Menu
Performing Ping Tests
In general, perform serial line ping tests as follows:
-
Put the CSU or DSU into local loopback mode.
-
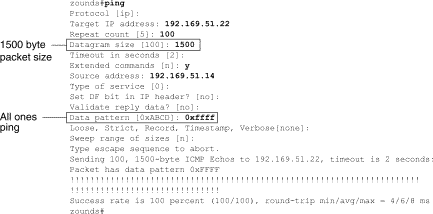
Configure the extended ping command to send different data patterns and packet sizes. Figure 15-6 and Figure 15-7 illustrate two useful ping tests, an all-zeros (1500-byte) ping and an all-ones (1500-byte) ping, respectively.
-
Examine the show interfaces serial command output (see Figure 15-1) and determine whether input errors have increased. If input errors have not increased, the local hardware (DSU, cable, router interface card) is probably in good condition.
Assuming that this test sequence was prompted by the appearance of a large number of CRC and framing errors, a clocking problem is likely. Check the CSU or DSU for a timing problem. See the section «Troubleshooting Clocking Problems,» later in this chapter.
-
If you determine that the clocking configuration is correct and is operating properly, put the CSU or DSU into remote loopback mode.
-
Repeat the ping test and look for changes in the input error statistics.
-
If input errors increase, there is either a problem in the serial line or on the CSU/DSU. Contact the WAN service provider and swap the CSU or DSU. If problems persist, contact your technical support representative.
Figure 15-6: ALl-Zeros 1500-Byte ping Test
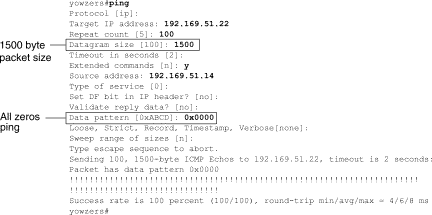
Figure 15-7 All-Ones 1500-Byte ping Test
Troubleshooting Clocking Problems
Clocking conflicts in serial connections can lead either to chronic loss of connection service or to degraded performance. This section discusses the important aspects of clocking problems: clocking problem causes, detecting clocking problems, isolating clocking problems, and clocking problem solutions.
Clocking Overview
The CSU/DSU derives the data clock from the data that passes through it. In order to recover the clock, the CSU/DSU hardware must receive at least one 1-bit value for every 8 bits of data that pass through it; this is known as ones density. Maintaining ones density allows the hardware to recover the data clock reliably.
Newer T1 implementations commonly use Extended Superframe Format (ESF) framing with binary eight-zero substitution (B8ZS) coding. B8ZS provides a scheme by which a special code is substituted whenever eight consecutive zeros are sent through the serial link. This code is then interpreted at the remote end of the connection. This technique guarantees ones density independent of the data stream.
Older T1 implementations use D4-also known as Superframe Format (SF) framing and Alternate Mark Inversion (AMI) coding. AMI does not utilize a coding scheme like B8ZS. This restricts the type of data that can be transmitted because ones density is not maintained independent of the data stream.
Another important element in serial communications is serial clock transmit external (SCTE) terminal timing. SCTE is the clock echoed back from the data terminal equipment (DTE) device (for example, a router) to the data communications equipment (DCE) device (for example, the CSU/DSU).
When the DCE device uses SCTE instead of its internal clock to sample data from the DTE, it is better able to sample the data without error even if there is a phase shift in the cable between the CSU/DSU and the router. Using SCTE is highly recommended for serial transmissions faster than 64 kbps. If your CSU/DSU does not support SCTE, see the section «Inverting the Transmit Clock,» later in this chapter.
Clocking Problem Causes
In general, clocking problems in serial WAN interconnections can be attributed to one of the following causes:
-
Incorrect DSU configuration
-
Incorrect CSU configuration
-
Cables out of specification-that is, longer than 50 feet (15.24 meters) or unshielded
-
Noisy or poor patch panel connections
-
Several cables connected together in a row
Detecting Clocking Problems
To detect clocking conflicts on a serial interface, look for input errors as follows:
-
Use the show interfaces serial EXEC command on the routers at both ends of the link.
-
Examine the command output for CRC, framing errors, and aborts.
-
If either of these steps indicates errors exceeding an approximate range of 0.5 percent 2.0 percent of traffic on the interface, clocking problems are likely to exist somewhere in the WAN.
-
Isolate the source of the clocking conflicts as outlined in the following section, «Isolating Clocking Problems.»
-
Bypass or repair any faulty patch panels.
Isolating Clocking Problems
After you determine that clocking conflicts are the most likely cause of input errors, the following procedure will help you isolate the source of those errors:
-
Perform a series of ping tests and loopback tests (both local and remote), as described in the section «CSU and DSU Loopback Tests,» earlier in this chapter.
-
Determine the end of the connection that is the source of the problem, or if the problem is in the line. In local loopback mode, run different patterns and sizes in the ping tests (for example, use 1500-byte datagrams). Using a single pattern and packet size may not force errors to materialize, particularly when a serial cable to the router or CSU/DSU is the problem.
-
Use the show interfaces serial EXEC command and determine if input errors counts are increasing and where they are accumulating.
If input errors are accumulating on both ends of the connection, clocking of the CSU is the most likely problem.
If only one end is experiencing input errors, there is probably a DSU clocking or cabling problem.
Aborts on one end suggests that the other end is sending bad information or that there is a line problem.
Note: Always refer to the show interfaces serial command output (see Figure 15-1) and log any changes in error counts or note if the error count does not change.
Clocking Problem Solutions
Table 15-8 Serial Lines: Clocking Problems and Solutions: This table outlines suggested remedies for clocking problems, based on the source of the problem.
| Possible Problem | Solution |
|---|---|
| Incorrect CSU configuration |
|
| Incorrect DSU configuration |
|
| Cable to router is out of specification | If the cable is longer than 50 feet (15.24 meters), use a shorter cable. If the cable is unshielded, replace it with shielded cable. |
Inverting the Transmit Clock
If you are attempting serial connections at speeds greater than 64 kbps with a CSU/DSU that does not support SCTE, you may have to invert the transmit clock on the router. Inverting the transmit clock compensates for phase shifts between the data and clock signals.
The specific command used to invert the transmit clock varies between platforms. On a Cisco 7000 series router, enter the invert-transmit-clock interface configuration command. For Cisco 4000 series routers, use the dte-invert-txc interface configuration command.
To ensure that you are using the correct command syntax for your router, refer to the user guide for your router or access server and to the Cisco IOS configuration guides and command references.
Note: On older platforms, inverting the transmit clock may require that you move a physical jumper.
Adjusting Buffers
Excessively high bandwidth utilization (over 70percent) results in reduced overall performance and can cause intermittent failures. For example, DECnet file transmissions may be failing due to packets being dropped somewhere in the network.
If the situation is bad enough, you must increase the bandwidth of the link. However, increasing the bandwidth may not be necessary or immediately practical. One way to resolve marginal serial line overutilization problems is to control how the router uses data buffers.
Caution: In general, do not adjust system buffers unless you are working closely with a Cisco technical support representative. You can severely affect the performance of your hardware and your network if you incorrectly adjust the system buffers on your router.
Use one of the following three options to control how buffers are used:
-
Adjust parameters associated with system buffers
-
Specify the number of packets held in input or output queues (hold queues)
-
Prioritize how traffic is queued for transmission (priority output queuing)
The configuration commands associated with these options are described in the Cisco IOS configuration guides and command references.
The following section focuses on identifying situations in which these options are likely to apply and defining how you can use these options to help resolve connectivity and performance problems in serial/WAN interconnections.
Tuning System Buffers
There are two general buffer types on Cisco routers: hardware buffers and system buffers. Only the system buffers are directly configurable by system administrators. The hardware buffers are specifically used as the receive and transmit buffers associated with each interface and (in the absence of any special configuration) are dynamically managed by the system software itself.
The system buffers are associated with the main system memory and are allocated to different-size memory blocks. A useful command for determining the status of your system buffers is the show buffers EXEC command. Figure 15-8 shows the output from the show buffers command.
Figure 15-8 show buffers Command Output
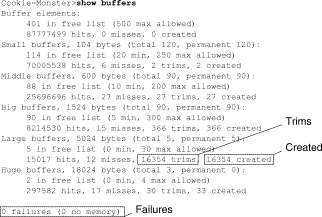
In the show buffers output:
-
total— Identifies the total number of buffers in the pool, including used and unused buffers.
-
permanent— Identifies the permanent number of allocated buffers in the pool. These buffers are always in the pool and cannot be trimmed away.
-
in free list— Identifies the number of buffers currently in the pool that are available for use.
-
min— Identifies the minimum number of buffers that the Route Processor (RP) should attempt to keep in the free list:
-
The min parameter is used to anticipate demand for buffers from the pool at any given time.
-
If the number of buffers in the free list falls below the min value, the RP attempts to create more buffers for that pool.
-
-
max allowed— Identifies the maximum number of buffers allowed in the free list:
-
The max allowed parameter prevents a pool from monopolizing buffers that it doesn’t need anymore and frees this memory back to the system for further use.
-
If the number of buffers in the free list is greater than the max allowed value, the RP should attempt to trim buffers from the pool.
-
-
hits— Identifies the number of buffers that have been requested from the pool. The hits counter provides a mechanism for determining which pool must meet the highest demand for buffers.
-
misses— Identifies the number of times a buffer has been requested and the RP detected that additional buffers were required. (In other words, the number of buffers in the free list has dropped below min.) The misses counter represents the number of times the RP has been forced to create additional buffers.
-
trims— Identifies the number of buffers that the RP has trimmed from the pool when the number of buffers in the free list exceeded the number of max allowed buffers.
-
created— Identifies the number of buffers that have been created in the pool. The RP creates buffers when demand for buffers has increased until the number of buffers in the free list is less than min buffers and/or a miss occurs because of zero buffers in the free list.
-
failures— Identifies the number of failures to grant a buffer to a requester even after attempting to create an additional buffer. The number of failures represents the number of packets that have been dropped due to buffer shortage.
-
no memory— Identifies the number of failures caused by insufficient memory to create additional buffers.
The show buffers command output in Figure 15-8 indicates high numbers in the trims and created fields for large buffers. If you are receiving high numbers in these fields, you can increase your serial link performance by increasing the max free value configured for your system buffers. trims identifies the number of buffers that the RP has trimmed from the pool when the number of buffers in free list exceeded the number of max allowed buffers.
Use the buffers max free number global configuration command to increase the number of free system buffers. The value you configure should be approximately 150 percent of the figure indicated in the total field of the show buffers command output. Repeat this process until the show buffers output no longer indicates trims and created buffers.
If the show buffers command output shows a large number of failures in the (no memory) field (see the last line of output in Figure 15-8), you must reduce the usage of the system buffers or increase the amount of shared or main memory (physical RAM) on the router. Call your technical support representative for assistance.
Implementing Hold Queue Limits
Hold queues are buffers used by each router interface to store outgoing or incoming packets. Use the hold-queue interface configuration command to increase the number of data packets queued before the router will drop packets. Increase these queues by small increments (for instance, 25 percent) until you no longer see drops in the show interfaces output. The default output hold queue limit is 100 packets.
Note: The hold-queue command is used for process-switched packets and periodic updates generated by the router.
Use the hold-queue command to prevent packets from being dropped and to improve serial-link performance under the following conditions:
-
You have an application that cannot tolerate drops and the protocol is able to tolerate longer delays. DECnet is an example of a protocol that meets both criteria. Local-area transport (LAT) does not because it does not tolerate delays.
-
The interface is very slow. Bandwidth is low or anticipated utilization is likely to sporadically exceed available bandwidth.
Note: When you increase the number specified for an output hold queue, you may need to increase the number of system buffers. The value used depends on the size of the packets associated with the traffic anticipated for the network.
Using Priority Queuing to Reduce Bottlenecks
Priority queuing is a list-based control mechanism that allows traffic to be prioritized on an interface-by-interface basis. Priority queuing involves two steps:
-
Create a priority list by protocol type and level of priority.
-
Assign the priority list to a specific interface.
Both of these steps use versions of the priority-list global configuration command. In addition, further traffic control can be applied by referencing access-list global configuration commands from priority-list specifications. For examples of defining priority lists and for details about command syntax associated with priority queuing, refer to the Cisco IOS configuration guides and command references.
Note: Priority queuing automatically creates four hold queues of varying size. This overrides any hold queue specification included in your configuration.
Use priority queuing to prevent packets from being dropped and to improve serial link performance under the following conditions:
-
When the interface is slow, there is a variety of traffic types being transmitted, and you want to improve terminal traffic performance.
-
If you have a serial link that is intermittently experiencing very heavy loads (such as file transfers occurring at specific times) priority queuing will help select which types of traffic should be discarded at high traffic periods.
In general, start with the default number of queues when implementing priority queues. After enabling priority queuing, monitor output drops with the show interfaces serial EXEC command. If you notice that output drops are occurring in the traffic queue you have specified to be high priority, increase the number of packets that can be queued (using the queue-limit keyword option of the priority-list global configuration command). The default queue-limit arguments are 20 packets for the high-priority queue, 40 for medium, 60 for normal, and 80 for low.
Note: When bridging Digital Equipment Corporation (DEC) LAT traffic, the router must drop very few packets, or LAT sessions can terminate unexpectedly. A high-priority queue depth of about 100 (specified with the queue-limit keyword) is a typical working value when your router is dropping output packets and the serial lines are subjected to about 50 percent bandwidth utilization. If the router is dropping packets and is at 100 percent utilization, you need another line.
Another tool to relieve congestion when bridging DEC LAT is LAT compression. You can implement LAT compression with the interface configuration command bridge-group group lat-compression.
Special Serial Line Tests
In addition to the basic diagnostic capabilities available on routers, a variety of supplemental tools and techniques can be used to determine the conditions of cables, switching equipment, modems, hosts, and remote internetworking hardware. For more information, consult the documentation for your CSU, DSU, serial analyzer, or other equipment.
CSU and DSU Loopback Tests
If the output of the show interfaces serial EXEC command indicates that the serial line is up but the line protocol is down, use the CSU/DSU loopback tests to determine the source of the problem. Perform the local loop test first, and then the remote test. Figure 15-9 illustrates the basic topology of the CSU/DSU local and remote loopback tests.
Figure 15-9: CSU/DSU Local and Remote Loopback Tests
Note: These tests are generic in nature and assume attachment of the internetworking system to a CSU or DSU. However, the tests are essentially the same for attachment to a multiplexer with built-in CSU/DSU functionality. Because there is no concept of a loopback in X.25 or Frame Relay packet-switched network (PSN) environments, loopback tests do not apply to X.25 and Frame Relay networks.
CSU and DSU Local Loopback Tests for HDLC or PPP Links
Listed below is a general procedure for performing loopback tests in conjunction with built-in system diagnostic capabilities:
-
Place the CSU/DSU in local loop mode (refer to your vendor documentation). In local loop mode, the use of the line clock (from the T1 service) is terminated, and the DSU is forced to use the local clock.
-
Use the show interfaces serial EXEC command to determine if the line status changes from «line protocol is down» to «line protocol is up (looped),» or if it remains down.
-
If the line protocol comes up when the CSU or DSU is in local loopback mode, this suggests that the problem is occurring on the remote end of the serial connection. If the status line does not change state, there is a possible problem in the router, connecting cable, or CSU/DSU.
-
If the problem appears to be local, use the debug serial interface privileged EXEC command.
-
Take the CSU/DSU out of local loop mode. When the line protocol is down, the debug serial interface command output will indicate that keepalive counters are not incrementing.
-
Place the CSU/DSU in local loop mode again. This should cause the keepalive packets to begin to increment. Specifically, the values for mineseen and yourseen keepalives will increment every 10 seconds. This information will appear in the debug serial interface output.
If the keepalives do not increment, there may be a timing problem on the interface card or on the network. For information on correcting timing problems, see the section «Troubleshooting Clocking Problems,» earlier in this chapter.
If the keepalives do not increment, there may be a timing problem on the interface card or on the network. For information on correcting timing problems, see the section «Troubleshooting Clocking Problems,» earlier in this chapter.
-
Check the local router, CSU/DSU hardware, and any attached cables. Make certain that the cables are within the recommended lengths-no more than 50 feet (15.24 meters) or 25 feet (7.62 meters) for a T1 link. Make certain the cables are attached to the proper ports. Swap faulty equipment as necessary.
Figure 15-10 shows the output from the debug serial interface command for an HDLC serial connection, with missed keepalives causing the line to go down and the interface to reset.
Figure 15-10: debug serial interface Command Output
CSU and DSU Remote Loopback Tests for HDLC or PPP Links
If you determine that the local hardware is functioning properly but you still encounter problems when attempting to establish connections over the serial link, try using the remote loopback test to isolate the problem cause.
Note: This remote loopback test assumes that HDLC encapsulation is being used and that the preceding local loop test was performed immediately before this test.
The following steps are required to perform loopback testing:The following steps are required to perform loopback testing:
-
Put the remote CSU or DSU into remote loopback mode (refer to the vendor documentation).
-
Using the show interfaces serial EXEC command, determine if the line protocol remains up with the status line indicating «Serial x is up, line protocol is up (looped),» or if it goes down with the status line indicating «line protocol is down.»
-
If the line protocol remains up (looped), the problem is probably at the remote end of the serial connection (between the remote CSU/DSU and the remote router). Perform both local and remote tests at the remote end to isolate the problem source.
-
If the line status changes to «line protocol is down» when remote loopback mode is activated, make sure that ones density is being properly maintained. The CSU/DSU must be configured to use the same framing and coding schemes used by the leased-line or other carrier service (for example, ESF and B8ZS).
-
If problems persist, contact your WAN network manager or the WAN service organization.
Detailed Information on the show interfaces serial Command
The following sub-sections cover the show interfaces serial command’s parameters, syntax description, sample output display, and field descriptions.
show interfaces serial Parameters
To display information about a serial interface, use the show interfaces serial privileged EXEC command:
show interfaces serial [number] [accounting]
show interfaces serial [number [:channel-group] [accounting] (Cisco 4000 series)
show interfaces serial [slot | port [:channel-group]] [accounting] (Cisco 7500 series)
show interfaces serial [type slot | port-adapter | port] [serial]
(ports on VIP cards in the Cisco 7500 series)
show interfaces serial [type slot | port-adapter | port] [:t1-channel] [accounting | crb]
(CT3IP in Cisco 7500 series)
Syntax Description
-
number-Optional. Port number.
-
accounting-Optional. Displays the number of packets of each protocol type that have been sent through the interface.
-
:channel-group -Optional. On the Cisco 4000 series with an NPM or a Cisco 7500 series with a MIP, specifies the T1 channel-group number in the range of 0 to 23, defined with the channel-group controller configuration command.
-
slot -Refers to the appropriate hardware manual for slot information.
-
port -Refers to the appropriate hardware manual for port information.
-
port-adapter -Refers to the appropriate hardware manual for information about port adapter compatibility.
-
:t1-channel -Optional. For the CT3IP, the T1 channel is a number between 1 and 28.
-
T1 channels on the CT3IP are numbered 1 to 28 rather than the more traditional zero-based scheme (0 to 27) used with other Cisco products. This is to ensure consistency with Telco numbering schemes for T1 channels within channelized T3 equipment.
-
crb-Optional. Shows interface routing and bridging information.
Command Mode
Privileged EXEC
Usage Guidelines
This command first appeared in Cisco IOS Release 10.0 for the Cisco 4000 series. It first appeared in Cisco IOS Release 11.0 for the Cisco 7000 series, and it was modified in Cisco IOS Release 11.3 to include the CT3IP.
Sample Displays
The following is sample output from the show interfaces command for a synchronous serial interface:
Router# show interfaces serial
Serial 0 is up, line protocol is up
   Hardware is MCI Serial
   Internet address is 150.136.190.203, subnet mask is 255.255.255.0
   MTU 1500 bytes, BW 1544 Kbit, DLY 20000 usec, rely 255/255, load 1/255
   Encapsulation HDLC, loopback not set, keepalive set (10 sec)
   Last input 0:00:07, output 0:00:00, output hang never
   Output queue 0/40, 0 drops; input queue 0/75, 0 drops
   Five minute input rate 0 bits/sec, 0 packets/sec
   Five minute output rate 0 bits/sec, 0 packets/sec
       16263 packets input, 1347238 bytes, 0 no buffer
       Received 13983 broadcasts, 0 runts, 0 giants
       2 input errors, 0 CRC, 0 frame, 0 overrun, 0 ignored, 2 abort
1 carrier transitions
     22146 packets output, 2383680 bytes, 0 underruns
     0 output errors, 0 collisions, 2 interface resets, 0 restarts
Field Description
Table 15-9: show interfaces serial Field Descriptions — this table describes significant fields shown in the output.
| Field | Description |
|---|---|
| Serial…is {up | down}…is administratively down | Indicates whether the interface hardware is currently active (carrier detect is present) or whether it has been taken down by an administrator. |
| line protocol is {up | down} | Indicates whether the software processes that handle the line protocol consider the line usable (that is, keepalives are successful) or whether it has been taken down by an administrator. |
| line protocol is {up | down} | Indicates whether the software processes that handle the line protocol consider the line usable (that is, keepalives are successful) or whether it has been taken down by an administrator. |
| Hardware is | Specifies the hardware type. |
| Internet address is | Specifies the internet address and subnet mask. |
| MTU | Maximum transmission unit of the interface. |
| BW | Indicates the value of the bandwidth parameter that has been configured for the interface (in kilobits per second). The bandwidth parameter is used to compute IGRP metrics only. If the interface is attached to a serial line with a line speed that does not match the default (1536 or 1544 for T1 and 56 for a standard synchronous serial line), use the bandwidth command to specify the correct line speed for this serial line. |
| DLY | Delay of the interface in microseconds. |
| rely | Reliability of the interface as a fraction of 255 (255/255 is 100 percent reliability), calculated as an exponential average over five minutes. |
| load | Reliability of the interface as a fraction of 255 (255/255 is 100 percent reliability), calculated as an exponential average over five minutes. |
| Encapsulation | Encapsulation method assigned to the interface. |
| loopback | Indicates whether loopback is set. |
| keepalive | Indicates whether keepalives are set. |
| Last input | Number of hours, minutes, and seconds since the last packet was successfully received by an interface. Useful for knowing when a dead interface failed. |
| Last output | Number of hours, minutes, and seconds since the last packet was successfully transmitted by an interface.Number of hours, minutes, and seconds since the last packet was successfully transmitted by an interface. |
| output hang | Number of hours, minutes, and seconds (or never) since the interface was last reset because of a transmission that took too long. When the number of hours in any of the last fields exceeds 24, the number of days and hours is printed. If that field overflows, asterisks are printed. |
| Output queue, drops input queue, drops | Number of packets in output and input queues. Each number is followed by a slash, the maximum size of the queue, and the number of packets because the queue is full. |
| 5 minute input rate 5 minute output rate | Average number of bits and packets transmitted per second in the past five minutes. The five-minute input and output rates should be used only as an approximation of traffic per second during a given five-minute period. These rates are exponentially weighted averages with a time constant of five minutes. A period of four time constants must pass before the average will be within 2 percent of the instantaneous rate of a uniform stream of traffic over that period. |
| packets input | Total number of error-free packets received by the system. |
| bytes | Total number of bytes, including data and MAC encapsulation, in the error-free packets received by the system. |
| no buffer | Number of received packets discarded because there was no buffer space in the main system. Compare with ignored count. Broadcast storms on Ethernet networks and bursts of noise on serial lines are often responsible for no input buffer events. |
| Received… broadcasts | Total number of broadcast or multicast packets received by the interface. |
| runts | Number of packets that are discarded because they are smaller than the medium’s minimum packet size. |
| giants | Number of packets that are discarded because they exceed the medium’s maximum packet size. |
| input errors | Total number of no buffer, runts, giants, CRCs, frame, overrun, ignored, and abort counts. Other input-related errors can also increment the count, so this sum may not balance with the other counts. |
| CRC | Cyclic redundancy check generated by the originating station or far-end device does not match the checksum calculated from the data received. On a serial link, CRCs usually indicate noise, gain hits, or other transmission problems on the data link. |
| frame | Number of packets received incorrectly having a CRC error and a noninteger number of octets. On a serial line, this is usually the result of noise or other transmission problems. |
| overrun | Number of times the serial receiver hardware was unable to hand received data to a hardware buffer because the input rate exceeded the receiver’s ability to handle the data. |
| ignored | Number of received packets ignored by the interface because the interface hardware ran low on internal buffers. Broadcast storms and bursts of noise can cause the ignored count to be increased. |
| abort | Illegal sequence of one bits on a serial interface. This usually indicates a clocking problem between the serial interface and the data link equipment. |
| carrier transitions | Number of times the carrier detect signal of a serial interface has changed state. For example, if data carrier detect (DCD) goes down and comes up, the carrier transition counter will increment two times. Indicates modem or line problems if the carrier detect line is changing state often. |
| packets output | Total number of messages transmitted by the system. |
| bytes output | Total number of bytes, including data and MAC encapsulation, transmitted by the system. |
| underruns | Number of times that the transmitter has been running faster than the router can handle. This may never be reported on some interfaces. |
| output errors | Sum of all errors that prevented the final transmission of datagrams out of the interface being examined. Note that this may not balance with the sum of the enumerated output errors because some datagrams can have more than one error, and others can have errors that do not fall into any of the specifically tabulated categories. |
| collisions | Number of messages retransmitted due to an Ethernet collision. This usually is the result of an overextended LAN (that is, Ethernet or transceiver cable too long, more than two repeaters between stations, or too many cascaded multiport transceivers). Some collisions are normal. However, if your collision rate climbs to around 4 percent or 5 percent, you should consider verifying that there is no faulty equipment on the segment and/or moving some existing stations to a new segment. A packet that collides is counted only once in output packets. |
| interface resets | Number of times an interface has been completely reset. This can happen if packets queued for transmission were not sent within several seconds’ time. On a serial line, this can be caused by a malfunctioning modem that is not supplying the transmit clock signal, or by a cable problem. If the system notices that the carrier detect line of a serial interface is up but the line protocol is down, it periodically resets the interface in an effort to restart it. Interface resets can also occur when an interface is looped back or shut down. |
| restarts | Number of times the controller was restarted because of errors. |
| alarm indications, remote alarms, rx LOF, rx LOS | Number of CSU/DSU alarms, and number of occurrences of receive loss of frame and receive loss of signal. |
| BER inactive, NELR inactive, FELR inactive | Status of G.703-E1 counters for bit error rate (BER) alarm, near-end loop remote (NELR), and far-end loop remote (FELR). Note that you cannot set the NELR or FELR. |
Troubleshooting T1
This section describes the techniques and procedures for troubleshooting T1 circuits for dial-in customers.
Troubleshooting Using the show controller t1 Command
This command displays the controller status that is specific to the controller hardware. The information displayed is generally useful for diagnostic tasks performed by technical support personnel only.
The NMP (Network Management Processor) or MIP (MultiChannel Interface Processor) can query the port adapters to determine their current status. Issue a show controller t1 command to display statistics about the T1 link.
If you specify a slot and port number, statistics for each 15-minute period will be displayed. The show controller t1 EXEC command provides information to logically troubleshoot physical layer and data link layer problems. This section describes how to logically troubleshoot using the show controller t1 command.
Most T1 errors are caused by misconfigured lines. Ensure that linecoding, framing and clock source are configured according to what the service provider recommends.
show controller t1 Conditions
The T1 controller can be in one of the following three states.
-
Administratively down
-
Down
-
Up
Is the T1 Controller Administratively Down?
The controller is administratively down when it has been manually shut down. You should restart the controller to correct this error.
-
Enter enable mode.
maui-nas-03>en
Password:
maui-nas-03#
-
Enter global configuration mode.
maui-nas-03#configure terminal
Enter configuration commands, one per line. End with CNTL/Z.
maui-nas-03(config)#
-
Enter controller configuration mode.
maui-nas-03(config)#controller t1 0
maui-nas-03(config-controlle)#
-
Restart controller.
maui-nas-03(config-controlle)#shutdown
maui-nas-03(config-controlle)#no shutdown
Is the Line Up?
If the T1 controller and line are not up, check to see if one of the following messages appears in the show controller t1 EXEC output:
-
Receiver has loss of frame
-
Receiver has loss of signal
If T1 Receiver Has Loss of Frame:
Follow these steps if T1 Receiver Has Loss of Frame:
-
Check to see if the framing format configured on the port matches the framing format of the line. You can check the framing format of the controller from the running configuration or the show controller t1 command output.
To change the framing format use the framing {SF | ESF} command in the controller configuration mode as shown below:
maui-nas-03#configure terminal
Enter configuration commands, one per line. End with CNTL/Z.
maui-nas-03(config)#controller t1 0
maui-nas-03(config-controlle)#framing esf
-
Try the other framing format to see if the alarm clears.
-
Change the line buildout setting using the cablelength {long | short} command.
Line build out (LBO) compensates for the loss in decibels based on the distance from the device to the first repeater in the circuit. A longer distance from the device to the repeater requires that the signal strength on the circuit be boosted to compensate for loss over that distance.
Consult your service provider and the Cisco IOSÒ Command Reference for details on buildout settings.
If this does not fix the problem, proceed to the «If T1 Receiver Has Loss of Signal» section below.
If T1 Receiver Has Loss of Signal:
Follow these steps if T1 Receiver Has Loss of Signal:
-
Make sure that the cable between the interface port and the T1 service provider’s equipment (or T1 terminal equipment) is connected correctly. Check to see if the cable is hooked up to the correct ports. Correct the cable connections if necessary.
-
Check cable integrity. Look for breaks or other physical abnormalities in the cable. Ensure that the pinouts are set correctly. If necessary, replace the cable.
-
Check the cable connectors. A reversal of the transmit and receive pairs or an open receive pair can cause errors. Set the receive pair to lines 1 & 2. Set the transmit pair to lines 4 & 5.
The pins on a RJ-45 jack are numbered from 1 through 8. Pin 1 is the leftmost pin when looking at the jack with the metal pins facing you. Refer to the figure below.
Figure 15-10: RJ-45 Cable

-
Try using a rollover cable.
Run the show controller t1 EXEC command after each step to check if the controller exhibits any errors.
Check to see if the line is in loopback mode from the show controller t1 output. A line should be in loopback mode only for testing purposes.
To turn off loopback, use the no loopback command in the controller configuration mode as shown below:
maui-nas-03(config-controlle)#no loopback
If the Controller Displays Any Alarms:
Check the show controller command output to see if there are alarms displayed by the controller.
We will now discuss various alarms and the procedure necessary to correct them.
Receive (RX) Alarm Indication Signal (AIS) (Blue):
A received Alarm Indication Signal (AIS) means there is an alarm occurring on the line upstream of the equipment connected to the port.
-
Check to see if the framing format configured on the port matches the framing format of the line. If not, change the framing format on the controller to match that of the line.
-
Contact your service provider to check for mis-configuration within the Telco.
Receive (Rx) Remote Alarm Indication (RAI) (Yellow):
A received RAI means that the far-end equipment has a problem with the signal it is receiving from its upstream equipment.
-
Insert an external loopback cable into the port. To create a loopback plug refer to the section «Creating a Loopback Plug,» later in the chapter.
-
Check to see if there are any alarms. If you do not see any alarms, then the local hardware is probably in good condition. In that case:
-
Check the cabling. See the section «If T1 Receiver Has Loss of Signal» for more information.
-
Check the settings at the remote end and verify that they match your port settings.
-
If the problem persists, contact your service provider.
-
-
Remove the loopback plug and reconnect your T1 line.
-
Check the cabling. See the section «If T1 Receiver Has Loss of Signal» for more information.
-
Power-cycle the router.
-
Connect the T1 line to a different port. Configure the port with the same settings as that of the line. If the problem does not persist, then the fault lies with the one port:
-
Reconnect the T1 line to the original port.
-
Proceed to the «Troubleshooting T1 Error Events» section.
If the problem persists, then:
-
-
Perform a hardware loop test as described in the section «Performing Hardware Loopback Plug Test.»
-
Replace the T1 controller card.
-
Proceed to the «Troubleshooting T1 Error Events» section.
Transmitter Sending Remote Alarm (Red):
A Red alarm is declared when the CSU cannot synchronize with the framing pattern on the T1 line.
-
Check to see if the framing format configured on the port matches the framing format of the line. If not change the framing format on the controller to match that of the line.
-
Check the settings at the remote end and verify that they match your port settings.
-
Contact your service provider.
Transmit(Tx) Remote Alarm Indication (RAI) (Yellow):
A transmitted RAI at the interface indicates that the interface has a problem with the signal it is receiving from the far-end equipment.
-
Check the settings at the remote end and verify that they match your port settings.
-
A transmit RAI should be accompanied by some other alarm that indicates the nature of the problem the T1 port/card is having with the signal from the far-end equipment.
Troubleshoot that condition to resolve the transmit RAI.
Transmit(Tx) AIS (Blue):
Follow the steps below to correct the Transmit (Tx) AIS (Blue).
-
Check to see if the framing format configured on the port matches the framing format of the line. If not, correct the mismatch.
-
Power-cycle the router.
-
Connect the T1 line to a different port. Configure the port with the same settings as that of the line.
-
Perform a hardware loop test as described in the section «Performing Hardware Loopback Plug Test.»
-
Replace the T1 controller card.
-
Proceed to the «Troubleshooting T1 Error Events» section.
Troubleshooting T1 Error Events
The show controller t1 EXEC command provides error messages that can be used to troubleshoot problems. We will now discuss several error messages and how to correct the errors.
To see if the error counters are increasing, execute the show controller t1 command repeatedly. Note the values of the counters for the current interval.
Consult your service provider for framing and linecoding settings. A good rule of thumb is to use B8ZS linecoding with ESF framing and AMI linecoding with SF framing.
Slip Secs Counter is increasing:
The presence of slips on a T1 line indicates a clocking problem. The T1 provider (Telco) will provide the clocking to which the Customer Premises Equipment (CPE) should be synchronized.
-
Verify that the clock source is derived from the network. This can be ascertained by looking for Clock Source is Line Primary.
Note: If there are multiple T1s into an access server, only one can be the primary, while the other T1s derive the clock from the primary. In that case verify that the T1 line designated as the primary clock source is configured correctly.
-
Set the T1 clock source correctly from the controller configuration mode.
maui-nas-03(config-controlle)#clock source line primary
Framing Loss Seconds Counter is Increasing:
Follow these steps when the Framing Loss Seconds Counter is Increasing.
-
Check to see if the framing format configured on the port matches the framing format of the line. You can check this by looking for the Framing is {ESF|SF} in the show controller t1 output.
-
To change the framing format use the framing {SF | ESF} command in the controller configuration mode as shown below:
maui-nas-03(config-controlle)#framing esf
-
Change the line buildout using the cablelength {long | short} command.
Consult your service provider and the Cisco IOSÒ Command Reference for details on buildout settings.
Line Code Violations are increasing:
Follow these steps when Line Code Violations are increasing.
-
Check to see if the linecoding configured on the port matches the framing format of the line. You can check this by looking for the Line Code is {B8ZS|AMI} in the show controller t1 output.
-
To change the linecoding, use the linecode {ami | b8zs} command in the controller configuration mode as shown below:
maui-nas-03(config-controlle)#linecode b8zs
-
Change the line buildout using the cablelength {long | short} command.
Consult your service provider and the Cisco IOS® Command Reference for details on buildout settings.
Verifying that ISDN Switch Type and PRI-Group are Configured Correctly
Use the show running-config command to see if ISDN switch type and the PRI-group timeslots are configured correctly. Contact your service provider for correct values.
To change the ISDN switch type and PRI-group:
maui-nas-03#configure terminal
maui-nas-03(config)#isdn switch-type primary-5ess
maui-nas-03(config)#controller t1 0
maui-nas-03(config-controlle)#pri-group timeslots 1-24
Verifying the Signaling Channel
If the error counters do not increase but the problem persists, verify that the signaling channel is up and configured correctly.
-
Run the show interface serial x:23 command, where x should be replaced by the interface number.
-
Check to see if the interface is up. If the interface is not up, use the no shutdown command to bring the interface up.
maui-nas-03#config terminal
Enter configuration commands, one per line.  End with CNTL/Z.
maui-nas-03(config)#interface serial 0:23
maui-nas-03(config-if)#no shutdown
-
Ensure that encapsulation is PPP. If the interface is not using PPP then use the encapsulation ppp command in the interface configuration mode to correct it.
maui-nas-03(config-if)#encapsulation ppp
-
Check to see if loopback is set. Loopback should be set only for testing purposes. Use the no loopback command to remove loopbacks.
maui-nas-03(config-if)#no loopback
-
Power-cycle the router.
-
If the problem persists, contact your service provider or Cisco TAC
Troubleshooting a PRI
Whenever troubleshooting a PRI, you need to check to see if the T1 is running cleanly on both ends. If Layer 1 problems have been resolved, as described above, consider Layer 2 and Layer 3 problems.
Troubleshooting Using the show isdn status Command
The show isdn status command is used to display a snapshot of all ISDN interfaces. It displays the status of Layers 1, 2 and 3.
-
Verify that Layer 1 is active.
The Layer 1 status should always say ACTIVE unless the T1 is down. If show isdn status indicates that Layer 1 is DEACTIVATED, then there is a problem with the physical connectivity on the T1 line. See the section «Is the T1 Controller T1 Down?»
Also verify that the T1 is not administratively down. Use the no shutdown command to bring the T1 controller up.
-
Check to see if the Layer 2 State is MULTIPLE_FRAME_ESTABLISHED
The desired Layer 2 state is Multiple_Frame_Established, which indicates that we are exchanging layer 2 frames and have finished Layer 2 initialization.
If Layer 2 is not Multiple_Frame_Established , use the show controller t1 EXEC command to diagnose the problem. Refer to the Troubleshooting using the show controller t1 Command section in this chapter.
Since show isdn status is a snapshot of the current status, it is possible that layer 2 is bouncing up and down despite indicating Mulitple_Frame_Established. Use debug isdn q921 to verify that layer 2 is stable.
The debug isdn q921 command displays data link layer (layer 2) access procedures that are taking place at the router on the D-channel.
Ensure that you are configured to view debug messages by using the logging console or terminal monitor command as necessary.
Note: In a production environment, verify that console logging is disabled. Enter the show logging command. If logging is enabled, the access server may intermittently freeze up as soon as the console port gets overloaded with log messages. Enter the no logging console command.
Note: If debug isdn q921 is turned on and you do not receive any debug outputs, place a call or reset the controller to get debug outputs.
-
Verify that Layer 2 is stable.
You should observe the debug outputs for messages indicating that the service is not bouncing up and down. If you see the following types of debug outputs, the line is not stable.
Mar 20 10:06:07.882: %ISDN-6-LAYER2DOWN: Layer 2 for Interface Se0:23, TEI 0
changed to down
Mar 20 10:06:09.882: %LINK-3-UPDOWN: Interface Serial0:23, changed state to down
Mar 20 10:06:21.274: %DSX1-6-CLOCK_CHANGE: Controller 0  clock is now selected
as clock source
Mar 20 10:06:21.702: %ISDN-6-LAYER2UP: Layer 2 for Interface Se0:23, TEI 0 changed
to up
Mar 20 10:06:22.494: %CONTROLLER-5-UPDOWN: Controller T1 0, changed state to up
Mar 20 10:06:24.494: %LINK-3-UPDOWN: Interface Serial0:23, changed state to up
If Layer 2 does not appear to be stable, see «Troubleshooting T1 Error Events,» earlier in this chapter.
-
Verify that you are seeing only SAPI messages in both transmit (TX) and Receive (RX) sides.
Mar 20 10:06:52.505: ISDN Se0:23: TX ->  RRf sapi = 0  tei = 0  nr = 0
Mar 20 10:06:52.505: ISDN Se0:23: RX <-  RRf sapi = 0  tei = 0  nr = 0
Mar 20 10:07:22.505: ISDN Se0:23: TX ->  RRp sapi = 0  tei = 0 nr = 0
Mar 20 10:07:22.509: ISDN Se0:23: RX <-  RRp sapi = 0  tei = 0 nr = 0
Mar 20 10:07:22.509: ISDN Se0:23: TX ->  RRf sapi = 0  tei = 0  nr = 0
Mar 20 10:07:22.509: ISDN Se0:23: RX <-  RRf sapi = 0  tei = 0  nr = 0
-
Verify that you are not seeing SABME messages, which indicates that Layer 2 is trying to reinitialize. This is usually seen when we are transmitting poll requests (RRp) and not getting a response from the switch (RRf) or vice-versa. Below are example of SABME messages.
Mar 20 10:06:21.702: ISDN Se0:23: RX <-  SABMEp sapi = 0  tei = 0
Mar 20 10:06:22.494: ISDN Se0:23: TX ->  SABMEp sapi = 0  tei = 0
If you are seeing SABME messages, use the show running-config command to see if ISDN switch type and the PRI-group timeslots are configured correctly. Contact your service provider for correct values.
To change the ISDN switch type and PRI-group:
maui-nas-03#configure terminal
maui-nas-03(config)#isdn switch-type primary-5ess
maui-nas-03(config)#controller t1 0
maui-nas-03(config-controlle)#pri-group timeslots 1-24
-
Verify that the D-channel is up using the show interfaces serial x:23 command.
If the D-channel is not up, then use no shutdown command to bring it up:
maui-nas-03(config)#interface serial 0:23
maui-nas-03(config-if)#no shutdown
-
Check to see if encapsulation is PPP. If not, use the encapsulation ppp command to set encapsulation.
maui-nas-03(config-if)#encapsulation ppp
-
Check to see if the interface is in loopback mode. For normal operation, the interface should not be in loopback mode.
maui-nas-03(config-if)#no loopback
-
Power-cycle the router.
-
If the problem persists, contact your service provider or the Cisco TAC.
Performing Hardware Loopback Plug Test
The Hardware loopback plug test can be used to test whether the router has any faults. If a router passes a hardware loopback plug test, then the problem exists elsewhere on the line.
Create a Loopback Plug:
Follow these steps to create a loopback plug.
-
Use wire cutters to cut a working RJ-45 or RJ-48 cable so that there are five inches of cable and the connector is attached to it.
-
Strip the wires.
-
Twist together the wires from pins 1 and 4.
-
Twist together the wires from pins 2 and 5.
The pins on a RJ-45/48 jack are numbered from 1 through 8. Pin 1 is the left-most pin when looking at the jack with the metal pins facing you.
Performing the Loopback Plug Test
Follow these steps to perform the loopback plug test.
-
Insert the plug into the T1 port in question.
-
Save your router configuration using the write memory command.
maui-nas-03#write memory
Building configuration...
[OK]
-
Set the encapsulation to HDLC
maui-nas-03#config terminal
Enter configuration commands, one per line.  End with CNTL/Z.
maui-nas-03(config)#interface serial 0
maui-nas-03(config-if)#enc
maui-nas-03(config-if)#encapsulation HDLC
maui-nas-03(config-if)#^Z
-
Use the show running-config command to see if the interface has an IP address.
If the interface does not have an IP address, obtain a unique address and assign it to the interface with a subnet mask of 255.255.255.0.
maui-nas-03(config)#ip address 172.22.53.1 255.255.255.0
-
Clear the interface counters using the clear counters command.
maui-nas-03#clear counters
Clear "show interfaces" counters on all interfaces [confirm]
maui-nas-03#
-
Perform the extended ping test as described in the «Using Extended ping Tests,» section earlier in this chapter.
Troubleshooting E1
This section describes the techniques and procedures for troubleshooting E1 circuits for dial-in customers.
Troubleshooting Using the show controller e1 Command
This command displays the controller status that is specific to the controller hardware. The information displayed is generally useful for diagnostic tasks performed by technical support personnel only.
The NMP or MIP can query the port adapters to determine their current status. Issue a show controller e1 command to display statistics about the E1 link. If you specify a slot and port number, statistics for each 15 minute period will be displayed.
The show controller e1 EXEC command provides information to logically troubleshoot physical layer and data link layer problems. This section describes how to logically troubleshoot using the show controller e1 command.
Most E1 errors are caused by misconfigured lines. Ensure that linecoding, framing, clock source and line termination (balanced or unbalanced) are configured according to what the service provider recommends.
show controller e1 Conditions
The E1 controller can be in one of the following three states.
-
Administratively down
-
Down
-
Up
Is the E1 Controller Administratively Down?
The controller is administratively down when it has been manually shut down. You should restart the controller to correct this error.
-
Enter enable mode.
maui-nas-03>enable
Password:
maui-nas-03#
-
Enter global configuration mode.
maui-nas-03#configure terminal
Enter configuration commands, one per line.  End with CNTL/Z.
maui-nas-03(config)#
-
Enter controller configuration mode.
maui-nas-03(config)#controller e1 0
maui-nas-03(config-controlle)#
-
Restart controller.
maui-nas-03(config-controlle)#shutdown
maui-nas-03(config-controlle)#no shutdown
Is the Line Up?
If the E1 line is not up, check to see that the line configuration is correct and matches the settings of the remote end.
-
Check the framing of the line and the remote end. For E1 lines, the framing is either CRC4 or noCRC4
-
Check the linecoding of the line and the remote end. The linecoding is either AMI or HDB3.
-
Check to see if the line termination is set for balanced or unbalanced (75-ohm or 120-ohm).
Consult your service provider for more information regarding the correct settings. Make any changes as necessary to both local or remote end-devices.
If the E1 controller and line are not up, check to see if one of the following messages appears in the show controller e1 EXEC output:
-
Receiver has loss of frame
-
Receiver has loss of signal
If E1 Receiver Has Loss of Frame:
Follow these steps if E1 receiver has loss of frame.
-
Check to see if the framing format configured on the port matches the framing format of the line. You can check the framing format of the controller from the running configuration or the show controller e1 command output.
To change the framing format, use the framing {CRC4 | no CRC4} command in the controller configuration mode as shown below:
maui-nas-03#configure terminal
Enter configuration commands, one per line.  End with CNTL/Z.
maui-nas-03(config)#controller E1 0
maui-nas-03(config-controlle)#framing CRC4
-
Try the other framing format to see if the alarm clears.
If this does not fix the problem, proceed to the «If E1 Receiver Has Loss of Signal» section below.
-
Check the framing format on the remote end.
-
Check the linecoding on the remote end.
If E1 Receiver Has Loss of Signal:
Follow these steps if E1 receiver has loss of signal
-
Make sure that the cable between the interface port and the E1 service provider’s equipment (or E1 terminal equipment) is connected correctly. Check to see if the cable is hooked up to the correct ports. Correct the cable connections if necessary.
-
Check cable integrity. Look for breaks or other physical abnormalities in the cable. Ensure that the pinouts are set correctly. If necessary, replace the cable.
-
Check the cable connectors. A reversal of the transmit and receive pairs or an open receive pair can cause errors. Set the receive pair to lines 1 & 2. Set the transmit pair to lines 4 & 5.
The pins on a RJ-48 jack are numbered from 1 through 8. Pin 1 is the leftmost pin when looking at the jack with the metal pins facing you. Refer to the following figure for more information.
Figure 15-11: RJ-45 Cable
-
Try using a rollover cable.
-
Check to see if there are far-end block errors. If so, the problem exists with the receive lead on the local end. Contact the TAC for more assistance.
Run the show controller e1 EXEC command after each step to check if the controller exhibits any errors.
If the Line is in Loopback Mode:
Check to see if the line is in loopback mode from the show controller e1 output. A line should be in loopback mode only for testing purposes.
To turn off loopback, use the no loopback command in the controller configuration mode as shown below:
maui-nas-03(config-controlle)#no loopback
If the Controller Displays Any Alarms:
Check the show controller command output to see if there are alarms displayed by the controller.
We will now discuss various alarms and the procedure necessary to correct them.
Receiver (Rx) Has Remote Alarm:
A received remote alarm means there is an alarm occurring on the line upstream of the equipment connected to the port.
-
Check to see if the framing format configured on the port matches the framing format of the line. If not, change the framing format on the controller to match that of the line.
-
Check the linecoding setting on the remote-end equipment. Contact your service provider for the correct settings. Correct any misconfigurations as necessary.
-
Insert an external loopback cable into the port. To create a loopback plug, see the section «Performing Hardware Loopback Plug Test,» earlier in the chapter.
-
Check to see if there are any alarms. If you do not see any alarms, then the local hardware is probably in good condition. In that case:
-
Check the cabling. Refer to the section «If E1 Receiver Has Loss of Signal» for more information.
-
Check the settings at the remote end and verify that they match your port settings.
-
If the problem persists, contact your service provider.
-
-
Remove the loopback plug and reconnect your E1 line.
-
Check the cabling. See the section «If E1 Receiver Has Loss of Signal» for more information.
-
Power-cycle the router.
-
Connect the E1 line to a different port. Configure the port with the same settings as that of the line. If the problem does not persist, then the fault lies with the one port:
-
Reconnect the E1 line to the original port.
-
Proceed to the «Troubleshooting E1 Error Events» section.
If the problem persists, then:
-
-
Perform a hardware loop test as described in the section «Performing Hardware loopback Plug Test»
-
Replace the E1 controller card.
-
Proceed to the «Troubleshooting E1 Error Events» section.
Transmitter Sending Remote Alarm (Red):
A Red alarm is declared when the CSU cannot synchronize with the framing pattern on the E1 line.
-
Check to see if the framing format configured on the port matches the framing format of the line. If not change the framing format on the controller to match that of the line.
-
Check the settings at the remote end and verify that they match your port settings.
-
Insert an external loopback cable into the port. To create a loopback plug, see the section «Performing Hardware Loopback Plug Test,» earlier in the chapter.
-
Check to see if there are any alarms. If you do not see any alarms, then the local hardware is probably in good condition. In that case:
-
Check the cabling. Refer to the section «If E1 Receiver Has Loss of Signal» for more information.
-
If the problem persists, contact your service provider.
-
-
Connect the E1 line to a different port. Configure the port with the same settings as that of the line. If the problem does not persist, then the fault lies with the one port.
-
Reconnect the E1 line to the original port.
-
Proceed to the «Troubleshooting E1 Error Events» section.
If the problem persists, then:
-
-
Perform a hardware loop test as described in the section «Performing Hardware Loopback Plug Test.»
-
Replace the E1 controller card.
-
Proceed to the «Troubleshooting E1 Error Events» section.
-
Contact your service provider.
Troubleshooting E1 Error Events
The show controller e1 EXEC command provides error messages that can be used to troubleshoot problems. We will now discuss several error messages and how to correct the errors.
To see if the error counters are increasing, execute the show controller e1 command repeatedly. Note the values of the counters for the current interval. Consult your service provider for framing and linecoding settings.
Slip Secs Counter is increasing:
The presence of slips on E1 lines indicates a clocking problem. The E1 provider (Telco) will provide the clocking to which the Customer Premises Equipment (CPE) should be synchronized.
-
Verify that the clock source is derived from the network. This can be ascertained by looking for Clock Source is Line Primary.
Note: If there are multiple E1s in an access server, only one can be the primary, while the other E1s derive the clock from the primary. In that case, verify that the E1 line designated as the primary clock source is configured correctly.
-
Set the E1 clock source correctly from the controller configuration mode.
maui-nas-03(config-controlle)#clock source line primary
Framing Loss Seconds Counter is Increasing:
Follow these steps when framing loss seconds counter is increasing:
-
Check to see if the framing format configured on the port matches the framing format of the line. You can check this by looking for the Framing is {CRC4|no CRC4} in the show controller e1 output.
-
To change the framing format use the framing {CRC4 | no CRC4} command in the controller configuration mode as shown below:
maui-nas-03(config-controlle)#framing crc4
Line Code Violations are Increasing:
Follow these steps when line code violations are increasing.
-
Check to see if the linecoding configured on the port matches the framing format of the line. You can check this by looking for the Line Code is {AMI/HDB3} in the show controller e1 output.
-
To change the linecoding, use the linecode {ami | hdb3} command in the controller configuration mode as shown below:
maui-nas-03(config-controlle)#linecode ami
Verifying that ISDN Switch Type and PRI-Group are Configured Correctly
Use the show running-config command to check if ISDN switch type and the PRI-group timeslots are configured correctly. Contact your service provider for correct values.
To change the ISDN switch type and PRI-group:
maui-nas-03#configure terminal
maui-nas-03(config)#isdn switch-type primary-net5
maui-nas-03(config)#controller e1 0
maui-nas-03(config-controlle)#pri-group timeslots 1-31
Verifying the Signaling Channel
If the error counters do not increase but the problem persists, verify that the signaling channel is up and configured correctly.
-
Run the show interface serial x:15 command, where x should be replaced by the interface number.
-
Check to see if the interface is up. If the interface is not up, use the no shutdown command to bring the interface up.
maui-nas-03#config terminal
Enter configuration commands, one per line.  End with CNTL/Z.
maui-nas-03(config)#interface serial 0:15
maui-nas-03(config-if)#no shutdown
-
Ensure that encapsulation is PPP. If the interface is not using PPP, then use the encapsulation ppp command in the interface configuration mode to correct it.
maui-nas-03(config-if)#encapsulation ppp
-
Check to see if loopback is set. Loopback should be set only for testing purposes. Use the no loopback command to remove loopbacks.
maui-nas-03(config-if)#no loopback
-
Power-cycle the router.
-
If the problem persists, contact your service provider or the Cisco TAC.
Troubleshooting a PRI
When troubleshooting a PRI, you need to determine if the E1 is running cleanly on both ends. If Layer 1 problems have been resolved as described above, consider Layer 2 and Layer 3 problems.
Troubleshooting Using the show isdn status Command
The show isdn status command is used to display a snapshot of all ISDN interfaces. It displays the status of Layers 1, 2 and 3.
-
Verify that Layer 1 is active.
The Layer 1 status should always say ACTIVE unless the E1 is down.
If show isdn status indicates that Layer 1 is DEACTIVATED, then there is a problem with the physical connectivity on the E1 line. See the section «Is the E1 Controller Administratively Down?»
Also verify that the E1 is not administratively down. Use the no shutdown command to bring the E1 controller up.
-
Check to see if the Layer 2 State is MULTIPLE_FRAME_ESTABLISHED.
The desired Layer 2 state is Multiple_Frame_Established, which indicates the startup protocol between ISDN switch and end-device has been established and we are exchanging Layer 2 frames.
If Layer 2 is not Multiple_Frame_Established, use the show controller e1 EXEC command to diagnose the problem. See «Troubleshooting Using the show controller e1 Command» section in this chapter and the «Troubleshooting E1 Error Events» section.
Because show isdn status is a snapshot of the current status, it is possible that Layer 2 is bouncing up and down despite indicating Mulitple_Frame_Established. Use the debug isdn q921 command to verify that Layer 2 is stable.
Using debug q921
The debug isdn q921 command displays data link layer (Layer 2) access procedures that are taking place at the router on the D-channel.
Ensure that you are configured to view debug messages by using the logging console or terminal monitor command as necessary.
Note: In a production environment, verify that console logging is disabled. Enter the show logging command. If logging is enabled, the access server may intermittently freeze up as soon as the console port gets overloaded with log messages. Enter the no logging console command.
Note: If debug isdn q921 is turned on and you do not receive any debug outputs, place a call or reset the controller to get debug outputs.
-
Verify that Layer 2 is stable. You should observe the debug outputs for messages indicating that the service is not bouncing up and down. If you see the following types of debug outputs, the line is not stable.
Mar 20 10:06:07.882: %ISDN-6-LAYER2DOWN: Layer 2 for Interface Se0:15, TEI 0
changed to down
Mar 20 10:06:09.882: %LINK-3-UPDOWN: Interface Serial0:15, changed state to down
Mar 20 10:06:21.274: %DSX1-6-CLOCK_CHANGE: Controller 0  clock is now selected
as clock source
Mar 20 10:06:21.702: %ISDN-6-LAYER2UP: Layer 2 for Interface Se0:15, TEI 0
changed to up
Mar 20 10:06:22.494: %CONTROLLER-5-UPDOWN: Controller E1 0, changed state to up
Mar 20 10:06:24.494: %LINK-3-UPDOWN: Interface Serial0:15, changed state to up
If Layer 2 does not appear to be stable, see «Troubleshooting E1 Error Events,» earlier in this chapter.
-
Verify that you are seeing only SAPI messages in both transmit (TX) and Receive (RX) sides.
Mar 20 10:06:52.505: ISDN Se0:15: TX ->  RRf sapi = 0  tei = 0  nr = 0
Mar 20 10:06:52.505: ISDN Se0:15: RX <-  RRf sapi = 0  tei = 0  nr = 0
Mar 20 10:07:22.505: ISDN Se0:15: TX ->  RRp sapi = 0  tei = 0 nr = 0
Mar 20 10:07:22.509: ISDN Se0:15: RX <-  RRp sapi = 0  tei = 0 nr = 0
Mar 20 10:07:22.509: ISDN Se0:15: TX ->  RRf sapi = 0  tei = 0  nr = 0
Mar 20 10:07:22.509: ISDN Se0:15: RX <-  RRf sapi = 0  tei = 0  nr = 0
-
Verify that you are not seeing SABME messages, which indicates that Layer 2 is trying to reinitialize. This is usually seen when we are transmitting poll requests (RRp) and not getting a response from the switch (RRf) or vice-versa. Below are example of SABME messages. We should get a response from ISDN switch for our SABME messages (UA frame received).
Mar 20 10:06:21.702: ISDN Se0:15: RX <-  SABMEp sapi = 0  tei = 0
Mar 20 10:06:22.494: ISDN Se0:15: TX ->  SABMEp sapi = 0  tei = 0
If you are seeing SABME messages, use the show running-config command to check if ISDN switch type and the PRI-group timeslots are configured correctly. Contact your service provider for correct values.
To change the ISDN switch type and PRI-group:
maui-nas-03#configure terminal
maui-nas-03(config)#isdn switch-type primary-net5
maui-nas-03(config)#controller e1 0
maui-nas-03(config-controlle)#pri-group timeslots 1-31
-
Verify that the D-channel is up using the show interfaces serial x:15 command.
If the D-channel is not up, then use the no shutdown command to bring it up:
maui-nas-03(config)#interface serial 0:15
maui-nas-03(config-if)#no shutdown
-
Check to see if encapsulation is PPP. If not use the encapsulation ppp command to set encapsulation.
maui-nas-03(config-if)#encapsulation ppp
-
Check to see if the interface is in loopback mode. For normal operation, the interface should not be in loopback mode.
maui-nas-03(config-if)#no loopback
-
Power-cycle the router.
-
If the problem persists, contact your service provider or the Cisco TAC.
Related Information
- Technical Support — Cisco Systems
Table Of Contents
Troubleshooting Ethernet
Ethernet and IEEE 802.3
Full-Duplex Operation 10/100/1000
Autonegotiation
Physical Connections
Frame Formats
Troubleshooting Ethernet
show interfaces ethernet
Syntax Description
Command Mode
Usage Guidelines
Sample Display
Troubleshooting Ethernet
Ethernet was developed by Xerox Corporation’s Palo Alto Research Center (PARC) in the 1970s. Ethernet was the technological basis for the IEEE 802.3 specification, which was initially released in 1980. Shortly thereafter, Digital Equipment Corporation, Intel Corporation, and Xerox Corporation jointly developed and released an Ethernet specification (Version 2.0) that is substantially compatible with IEEE 802.3. Together, Ethernet and IEEE 802.3 currently maintain the greatest market share of any local-area network (LAN) protocol. Today, the term Ethernet is often used to refer to all carrier sense multiple access collision detect (CSMA/CD) LANs that generally conform to Ethernet specifications, including IEEE 802.3.
When it was developed, Ethernet was designed to fill the middle ground between long-distance, low-speed networks and specialized, computer-room networks carrying data at high speeds for very limited distances. Ethernet is well suited to applications on which a local communication medium must carry sporadic, occasionally heavy traffic at high peak data rates.
Ethernet and IEEE 802.3
Ethernet and IEEE 802.3 specify similar technologies. Both are CSMA/CD LANs. Stations on a CSMA/CD LAN can access the network at any time. Before sending data, CSMA/CD stations «listen» to the network to see if it is already in use. If it is, the station wanting to transmit waits. If the network is not in use, the station transmits. A collision occurs when two stations listen for network traffic, «hear» none, and transmit simultaneously. In this case, both transmissions are damaged, and the stations must retransmit at some later time. Back-off algorithms determine when the colliding stations retransmit. CSMA/CD stations can detect collisions, so they know when they must retransmit. This access method is used by traditional Ethernet and IEEE 802.3 functions in half-duplex mode. (When Ethernet is operated in full-duplex mode, CSMA/CD is not used.) This means that only one station can transmit at a time over the shared Ethernet.
This access method was conceived to offer shared and fair access to multiple network stations/devices. It allows these systems fair access to the Ethernet network through a process of arbitration by dictating how stations attached to this network can access the shared channel. It allows stations to listen before transmitting and can recover if signals collide. This recovery time interval is called a slot time and is based on the round-trip time that it takes to send a 64-byte frame the maximum length of an Ethernet LAN attached by repeaters. Another name for this shared LAN is a collision domain. For half-duplex operation, the mode on which traditional Ethernet is based, the size of your collision domain can be limited by the physical limitations of the cabling utilized. Table 4-1 lists the collision domains for 10/100/1000 Mbps.
|
Traditional Ethernet and 802.3 Collision Domains |
||
|---|---|---|
|
Signaling Speed |
Network Diameter |
|
|
10BaseX |
About 280 meters (coax) |
Ethernet |
|
10/100BaseX |
About 205 meters (twisted pair) |
IEEE 802.3b |
|
1000BaseX |
About 20 meters |
IEEE 802.3z |
The limitations of the cable itself can create even smaller boundaries.
Because the 64-byte slot time is consistent for 10/100/1000 transmission speeds, this severely limits the scalability for 1000BaseX to operate in a network with a diameter of more than 20 meters. To overcome this obstacle, use carrier extension bits in addition to the Ethernet frame size to extend the time that transmits on the wire. This expands the network diameter to 100 meters per segment, like 100BaseT.
For this system to work, everyone must abide by the same rules. For CSMA/CD the rules are as follows:
1. ![]() Listen—Stations listen for signals on the wire. If a signal is detected (carrier sense), then stations should not attempt to transmit frame. If a station «hears» another signal on the wire while transmitting the first 64 bytes of a frame, it should recognize that its frame has collided with another.
Listen—Stations listen for signals on the wire. If a signal is detected (carrier sense), then stations should not attempt to transmit frame. If a station «hears» another signal on the wire while transmitting the first 64 bytes of a frame, it should recognize that its frame has collided with another.
2. ![]() Collision detect—If a station detects a collision, it must back off from sending the frame using the truncated back-off algorithm. The back-off algorithm counts the number of collisions, if any, to determine how long a station must wait to retransmit the frame. This algorithm backs off each time that a collision is detected. The goal of this method is to provide the system a way to determine how many stations are trying to transmit simultaneously and then guess when it should be safe to try again. The way that the truncated back-off algorithm tracks and adjusts timers is based on the value of 2n , where n is the number of collisions encountered during transmission of the frame. The result is a guess of how many stations may be on the shared channel. This result gets plugged in as a range, counting from zero, for the number of slot times to wait. The algorithm randomly selects a value from this range as shown in Table 4-2.
Collision detect—If a station detects a collision, it must back off from sending the frame using the truncated back-off algorithm. The back-off algorithm counts the number of collisions, if any, to determine how long a station must wait to retransmit the frame. This algorithm backs off each time that a collision is detected. The goal of this method is to provide the system a way to determine how many stations are trying to transmit simultaneously and then guess when it should be safe to try again. The way that the truncated back-off algorithm tracks and adjusts timers is based on the value of 2n , where n is the number of collisions encountered during transmission of the frame. The result is a guess of how many stations may be on the shared channel. This result gets plugged in as a range, counting from zero, for the number of slot times to wait. The algorithm randomly selects a value from this range as shown in Table 4-2.
|
2n value1 |
Actions |
|
20-1 |
Stations either try to retransmit immediately or wait for one slot time. |
|
22 |
Stations randomly wait zero, one, two, or three slot times to retransmit. |
|
23 |
Stations randomly wait from zero to seven slot times. |
|
24 |
. . . you get the point. |
1 2n where n = the number of collisions
Depending on the number of collisions the algorithm randomly selects to back off, a station could potentially wait a while before retransmitting.
The algorithm collision counter stops incrementing at 10, where the penalty wait time is selected from a range of 0 to 1023 slot times before retransmission. This is pretty bad, but the algorithm will attempt to retransmit the frame up to 16 collisions. Then it just gives up, and a higher-layer network protocol such as TCP/IP will attempt to retransmit the packet. This is an indication that you have some serious errors.
When a station successfully sends a frame, the collision counter (penalty) is cleared (for that frame) and no loner must wait for the back-off time. («Interface» statistics are not cleared, just the timer is). Any stations with the lowest collisions will be capable of accessing the wire more quickly because they do not have to wait.
Both Ethernet and IEEE 802.3 LANs are broadcast networks. In other words, all stations see all frames, regardless of whether they represent an intended destination. Each station must examine received frames to determine whether the station is a destination. If it is a destination, the frame is passed to a higher protocol layer for appropriate processing.
Differences between Ethernet and IEEE 802.3 standards are subtle. Ethernet provides services corresponding to Layers 1 and 2 of the OSI reference model, whereas IEEE 802.3 specifies the physical layer (Layer 1) and the channel-access portion of the link layer (Layer 2), but does not define a logical link control protocol. Both Ethernet and IEEE 802.3 are implemented in hardware. Typically, the physical manifestation of these protocols is either an interface card in a host computer or circuitry on a primary circuit board within a host computer.
Now, having said all that regarding the regular operation of traditional Ethernet and 802.3, we must discuss where the two separate in features and functionality. The IEEE 802.3 standard was based on traditional Ethernet, but improvements have been made to this current standard. What we have discussed so far will not scale in today’s demanding service provider and enterprise networks.
Full-Duplex Operation 10/100/1000
Everything you’ve read so far dealt with half-duplex operation (CSMA/CD, back-off timers, and so on). Full-duplex mode allows stations to transmit and receive data simultaneously. This makes for more efficient use of the available bandwidth by allowing open access to the medium. Conversely, this mode of operation can function only with Ethernet switching hubs or via Ethernet cross-over cables between interfaces capable of full-duplex Ethernet. Full-duplex mode expects links to be point-to-point links. There are also no collisions in full-duplex mode, so CSMA/CD is not needed.
Autonegotiation
Autonegotiation allows Ethernet devices to automatically configure their interfaces for operation. If the network interfaces supported different speeds or different modes of operation, they will attempt to settle on a lower common denominator. A plain repeater cannot support multiple speeds; it knows only how to regenerate signals. Smart hubs employ multiple repeaters and a switch plane internally to allow stations that support different speeds to communicate. The negotiation is performed only when the system initially connects to the hub. If slower systems are attached to the same smart hub, then faster systems will have to be manually configured for 10 Mbps operation.
To make sure that your connection is operating properly, IEEE 802.3 Ethernet employs normal link pulses (NLPs), which are used for verifying link integrity in a 10BaseT system. This signaling gives you the link indication when you attach to the hub and is performed between two directly connected link interfaces (hub-to-station or station-to-station). NLPs are helpful in determining that a link has been established between devices, but they are not a good indicator that your cabling is free of problems.
An extension of NLPs is fast link pulses. These do not perform link tests, but instead are employed in the autonegotiation process to advertise a device’s capabilities. Autonegotiation on 1000BaseX networks works at only 1000 Mbps, so the only feature «negotiated» is for full- or half-duplex operation. There may be new vendor implementations on the market that can autonegotiate speeds 10 to 1000BaseX, but at this time they are not widely deployed.
A backup alternative, called parallel detection, works for 10/100 speeds if autonegotiation is disabled or is unsupported. This is basically a fallback mechanism that springs into action when autonegotiation fails. The interface capable of autonegotiation will configure itself for bare bones 10-Mbps half-duplex operation.
Physical Connections
IEEE 802.3 specifies several different physical layers, whereas Ethernet defines only one. Each IEEE 802.3 physical layer protocol has a name that summarizes its characteristics. The coded components of an IEEE 802.3 physical layer name are shown in Figure 4-1.
Figure 4-1 IEEE 802.3 Physical Layer Name Components
A summary of Ethernet Version 2 and IEEE 802.3 characteristics appears in Tables 4-3 and 4-4.
|
Characteristic |
Ethernet |
IEEE 802.3 Values |
||||
|---|---|---|---|---|---|---|
|
10Base5 |
10Base2 |
1Base5 |
10BaseT |
10Broad36 |
||
|
Data rate (Mbps) |
10 |
10 |
10 |
1 |
10 |
10 |
|
Signaling method |
Baseband |
Baseband |
Baseband |
Baseband |
Baseband |
Broadband |
|
Maximum segment length (m) |
500 |
500 |
185 |
250 |
100 |
1800 |
|
Media |
50-ohm coax (thick) |
50-ohm coax (thick) |
50-ohm coax (thin) |
Unshielded |
Unshielded |
75-ohm coax |
|
Topology |
Bus |
Bus |
Bus |
Star |
Star |
Star |
|
Characteristic |
IEEE 802.3 Values |
|
|---|---|---|
|
10BaseFX |
1000BaseFX |
|
|
Data rate (Mbps) |
100 |
1000 |
|
Signaling method |
Baseband |
Baseband |
|
Maximum segment length (m) |
Repeater 150 m; full-duplex 2000 m Single mode up to 6 to 10 km |
Repeater 150 m; full-duplex 2000 m Single mode up to 6 to 10 km |
|
Media |
Fiber (single mode or multimode) |
Fiber (single mode or multimode) |
|
Topology |
Star |
Star |
There are other 100Basen implementations, but they are not widely implemented for various reasons. One particular case in point is 100BaseT4. This system uses four pairs of copper wire and can be used on voice- and data-grade cable. 10/100BaseT systems perform well on Category 5 data-grade cable and use only two pairs of copper wire.
Ethernet is most similar to IEEE 802.3 10Base5. Both of these protocols specify a bus topology network with a connecting cable between the end stations and the actual network medium. In the case of Ethernet, that cable is called a transceiver cable. The transceiver cable connects to a transceiver device attached to the physical network medium. The IEEE 802.3 configuration is much the same, except that the connecting cable is referred to as an attachment unit interface (AUI), and the transceiver is called a media attachment unit (MAU). In both cases, the connecting cable attaches to an interface board (or interface circuitry) within the end station.
Frame Formats
Ethernet and IEEE 802.3 frame formats are shown in Figure 4-2.
Figure 4-2 Ethernet and IEEE 802.3 Frame Formats
Both Ethernet and IEEE 802.3 frames begin with an alternating pattern of ones and zeros called a preamble. The preamble tells receiving stations that a frame is coming.
The byte before the destination address in both an Ethernet and an IEEE 802.3 frame is a start-of-frame (SOF) delimiter. This byte ends with 2 consecutive 1 bits, which serve to synchronize the frame reception portions of all stations on the LAN.
Immediately following the preamble in both Ethernet and IEEE 802.3 LANs are the destination and source address fields. Both Ethernet and IEEE 802.3 addresses are 6 bytes long. Addresses are contained in hardware on the Ethernet and IEEE 802.3 interface cards. The first 3 bytes of the addresses are specified by the IEEE on a vendor-dependent basis, and the last 3 bytes are specified by the Ethernet or IEEE 802.3 vendor. The source address is always a unicast (single node) address, whereas the destination address may be unicast, multicast (group), or broadcast (all nodes).
In Ethernet frames, the 2-byte field following the source address is a type field. This field specifies the upper-layer protocol to receive the data after Ethernet processing is complete.
In IEEE 802.3 frames, the 2-byte field following the source address is a length field, which indicates the number of bytes of data that follow this field and precede the frame check sequence (FCS) field.
Following the type/length field is the actual data contained in the frame. After physical layer and link layer processing is complete, this data will eventually be sent to an upper-layer protocol. In the case of Ethernet, the upper-layer protocol is identified in the type field. In the case of IEEE 802.3, the upper-layer protocol must be defined within the data portion of the frame, if at all. If data in the frame is insufficient to fill the frame to its minimum 64-byte size, padding bytes are inserted to ensure at least a 64-byte frame.
In 802.3 the data field carries a payload header in addition to the payload itself. This header serves the logical link control sublayer of the OSI model and is completely independent of the MAC sublayer and physical layer below it. This header, functionally known as 802.2 encapsulation, contains destination service access point (DSAP) and source service access point (SSAP) information. This will notify higher protocols what type of payload is actually riding in the frame. It functions like the «type» field in traditional Ethernet and is used by upper-layer network protocols such as IPX. Network software developed to support the TCP/IP networking suite uses the type field to determine protocol type in an Ethernet frame. The type field and the LLC header are not replacements for each other, but they serve to offer backward compatibility between network protocol implementations without rewriting the entire Ethernet frame.
After the data field is a 4-byte frame check sequence (FCS) field containing a cyclic redundancy check (CRC) value. The CRC is created by the sending device and is recalculated by the receiving device to check for damage that might have occurred to the frame in transit.
Troubleshooting Ethernet
Table 4-5 provides troubleshooting procedures for common Ethernet media problems.
|
Media Problem |
Suggested Actions |
|---|---|
|
Excessive noise |
1.
2.
3.
4. |
|
Excessive collisions |
1.
2.
3. |
|
Excessive runt frames |
In a shared Ethernet environment, runt frames are almost always caused by collisions. If the collision rate is high, refer to the problem of excessive collisions, earlier in this table. If runt frames occur when collisions are not high or when in a switched Ethernet environment, then they are the result of underruns or bad software on a network interface card. Use a protocol analyzer to try to determine the source address of the runt frames. |
|
Late collisions |
1.
2. |
|
No link integrity on 10BaseT, 100BaseT4, or 100BaseTX |
1.
2.
3.
4. |
When you’re troubleshooting Ethernet media in a Cisco router environment, the show interfaces ethernet command provides several key fields of information that can assist with isolating problems. The following section provides a detailed description of the show interfaces ethernet command and the information that it provides.
show interfaces ethernet
Use the show interfaces ethernet privileged exec command to display information about an Ethernet interface on the router:
•![]() show interfaces ethernet unit [accounting]
show interfaces ethernet unit [accounting]
•![]() show interfaces ethernet [slot | port] [accounting] (for the Cisco 7200 series and Cisco 7500)
show interfaces ethernet [slot | port] [accounting] (for the Cisco 7200 series and Cisco 7500)
•![]() show interfaces ethernet [type slot | port-adapter | port] (for ports on VIP cards in the Cisco 7500 series routers)
show interfaces ethernet [type slot | port-adapter | port] (for ports on VIP cards in the Cisco 7500 series routers)
Syntax Description
unit—This must match a port number on the selected interface.
accounting—(Optional) This displays the number of packets of each protocol type that have been sent through the interface.
slot—Refer to the appropriate hardware manual for slot and port information.
port—Refer to the appropriate hardware manual for slot and port information.
port-adapter—Refer to the appropriate hardware manual for information about port adapter compatibility.
Command Mode
Privileged exec
Usage Guidelines
This command first appeared in Cisco IOS Release 10.0. If you do not provide values for the argument unit (or slot and port on the Cisco 7200 series, or slot and port-adapter on the Cisco 7500 series), the command will display statistics for all network interfaces. The optional keyword accounting displays the number of packets of each protocol type that have been sent through the interface.
Sample Display
The following is sample output from the show interfaces command for the Ethernet 0 interface:
Router# show interfaces ethernet 0
Ethernet 0 is up, line protocol is up
Hardware is MCI Ethernet, address is aa00.0400.0134 (via 0000.0c00.4369)
Internet address is 131.108.1.1, subnet mask is 255.255.255.0
MTU 1500 bytes, BW 10000 Kbit, DLY 1000 usec, rely 255/255, load 1/255
Encapsulation ARPA, loopback not set, keepalive set (10 sec)
ARP type: ARPA, PROBE, ARP Timeout 4:00:00
Last input 0:00:00, output 0:00:00, output hang never
Output queue 0/40, 0 drops; input queue 0/75, 2 drops
Five minute input rate 61000 bits/sec, 4 packets/sec
Five minute output rate 1000 bits/sec, 2 packets/sec
2295197 packets input, 305539992 bytes, 0 no buffer
Received 1925500 broadcasts, 0 runts, 0 giants
3 input errors, 3 CRC, 0 frame, 0 overrun, 0 ignored, 0 abort
0 input packets with dribble condition detected
3594664 packets output, 436549843 bytes, 0 underruns
8 output errors, 1790 collisions, 10 interface resets, 0 restarts
Table 4-6 presents show interfaces ethernet field descriptions.
|
Field |
Description |
|
Ethernet . . . is up . . . is administratively down |
Indicates whether the interface hardware is currently active and whether it has been taken down by an administrator. «Disabled» indicates that the router has received more than 5,000 errors in a keepalive interval, which is 10 seconds, by default. |
|
line protocol is {up | down | administratively down} |
Indicates whether the software processes that handle the line protocol believe that the interface is usable (that is, whether keepalives are successful) or if it has been taken down by an administrator. |
|
Hardware |
Specifies the hardware type (for example, MCI Ethernet, SCI, cBus Ethernet) and address. |
|
Internet address |
Specifies the Internet address, followed by the subnet mask. |
|
MTU |
Gives the maximum transmission unit of the interface. |
|
BW |
Gives the bandwidth of the interface in kilobits per second. |
|
DLY |
Gives the delay of the interface in microseconds. |
|
rely |
Shows reliability of the interface as a fraction of 255 (255/255 is 100 percent reliability), calculated as an exponential average over 5 minutes. |
|
load |
Shows load on the interface as a fraction of 255 (255/255 is completely saturated), calculated as an exponential average over 5 minutes. |
|
Encapsulation |
Specifies the encapsulation method assigned to interface. |
|
ARP type |
Specifies the type of Address Resolution Protocol assigned. |
|
loopback |
Indicates whether loopback is set. |
|
keepalive |
Indicates whether keepalives are set. |
|
Last input |
Gives the number of hours, minutes, and seconds since the last packet was successfully received by an interface. This is useful for knowing when a dead interface failed. |
|
Last output |
Gives the number of hours, minutes, and seconds since the last packet was successfully transmitted by an interface. |
|
output |
Gives the number of hours, minutes, and seconds since the last packet was successfully transmitted by the interface. This is useful for knowing when a dead interface failed. |
|
output hang |
Gives the number of hours, minutes, and seconds (or never) since the interface was last reset because of a transmission that took too long. When the number of hours in any of the «last» fields exceeds 24 hours, the number of days and hours is printed. If that field overflows, asterisks are printed. |
|
Last clearing |
Gives the time at which the counters that measure cumulative statistics (such as number of bytes transmitted and received) shown in this report were last reset to zero. Note that variables that might affect routing (for example, load and reliability) are not cleared when the counters are cleared. «***» indicates that the elapsed time is too large to be displayed. «0:00:00» indicates that the counters were cleared more than 231ms (and less than 232ms) ago. |
|
Output queue, input queue, drops |
Gives the number of packets in output and input queues. Each number is followed by a slash, the maximum size of the queue, and the number of packets dropped due to a full queue. |
|
Five minute input rate, Five minute output rate |
Gives the average number of bits and packets transmitted per second in the past 5 minutes. If the interface is not in promiscuous mode, it senses network traffic it sends and receives (rather than all network traffic). The 5-minute input and output rates should be used only as an approximation of traffic per second during a given 5-minute period. These rates are exponentially weighted averages with a time constant of 5 minutes. A period of four time constants must pass before the average will be within 2 percent of the instantaneous rate of a uniform stream of traffic over that period. |
|
packets input |
Gives the total number of error-free packets re
ceived by the system. |
|
bytes input |
Gives the total number of bytes, including data and MAC encapsulation, in the error-free packets received by the system. |
|
no buffers |
Gives the number of received packets discarded because there was no buffer space in the main system. Compare this with the ignored count. Broadcast storms on Ethernet networks and bursts of noise on serial lines are often responsible for no input buffer events. |
|
Received . . . broadcasts |
Shows the total number of broadcast or multicast packets received by the interface. |
|
Runts |
Gives the number of packets that are discarded because they are smaller than the medium’s minimum packet size. For instance, any Ethernet packet that is less than 64 bytes is considered a runt. |
|
giants |
Gives the number of packets that are discarded because they exceed the medium’s maximum packet size. For example, any Ethernet packet that is greater than 1518 bytes is considered a giant. |
|
input error |
Includes runts, giants, no buffer, CRC, frame, overrun, and ignored counts. Other input-related errors can also cause the input error count to be increased, and some datagrams may have more than one error; therefore, this sum may not balance with the sum of enumerated input error counts. |
|
CRC |
Indicates that the cyclic redundancy checksum generated by the originating LAN station or far-end device does not match the checksum calculated from the data received. On a LAN, this usually indicates noise or transmission problems on the LAN interface or the LAN bus itself. A high number of CRCs is usually the result of collisions or a station transmitting bad data. |
|
frame |
Shows the number of packets received incorrectly having a CRC error and a noninteger number of octets. On a LAN, this is usually the result of collisions or a malfunctioning Ethernet device. |
|
overrun |
Shows the number of times that the receiver hardware was incapable of handing received data to a hardware buffer because the input rate exceeded the receiver’s capability to handle the data. |
|
ignored |
Shows the number of received packets ignored by the interface because the interface hardware ran low on internal buffers. These buffers are different from the system buffers mentioned previously in the buffer description. Broadcast storms and bursts of noise can cause the ignored count to be increased. |
|
input packets with dribble condition detected |
Gives the dribble bit error, which indicates that a frame is slightly too long. This frame error counter is incremented just for informational purposes; the router accepts the frame. |
|
packets output |
Shows the total number of messages transmitted by the system. |
|
bytes |
Shows the total number of bytes, including data and MAC encapsulation, transmitted by the system. |
|
underruns |
Gives the number of times that the transmitter has been running faster than the router can handle. This may never be reported on some interfaces. |
|
output errors |
Gives the sum of all errors that prevented the final transmission of datagrams out of the interface being examined. Note that this may not balance with the sum of the enumerated output errors because some datagrams may have more than one error, and others may have errors that do not fall into any of the specifically tabulated categories. |
|
collisions |
Gives the number of messages retransmitted due to an Ethernet collision. This is usually the result of an overextended LAN (Ethernet or transceiver cable too long, more than two repeaters between stations, or too many cascaded multiport transceivers). A packet that collides is counted only once in output packets. |
|
interface resets |
Gives the number of times that an interface has been completely reset. This can happen if packets queued for transmission were not sent within several seconds. On a serial line, this can be caused by a malfunctioning modem that is not supplying the transmit clock signal, or by a cable problem. If the system notices that the carrier detect line of a serial interface is up, but the line protocol is down, it periodically resets the interface in an effort to restart it. Interface resets can also occur when an interface is looped back or shut down. |
|
restarts |
Gives the number of times a Type 2 Ethernet controller was restarted because of errors. |
Table Of Contents
Troubleshooting Serial Lines
Troubleshooting Using the show interfaces serial Command
Serial Lines: show interfaces serial Status Line Conditions
Serial Lines: Increasing Output Drops on Serial Link
Serial Lines: Increasing Input Drops on Serial Link
Serial Lines: Increasing Input Errors in Excess of 1 Percent of Total Interface Traffic
Serial Lines: Troubleshooting Serial Line Input Errors
Serial Lines: Increasing Interface Resets on Serial Link
Serial Lines: Increasing Carrier Transitions Count on Serial Link
Using the show controllers Command
Using debug Commands
Using Extended ping Tests
Troubleshooting Clocking Problems
Clocking Overview
Clocking Problem Causes
Detecting Clocking Problems
Isolating Clocking Problems
Clocking Problem Solutions
Inverting the Transmit Clock
Adjusting Buffers
Tuning System Buffers
Implementing Hold Queue Limits
Using Priority Queuing to Reduce Bottlenecks
Special Serial Line Tests
CSU and DSU Loopback Tests
CSU and DSU Local Loopback Tests for HDLC or PPP Links
CSU and DSU Remote Loopback Tests for HDLC or PPP Links
Detailed Information on the show interfaces serial Command
show interfaces serial
Syntax Description
Command Mode
Usage Guidelines
Sample Displays
Troubleshooting T1 Problems
Troubleshooting Using the show controller t1 Command
show controller t1 Conditions
Is the Controller Administratively Down?
Is the Line Up?
If Receiver Has Loss of Frame
If Receiver Has Loss of Signal
If the Line Is in Loopback Mode
If the Controller Displays Any Alarms
Receive (RX) Alarm Indication Signal (AIS) (Blue)
Receive (Rx) Remote Alarm Indication (Yellow)
Transmitter Sending Remote Alarm (Red)
Transmit (Tx) Remote Alarm Indication (Yellow)
Transmit (Tx) AIS (Blue)
Troubleshooting Error Events
Slip Secs Counter Is Increasing
Framing Loss Seconds Counter Is Increasing
Line Code Violations Are Increasing
Verify that isdn switchtype and pri-group Are Configured Correctly
Verifying the Signaling Channel
Troubleshooting a PRI
Troubleshooting Using the show isdn status Command
Using debug q921
Performing Hardware Loopback Plug Test
Performing the Loopback Plug Test
Troubleshooting E1 Problems
Troubleshooting Using the show controller e1 Command
Show controller e1 Conditions
Troubleshooting E1 Error Events
Verifying That isdn switchtype and pri-group Are Configured Correctly
Verifying the Signaling Channel
Troubleshooting a PRI
Troubleshooting Using the show isdn status Command
Using debug q921
Troubleshooting Serial Lines
This chapter presents general troubleshooting information and a discussion of tools and techniques for troubleshooting serial connections. The chapter consists of the following sections:
•![]() Troubleshooting Using the show interfaces serial Command
Troubleshooting Using the show interfaces serial Command
•![]() Using the show controllers Command
Using the show controllers Command
•![]() Using debug Commands
Using debug Commands
•![]() Using Extended ping Tests
Using Extended ping Tests
•![]() Troubleshooting Clocking Problems
Troubleshooting Clocking Problems
•![]() Adjusting Buffers
Adjusting Buffers
•![]() Special Serial Line Tests
Special Serial Line Tests
•![]() Detailed Information on the show interfaces serial Command
Detailed Information on the show interfaces serial Command
•![]() Troubleshooting T1 Problems
Troubleshooting T1 Problems
•![]() Troubleshooting E1 Problems
Troubleshooting E1 Problems
Troubleshooting Using the show interfaces serial Command
The output of the show interfaces serial exec command displays information specific to serial interfaces. Figure 15-1 shows the output of the show interfaces serial exec command for a High-Level Data Link Control (HDLC) serial interface.
This section describes how to use the show interfaces serial command to diagnose serial line connectivity problems in a wide-area network (WAN) environment. The following sections describe some of the important fields of the command output.
Other fields shown in the display are described in detail in the section «Detailed Information on the show interfaces serial Command,» later in this chapter.
Serial Lines: show interfaces serial Status Line Conditions
You can identify five possible problem states in the interface status line of the show interfaces serial display (see Figure 15-1):
•![]() Serial x is down, line protocol is down
Serial x is down, line protocol is down
•![]() Serial x is up, line protocol is down
Serial x is up, line protocol is down
•![]() Serial x is up, line protocol is up (looped)
Serial x is up, line protocol is up (looped)
•![]() Serial x is up, line protocol is down (disabled)
Serial x is up, line protocol is down (disabled)
•![]() Serial x is administratively down, line protocol is down
Serial x is administratively down, line protocol is down
Figure 15-1 Output of the HDLC show interface serial Command
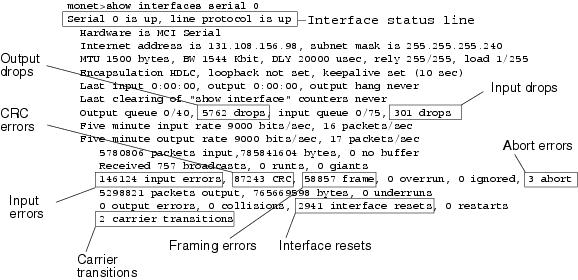
Table 15-1 shows the interface status conditions, possible problems associated with the conditions, and solutions to those problems.
|
Status Line |
Possible Problem |
Solution |
|---|---|---|
|
Serial x is up, line protocol is up |
— |
This is the proper status line condition. No action is required. |
|
Serial x is down, line protocol is down (DTE1 mode) |
The router is not sensing a CD2 signal (that is, the CD is not active). A telephone company problem has occurred—line is down or is not connected to CSU3 /DSU4 . Cabling is faulty or incorrect. Hardware failure has occurred (CSU/DSU). |
1.
2.
3.
4.
5.
6. |
|
Serial x is up, line protocol is down (DTE mode) |
A local or remote router is misconfigured. Keepalives are not being sent by the remote router. A leased-line or other carrier service problem has occurred (noisy line or misconfigured or failed switch). A timing problem has occurred on the cable (SCTE5 not set on CSU/DSU). A local or remote CSU/DSU has failed. Router hardware (local or remote) has failed. |
1. If the line protocol comes up, a telephone company problem or a failed remote router is the likely problem.
2.
3.
4. |
|
Serial x is up, line protocol is down (DTE mode) (continued) |
Caution: Because debugging output is assigned high priority in the CPU process, it can render the system unusable. For this reason, use debug commands only to troubleshoot specific problems or during troubleshooting sessions with Cisco technical support staff. Moreover, it is best to use debug commands during periods of lower network traffic and fewer users. Debugging during these periods decreases the likelihood that increased debug command processing overhead will affect system use.
5.
6.
7. |
|
|
Serial x is up, line protocol is down (DCE6 mode) |
The clockrate interface configuration command is missing. The DTE device does not support or is not set up for SCTE mode (terminal timing). The remote CSU or DSU has failed. |
1. Syntax: clock rate bps Syntax Description:
• |
|
Serial x is up, line protocol is down (DCE mode) (continued) |
The clockrate interface configuration command is missing. The DTE device does not support or is not set up for SCTE mode (terminal timing). The remote CSU or DSU has failed. |
2.
3.
4.
5. |
|
Serial x is up, line protocol is up (looped) |
A loop exists in the circuit. The sequence number in the keepalive packet changes to a random number when a loop is initially detected. If the same random number is returned over the link, a loop exists. |
1.
2.
3.
4.
5. |
|
Serial x is up, line protocol is down (disabled) |
A high error rate has occurred due to a telephone company service problem. A CSU or DSU hardware problem has occurred. Router hardware (interface) is bad. |
1.
2.
3. |
|
Serial x is administrat-ively down, line protocol is down |
The router configuration includes the shutdown interface configuration command. A duplicate IP address exists. |
1.
2.
3.
4. |
1 DTE = data terminal equipment
2 CD = carrier detect
3 CSU = channel service unit
4 DSU = digital service unit
5 SCTE = serial clock transmit external
6 DCE = data circuit-terminating equipment or data communications equipment
7 CTS = clear-to-send
8 DSR = data-set ready
Serial Lines: Increasing Output Drops on Serial Link
Output drops appear in the output of the show interfaces serial command (refer to Figure 15-1) when the system is attempting to hand off a packet to a transmit buffer but no buffers are available.
Symptom: Increasing output drops on serial link
Table 15-2 outlines the possible problem that might cause this symptom and describes solutions to that problem.
|
Possible Problem |
Solution |
|---|---|
|
Input rate to serial interface exceeds bandwidth available on serial link |
1. |
|
Input rate to serial interface exceeds bandwidth available on serial link (continued) |
2.
3.
4. Note: Output drops are acceptable under certain conditions. For instance, if a link is known to be overused (with no way to remedy the situation), it is often considered preferable to drop packets than to hold them. This is true for protocols that support flow control and can retransmit data (such as TCP/IP and Novell IPX2 ). However, some protocols, such as DECnet and local-area transport, are sensitive to dropped packets and accommodate retransmission poorly, if at all. |
1 SAP = Service Advertising Protocol
2 IPX = Internetwork Packet Exchange
Serial Lines: Increasing Input Drops on Serial Link
Input drops appear in the output of the show interfaces serial exec command (refer to Figure 15-1) when too many packets from that interface are still being processed in the system.
Symptom: Increasing number of input drops on serial link
Table 15-3 outlines the possible problem that might cause this symptom and describes solutions to that problem.
|
Possible Problem |
Solution |
|---|---|
|
Input rate exceeds the capacity of the router, or input queues exceed the size of output queues |
Note: Input drop problems are typically seen when traffic is being routed between faster interfaces (such as Ethernet, Token Ring, and FDDI1 ) and serial interfaces. When traffic is light, there is no problem. As traffic rates increase, backups start occurring. Routers drop packets during these congested periods. |
|
Input rate exceeds the capacity of the router, or input queues exceed the size of output queues (continued) |
1.
2. |
1 FDDI = Fiber Distributed Data Interface
Serial Lines: Increasing Input Errors in Excess of 1 Percent of Total Interface Traffic
If input errors appear in the show interfaces serial output (refer to Figure 15-1), there are several possible sources of those errors. The most likely sources are summarized in Table 15-4.

Note ![]() Any input error value for cyclic redundancy check (CRC) errors, framing errors, or aborts above 1 percent of the total interface traffic suggests some kind of link problem that should be isolated and repaired.
Any input error value for cyclic redundancy check (CRC) errors, framing errors, or aborts above 1 percent of the total interface traffic suggests some kind of link problem that should be isolated and repaired.
Symptom: Increasing number of input errors in excess of 1 percent of total interface traffic
|
Possible Problem |
Solution |
|---|---|
|
The following problems can result in this symptom:
•
•
• |
Note: Cisco strongly recommends against the use of data converters when you are connecting a router to a WAN or a serial network.
1. |
|
•
•
•
•
• |
2.
3. |
Serial Lines: Troubleshooting Serial Line Input Errors
Table 15-5 describes the various types of input errors displayed by the show interfaces serial command (see Figure 15-1), possible problems that might be causing the errors, and solutions to those problems.
|
Input Error Type |
Possible Problem |
Solution |
|---|---|---|
|
CRC errors (CRC) |
CRC errors occur when the CRC calculation does not pass (indicating that data is corrupted) for one of the following reasons:
•
•
• |
1.
2.
3.
4. |
|
CRC errors (CRC) (continued) |
•
• |
5. |
|
Framing errors (frame) |
A framing error occurs when a packet does not end on an 8-bit byte boundary for one of the following reasons:
•
•
•
• |
1.
2.
3.
4.
5. |
|
Aborted transmission (abort) |
Aborts indicate an illegal sequence of 1 bit (more than seven in a row) The following are possible reasons for this to occur:
•
•
•
•
•
• |
1.
2.
3.
4.
5.
6. |
1 ESF = Extended Superframe Format
2 B8ZS = binary eight-zero substitution
Serial Lines: Increasing Interface Resets on Serial Link
Interface resets that appear in the output of the show interfaces serial exec command (see Figure 15-1) are the result of missed keepalive packets.
Symptom: Increasing interface resets on serial link
Table 15-6 outlines the possible problems that might cause this symptom and describes solutions to those problems.
|
Possible Problem |
Solution |
|---|---|
|
The following problems can result in this symptom:
•
•
• |
When interface resets are occurring, examine other fields of the show interfaces serial command output to determine the source of the problem. Assuming that an increase in interface resets is being recorded, examine the following fields:
1.
2.
3. |
Serial Lines: Increasing Carrier Transitions Count on Serial Link
Carrier transitions appear in the output of the show interfaces serial exec command whenever there is an interruption in the carrier signal (such as an interface reset at the remote end of a link).
Symptom: Increasing carrier transitions count on serial link
Table 15-7 outlines the possible problems that might cause this symptom and describes solutions to those problems.
|
Possible Problem |
Solution |
|---|---|
|
The following problems can result in this symptom:
•
• |
1.
2.
3. |
Using the show controllers Command
The show controllers exec command is another important diagnostic tool when troubleshooting serial lines. The command syntax varies, depending on platform:
•![]() For serial interfaces on Cisco 7000 series routers, use the show controllers cbus exec command.
For serial interfaces on Cisco 7000 series routers, use the show controllers cbus exec command.
•![]() For Cisco access products, use the show controllers exec command.
For Cisco access products, use the show controllers exec command.
•![]() For the AGS, CGS, and MGS, use the show controllers mci exec command.
For the AGS, CGS, and MGS, use the show controllers mci exec command.
Figure 15-2 shows the output from the show controllers cbus exec command. This command is used on Cisco 7000 series routers with the Fast Serial Interface Processor (FSIP) card. Check the command output to make certain that the cable to the channel service unit/digital service unit (CSU/DSU) is attached to the proper interface. You can also check the microcode version to see whether it is current.
Figure 15-2 show controllers cbus Command Output
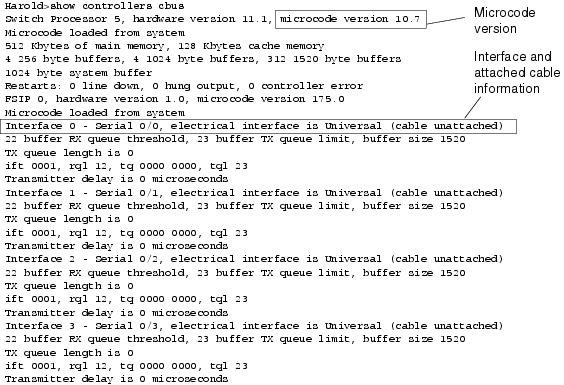
On access products such as the Cisco 2000, Cisco 2500, Cisco 3000, and Cisco 4000 series access servers and routers, use the show controllers exec command. Figure 15-3 shows the show controllers command output from the Basic Rate Interface (BRI) and serial interfaces on a Cisco 2503 access server. (Note that some output is not shown.)
The show controllers output indicates the state of the interface channels and whether a cable is attached to the interface. In Figure 15-3, serial interface 0 has an RS-232 DTE cable attached. Serial interface 1 has no cable attached.
Figure 15-4 shows the output of the show controllers mci command. This command is used on AGS, CGS, and MGS routers only. If the electrical interface is displayed as UNKNOWN (instead of V.35, EIA/TIA-449, or some other electrical interface type), an improperly connected cable is the likely problem. A bad applique or a problem with the internal wiring of the card is also possible. If the electrical interface is unknown, the corresponding display for the show interfaces serial exec command will show that the interface and line protocol are down.
Figure 15-3 show controllers Command Output
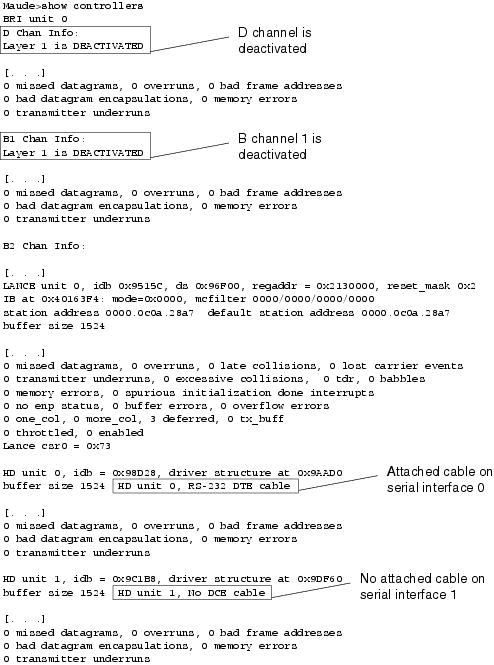
Figure 15-4 show controllers mci Command Output
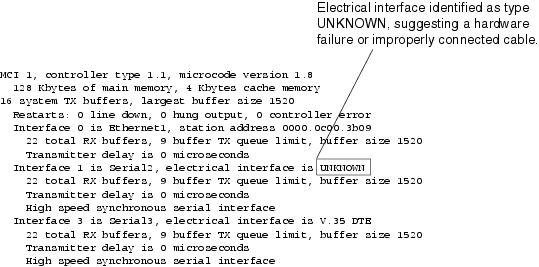
Using debug Commands
The output of the various debug privileged exec commands provides diagnostic information relating to protocol status and network activity for many internetworking events.

Caution ![]() Because debugging output is assigned high priority in the CPU process, it can render the system unusable. For this reason, use debug commands only to troubleshoot specific problems or during troubleshooting sessions with Cisco technical support staff. Moreover, it is best to use debug commands during periods of lower network traffic and fewer users. Debugging during these periods decreases the likelihood that increased debug command processing overhead will affect system use. When you finish using a debug command, remember to disable it with its specific no debug command or with the no debug all command.
Because debugging output is assigned high priority in the CPU process, it can render the system unusable. For this reason, use debug commands only to troubleshoot specific problems or during troubleshooting sessions with Cisco technical support staff. Moreover, it is best to use debug commands during periods of lower network traffic and fewer users. Debugging during these periods decreases the likelihood that increased debug command processing overhead will affect system use. When you finish using a debug command, remember to disable it with its specific no debug command or with the no debug all command.
Following are some debug commands that are useful when troubleshooting serial and WAN problems. More information about the function and output of each of these commands is provided in the Debug Command Reference publication:
•![]() debug serial interface—Verifies whether HDLC keepalive packets are incrementing. If they are not, a possible timing problem exists on the interface card or in the network.
debug serial interface—Verifies whether HDLC keepalive packets are incrementing. If they are not, a possible timing problem exists on the interface card or in the network.
•![]() debug x25 events—Detects X.25 events, such as the opening and closing of switched virtual circuits (SVCs). The resulting cause and diagnostic information is included with the event report.
debug x25 events—Detects X.25 events, such as the opening and closing of switched virtual circuits (SVCs). The resulting cause and diagnostic information is included with the event report.
•![]() debug lapb—Outputs Link Access Procedure, Balanced (LAPB) or Level 2 X.25 information.
debug lapb—Outputs Link Access Procedure, Balanced (LAPB) or Level 2 X.25 information.
•![]() debug arp—Indicates whether the router is sending information about or learning about routers (with ARP packets) on the other side of the WAN cloud. Use this command when some nodes on a TCP/IP network are responding, but others are not.
debug arp—Indicates whether the router is sending information about or learning about routers (with ARP packets) on the other side of the WAN cloud. Use this command when some nodes on a TCP/IP network are responding, but others are not.
•![]() debug frame-relay lmi—Obtains Local Management Interface (LMI) information useful for determining whether a Frame Relay switch and a router are sending and receiving LMI packets.
debug frame-relay lmi—Obtains Local Management Interface (LMI) information useful for determining whether a Frame Relay switch and a router are sending and receiving LMI packets.
•![]() debug frame-relay events—Determines whether exchanges are occurring between a router and a Frame Relay switch.
debug frame-relay events—Determines whether exchanges are occurring between a router and a Frame Relay switch.
•![]() debug ppp negotiation—Shows Point-to-Point Protocol (PPP) packets transmitted during PPP startup, where PPP options are negotiated.
debug ppp negotiation—Shows Point-to-Point Protocol (PPP) packets transmitted during PPP startup, where PPP options are negotiated.
•![]() debug ppp packet—Shows PPP packets being sent and received. This command displays low-level packet dumps.
debug ppp packet—Shows PPP packets being sent and received. This command displays low-level packet dumps.
•![]() debug ppp errors—Shows PPP errors (such as illegal or malformed frames) associated with PPP connection negotiation and operation.
debug ppp errors—Shows PPP errors (such as illegal or malformed frames) associated with PPP connection negotiation and operation.
•![]() debug ppp chap—Shows PPP Challenge Handshake Authentication Protocol (CHAP) and Password Authentication Protocol (PAP) packet exchanges.
debug ppp chap—Shows PPP Challenge Handshake Authentication Protocol (CHAP) and Password Authentication Protocol (PAP) packet exchanges.
•![]() debug serial packet—Shows Switched Multimegabit Data Service (SMDS) packets being sent and received. This display also prints error messages to indicate why a packet was not sent or was received erroneously. For SMDS, the command dumps the entire SMDS header and some payload data when an SMDS packet is transmitted or received.
debug serial packet—Shows Switched Multimegabit Data Service (SMDS) packets being sent and received. This display also prints error messages to indicate why a packet was not sent or was received erroneously. For SMDS, the command dumps the entire SMDS header and some payload data when an SMDS packet is transmitted or received.
Using Extended ping Tests
The ping command is a useful test available on Cisco internetworking devices as well as on many host systems. In TCP/IP, this diagnostic tool is also known as an Internet Control Message Protocol (ICMP) echo request.
Note ![]() The ping command is particularly useful when high levels of input errors are being registered in the show interfaces serial display. See Figure 15-1.
The ping command is particularly useful when high levels of input errors are being registered in the show interfaces serial display. See Figure 15-1.
Cisco internetworking devices provide a mechanism to automate the sending of many ping packets in sequence. Figure 15-5 illustrates the menu used to specify extended ping options. This example specifies 20 successive pings. However, when testing the components on your serial line, you should specify a much larger number, such as 1000 pings. Also increase the datagram size to a larger number, such as 1500.
Figure 15-5 Extended ping Specification Menu
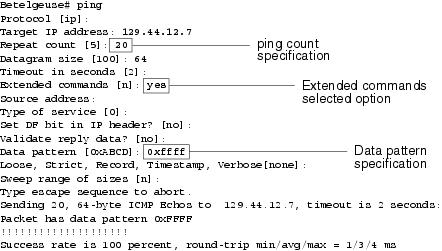
In general, perform serial line ping tests as follows:
Step 1 ![]() Put the CSU or DSU into local loopback mode.
Put the CSU or DSU into local loopback mode.
Step 2 ![]() Configure the extended ping command to send different data patterns and packet sizes. Figure 15-6 and Figure 15-7 illustrate two useful ping tests, an all-zeros 1500-byte ping and an all-ones 1500-byte ping, respectively.
Configure the extended ping command to send different data patterns and packet sizes. Figure 15-6 and Figure 15-7 illustrate two useful ping tests, an all-zeros 1500-byte ping and an all-ones 1500-byte ping, respectively.
Step 3 ![]() Examine the show interfaces serial command output (see Figure 15-1) and determine whether input errors have increased. If input errors have not increased, the local hardware (DSU, cable, router interface card) is probably in good condition.
Examine the show interfaces serial command output (see Figure 15-1) and determine whether input errors have increased. If input errors have not increased, the local hardware (DSU, cable, router interface card) is probably in good condition.
Assuming that this test sequence was prompted by the appearance of a large number of CRC and framing errors, a clocking problem is likely. Check the CSU or DSU for a timing problem. See the section «Troubleshooting Clocking Problems,» next.
Step 4 ![]() If you determine that the clocking configuration is correct and is operating properly, put the CSU or DSU into remote loopback mode.
If you determine that the clocking configuration is correct and is operating properly, put the CSU or DSU into remote loopback mode.
Step 5 ![]() Repeat the ping test and look for changes in the input error statistics.
Repeat the ping test and look for changes in the input error statistics.
Step 6 ![]() If input errors increase, there is a problem either in the serial line or on the CSU/DSU. Contact the WAN service provider and swap the CSU or DSU. If problems persist, contact your technical support representative.
If input errors increase, there is a problem either in the serial line or on the CSU/DSU. Contact the WAN service provider and swap the CSU or DSU. If problems persist, contact your technical support representative.
Figure 15-6 All-Zeros 1500-Byte ping Test
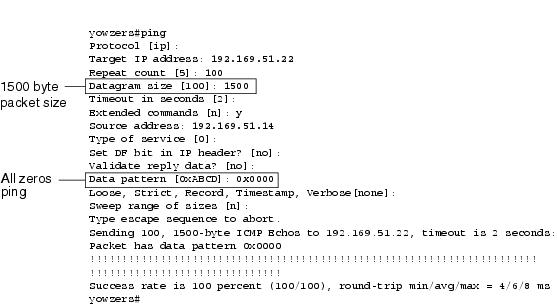
Figure 15-7 All-Ones 1500-Byte ping Test
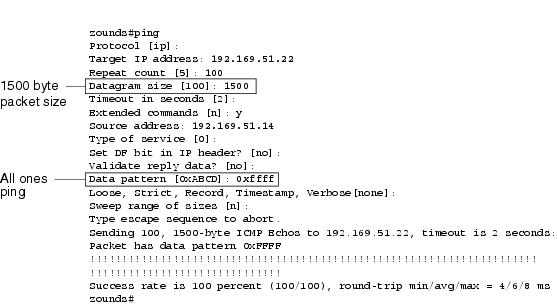
Troubleshooting Clocking Problems
Clocking conflicts in serial connections can lead either to chronic loss of connection service or to degraded performance. This section discusses the important aspects of clocking problems: clocking problem causes, how to detect clocking problems, how to isolate clocking problems, and clocking problem solutions.
Clocking Overview
The CSU/DSU derives the data clock from the data that passes through it. To recover the clock, the CSU/DSU hardware must receive at least one 1-bit value for every 8 bits of data that pass through it; this is known as ones density. Maintaining ones density allows the hardware to recover the data clock reliably.
Newer T1 implementations commonly use Extended Superframe Format (ESF) framing with binary eight-zero substitution (B8ZS) coding. B8ZS provides a scheme by which a special code is substituted whenever eight consecutive zeros are sent through the serial link. This code is then interpreted at the remote end of the connection. This technique guarantees ones density independent of the data stream.
Older T1 implementations use D4 (also known as Superframe Format [SF]) framing and Alternate Mark Inversion (AMI) coding. AMI does not utilize a coding scheme like B8ZS. This restricts the type of data that can be transmitted because ones density is not maintained independent of the data stream.
Another important element in serial communications is serial clock transmit external (SCTE) terminal timing. SCTE is the clock echoed back from the data terminal equipment (DTE) device (for example, a router) to the data communications equipment (DCE) device (for example, the CSU/DSU).
When the DCE device uses SCTE instead of its internal clock to sample data from the DTE, it can better sample the data without error even if there is a phase shift in the cable between the CSU/DSU and the router. Using SCTE is highly recommended for serial transmissions faster than 64 kbps. If your CSU/DSU does not support SCTE, see the section «Inverting the Transmit Clock,» later in this chapter.
Clocking Problem Causes
In general, clocking problems in serial WAN interconnections can be attributed to one of the following causes:
•![]() Incorrect DSU configuration
Incorrect DSU configuration
•![]() Incorrect CSU configuration
Incorrect CSU configuration
•![]() Cables out of specification (longer than 50 feet [15.24 meters] or unshielded)
Cables out of specification (longer than 50 feet [15.24 meters] or unshielded)
•![]() Noisy or poor patch panel connections
Noisy or poor patch panel connections
•![]() Several cables connected in a row
Several cables connected in a row
Detecting Clocking Problems
To detect clocking conflicts on a serial interface, look for input errors as follows:
Step 1 ![]() Use the show interfaces serial exec command on the routers at both ends of the link.
Use the show interfaces serial exec command on the routers at both ends of the link.
Step 2 ![]() Examine the command output for CRC, framing errors, and aborts.
Examine the command output for CRC, framing errors, and aborts.
Step 3 ![]() If either of these steps indicates errors exceeding an approximate range of 0.5 percent to 2.0 percent of traffic on the interface, clocking problems are likely to exist somewhere in the WAN.
If either of these steps indicates errors exceeding an approximate range of 0.5 percent to 2.0 percent of traffic on the interface, clocking problems are likely to exist somewhere in the WAN.
Step 4 ![]() Isolate the source of the clocking conflicts, as outlined in the following section, «Isolating Clocking Problems.»
Isolate the source of the clocking conflicts, as outlined in the following section, «Isolating Clocking Problems.»
Step 5 ![]() Bypass or repair any faulty patch panels.
Bypass or repair any faulty patch panels.
Isolating Clocking Problems
After you determine that clocking conflicts are the most likely cause of input errors, use the following procedure to isolate the source of those errors:
Step 1 ![]() Perform a series of ping tests and loopback tests (both local and remote), as described in the section «CSU and DSU Loopback Tests,» earlier in this chapter.
Perform a series of ping tests and loopback tests (both local and remote), as described in the section «CSU and DSU Loopback Tests,» earlier in this chapter.
Step 2 ![]() Determine which end of the connection is the source of the problem, or whether the problem is in the line. In local loopback mode, run different patterns and sizes in the ping tests (for example, use 1500-byte datagrams). Using a single pattern and packet size may not force errors to materialize, particularly when a serial cable to the router or CSU/DSU is the problem.
Determine which end of the connection is the source of the problem, or whether the problem is in the line. In local loopback mode, run different patterns and sizes in the ping tests (for example, use 1500-byte datagrams). Using a single pattern and packet size may not force errors to materialize, particularly when a serial cable to the router or CSU/DSU is the problem.
Step 3 ![]() Use the show interfaces serial exec command, and determine whether input errors counts are increasing and where they are accumulating.
Use the show interfaces serial exec command, and determine whether input errors counts are increasing and where they are accumulating.
If input errors are accumulating on both ends of the connection, clocking of the CSU is the most likely problem.
If only one end is experiencing input errors, there is probably a DSU clocking or cabling problem.
Aborts on one end suggest that the other end is sending bad information or that there is a line problem.
Note ![]() Always refer to the show interfaces serial command output (see Figure 15-1). Log any changes in error counts, or note if the error count does not change.
Always refer to the show interfaces serial command output (see Figure 15-1). Log any changes in error counts, or note if the error count does not change.
Clocking Problem Solutions
Table 15-8 outlines suggested remedies for clocking problems, based on the source of the problem.
|
Possible Problem |
Solution |
|---|---|
|
Incorrect CSU configuration |
1.
2.
3. |
|
Incorrect DSU configuration |
1.
2. (For any interface that is connected to a line of 128 kbps or faster, SCTE must be enabled. If your DSU does not support SCTE, see the section «Inverting the Transmit Clock,» later in this chapter.)
3. Check with your leased-line provider for information on its framing and coding schemes.
4. |
|
Cable to router out of specification |
If the cable is longer than 50 feet (15.24 meters), use a shorter cable. If the cable is unshielded, replace it with shielded cable. |
Inverting the Transmit Clock
If you are attempting serial connections at speeds greater than 64 kbps with a CSU/DSU that does not support SCTE, you might have to invert the transmit clock on the router. Inverting the transmit clock compensates for phase shifts between the data and clock signals.
The specific command used to invert the transmit clock varies between platforms. On a Cisco 7000 series router, enter the invert-transmit-clock interface configuration command. For Cisco 4000 series routers, use the dte-invert-txc interface configuration command.
To ensure that you are using the correct command syntax for your router, refer to the user guide for your router or access server and to the Cisco IOS configuration guides and command references.
Note ![]() On older platforms, inverting the transmit clock might require that you move a physical jumper.
On older platforms, inverting the transmit clock might require that you move a physical jumper.
Adjusting Buffers
Excessively high bandwidth utilization greater than 70 percent results in reduced overall performance and can cause intermittent failures. For example, DECnet file transmissions might be failing because of packets being dropped somewhere in the network.
If the situation is bad enough, you must increase the bandwidth of the link. However, increasing the bandwidth might not be necessary or immediately practical. One way to resolve marginal serial line overutilization problems is to control how the router uses data buffers.
Caution ![]() In general, do not adjust system buffers unless you are working closely with a Cisco technical support representative. You can severely affect the performance of your hardware and your network if you incorrectly adjust the system buffers on your router.
In general, do not adjust system buffers unless you are working closely with a Cisco technical support representative. You can severely affect the performance of your hardware and your network if you incorrectly adjust the system buffers on your router.
Use one of the following three options to control how buffers are used:
•![]() Adjust parameters associated with system buffers.
Adjust parameters associated with system buffers.
•![]() Specify the number of packets held in input or output queues (hold queues).
Specify the number of packets held in input or output queues (hold queues).
•![]() Prioritize how traffic is queued for transmission (priority output queuing).
Prioritize how traffic is queued for transmission (priority output queuing).
The configuration commands associated with these options are described in the Cisco IOS configuration guides and command references.
The following section focuses on identifying situations in which these options are likely to apply and defining how you can use these options to help resolve connectivity and performance problems in serial/WAN interconnections.
Tuning System Buffers
There are two general buffer types on Cisco routers: hardware buffers and system buffers. Only the system buffers are directly configurable by system administrators. The hardware buffers are specifically used as the receive and transmit buffers associated with each interface and (in the absence of any special configuration) are dynamically managed by the system software itself.
The system buffers are associated with the main system memory and are allocated to different-size memory blocks. A useful command for determining the status of your system buffers is the show buffers exec command. Figure 15-8 shows the output from the show buffers command.
Figure 15-8 show buffers Command Output
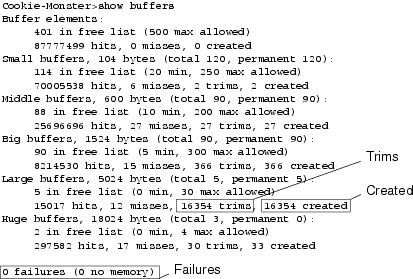
In the show buffers output, the following is true:
•![]() total identifies the total number of buffers in the pool, including used and unused buffers.
total identifies the total number of buffers in the pool, including used and unused buffers.
•![]() permanent identifies the permanent number of allocated buffers in the pool. These buffers are always in the pool and cannot be trimmed away.
permanent identifies the permanent number of allocated buffers in the pool. These buffers are always in the pool and cannot be trimmed away.
•![]() in free list identifies the number of buffers currently in the pool that are available for use.
in free list identifies the number of buffers currently in the pool that are available for use.
•![]() min identifies the minimum number of buffers that the route processor (RP) should attempt to keep in the free list:
min identifies the minimum number of buffers that the route processor (RP) should attempt to keep in the free list:
–![]() The min parameter is used to anticipate demand for buffers from the pool at any given time.
The min parameter is used to anticipate demand for buffers from the pool at any given time.
–![]() If the number of buffers in the free list falls below the min value, the RP attempts to create more buffers for that pool.
If the number of buffers in the free list falls below the min value, the RP attempts to create more buffers for that pool.
•![]() max allowed identifies the maximum number of buffers allowed in the free list:
max allowed identifies the maximum number of buffers allowed in the free list:
–![]() The max allowed parameter prevents a pool from monopolizing buffers that it doesn’t need anymore, and frees this memory back to the system for further use.
The max allowed parameter prevents a pool from monopolizing buffers that it doesn’t need anymore, and frees this memory back to the system for further use.
–![]() If the number of buffers in the free list is greater than the max allowed value, the RP should attempt to trim buffers from the pool.
If the number of buffers in the free list is greater than the max allowed value, the RP should attempt to trim buffers from the pool.
•![]() hits identifies the number of buffers that have been requested from the pool. The hits counter provides a mechanism for determining which pool must meet the highest demand for buffers.
hits identifies the number of buffers that have been requested from the pool. The hits counter provides a mechanism for determining which pool must meet the highest demand for buffers.
•![]() misses identifies the number of times that a buffer has been requested and that the RP detected that additional buffers were required. (In other words, the number of buffers in the free list has dropped below min.) The misses counter represents the number of times that the RP has been forced to create additional buffers.
misses identifies the number of times that a buffer has been requested and that the RP detected that additional buffers were required. (In other words, the number of buffers in the free list has dropped below min.) The misses counter represents the number of times that the RP has been forced to create additional buffers.
•![]() trims identifies the number of buffers that the RP has trimmed from the pool when the number of buffers in the free list exceeded the number of max allowed buffers.
trims identifies the number of buffers that the RP has trimmed from the pool when the number of buffers in the free list exceeded the number of max allowed buffers.
•![]() created identifies the number of buffers that has been created in the pool. The RP creates buffers when demand for buffers has increased until the number of buffers in the free list is less than min buffers or a miss occurs because of zero buffers in the free list.
created identifies the number of buffers that has been created in the pool. The RP creates buffers when demand for buffers has increased until the number of buffers in the free list is less than min buffers or a miss occurs because of zero buffers in the free list.
•![]() failures identifies the number of failures to grant a buffer to a requester even after attempting to create an additional buffer. The number of failures represents the number of packets that have been dropped due to buffer shortage.
failures identifies the number of failures to grant a buffer to a requester even after attempting to create an additional buffer. The number of failures represents the number of packets that have been dropped due to buffer shortage.
•![]() no memory identifies the number of failures caused by insufficient memory to create additional buffers.
no memory identifies the number of failures caused by insufficient memory to create additional buffers.
The show buffers command output in Figure 15-8 indicates high numbers in the Trims and Created fields for large buffers. If you are receiving high numbers in these fields, you can increase your serial link performance by increasing the max free value configured for your system buffers. trims identifies the number of buffers that the RP has trimmed from the pool when the number of buffers in free list exceeded the number of max allowed buffers.
Use the buffers max free number global configuration command to increase the number of free system buffers. The value that you configure should be approximately 150 percent of the figure indicated in the total field of the show buffers command output. Repeat this process until the show buffers output no longer indicates trims and created buffers.
If the show buffers command output shows a large number of failures in the (no memory) field (see the last line of output in Figure 15-8), you must reduce the usage of the system buffers or increase the amount of shared or main memory (physical RAM) on the router. Call your technical support representative for assistance.
Implementing Hold Queue Limits
Hold queues are buffers used by each router interface to store outgoing or incoming packets. Use the hold-queue interface configuration command to increase the number of data packets queued before the router will drop packets. Increase these queues by small increments (for instance, 25 percent) until you no longer see drops in the show interfaces output. The default output hold queue limit is 100 packets.
Note ![]() The hold-queue command is used for process-switched packets and periodic updates generated by the router.
The hold-queue command is used for process-switched packets and periodic updates generated by the router.
Use the hold-queue command to prevent packets from being dropped and to improve serial link performance under the following conditions:
•![]() You have an application that cannot tolerate drops, and the protocol is capable of tolerating longer delays. DECnet is an example of a protocol that meets both criteria. Local-area transport (LAT) does not meet this criteria because it does not tolerate delays.
You have an application that cannot tolerate drops, and the protocol is capable of tolerating longer delays. DECnet is an example of a protocol that meets both criteria. Local-area transport (LAT) does not meet this criteria because it does not tolerate delays.
•![]() The interface is very slow (bandwidth is low or anticipated utilization is likely to sporadically exceed available bandwidth).
The interface is very slow (bandwidth is low or anticipated utilization is likely to sporadically exceed available bandwidth).
Note ![]() When you increase the number specified for an output hold queue, you might need to increase the number of system buffers. The value used depends on the size of the packets associated with the traffic anticipated for the network.
When you increase the number specified for an output hold queue, you might need to increase the number of system buffers. The value used depends on the size of the packets associated with the traffic anticipated for the network.
Using Priority Queuing to Reduce Bottlenecks
Priority queuing is a list-based control mechanism that allows traffic to be prioritized on an interface-by-interface basis. Priority queuing involves two steps:
Step 1 ![]() Create a priority list by protocol type and level of priority.
Create a priority list by protocol type and level of priority.
Step 2 ![]() Assign the priority list to a specific interface.
Assign the priority list to a specific interface.
Both of these steps use versions of the priority-list global configuration command. In addition, further traffic control can be applied by referencing access-list global configuration commands from priority-list specifications. For examples of defining priority lists and for details about command syntax associated with priority queuing, refer to the Cisco IOS configuration guides and command references.
Note ![]() Priority queuing automatically creates four hold queues of varying size. This overrides any hold queue specification included in your configuration.
Priority queuing automatically creates four hold queues of varying size. This overrides any hold queue specification included in your configuration.
Use priority queuing to prevent packets from being dropped and to improve serial link performance under the following conditions:
•![]() When the interface is slow, a variety of traffic types are being transmitted, and you want to improve terminal traffic performance
When the interface is slow, a variety of traffic types are being transmitted, and you want to improve terminal traffic performance
•![]() If you have a serial link that is intermittently experiencing very heavy loads (such as file transfers occurring at specific times), and priority queuing will help select which types of traffic should be discarded at high traffic periods
If you have a serial link that is intermittently experiencing very heavy loads (such as file transfers occurring at specific times), and priority queuing will help select which types of traffic should be discarded at high traffic periods
In general, start with the default number of queues when implementing priority queues. After enabling priority queuing, monitor output drops with the show interfaces serial exec command. If you notice that output drops are occurring in the traffic queue that you have specified to be high priority, increase the number of packets that can be queued (using the queue-limit keyword option of the priority-list global configuration command). The default queue-limit arguments are 20 packets for the high-priority queue, 40 for medium, 60 for normal, and 80 for low.
Note ![]() When bridging Digital Equipment Corporation (Digital) LAT traffic, the router must drop very few packets, or LAT sessions can terminate unexpectedly. A high-priority queue depth of about 100 (specified with the queue-limit keyword) is a typical working value when your router is dropping output packets and the serial lines are subjected to about 50 percent bandwidth utilization. If the router is dropping packets and is at 100 percent utilization, you need another line.
When bridging Digital Equipment Corporation (Digital) LAT traffic, the router must drop very few packets, or LAT sessions can terminate unexpectedly. A high-priority queue depth of about 100 (specified with the queue-limit keyword) is a typical working value when your router is dropping output packets and the serial lines are subjected to about 50 percent bandwidth utilization. If the router is dropping packets and is at 100 percent utilization, you need another line.
Another tool to relieve congestion when bridging Digital LAT is LAT compression. You can implement LAT compression with the interface configuration command bridge-group group lat-compression.
Special Serial Line Tests
In addition to the basic diagnostic capabilities available on routers, a variety of supplemental tools and techniques can be used to determine the conditions of cables, switching equipment, modems, hosts, and remote internetworking hardware. For more information, consult the documentation for your CSU, DSU, serial analyzer, or other equipment.
CSU and DSU Loopback Tests
If the output of the show interfaces serial exec command indicates that the serial line is up but the line protocol is down, use the CSU/DSU loopback tests to determine the source of the problem. Perform the local loop test first, and then perform the remote test. Figure 15-9 illustrates the basic topology of the CSU/DSU local and remote loopback tests.
Figure 15-9 CSU/DSU Local and Remote Loopback Tests
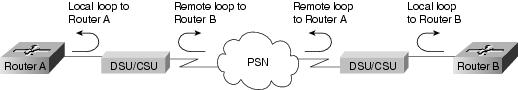
Note ![]() These tests are generic in nature and assume attachment of the internetworking system to a CSU or DSU. However, the tests are essentially the same for attachment to a multiplexer with built-in CSU/DSU functionality. Because there is no concept of a loopback in X.25 or Frame Relay packet-switched network (PSN) environments, loopback tests do not apply to X.25 and Frame Relay networks.
These tests are generic in nature and assume attachment of the internetworking system to a CSU or DSU. However, the tests are essentially the same for attachment to a multiplexer with built-in CSU/DSU functionality. Because there is no concept of a loopback in X.25 or Frame Relay packet-switched network (PSN) environments, loopback tests do not apply to X.25 and Frame Relay networks.
CSU and DSU Local Loopback Tests for HDLC or PPP Links
Following is a general procedure for performing loopback tests in conjunction with built-in system diagnostic capabilities:
Step 1 ![]() Place the CSU/DSU in local loop mode (refer to your vendor documentation). In local loop mode, the use of the line clock (from the T1 service) is terminated, and the DSU is forced to use the local clock.
Place the CSU/DSU in local loop mode (refer to your vendor documentation). In local loop mode, the use of the line clock (from the T1 service) is terminated, and the DSU is forced to use the local clock.
Step 2 ![]() Use the show interfaces serial exec command to determine whether the line status changes from «line protocol is down» to «line protocol is up (looped),» or whether it remains down.
Use the show interfaces serial exec command to determine whether the line status changes from «line protocol is down» to «line protocol is up (looped),» or whether it remains down.
Step 3 ![]() If the line protocol comes up when the CSU or DSU is in local loopback mode, this suggests that the problem is occurring on the remote end of the serial connection. If the status line does not change state, there is a possible problem in the router, connecting cable, or CSU/DSU.
If the line protocol comes up when the CSU or DSU is in local loopback mode, this suggests that the problem is occurring on the remote end of the serial connection. If the status line does not change state, there is a possible problem in the router, connecting cable, or CSU/DSU.
Step 4 ![]() If the problem appears to be local, use the debug serial interface privileged exec command.
If the problem appears to be local, use the debug serial interface privileged exec command.
Step 5 ![]() Take the CSU/DSU out of local loop mode. When the line protocol is down, the debug serial interface command output will indicate that keepalive counters are not incrementing.
Take the CSU/DSU out of local loop mode. When the line protocol is down, the debug serial interface command output will indicate that keepalive counters are not incrementing.
Step 6 ![]() Place the CSU/DSU in local loop mode again. This should cause the keepalive packets to begin to increment. Specifically, the values for mineseen and yourseen keepalives will increment every 10 seconds. This information will appear in the debug serial interface output.
Place the CSU/DSU in local loop mode again. This should cause the keepalive packets to begin to increment. Specifically, the values for mineseen and yourseen keepalives will increment every 10 seconds. This information will appear in the debug serial interface output.
If the keepalives do not increment, there may be a timing problem on the interface card or on the network. For information on correcting timing problems, refer to the section «Troubleshooting Clocking Problems,» earlier in this chapter.
Step 7 ![]() Check the local router and CSU/DSU hardware, and any attached cables. Make certain that the cables are within the recommended lengths (no more than 50 feet [15.24 meters], or 25 feet [7.62 meters] for a T1 link). Make certain that the cables are attached to the proper ports. Swap faulty equipment, as necessary.
Check the local router and CSU/DSU hardware, and any attached cables. Make certain that the cables are within the recommended lengths (no more than 50 feet [15.24 meters], or 25 feet [7.62 meters] for a T1 link). Make certain that the cables are attached to the proper ports. Swap faulty equipment, as necessary.
Figure 15-10 shows the output from the debug serial interface command for an HDLC serial connection, with missed keepalives causing the line to go down and the interface to reset.
Figure 15-10 debug serial interface Command Output
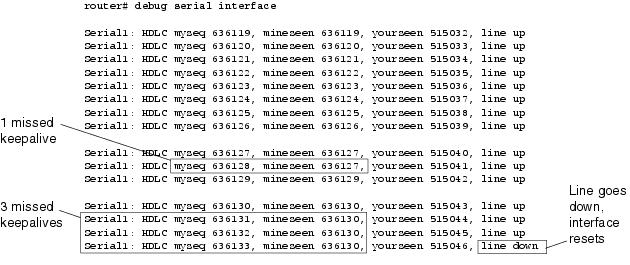
CSU and DSU Remote Loopback Tests for HDLC or PPP Links
If you determine that the local hardware is functioning properly, but you still encounter problems when attempting to establish connections over the serial link, try using the remote loopback test to isolate the problem’s cause.
Note ![]() This remote loopback test assumes that HDLC encapsulation is being used and that the preceding local loop test was performed immediately before this test.
This remote loopback test assumes that HDLC encapsulation is being used and that the preceding local loop test was performed immediately before this test.
The following are the steps required to perform loopback testing:
Step 1 ![]() Put the remote CSU or DSU into remote loopback mode (refer to the vendor documentation).
Put the remote CSU or DSU into remote loopback mode (refer to the vendor documentation).
Step 2 ![]() Using the show interfaces serial exec command, determine whether the line protocol remains up, with the status line indicating «Serial x is up, line protocol is up (looped),» or goes down, with the status line indicating «line protocol is down.»
Using the show interfaces serial exec command, determine whether the line protocol remains up, with the status line indicating «Serial x is up, line protocol is up (looped),» or goes down, with the status line indicating «line protocol is down.»
Step 3 ![]() If the line protocol remains up (looped), the problem is probably at the remote end of the serial connection (between the remote CSU/DSU and the remote router). Perform both local and remote tests at the remote end to isolate the problem source.
If the line protocol remains up (looped), the problem is probably at the remote end of the serial connection (between the remote CSU/DSU and the remote router). Perform both local and remote tests at the remote end to isolate the problem source.
Step 4 ![]() If the line status changes to «line protocol is down» when remote loopback mode is activated, make certain that ones density is being properly maintained. The CSU/DSU must be configured to use the same framing and coding schemes used by the leased-line or other carrier service (for example, ESF and B8ZS).
If the line status changes to «line protocol is down» when remote loopback mode is activated, make certain that ones density is being properly maintained. The CSU/DSU must be configured to use the same framing and coding schemes used by the leased-line or other carrier service (for example, ESF and B8ZS).
Step 5 ![]() If problems persist, contact your WAN network manager or the WAN service organization.
If problems persist, contact your WAN network manager or the WAN service organization.
Detailed Information on the show interfaces serial Command
This section covers the show interfaces serial command’s parameters, syntax description, sample output display, and field descriptions.
show interfaces serial
To display information about a serial interface, use the show interfaces serial privileged exec command:
show interfaces serial [number] [accounting]
show interfaces serial [number [:channel-group] [accounting] (Cisco 4000 series)
show interfaces serial [slot | port [:channel-group]] [accounting] (Cisco 7500 series)
show interfaces serial [type slot | port-adapter | port] [serial] (ports on VIP cards in the Cisco 7500 series)
show interfaces serial [type slot | port-adapter | port] [:t1-channel] [accounting | crb] (CT3IP in Cisco 7500 series)
Syntax Description
•![]() Number—(Optional) Port number.
Number—(Optional) Port number.
•![]() accounting—(Optional) Displays the number of packets of each protocol type that have been sent through the interface.
accounting—(Optional) Displays the number of packets of each protocol type that have been sent through the interface.
•![]() :channel-group—(Optional) On the Cisco 4000 series with an NPM or a Cisco 7500 series with a MIP, specifies the T1 channel-group number in the range of 0 to 23, defined with the channel-group controller configuration command.
:channel-group—(Optional) On the Cisco 4000 series with an NPM or a Cisco 7500 series with a MIP, specifies the T1 channel-group number in the range of 0 to 23, defined with the channel-group controller configuration command.
•![]() slot—Refer to the appropriate hardware manual for slot information.
slot—Refer to the appropriate hardware manual for slot information.
•![]() port—Refer to the appropriate hardware manual for port information.
port—Refer to the appropriate hardware manual for port information.
•![]() port-adapter—Refer to the appropriate hardware manual for information about port adapter compatibility.
port-adapter—Refer to the appropriate hardware manual for information about port adapter compatibility.
•![]() :t1-channel—(Optional) For the CT3IP, the T1 channel is a number between 1 and 28.
:t1-channel—(Optional) For the CT3IP, the T1 channel is a number between 1 and 28.
T1 channels on the CT3IP are numbered 1 to 28 rather than the more traditional zero-based scheme (0 to 27) used with other Cisco products. This is to ensure consistency with telco numbering schemes for T1 channels within channelized T3 equipment.
•![]() crb—(Optional) Shows interface routing and bridging information.
crb—(Optional) Shows interface routing and bridging information.
Command Mode
Privileged exec
Usage Guidelines
This command first appeared in Cisco IOS Release 10.0 for the Cisco 4000 series. It first appeared in Cisco IOS Release 11.0 for the Cisco 7000 series, and it was modified in Cisco IOS Release 11.3 to include the CT3IP.
Sample Displays
The following is sample output from the show interfaces command for a synchronous serial interface:
Router# show interfaces serial
Serial 0 is up, line protocol is up
Internet address is 150.136.190.203, subnet mask is 255.255.255.0
MTU 1500 bytes, BW 1544 Kbit, DLY 20000 usec, rely 255/255, load 1/255
Encapsulation HDLC, loopback not set, keepalive set (10 sec)
Last input 0:00:07, output 0:00:00, output hang never
Output queue 0/40, 0 drops; input queue 0/75, 0 drops
Five minute input rate 0 bits/sec, 0 packets/sec
Five minute output rate 0 bits/sec, 0 packets/sec
16263 packets input, 1347238 bytes, 0 no buffer
Received 13983 broadcasts, 0 runts, 0 giants
2 input errors, 0 CRC, 0 frame, 0 overrun, 0 ignored, 2 abort
22146 packets output, 2383680 bytes, 0 underruns
0 output errors, 0 collisions, 2 interface resets, 0 restarts
Table 15-9 describes significant fields shown in the output.
|
Field |
Description |
|---|---|
|
Serial…is {up | down}…is administratively down |
Indicates whether the interface hardware is currently active (whether carrier detect is present) or whether it has been taken down by an administrator. |
|
line protocol is {up | down} |
Indicates whether the software processes that handle the line protocol consider the line usable (that is, whether keepalives are successful), or whether it has been taken down by an administrator. |
|
Hardware is |
Specifies the hardware type. |
|
Internet address is |
Specifies the Internet address and subnet mask. |
|
MTU |
Specifies the maximum transmission unit of the interface. |
|
BW |
Indicates the value of the bandwidth parameter that has been configured for the interface (in kilobits per second). The bandwidth parameter is used to compute IGRP metrics only. If the interface is attached to a serial line with a line speed that does not match the default (1536 or 1544 for T1, and 56 for a standard synchronous serial line), use the bandwidth command to specify the correct line speed for this serial line.
|
|
DLY |
Gives the delay of the interface in microseconds. |
|
rely |
Expresses reliability of the interface as a fraction of 255 (255/255 is 100 percent reliability), calculated as an exponential average over 5 minutes. |
|
load |
Expresses load on the interface as a fraction of 255 (255/255 is completely saturated), calculated as an exponential average over five minutes. |
|
Encapsulation |
Gives the encapsulation method assigned to the interface. |
|
loopback |
Indicates whether loopback is set. |
|
keepalive |
Indicates whether keepalives are set. |
|
Last input |
Gives the number of hours, minutes, and seconds since the last packet was successfully received by an interface. Useful for knowing when a dead interface failed. |
|
Last output |
Gives the number of hours, minutes, and seconds since the last packet was successfully transmitted by an interface. |
|
output hang |
Gives the number of hours, minutes, and seconds (or never) since the interface was last reset because of a transmission that took too long. When the number of hours in any of the last fields exceeds 24, the number of days and hours is printed. If that field overflows, asterisks are printed. |
|
Output queue, drops input queue, drops |
Gives the number of packets in output and input queues. Each number is followed by a slash, the maximum size of the queue, and the number of packets because the queue is full. |
|
5 minute input rate 5 minute output rate |
Gives the average number of bits and packets transmitted per second in the past 5 minutes. The 5-minute input and output rates should be used only as an approximation of traffic per second during a given 5-minute period. These rates are exponentially weighted averages with a time constant of 5 minutes. A period of four time constants must pass before the average will be within 2 percent of the instantaneous rate of a uniform stream of traffic over that period. |
|
packets input |
Gives the total number of error-free packets received by the system. |
|
bytes |
Gives the total number of bytes, including data and MAC encapsulation, in the error-free packets received by the system. |
|
no buffer |
Gives the number of received packets discarded because there was no buffer space in the main system. Compare with ignored count. Broadcast storms on Ethernet networks and bursts of noise on serial lines are often responsible for no input buffer events. |
|
Received…broadcasts |
Gives the total number of broadcast or multicast packets received by the interface. |
|
runts |
Gives the number of packets that are discarded because they are smaller than the medium’s minimum packet size. |
|
Giants |
Gives the number of packets that are discarded because they exceed the medium’s maximum packet size. |
|
input errors |
Gives the total number of no buffer, runts, giants, CRCs, frame, overrun, ignored, and abort counts. Other input-related errors can also increment the count, so this sum might not balance with the other counts. |
|
CRC |
The Cyclic Redundancy Check (CRC) counter is incremented by the originating station or far-end device when the checksum calculated from the data received does not match the checksum from the transmitted data. On a serial link, CRCs usually indicate noise, gain hits, or other transmission problems on the data link. |
|
frame |
Gives the number of packets received incorrectly, having a CRC error and a noninteger number of octets. On a serial line, this is usually the result of noise or other transmission problems. |
|
overrun |
Gives the number of times that the serial receiver hardware was incapable of handing received data to a hardware buffer because the input rate exceeded the receiver’s capability to handle the data. |
|
ignored |
Gives the number of received packets ignored by the interface because the interface hardware ran low on internal buffers. Broadcast storms and bursts of noise can cause the ignored count to be increased. |
|
abort |
Indicates an illegal sequence of 1 bit on a serial interface. This usually indicates a clocking problem between the serial interface and the data link equipment. |
|
carrier transitions |
Gives the number of times that the carrier detect signal of a serial interface has changed state. For example, if data carrier detect (DCD) goes down and comes up, the carrier transition counter will increment two times. This indicates modem or line problems if the carrier detect line is changing state often. |
|
packets output |
Gives the total number of messages transmitted by the system. |
|
bytes output |
Gives the total number of bytes, including data and MAC encapsulation, transmitted by the system. |
|
underruns |
Gives the number of times that the transmitter has been running faster than the router can handle. This might never be reported on some interfaces. |
|
output errors |
Gives the sum of all errors that prevented the final transmission of datagrams out of the interface being examined. Note that this might not balance with the sum of the enumerated output errors because some datagrams can have more than one error, and others can have errors that do not fall into any of the specifically tabulated categories. |
|
collisions |
Gives the number of messages retransmitted because of an Ethernet collision. This usually is the result of an overextended LAN (Ethernet or transceiver cable too long, more than two repeaters between stations, or too many cascaded multiport transceivers). Some collisions are normal. However, if your collision rate climbs to around 4 percent or 5 percent, you should consider verifying that there is no faulty equipment on the segment, or moving some existing stations to a new segment. A packet that collides is counted only once in output packets. |
|
interface resets |
Gives the number of times that an interface has been completely reset. This can happen if packets queued for transmission were not sent within several seconds. On a serial line, this can be caused by a malfunctioning modem that is not supplying the transmit clock signal, or by a cable problem. If the system notices that the carrier detect line of a serial interface is up but the line protocol is down, it periodically resets the interface in an effort to restart it. Interface resets can also occur when an interface is looped back or shut down. |
|
restarts |
Gives the number of times that the controller was restarted because of errors. |
|
alarm indications, remote alarms, rx LOF, rx LOS |
Gives the number of CSU/DSU alarms, and the number of occurrences of receive loss of frame and receive loss of signal. |
|
BER inactive, NELR inactive, FELR inactive |
Shows the status of G.703-E1 counters for bit error rate (BER) alarm, near-end loop remote (NELR), and far-end loop remote (FELR). Note that you cannot set the NELR or FELR. |
Troubleshooting T1 Problems
This section describes the techniques and procedures to troubleshoot T1 circuits for dial-in customers.
Troubleshooting Using the show controller t1 Command
The show controller t1 exec command provides information to logically troubleshoot physical layer and data link layer problems. This section describes how to logically troubleshoot using the show controller t1 command.
This command displays the controller status that is specific to the controller hardware. The information displayed is generally useful for diagnostic tasks performed by technical support personnel.
The NPM or MIP can query the port adapters to determine their current status. Issue a show controller t1 command to display statistics about the T1 link.
If you specify a slot and port number, statistics for each 15-minute period will be displayed.
Most T1 errors are caused by misconfigured lines. Ensure that linecoding, framing, and clock source are configured according to what the service provider recommends.
show controller t1 Conditions
The t1 controller can be in three states:
•![]() Administratively down
Administratively down
•![]() Down
Down
•![]() Up
Up
Is the Controller Administratively Down?
The controller is administratively down when it has been manually shut down. You should restart the controller to correct this error.
Step 1 ![]() Enter enable mode.
Enter enable mode.
Step 2 ![]() Enter global configuration mode.
Enter global configuration mode.
maui-nas-03#configure terminal
Enter configuration commands, one per line. End with CNTL/Z.
Step 3 ![]() Enter controller configuration mode.
Enter controller configuration mode.
maui-nas-03(config)#controller t1 0
maui-nas-03(config-controlle)#
Step 4 ![]() Restart the controller.
Restart the controller.
maui-nas-03(config-controlle)#shutdown
maui-nas-03(config-controlle)#no shutdown
Is the Line Up?
If the T1 controller and line are not up, check to see if you are seeing one of the following messages in the show controller t1 exec output:
Receiver has loss of frame.
or
Receiver has loss of signal.
If Receiver Has Loss of Frame
Step 1 ![]() Check to see whether the framing format configured on the port matches the framing format of the line. You can check the framing format of the controller from the running configuration or the show controller t1 command output.
Check to see whether the framing format configured on the port matches the framing format of the line. You can check the framing format of the controller from the running configuration or the show controller t1 command output.
To change the framing format, use the framing {SF | ESF} command in the controller configuration mode, as shown here:
maui-nas-03#configure terminal
Enter configuration commands, one per line. End with CNTL/Z.
maui-nas-03(config)#controller t1 0
maui-nas-03(config-controlle)#framing esf
Step 2 ![]() Try the other framing format to see if the alarm clears.
Try the other framing format to see if the alarm clears.
Step 3 ![]() Change the line build out setting using the cablelength {long | short} command.
Change the line build out setting using the cablelength {long | short} command.
Line build out (LBO) compensates for the loss in decibels based on the distance from the device to the first repeater in the circuit. A longer distance from the device to the repeater requires that the signal strength on the circuit be boosted to compensate for loss over that distance.
To configure transmit and receive levels for a cable length (line build out) longer than 655 feet for a T1 trunk with a channel service unit (CSU) interface, use the cablelength long controller configuration command. To configure transmit attenuation for a cable length (line build out) of 655 feet or shorter for a T1 trunk with a DSX-1 interface, use the cablelength short controller configuration command.
Consult your service provider and the Cisco IOS command reference for details on buildout settings.
If this does not fix the problem, proceed to the next section.
If Receiver Has Loss of Signal
Step 1 ![]() Make sure that the cable between the interface port and the T1 service provider’s equipment or T1 terminal equipment is connected correctly. Check to see if the cable is hooked up to the correct ports. Correct the cable connections, if necessary.
Make sure that the cable between the interface port and the T1 service provider’s equipment or T1 terminal equipment is connected correctly. Check to see if the cable is hooked up to the correct ports. Correct the cable connections, if necessary.
Step 2 ![]() Check cable integrity. Look for breaks or other physical abnormalities in the cable. Ensure that the pinouts are set correctly. If necessary, replace the cable.
Check cable integrity. Look for breaks or other physical abnormalities in the cable. Ensure that the pinouts are set correctly. If necessary, replace the cable.
Step 3 ![]() Check the cable connectors. A reversal of the transmit and receive pairs or an open receive pair can cause errors. Set the receive pair to lines 1 and 2; the transmit pair should be lines 4 and 5.
Check the cable connectors. A reversal of the transmit and receive pairs or an open receive pair can cause errors. Set the receive pair to lines 1 and 2; the transmit pair should be lines 4 and 5.
The pins on an RJ-48 jack are numbered from 1 through 8. Pin 1 is the leftmost pin when looking at the jack with the metal pins facing you. Refer to Figure 15-11.
Figure 15-11 RJ-45 Cable
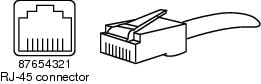
Step 4 ![]() Try using a rollover cable.
Try using a rollover cable.
Run the show controller t1 exec command after each step to see whether the controller exhibits any errors.
If the Line Is in Loopback Mode
Check to see whether the line is in loopback mode from the show controller t1 output. A line should be in loopback mode only for testing purposes.
To turn off loopback, use the no loopback command in the controller configuration mode, as shown here:
maui-nas-03(config-controlle)#no loopback
If the Controller Displays Any Alarms
Check the show controller command output to see if there are alarms displayed by the controller.
We will now discuss various alarms and the procedure necessary to correct them.
Receive (RX) Alarm Indication Signal (AIS) (Blue)
A received alarm indication signal (AIS) means that an alarm is occurring on the line upstream of the equipment connected to the port. The AIS failure is declared when an AIS defect is detected at the input and still exists after the loss of frame failure is declared (caused by the unframed nature of the «all-ones» signal). The AIS failure is cleared when the loss of frame failure is cleared.
Step 1 ![]() Check to see whether the framing format configured on the port matches the framing format of the line. If not, change the framing format on the controller to match that of the line.
Check to see whether the framing format configured on the port matches the framing format of the line. If not, change the framing format on the controller to match that of the line.
Step 2 ![]() Contact your service provider to check for misconfiguration within the telco.
Contact your service provider to check for misconfiguration within the telco.
Receive (Rx) Remote Alarm Indication (Yellow)
A received remote alarm indication means that the far-end equipment has a problem with the signal that it is receiving from its upstream equipment.
For SF links, the far-end alarm failure is declared when bit 6 of all the channels has been zero for at least 335 ms. The failure is cleared when bit 6 of at least one channel is not zero for a period usually less than 1 second and always less than 5 seconds. The far-end alarm failure is not declared for SF links when a loss of signal is detected.
For ESF links, the far-end alarm failure is declared if the yellow alarm signal pattern occurs in at least seven out of ten contiguous 16-bit pattern intervals. The failure is cleared if the yellow alarm signal pattern does not occur in ten contiguous 16-bit signal pattern intervals.
Step 1 ![]() Insert an external loopback cable into the port. To create a loopback plug, refer to the section «Performing Hardware Loopback Plug Test,» later in this chapter.
Insert an external loopback cable into the port. To create a loopback plug, refer to the section «Performing Hardware Loopback Plug Test,» later in this chapter.
Step 2 ![]() Check to see if there are any alarms. If you do not see any alarms, then the local hardware is probably in good condition. In that case, do the following:
Check to see if there are any alarms. If you do not see any alarms, then the local hardware is probably in good condition. In that case, do the following:
•![]() Check the cabling. Refer to the section «If Receiver Has Loss of Signal» for more information.
Check the cabling. Refer to the section «If Receiver Has Loss of Signal» for more information.
•![]() Check the settings at the remote end, and verify that they match your port settings.
Check the settings at the remote end, and verify that they match your port settings.
•![]() If the problem persists, contact your service provider.
If the problem persists, contact your service provider.
Step 3 ![]() Remove the loopback plug, and reconnect your T1 line
Remove the loopback plug, and reconnect your T1 line
Step 4 ![]() Check the cabling. Refer to the section «Loss of Signal» for more information.
Check the cabling. Refer to the section «Loss of Signal» for more information.
Step 5 ![]() Power-cycle the router.
Power-cycle the router.
Step 6 ![]() Connect the T1 line to a different port. Configure the port with the same settings as that of the line. If the problem does not persist, then the fault lies with the one port:
Connect the T1 line to a different port. Configure the port with the same settings as that of the line. If the problem does not persist, then the fault lies with the one port:
•![]() Reconnect the T1 line to the original port.
Reconnect the T1 line to the original port.
•![]() Proceed to the «Troubleshooting Error Events» section, later in this chapter.
Proceed to the «Troubleshooting Error Events» section, later in this chapter.
If the problem persists, then do the following:
•![]() Perform a hardware loop test, as described in the section «Performing Hardware Loopback Plug Test.»
Perform a hardware loop test, as described in the section «Performing Hardware Loopback Plug Test.»
•![]() Replace the T1 controller card.
Replace the T1 controller card.
•![]() Proceed to «Troubleshooting Error Events,» the next section.
Proceed to «Troubleshooting Error Events,» the next section.
Transmitter Sending Remote Alarm (Red)
A red alarm is declared when the CSU cannot synchronize with the framing pattern on the T1 line.
Step 1 ![]() Check to see whether the framing format configured on the port matches the framing format of the line. If not, change the framing format on the controller to match that of the line.
Check to see whether the framing format configured on the port matches the framing format of the line. If not, change the framing format on the controller to match that of the line.
Step 2 ![]() Check the settings at the remote end, and verify that they match your port settings.
Check the settings at the remote end, and verify that they match your port settings.
Step 3 ![]() Contact your service provider.
Contact your service provider.
Transmit (Tx) Remote Alarm Indication (Yellow)
A transmitted remote alarm indication at the interface indicates that the interface has a problem with the signal it is receiving from the far-end equipment.
Step 1 ![]() Check the settings at the remote end, and verify that they match your port settings.
Check the settings at the remote end, and verify that they match your port settings.
Step 2 ![]() A Tx RAI should be accompanied by some other alarm that indicates the nature of the problem that the T1 port/card is having with the signal from the far-end equipment.
A Tx RAI should be accompanied by some other alarm that indicates the nature of the problem that the T1 port/card is having with the signal from the far-end equipment.
Troubleshoot that condition to resolve the Tx RAI.
Transmit (Tx) AIS (Blue)
Step 1 ![]() Check to see whether the framing format configured on the port matches the framing format of the line. If not, correct the mismatch.
Check to see whether the framing format configured on the port matches the framing format of the line. If not, correct the mismatch.
Step 2 ![]() Power-cycle the router.
Power-cycle the router.
Step 3 ![]() Connect the T1 line to a different port. Configure the port with the same settings as that of the line.
Connect the T1 line to a different port. Configure the port with the same settings as that of the line.
If the problem persists, then do the following:
•![]() Perform a hardware loop test, as described in the section «Performing a Hardware Loop Test.»
Perform a hardware loop test, as described in the section «Performing a Hardware Loop Test.»
•![]() Replace the T1 controller card.
Replace the T1 controller card.
•![]() Proceed to the «Troubleshooting Error Events» section, next.
Proceed to the «Troubleshooting Error Events» section, next.
Troubleshooting Error Events
The show controller t1 exec command provides error messages that can be used to troubleshoot problems. We will now discuss several error messages and how to correct the errors.
To see whether the error counters are increasing, execute the show controller t1 command repeatedly. Note the values of the counters for the current interval.
Consult your service provider for framing and linecoding settings. A good rule of thumb is to use B8ZS linecoding with ESF framing and AMI linecoding with SF framing.
Slip Secs Counter Is Increasing
The presence of slips on a T1 line indicates a clocking problem. The T1 provider (telco) will provide the clocking that the customer premises equipment (CPE) will need to synchronize to.
Step 1 ![]() Verify that the clock source is derived from the network. This can be ascertained by looking for «Clock Source Is Line Primary.»
Verify that the clock source is derived from the network. This can be ascertained by looking for «Clock Source Is Line Primary.»
Note: If there are multiple T1s into an access server, only one can be the primary, while the other T1s derive the clock from the primary. In that case, verify that the T1 line designated as the primary clock source is configured correctly.
Step 2 ![]() Set the T1 clock source correctly from the controller configuration mode.
Set the T1 clock source correctly from the controller configuration mode.
maui-nas-03(config-controlle)#clock source line primary
Framing Loss Seconds Counter Is Increasing
Step 1 ![]() Check to see whether the framing format configured on the port matches the framing format of the line. You can check this by looking for «Framing is {ESF|SF}» in the show controller t1 output.
Check to see whether the framing format configured on the port matches the framing format of the line. You can check this by looking for «Framing is {ESF|SF}» in the show controller t1 output.
Step 2 ![]() To change the framing format, use the framing {SF | ESF} command in the controller configuration mode, as shown here:
To change the framing format, use the framing {SF | ESF} command in the controller configuration mode, as shown here:
maui-nas-03(config-controlle)#framing esf
Step 3 ![]() Change the line build out using the cablelength {long | short} command.
Change the line build out using the cablelength {long | short} command.
Consult your service provider and the Cisco IOS command reference for details on buildout settings.
Line Code Violations Are Increasing
Step 1 ![]() Check to see whether the linecoding configured on the port matches the framing format of the line. You can check this by looking for «Line Code is {B8ZS|AMI}» in the show controller t1 output.
Check to see whether the linecoding configured on the port matches the framing format of the line. You can check this by looking for «Line Code is {B8ZS|AMI}» in the show controller t1 output.
Step 2 ![]() To change the linecoding, use the linecode {ami | b8zs} command in the controller configuration mode, as shown here:
To change the linecoding, use the linecode {ami | b8zs} command in the controller configuration mode, as shown here:
maui-nas-03(config-controlle)#linecode b8zs
Step 3 ![]() Change the line build out using the cablelength {long | short} command.
Change the line build out using the cablelength {long | short} command.
Consult your service provider and the Cisco IOS command reference for details on buildout settings.
Verify that isdn switchtype and pri-group Are Configured Correctly
Use the show running-config command to check if isdn switchtype and pri-group timeslots are configured correctly. Contact your service provider for correct values.
To change the isdn switchtype and pri-group, enter these lines:
maui-nas-03#configure terminal
maui-nas-03(config)#isdn switch-type primary-5ess
maui-nas-03(config)#controller t1 0
maui-nas-03(config-controlle)#pri-group timeslots 1-24
Verifying the Signaling Channel
If the error counters do not increase but the problem persists, verify that the signaling channel is up and configured correctly.
Step 1 ![]() Run the show interface serial x:23 command, where x should be replaced by the interface number.
Run the show interface serial x:23 command, where x should be replaced by the interface number.
Step 2 ![]() Check to see if the interface is up. If the interface is not up, use the no shutdown command to bring the interface up.
Check to see if the interface is up. If the interface is not up, use the no shutdown command to bring the interface up.
maui-nas-03#config terminal
Enter configuration commands, one per line. End with CNTL/Z.
maui-nas-03(config)#interface serial 0:23
maui-nas-03(config-if)#no shutdown
Step 3 ![]() Ensure that encapsulation is PPP. If the interface is not using PPP, then use the encapsulation ppp command in the interface configuration mode to correct it.
Ensure that encapsulation is PPP. If the interface is not using PPP, then use the encapsulation ppp command in the interface configuration mode to correct it.
maui-nas-03(config-if)#encapsulation ppp
Step 4 ![]() Check to see whether loopback is set. Loopback should be set only for testing purposes. Use the no loopback command to remove loopbacks.
Check to see whether loopback is set. Loopback should be set only for testing purposes. Use the no loopback command to remove loopbacks.
maui-nas-03(config-if)#no loopback
Step 5 ![]() Power-cycle the router.
Power-cycle the router.
Step 6 ![]() If the problem persists, contact your service provider or Cisco TAC.
If the problem persists, contact your service provider or Cisco TAC.
Troubleshooting a PRI
Whenever troubleshooting a PRI, you need to check whether the T1 is running cleanly on both ends. If Layer 1 problems have been resolved, as described previously, we must look to Layer 2 and 3 problems.
Troubleshooting Using the show isdn status Command
The show isdn status command is used to display a snapshot of all ISDN interfaces. It displays the status of Layers 1, 2, and 3.
Step 1 ![]() Verify that Layer 1 is active.
Verify that Layer 1 is active.
The Layer 1 status should always say ACTIVE unless the T1 is down.
If show isdn status indicates that Layer 1 is DEACTIVATED, then there is a problem with the physical connectivity on the T1 line. Refer to the previous section «Is the Controller Administratively Down?»
Also verify that the T1 is not administratively down. Use the no shutdown command to bring up the T1 controller.
Step 2 ![]() Check whether Layer 2 state is MULTIPLE_FRAME_ESTABLISHED.
Check whether Layer 2 state is MULTIPLE_FRAME_ESTABLISHED.
The desired Layer 2 State is MULTIPLE_FRAME_ESTABLISHED, which indicates that we are exchanging Layer 2 frames and have finished Layer 2 initialization.
If Layer 2 is not MULTIPLE_FRAME_ESTABLISHED, use the show controller t1 exec command to diagnose the problem. Refer to the section «Troubleshooting Using the show controller t1 Command.»
Because show isdn status is a snapshot of the current status, it is possible that Layer 2 is bouncing up and down despite indicating MULTIPLE_FRAME_ESTABLISHED. Use debug isdn q921 to verify that Layer 2 is stable.
Using debug q921
The debug isdn q921 command displays data link layer (Layer 2) access procedures that are taking place at the router on the D-channel.
Ensure that you are configured to view debug messages by using the logging console or terminal monitor command as necessary.
Note ![]() In a production environment, verify that console logging is disabled. Enter the show logging command. If logging is enabled, the access server might intermittently freeze up as soon as the console port gets overloaded with log messages. Enter the no logging console command.
In a production environment, verify that console logging is disabled. Enter the show logging command. If logging is enabled, the access server might intermittently freeze up as soon as the console port gets overloaded with log messages. Enter the no logging console command.
Note ![]() If debug isdn q921 is turned on and you do not receive any debug outputs, place a call or reset the controller to get debug outputs.
If debug isdn q921 is turned on and you do not receive any debug outputs, place a call or reset the controller to get debug outputs.
Step 1 ![]() Verify that Layer 2 is stable. You should observe the debug outputs for messages indicating that the service is not bouncing up and down. If you see the following types of debug outputs, the line is not stable:
Verify that Layer 2 is stable. You should observe the debug outputs for messages indicating that the service is not bouncing up and down. If you see the following types of debug outputs, the line is not stable:
Mar 20 10:06:07.882: %ISDN-6-LAYER2DOWN: Layer 2 for Interface Se0:23, TEI 0 changed
to down
Mar 20 10:06:09.882: %LINK-3-UPDOWN: Interface Serial0:23, changed state to down
Mar 20 10:06:21.274: %DSX1-6-CLOCK_CHANGE: Controller 0  clock is now selected as
clock source
Mar 20 10:06:21.702: %ISDN-6-LAYER2UP: Layer 2 for Interface Se0:23, TEI 0 changed to
up
Mar 20 10:06:22.494: %CONTROLLER-5-UPDOWN: Controller T1 0, changed state to up
Mar 20 10:06:24.494: %LINK-3-UPDOWN: Interface Serial0:23, changed state to up
If Layer 2 does not appear to be stable, refer to the section «Troubleshooting Error Events.»
Step 2 ![]() Verify that you are seeing only SAPI messages in both transmit (TX) and receive (RX) sides.
Verify that you are seeing only SAPI messages in both transmit (TX) and receive (RX) sides.
Mar 20 10:06:52.505: ISDN Se0:23: TX -> RRf sapi = 0 tei = 0 nr = 0
Mar 20 10:06:52.505: ISDN Se0:23: RX <- RRf sapi = 0 tei = 0 nr = 0
Mar 20 10:07:22.505: ISDN Se0:23: TX -> RRp sapi = 0 tei = 0 nr = 0
Mar 20 10:07:22.509: ISDN Se0:23: RX <- RRp sapi = 0 tei = 0 nr = 0
Mar 20 10:07:22.509: ISDN Se0:23: TX -> RRf sapi = 0 tei = 0 nr = 0
Mar 20 10:07:22.509: ISDN Se0:23: RX <- RRf sapi = 0 tei = 0 nr = 0
Step 3 ![]() Verify that you are not seeing SABME messages, which indicates that Layer 2 is trying to reinitialize. This is usually seen when we are transmitting poll requests (RRp) and not getting a response from the switch (RRf), or vice versa. The following are example of SABME messages:
Verify that you are not seeing SABME messages, which indicates that Layer 2 is trying to reinitialize. This is usually seen when we are transmitting poll requests (RRp) and not getting a response from the switch (RRf), or vice versa. The following are example of SABME messages:
Mar 20 10:06:21.702: ISDN Se0:23: RX <- SABMEp sapi = 0 tei = 0
Mar 20 10:06:22.494: ISDN Se0:23: TX -> SABMEp sapi = 0 tei = 0
If you are seeing SABME messages, do the following:
•![]() Use the show running-config command to check whether isdn switchtype and pri-group timeslots are configured correctly. Contact your service provider for correct values.
Use the show running-config command to check whether isdn switchtype and pri-group timeslots are configured correctly. Contact your service provider for correct values.
•![]() To change the isdn switchtype and pri-group, enter these lines:
To change the isdn switchtype and pri-group, enter these lines:
maui-nas-03#configure terminal
maui-nas-03(config)#isdn switch-type primary-5ess
maui-nas-03(config)#controller t1 0
maui-nas-03(config-controlle)#pri-group timeslots 1-24
Step 4 ![]() Verify that the D-channel is up using the show interfaces serial x:23 command.
Verify that the D-channel is up using the show interfaces serial x:23 command.
If the D-channel is not up, then use no shutdown command to bring it up:
maui-nas-03(config)#interface serial 0:23
maui-nas-03(config-if)#no shutdown
Step 5 ![]() Check to see whether encapsulation is PPP. If not, use the encapsulation ppp command to set encapsulation.
Check to see whether encapsulation is PPP. If not, use the encapsulation ppp command to set encapsulation.
maui-nas-03(config-if)#encapsulation ppp
Step 6 ![]() Check to see whether the interface is in loopback mode. For normal operation, the interface should not be in loopback mode.
Check to see whether the interface is in loopback mode. For normal operation, the interface should not be in loopback mode.
maui-nas-03(config-if)#no loopback
Step 7 ![]() Power-cycle the router.
Power-cycle the router.
Step 8 ![]() If the problem persists, contact your service provider or Cisco TAC.
If the problem persists, contact your service provider or Cisco TAC.
Performing Hardware Loopback Plug Test
The hardware loopback plug test can be used to test whether the router has any faults. If a router passes a hardware loopback plug test, then the problem exists elsewhere on the line.
To create a loopback plug, follow these steps:
Step 1 ![]() Use wire cutters to cut a working RJ-45 or RJ-48 cable so that there are 5 inches of cable and the connector attached to it.
Use wire cutters to cut a working RJ-45 or RJ-48 cable so that there are 5 inches of cable and the connector attached to it.
Step 2 ![]() Strip the wires.
Strip the wires.
Step 3 ![]() Twist the wires from pins 1 and 4 together.
Twist the wires from pins 1 and 4 together.
Step 4 ![]() Twist the wires from pins 2 and 5 together.
Twist the wires from pins 2 and 5 together.
Leave the rest of the wires alone.
The pins on an RJ-45/48 jack are numbered from 1 through 8. Pin 1 is the left-most pin when looking at the jack with the metal pins facing you.
Performing the Loopback Plug Test
Step 1 ![]() Insert the plug into the T1 port in question.
Insert the plug into the T1 port in question.
Step 2 ![]() Save your router configuration using the write memory command.
Save your router configuration using the write memory command.
Building configuration...
Step 3 ![]() Set the encapsulation to HDLC.
Set the encapsulation to HDLC.
maui-nas-03#config terminal
Enter configuration commands, one per line. End with CNTL/Z.
maui-nas-03(config)#interface serial 0
maui-nas-03(config-if)#enc
maui-nas-03(config-if)#encapsulation HDLC
maui-nas-03(config-if)#^Z
Step 4 ![]() Use the show running-config command to check whether the interface has an IP address.
Use the show running-config command to check whether the interface has an IP address.
If the interface does not have an IP address, obtain a unique address and assign it to the interface with a subnet mask of 255.255.255.0
maui-nas-03(config)#ip address 172.22.53.1 255.255.255.0
Step 5 ![]() Clear the interface counters using the clear counters command.
Clear the interface counters using the clear counters command.
maui-nas-03#clear counters
Clear "show interface" counters on all interfaces [confirm]
Step 6 ![]() Perform the extended ping test as described in the «Using Extended ping Tests» section, earlier in this chapter.
Perform the extended ping test as described in the «Using Extended ping Tests» section, earlier in this chapter.
Troubleshooting E1 Problems
This section describes the techniques and procedures to troubleshoot E1 circuits for dial-in customers.
Troubleshooting Using the show controller e1 Command
The show e1 controller exec command provides information to logically troubleshoot physical layer and data link layer problems. This section describes how to logically troubleshoot using the show controller e1 command.
This command displays the controller status that is specific to the controller hardware. The information displayed is generally useful for diagnostic tasks performed by technical support personnel only.
The NPM or MIP can query the port adapters to determine their current status. Issue a show controller e1 command to display statistics about the E1 link.
If you specify a slot and port number, statistics for each 15-minute period will be displayed.
Most E1 errors are caused by misconfigured lines. Ensure that linecoding, framing, clock source, and line termination (balanced or unbalanced) are configured according to what the service provider recommended.
Show controller e1 Conditions
The E1 controller can be in three states:
•![]() Administratively down
Administratively down
•![]() Down
Down
•![]() Up
Up
Is the Controller Administratively Down?
The controller is administratively down when it has been manually shut down. You should restart the controller to correct this error.
Step 1 ![]() Enter enable mode.
Enter enable mode.
Step 2 ![]() Enter global configuration mode.
Enter global configuration mode.
maui-nas-03#configure terminal
Enter configuration commands, one per line. End with CNTL/Z.
Step 3 ![]() Enter controller configuration mode.
Enter controller configuration mode.
maui-nas-03(config)#controller e1 0
maui-nas-03(config-controlle)#
Step 4 ![]() Restart the controller.
Restart the controller.
maui-nas-03(config-controlle)#shutdown
maui-nas-03(config-controlle)#no shutdown
Is the Line Up?
If the E1 line is not up, check to see that the line configuration is correct and matches the settings of the remote end.
Check the framing of the line and the remote end. For E1 lines, the framing is either CRC4 or noCRC4.
Check the linecoding of the line and the remote end. The linecoding is either AMI or HDB3.
Check whether the line termination is set for balanced or unbalanced (75 ohm or 120 ohm).
Consult your service provider for more information regarding the correct settings. Make any changes as necessary to both local or remote end devices.
If the E1 controller and line are not up, check to see whether you are seeing one of the following messages in the show controller e1 exec output:
Receiver has loss of frame.
or
Receiver has loss of signal.
If Receiver Has Loss of Frame
Step 1 ![]() Check to see whether the framing format configured on the port matches the framing format of the line. You can check the framing format of the controller from the running configuration or the show controller e1 command output.
Check to see whether the framing format configured on the port matches the framing format of the line. You can check the framing format of the controller from the running configuration or the show controller e1 command output.
To change the framing format, use the framing {CRC4 | no CRC4} command in the controller configuration mode, as shown here:
maui-nas-03#configure terminal
Enter configuration commands, one per line. End with CNTL/Z.
maui-nas-03(config)#controller E1 0
maui-nas-03(config-controlle)#framing CRC4
Step 2 ![]() Try the other framing format to see if the alarm clears.
Try the other framing format to see if the alarm clears.
If this does not fix the problem, proceed to the receiver has loss of signal section below.
Step 3 ![]() Check the framing format on the remote end.
Check the framing format on the remote end.
Step 4 ![]() Check the linecoding on the remote end.
Check the linecoding on the remote end.
If Receiver Has Loss of Signal
Step 1 ![]() Make sure that the cable between the interface port and the E1 service provider’s equipment or E1 terminal equipment is connected correctly. Check to see whether the cable is hooked up to the correct ports. Correct the cable connections if necessary.
Make sure that the cable between the interface port and the E1 service provider’s equipment or E1 terminal equipment is connected correctly. Check to see whether the cable is hooked up to the correct ports. Correct the cable connections if necessary.
Step 2 ![]() Check cable integrity. Look for breaks or other physical abnormalities in the cable. Ensure that the pinouts are set correctly. If necessary, replace the cable.
Check cable integrity. Look for breaks or other physical abnormalities in the cable. Ensure that the pinouts are set correctly. If necessary, replace the cable.
Step 3 ![]() Check the cable connectors. A reversal of the transmit and receive pairs or an open receive pair can cause errors. Set the receive pair to lines 1 and 2; the transmit pair should be lines 4 and 5.
Check the cable connectors. A reversal of the transmit and receive pairs or an open receive pair can cause errors. Set the receive pair to lines 1 and 2; the transmit pair should be lines 4 and 5.
The pins on a RJ-48 jack are numbered from 1 through 8. Pin 1 is the leftmost pin when looking at the jack with the metal pins facing you. Refer to Figure 15-12 for more information.
Figure 15-12 RJ-45 Cable

Step 4 ![]() Try using a rollover cable.
Try using a rollover cable.
Step 5 ![]() Check to see whether there are far-end block errors. If so, the problem exists with the receive lead on the local end. Contact TAC for more assistance.
Check to see whether there are far-end block errors. If so, the problem exists with the receive lead on the local end. Contact TAC for more assistance.
Run the show controller e1 exec command after each step to check whether the controller exhibits any errors.
If the Line Is in Loopback Mode
Check to see whether the line is in loopback mode from the show controller e1 output. A line should be in loopback mode only for testing purposes.
To turn off loopback, use the no loopback command in the controller configuration mode, as shown here:
maui-nas-03(config-controlle)#no loopback
If the Controller Displays Any Alarms
Check the show controller command output to see whether any alarms are displayed by the controller.
We will now discuss various alarms and the procedure necessary to correct them.
Receiver (Rx) Has Remote Alarm
A received remote alarm means that an alarm is occurring on the line upstream of the equipment connected to the port.
Step 1 ![]() Check to see whether the framing format configured on the port matches the framing format of the line. If not, change the framing format on the controller to match that of the line.
Check to see whether the framing format configured on the port matches the framing format of the line. If not, change the framing format on the controller to match that of the line.
Step 2 ![]() Check the linecoding setting on the remote-end equipment. Contact your service provider for the correct settings. Correct any misconfigurations, as necessary.
Check the linecoding setting on the remote-end equipment. Contact your service provider for the correct settings. Correct any misconfigurations, as necessary.
Step 3 ![]() Insert an external loopback cable into the port. To create a loopback plug, refer to the section «Performing Hardware Loopback Plug Test,» earlier in the chapter.
Insert an external loopback cable into the port. To create a loopback plug, refer to the section «Performing Hardware Loopback Plug Test,» earlier in the chapter.
Step 4 ![]() Check to see whether there are any alarms. If you do not see any alarms, then the local hardware is probably in good condition. In that case, do the following:
Check to see whether there are any alarms. If you do not see any alarms, then the local hardware is probably in good condition. In that case, do the following:
•![]() Check the cabling. Refer to the section «Loss of Signal» for more information.
Check the cabling. Refer to the section «Loss of Signal» for more information.
•![]() Check the settings at the remote end, and verify that they match your port settings.
Check the settings at the remote end, and verify that they match your port settings.
•![]() If the problem persists, contact your service provider.
If the problem persists, contact your service provider.
Step 5 ![]() Remove the loopback plug and reconnect your E1 line.
Remove the loopback plug and reconnect your E1 line.
Step 6 ![]() Check the cabling. Refer to the section «Loss of Signal» for more information.
Check the cabling. Refer to the section «Loss of Signal» for more information.
Step 7 ![]() Power-cycle the router.
Power-cycle the router.
Step 8 ![]() Connect the E1 line to a different port. Configure the port with the same settings as that of the line. If the problem does not persist, then the fault lies with the port:
Connect the E1 line to a different port. Configure the port with the same settings as that of the line. If the problem does not persist, then the fault lies with the port:
•![]() Reconnect the E1 line to the original port.
Reconnect the E1 line to the original port.
•![]() Proceed to the «Troubleshooting E1 Error Events» section.
Proceed to the «Troubleshooting E1 Error Events» section.
If the problem persists, then do the following:
•![]() Perform a hardware loop test, as described in the section «Performing a Hardware Loop Test,»
Perform a hardware loop test, as described in the section «Performing a Hardware Loop Test,»
•![]() Replace the E1 controller card.
Replace the E1 controller card.
•![]() Proceed to the «Troubleshooting E1 Error Events» section.
Proceed to the «Troubleshooting E1 Error Events» section.
Transmitter Sending Remote Alarm (Red)
A red alarm is declared when the CSU cannot synchronize with the framing pattern on the E1 line.
Step 1 ![]() Check to see whether the framing format configured on the port matches the framing format of the line. If not, change the framing format on the controller to match that of the line.
Check to see whether the framing format configured on the port matches the framing format of the line. If not, change the framing format on the controller to match that of the line.
Step 2 ![]() Check the settings at the remote end, and verify that they match your port settings.
Check the settings at the remote end, and verify that they match your port settings.
Step 3 ![]() Insert an external loopback cable into the port. To create a loopback plug, refer to the section «Performing Hardware Loopback Plug Test,» earlier in the chapter.
Insert an external loopback cable into the port. To create a loopback plug, refer to the section «Performing Hardware Loopback Plug Test,» earlier in the chapter.
Step 4 ![]() Check to see whether there are any alarms. If you do not see any alarms, then the local hardware is probably in good condition. In that case, do the following:
Check to see whether there are any alarms. If you do not see any alarms, then the local hardware is probably in good condition. In that case, do the following:
•![]() Check the cabling. Refer to the section «Loss of Signal» for more information.
Check the cabling. Refer to the section «Loss of Signal» for more information.
•![]() If the problem persists, contact your service provider.
If the problem persists, contact your service provider.
Step 5 ![]() Connect the E1 line to a different port. Configure the port with the same settings as that of the line. If the problem does not persist, then the fault lies with the port:
Connect the E1 line to a different port. Configure the port with the same settings as that of the line. If the problem does not persist, then the fault lies with the port:
•![]() Reconnect the E1 line to the original port.
Reconnect the E1 line to the original port.
•![]() Proceed to the «Troubleshooting E1 Error Events» section.
Proceed to the «Troubleshooting E1 Error Events» section.
If the problem persists, then do the following:
•![]() Perform a hardware loop test, as described in the section «Performing a Hardware Loop Test.»
Perform a hardware loop test, as described in the section «Performing a Hardware Loop Test.»
•![]() Replace the E1 controller card.
Replace the E1 controller card.
•![]() Proceed to the «Troubleshooting E1 Error Events» section.
Proceed to the «Troubleshooting E1 Error Events» section.
•![]() Contact your service provider.
Contact your service provider.
Troubleshooting E1 Error Events
The show controller e1 exec command provides error messages that can be used to troubleshoot problems. We will now discuss several error messages and how to correct the errors.
To see whether the error counters are increasing, execute the show controller e1 command repeatedly. Note the values of the counters for the current interval.
Consult your service provider for framing and linecoding settings.
Slip Secs Counter Is Increasing
The presence of slips on E1 lines indicates a clocking problem. The E1 provider (telco) will provide the clocking that the customer premises equipment (CPE) will need to synchronize to.
Step 1 ![]() Verify that the clock source is derived from the network. This can be ascertained by looking for «Clock Source is Line Primary.»
Verify that the clock source is derived from the network. This can be ascertained by looking for «Clock Source is Line Primary.»
Note ![]() If there are multiple E1s into an access server, only one can be the primary, while the other E1s derive the clock from the primary. In that case, verify that the E1 line designated as the primary clock source is configured correctly.
If there are multiple E1s into an access server, only one can be the primary, while the other E1s derive the clock from the primary. In that case, verify that the E1 line designated as the primary clock source is configured correctly.
Step 2 ![]() Set the E1 clock source correctly from the controller configuration mode.
Set the E1 clock source correctly from the controller configuration mode.
maui-nas-03(config-controlle)#clock source line primary
Framing Loss Seconds Counter Is Increasing
Step 1 ![]() Check to see whether the framing format configured on the port matches the framing format of the line. You can check this by looking for «Framing is {CRC4|no CRC4}» in the show controller e1 output.
Check to see whether the framing format configured on the port matches the framing format of the line. You can check this by looking for «Framing is {CRC4|no CRC4}» in the show controller e1 output.
Step 2 ![]() To change the framing format, use the framing {CRC4 | no CRC4} command in the controller configuration mode, as shown here:
To change the framing format, use the framing {CRC4 | no CRC4} command in the controller configuration mode, as shown here:
maui-nas-03(config-controlle)#framing crc4
Line Code Violations Are Increasing
Step 1 ![]() Check to see whether the linecoding configured on the port matches the framing format of the line. You can check this by looking for «Line Code is {AMI/HDB3}» in the show controller e1 output.
Check to see whether the linecoding configured on the port matches the framing format of the line. You can check this by looking for «Line Code is {AMI/HDB3}» in the show controller e1 output.
Step 2 ![]() To change the linecoding, use the linecode {ami | hdb3} command in the controller configuration mode, as shown here:
To change the linecoding, use the linecode {ami | hdb3} command in the controller configuration mode, as shown here:
maui-nas-03(config-controlle)#linecode ami
Verifying That isdn switchtype and pri-group Are Configured Correctly
Use the show running-config command to check whether isdn switchtype and pri-group timeslots are configured correctly. Contact your service provider for correct values.
To change the isdn switchtype and pri-group, use these lines:
maui-nas-03#configure terminal
maui-nas-03(config)#isdn switch-type primary-net5
maui-nas-03(config)#controller e1 0
maui-nas-03(config-controlle)#pri-group timeslots 1-31
Verifying the Signaling Channel
If the error counters do not increase but the problem persists, verify that the signaling channel is up and configured correctly.
Step 1 ![]() Run the show interface serial x:15 command, where x should be replaced by the interface number.
Run the show interface serial x:15 command, where x should be replaced by the interface number.
Step 2 ![]() Check to see whether the interface is up. If the interface is not up, use the no shutdown command to bring up the interface.
Check to see whether the interface is up. If the interface is not up, use the no shutdown command to bring up the interface.
maui-nas-03#config terminal
Enter configuration commands, one per line. End with CNTL/Z.
maui-nas-03(config)#interface serial 0:15
maui-nas-03(config-if)#no shutdown
Step 3 ![]() Ensure that encapsulation is PPP. If the interface is not using PPP, then use the encapsulation ppp command in the interface configuration mode to correct it.
Ensure that encapsulation is PPP. If the interface is not using PPP, then use the encapsulation ppp command in the interface configuration mode to correct it.
maui-nas-03(config-if)#encapsulation ppp
Step 4 ![]() Check to see whether loopback is set. Loopback should be set only for testing purposes. Use the no loopback command to remove loopbacks.
Check to see whether loopback is set. Loopback should be set only for testing purposes. Use the no loopback command to remove loopbacks.
maui-nas-03(config-if)#no loopback
Step 5 ![]() Power-cycle the router.
Power-cycle the router.
Step 6 ![]() If the problem persists, contact your service provider or Cisco TAC.
If the problem persists, contact your service provider or Cisco TAC.
Troubleshooting a PRI
Whenever troubleshooting a PRI, you need to check whether the E1 is running cleanly on both ends. If Layer 1 problems have been resolved, as described previously, we must look to Layer 2 and 3 problems.
Troubleshooting Using the show isdn status Command
The show isdn status command is used to display a snapshot of all ISDN interfaces. It displays the status of Layers 1, 2, and 3.
Step 1 ![]() Verify that Layer 1 is active.
Verify that Layer 1 is active.
The Layer 1 status should always say ACTIVE unless the E1 is down.
If show isdn status indicates that Layer 1 is DEACTIVATED, then there is a problem with the physical connectivity on the E1 line. Refer to the section «Is the Controller Administratively Down?»
Also verify that the E1 is not administratively down. Use the no shutdown command to bring up the E1 controller.
Step 2 ![]() Check whether Layer 2 state is MULTIPLE_FRAME_ESTABLISHED.
Check whether Layer 2 state is MULTIPLE_FRAME_ESTABLISHED.
The desired Layer 2 state is MULTIPLE_FRAME_ESTABLISHED, which indicates that the startup protocol between ISDN switch and end device has been established and that we are exchanging Layer 2 frames.
If Layer 2 is not MULTIPLE_FRAME_ESTABLISHED, use the show controller E1 exec command to diagnose the problem. Refer to the previous section «Troubleshooting Using the show controller e1 Command,» and the upcoming section «Troubleshooting E1 Error Events.»
Because show isdn status is a snapshot of the current status, it is possible that Layer 2 is bouncing up and down despite indicating Mulitple_Frame_Established. Use debug isdn q921 to verify that Layer 2 is stable.
Using debug q921
The debug isdn q921 command displays data link layer (Layer 2) access procedures that are taking place at the router on the D-channel.
Ensure that you are configured to view debug messages by using the logging console or terminal monitor commands, as necessary.
Note ![]() In a production environment, verify that console logging is disabled. Enter the show logging command. If logging is enabled, the access server might intermittently freeze up as soon as the console port gets overloaded with log messages. Enter the no logging console command.
In a production environment, verify that console logging is disabled. Enter the show logging command. If logging is enabled, the access server might intermittently freeze up as soon as the console port gets overloaded with log messages. Enter the no logging console command.
Note ![]() If debug isdn q921 is turned on and you do not receive any debug outputs, place a call or reset the controller to get debug outputs.
If debug isdn q921 is turned on and you do not receive any debug outputs, place a call or reset the controller to get debug outputs.
Step 1 ![]() Verify that Layer 2 is stable. You should observe the debug outputs for messages indicating that the service is not bouncing up and down. If you see the following types of debug outputs, the line is not stable:
Verify that Layer 2 is stable. You should observe the debug outputs for messages indicating that the service is not bouncing up and down. If you see the following types of debug outputs, the line is not stable:
Mar 20 10:06:07.882: %ISDN-6-LAYER2DOWN: Layer 2 for Interface Se0:15, TEI 0 changed
to down
Mar 20 10:06:09.882: %LINK-3-UPDOWN: Interface Serial0:15, changed state to down
Mar 20 10:06:21.274: %DSX1-6-CLOCK_CHANGE: Controller 0  clock is now selected as
clock source
Mar 20 10:06:21.702: %ISDN-6-LAYER2UP: Layer 2 for Interface Se0:15, TEI 0 changed to
up
Mar 20 10:06:22.494: %CONTROLLER-5-UPDOWN: Controller E1 0, changed state to up
Mar 20 10:06:24.494: %LINK-3-UPDOWN: Interface Serial0:15, changed state to up
If Layer 2 does not appear to be stable refer to the «Troubleshooting Error Events» section, earlier in this chapter.
Step 2 ![]() Verify that you are seeing only SAPI messages in both transmit (TX) and receive (RX) sides.
Verify that you are seeing only SAPI messages in both transmit (TX) and receive (RX) sides.
Mar 20 10:06:52.505: ISDN Se0:15: TX -> RRf sapi = 0 tei = 0 nr = 0
Mar 20 10:06:52.505: ISDN Se0:15: RX <- RRf sapi = 0 tei = 0 nr = 0
Mar 20 10:07:22.505: ISDN Se0:15: TX -> RRp sapi = 0 tei = 0 nr = 0
Mar 20 10:07:22.509: ISDN Se0:15: RX <- RRp sapi = 0 tei = 0 nr = 0
Mar 20 10:07:22.509: ISDN Se0:15: TX -> RRf sapi = 0 tei = 0 nr = 0
Mar 20 10:07:22.509: ISDN Se0:15: RX <- RRf sapi = 0 tei = 0 nr = 0
Step 3 ![]() Verify that you are not seeing SABME messages, which indicates that Layer 2 is trying to reinitialize. This is usually seen when we are transmitting poll requests (RRp) and not getting a response from the switch (RRf), or vice versa. The following are examples of SABME messages. We should get a response from ISDN switch for our SABME messages (UA frame received):
Verify that you are not seeing SABME messages, which indicates that Layer 2 is trying to reinitialize. This is usually seen when we are transmitting poll requests (RRp) and not getting a response from the switch (RRf), or vice versa. The following are examples of SABME messages. We should get a response from ISDN switch for our SABME messages (UA frame received):
Mar 20 10:06:21.702: ISDN Se0:15: RX <- SABMEp sapi = 0 tei = 0
Mar 20 10:06:22.494: ISDN Se0:15: TX -> SABMEp sapi = 0 tei = 0
If you are seeing SABME messages, do the following:
•![]() Use the show running-config command to check whether isdn switchtype and pri-group timeslots are configured correctly. Contact your service provider for correct values.
Use the show running-config command to check whether isdn switchtype and pri-group timeslots are configured correctly. Contact your service provider for correct values.
•![]() To change the isdn switchtype and pri-group, use these lines:
To change the isdn switchtype and pri-group, use these lines:
maui-nas-03#configure terminal
maui-nas-03(config)#isdn switch-type primary-net5
maui-nas-03(config)#controller e1 0
maui-nas-03(config-controlle)#pri-group timeslots 1-31
Step 4 ![]() Verify that the D-channel is up using the show interfaces serial x:15 command.
Verify that the D-channel is up using the show interfaces serial x:15 command.
If the D-channel is not up, then use no shutdown command to bring it up:
maui-nas-03(config)#interface serial 0:15
maui-nas-03(config-if)#no shutdown
Step 5 ![]() Check to see whether encapsulation is PPP. If not, use the encapsulation ppp command to set encapsulation.
Check to see whether encapsulation is PPP. If not, use the encapsulation ppp command to set encapsulation.
maui-nas-03(config-if)#encapsulation ppp
Step 6 ![]() Check to see whether the interface is in loopback mode. For normal operation, the interface should not be in loopback mode.
Check to see whether the interface is in loopback mode. For normal operation, the interface should not be in loopback mode.
maui-nas-03(config-if)#no loopback
Step 7 ![]() Power-cycle the router.
Power-cycle the router.
Step 8 ![]() If the problem persists, contact your service provider or Cisco TAC.
If the problem persists, contact your service provider or Cisco TAC.
Содержание
- Carrier Ethernet Configuration Guide, Cisco IOS Release 15SY
- Bias-Free Language
- Book Title
- Using Ethernet Operations Administration and Maintenance
- Results
- Chapter: Using Ethernet Operations Administration and Maintenance
- Using Ethernet Operations Administration and Maintenance
- Finding Feature Information
- Information About Using Ethernet Operations Administration and Maintenance
- Ethernet OAM
- OAM Client
- OAM Sublayer
- Benefits of Ethernet OAM
- Cisco Implementation of Ethernet OAM
- OAM Features
- Discovery
- Link Monitoring
- Remote Failure Indication
- Remote Loopback
- Cisco Vendor-Specific Extensions
- OAM Messages
- IEEE 802.3ah Link Fault RFI Support
- Ethernet Connectivity Fault Management
- High Availability Features Supported by 802.3ah
- Benefits of 802.3ah HA
- NSF SSO Support in 802.3ah OAM
- ISSU Support in 802.3ah OAM
- How to Set Up and Configure Ethernet Operations Administration and Maintenance
- Enabling Ethernet OAM on an Interface
- Disabling and Enabling a Link Monitoring Session
- Disabling a Link Monitoring Session
- Enabling a Link Monitoring Session
- Stopping and Starting Link Monitoring Operations
- Stopping Link Monitoring Operations
- Starting Link Monitoring Operations
- Configuring Link Monitoring Options
- Example
- Configuring Global Ethernet OAM Options Using a Template
- Configuring a Port for Link Fault RFI Support
- Configuration Examples for Ethernet Operations Administration and Maintenance
- Verifying an OAM Session
- Verifying OAM Discovery Status
- Verifying Information OAMPDU and Fault Statistics
- Verifying Link Monitoring Configuration and Status
- Verifying Status of a Remote OAM Client
- Additional References
- Related Documents
- Standards
- Technical Assistance
- Feature Information for Using Ethernet Operations Administration and Maintenance
Carrier Ethernet Configuration Guide, Cisco IOS Release 15SY
Bias-Free Language
The documentation set for this product strives to use bias-free language. For the purposes of this documentation set, bias-free is defined as language that does not imply discrimination based on age, disability, gender, racial identity, ethnic identity, sexual orientation, socioeconomic status, and intersectionality. Exceptions may be present in the documentation due to language that is hardcoded in the user interfaces of the product software, language used based on RFP documentation, or language that is used by a referenced third-party product. Learn more about how Cisco is using Inclusive Language.
Book Title
Carrier Ethernet Configuration Guide, Cisco IOS Release 15SY
Using Ethernet Operations Administration and Maintenance
View with Adobe Reader on a variety of devices
Results
Chapter: Using Ethernet Operations Administration and Maintenance
Using Ethernet Operations Administration and Maintenance
Ethernet Operations, Administration, and Maintenance (OAM) is a protocol for installing, monitoring, and troubleshooting Ethernet metropolitan-area networks (MANs) and Ethernet WANs. It relies on a new, optional sublayer in the data link layer of the Open Systems Interconnection (OSI) model. The OAM features covered by this protocol are Discovery, Link Monitoring, Remote Fault Detection, Remote Loopback, and Cisco Proprietary Extensions.
The advent of Ethernet as a MAN and WAN technology has emphasized the necessity for integrated management for larger deployments. For Ethernet to extend into public MANs and WANs, it must be equipped with a new set of requirements on Ethernet’s traditional operations, which had been centered on enterprise networks only. The expansion of Ethernet technology into the domain of service providers, where networks are substantially larger and more complex than enterprise networks and the user-base is wider, makes operational management of link uptime crucial.
Finding Feature Information
Your software release may not support all the features documented in this module. For the latest caveats and feature information, see Bug Search Tool and the release notes for your platform and software release. To find information about the features documented in this module, and to see a list of the releases in which each feature is supported, see the feature information table at the end of this module.
Use Cisco Feature Navigator to find information about platform support and Cisco software image support. To access Cisco Feature Navigator, go to www.cisco.com/go/cfn. An account on Cisco.com is not required.
Information About Using Ethernet Operations Administration and Maintenance
Ethernet OAM
Ethernet OAM is a protocol for installing, monitoring, and troubleshooting metro Ethernet networks and Ethernet WANs. It relies on a new, optional sublayer in the data link layer of the OSI model. Ethernet OAM can be implemented on any full-duplex point-to-point or emulated point-to-point Ethernet link. A system-wide implementation is not required; OAM can be deployed for part of a system; that is, on particular interfaces.
Normal link operation does not require Ethernet OAM. OAM frames, called OAM protocol data units (PDUs), use the slow protocol destination MAC address 0180.c200.0002. They are intercepted by the MAC sublayer and cannot propagate beyond a single hop within an Ethernet network.
Ethernet OAM is a relatively slow protocol with modest bandwidth requirements. The frame transmission rate is limited to a maximum of 10 frames per second; therefore, the impact of OAM on normal operations is negligible. However, when link monitoring is enabled, the CPU must poll error counters frequently. In this case, the required CPU cycles will be proportional to the number of interfaces that have to be polled.
Two major components, the OAM client and the OAM sublayer, make up Ethernet OAM. The following two sections describe these components.
OAM Client
The OAM client is responsible for establishing and managing Ethernet OAM on a link. The OAM client also enables and configures the OAM sublayer. During the OAM discovery phase, the OAM client monitors OAM PDUs received from the remote peer and enables OAM functionality on the link based on local and remote state as well as configuration settings. Beyond the discovery phase (at steady state), the OAM client is responsible for managing the rules of response to OAM PDUs and managing the OAM remote loopback mode.
OAM Sublayer
The OAM sublayer presents two standard IEEE 802.3 MAC service interfaces: one facing toward the superior sublayers, which include the MAC client (or link aggregation), and the other interface facing toward the subordinate MAC control sublayer. The OAM sublayer provides a dedicated interface for passing OAM control information and OAM PDUs to and from a client.
The OAM sublayer is made up of three components: control block, multiplexer, and packet parser (p-parser). Each component is described in the following sections.
Control Block
The control block provides the interface between the OAM client and other blocks internal to the OAM sublayer. The control block incorporates the discovery process, which detects the existence and capabilities of remote OAM peers. It also includes the transmit process that governs the transmission of OAM PDUs to the multiplexer and a set of rules that govern the receipt of OAM PDUs from the p-parser.
Multiplexer
The multiplexer manages frames generated (or relayed) from the MAC client, control block, and p-parser. The multiplexer passes through frames generated by the MAC client untouched. It passes OAM PDUs generated by the control block to the subordinate sublayer; for example, the MAC sublayer. Similarly, the multiplexer passes loopback frames from the p-parser to the same subordinate sublayer when the interface is in OAM remote loopback mode.
P-Parser
The p-parser classifies frames as OAM PDUs, MAC client frames, or loopback frames and then dispatches each class to the appropriate entity. OAM PDUs are sent to the control block. MAC client frames are passed to the superior sublayer. Loopback frames are dispatched to the multiplexer.
Benefits of Ethernet OAM
Ethernet OAM provides the following benefits:
Competitive advantage for service providers
Standardized mechanism to monitor the health of a link and perform diagnostics
Cisco Implementation of Ethernet OAM
The Cisco implementation of Ethernet OAM consists of the Ethernet OAM shim and the Ethernet OAM module.
The Ethernet OAM shim is a thin layer that connects the Ethernet OAM module and the platform code. It is implemented in the platform code (driver). The shim also communicates port state and error conditions to the Ethernet OAM module via control signals.
The Ethernet OAM module, implemented within the control plane, handles the OAM client as well as control block functionality of the OAM sublayer. This module interacts with the CLI and Simple Network Management Protocol (SNMP)/programmatic interface via control signals. In addition, this module interacts with the Ethernet OAM shim through OAM PDU flows.
OAM Features
The OAM features as defined by IEEE 802.3ah, Ethernet in the First Mile , are discovery, Link Monitoring, Remote Fault Detection, Remote Loopback, and Cisco Proprietary Extensions.
Discovery
Discovery is the first phase of Ethernet OAM and it identifies the devices in the network and their OAM capabilities. Discovery uses information OAM PDUs. During the discovery phase, the following information is advertised within periodic information OAM PDUs:
OAM mode—Conveyed to the remote OAM entity. The mode can be either active or passive and can be used to determine device functionality.
OAM configuration (capabilities)—Advertises the capabilities of the local OAM entity. With this information a peer can determine what functions are supported and accessible; for example, loopback capability.
OAM PDU configuration—Includes the maximum OAM PDU size for receipt and delivery. This information along with the rate limiting of 10 frames per second can be used to limit the bandwidth allocated to OAM traffic.
Platform identity—A combination of an organization unique identifier (OUI) and 32-bits of vendor-specific information. OUI allocation, controlled by the IEEE, is typically the first three bytes of a MAC address.
Discovery includes an optional phase in which the local station can accept or reject the configuration of the peer OAM entity. For example, a node may require that its partner support loopback capability to be accepted into the management network. These policy decisions may be implemented as vendor-specific extensions.
Link Monitoring
Link monitoring in Ethernet OAM detects and indicates link faults under a variety of conditions. Link monitoring uses the event notification OAM PDU and sends events to the remote OAM entity when there are problems detected on the link. The error events include the following:
Error Symbol Period (error symbols per second)—The number of symbol errors that occurred during a specified period exceeded a threshold. These errors are coding symbol errors.
Error Frame (error frames per second)—The number of frame errors detected during a specified period exceeded a threshold.
Error Frame Period (error frames per n frames)—The number of frame errors within the last n frames has exceeded a threshold.
Error Frame Seconds Summary (error seconds per m seconds)—The number of error seconds (1-second intervals with at least one frame error) within the last m seconds has exceeded a threshold.
Since IEEE 802.3ah OAM does not provide a guaranteed delivery of any OAM PDU, the event notification OAM PDU may be sent multiple times to reduce the probability of a lost notification. A sequence number is used to recognize duplicate events.
Remote Failure Indication
Faults in Ethernet connectivity that are caused by slowly deteriorating quality are difficult to detect. Ethernet OAM provides a mechanism for an OAM entity to convey these failure conditions to its peer via specific flags in the OAM PDU. The following failure conditions can be communicated:
Link Fault—Loss of signal is detected by the receiver; for instance, the peer’s laser is malfunctioning. A link fault is sent once per second in the information OAM PDU. Link fault applies only when the physical sublayer is capable of independently transmitting and receiving signals.
Dying Gasp—An unrecoverable condition has occurred; for example, when an interface is shut down. This type of condition is vendor specific. A notification about the condition may be sent immediately and continuously.
Critical Event—An unspecified critical event has occurred. This type of event is vendor specific. A critical event may be sent immediately and continuously.
Remote Loopback
An OAM entity can put its remote peer into loopback mode using the loopback control OAM PDU. Loopback mode helps an administrator ensure the quality of links during installation or when troubleshooting. In loopback mode, every frame received is transmitted back on the same port except for OAM PDUs and pause frames. The periodic exchange of OAM PDUs must continue during the loopback state to maintain the OAM session.
The loopback command is acknowledged by responding with an information OAM PDU with the loopback state indicated in the state field. This acknowledgement allows an administrator, for example, to estimate if a network segment can satisfy a service-level agreement. Acknowledgement makes it possible to test delay, jitter, and throughput.
When an interface is set to the remote loopback mode the interface no longer participates in any other Layer 2 or Layer 3 protocols; for example Spanning Tree Protocol (STP) or Open Shortest Path First (OSPF). The reason is that when two connected ports are in a loopback session, no frames other than the OAM PDUs are sent to the CPU for software processing. The non-OAM PDU frames are either looped back at the MAC level or discarded at the MAC level.
From a user’s perspective, an interface in loopback mode is in a link-up state.
Cisco Vendor-Specific Extensions
Ethernet OAM allows vendors to extend the protocol by allowing them to create their own type-length-value (TLV) fields.
OAM Messages
Ethernet OAM messages or OAM PDUs are standard length, untagged Ethernet frames within the normal frame length bounds of 64 to 1518 bytes. The maximum OAM PDU frame size exchanged between two peers is negotiated during the discovery phase.
OAM PDUs always have the destination address of slow protocols (0180.c200.0002) and an Ethertype of 8809. OAM PDUs do not go beyond a single hop and have a hard-set maximum transmission rate of 10 OAM PDUs per second. Some OAM PDU types may be transmitted multiple times to increase the likelihood that they will be successfully received on a deteriorating link.
Four types of OAM messages are supported:
Information OAM PDU—A variable-length OAM PDU that is used for discovery. This OAM PDU includes local, remote, and organization-specific information.
Event notification OAM PDU—A variable-length OAM PDU that is used for link monitoring. This type of OAM PDU may be transmitted multiple times to increase the chance of a successful receipt; for example, in the case of high-bit errors. Event notification OAM PDUs also may include a time stamp when generated.
Loopback control OAM PDU—An OAM PDU fixed at 64 bytes in length that is used to enable or disable the remote loopback command.
Vendor-specific OAM PDU—A variable-length OAM PDU that allows the addition of vendor-specific extensions to OAM.
IEEE 802.3ah Link Fault RFI Support
The IEEE 802.3ah Link Fault RFI Support feature provides a per-port configurable option that moves a port into a blocking state when an OAM PDU control request packet is received with the Link Fault Status flag set. In the blocking state, the port can continue to receive OAM PDUs, detect remote link status, and automatically recover when the remote link becomes operational. When an OAM PDU is received with the Link Fault Status flag set to zero or FALSE, the port is enabled and all VLANs configured on the port are set to “forwarding.”
 Note |
If you configure the Ethernet OAM timeout period to be the minimum allowable value of 2 seconds, the Ethernet OAM session may be dropped briefly when the port transitions from blocked to unblocked. This action will not occur by default; the default timeout value is 5 seconds. Before the release of the IEEE 802.3ah Link Fault RFI Support feature, when an OAM PDU control request packet was received with the Link Fault Status flag set, one of three actions was taken: The port was put in the error-disable state, meaning that the port did not send or receive packets, including Bridge Protocol Data Units (BPDU) packets. In the error-disable state, a link can automatically recover after the error-disable timeout period but cannot recover automatically when the remote link becomes operational. A warning message was displayed or logged, and the port remained operational. The Link Fault Status flag was ignored. Ethernet Connectivity Fault ManagementEthernet connectivity fault management (CFM) is an end-to-end per-service-instance Ethernet layer OAM protocol that includes proactive connectivity monitoring, fault verification, and fault isolation. End to end can be provider edge (PE) to PE or customer edge (CE) to CE. Per service instance means per VLAN. For more information about Ethernet CFM, see Ethernet Connectivity Fault Management . High Availability Features Supported by 802.3ahIn access and service provider networks using Ethernet technology, High Availability (HA) is a requirement, especially on Ethernet OAM components that manage Ethernet virtual circuit (EVC) connectivity. End-to-end connectivity status information is critical and must be maintained on a hot standby Route Switch Processor (RSP) (a standby RSP that has the same software image as the active RSP and supports synchronization of line card, protocol, and application state information between RSPs for supported features and protocols). End-to-end connectivity status is maintained on the CE, PE, and access aggregation PE (uPE) network nodes based on information received by protocols such as CFM and 802.3ah. This status information is used to either stop traffic or switch to backup paths when an EVC is down. Metro Ethernet clients (for example, CFM and 802.3ah) maintain configuration data and dynamic data, which is learned through protocols. Every transaction involves either accessing or updating data among the various databases. If the databases are synchronized across active and standby modules, the RSPs are transparent to clients. Cisco infrastructure provides various component application program interfaces (APIs) for clients that are helpful in maintaining a hot standby RSP. Metro Ethernet HA clients (such as, HA/ISSU, CFM HA/ISSU, 802.3ah HA/ISSU) interact with these components, update the databases, and trigger necessary events to other components. Benefits of 802.3ah HAElimination of network downtime for Cisco software image upgrades, resulting in higher availability Elimination of resource scheduling challenges associated with planned outages and late night maintenance windows Accelerated deployment of new services and applications and faster implementation of new features, hardware, and fixes due to the elimination of network downtime during upgrades Reduced operating costs due to outages while delivering higher service levels due to the elimination of network downtime during upgrades NSF SSO Support in 802.3ah OAMThe redundancy configurations Stateful Switchover (SSO) and Nonstop Forwarding (NSF) are both supported in Ethernet OAM and are automatically enabled. A switchover from an active to a standby Route Switch Processor (RSP) occurs when the active RSP fails, is removed from the networking device, or is manually taken down for maintenance. NSF interoperates with the SSO feature to minimize network downtime following a switchover. The primary function of Cisco NSF is to continue forwarding IP packets following an RSP switchover. For detailed information about the SSO feature, see the “Configuring Stateful Switchover” module of the High Availability Configuration Guide. For detailed information about the NSF feature, see the “Configuring Cisco Nonstop Forwarding” module of the High Availability Configuration Guide. ISSU Support in 802.3ah OAMCisco In-Service Software Upgrades (ISSUs) allow you to perform a Cisco software upgrade or downgrade without disrupting packet flow. ISSU is automatically enabled in 802.3ah. OAM performs a bulk update and a runtime update of the continuity check database to the standby Route Switch Processor (RSP), including adding, deleting, or updating a row. This checkpoint data requires ISSU capability to transform messages from one release to another. All the components that perform active RSP to standby RSP updates using messages require ISSU support. ISSU lowers the impact that planned maintenance activities have on network availability by allowing software changes while the system is in service. For detailed information about ISSU, see the “Performing an In Service Software Upgrade” module of the High Availability Configuration Guide. How to Set Up and Configure Ethernet Operations Administration and MaintenanceEnabling Ethernet OAM on an InterfaceEthernet OAM is by default disabled on an interface. 2. configure terminal 3. interface type number 4. ethernet oam [ max-rate oampdus | min-rate num-seconds | mode < active | passive >| timeout seconds ] DETAILED STEPS
|
In my topology, I have connected spirent — traffic generator to MRV switch ( L1 switch) and then connected to CISCO switch. I am seeing some input errors on this interface. What does it mean? Does it mean that some packets are bad from spirent MRV switch. here is the show command of the interface gi 0/13.
In my topology, spirent is connected to MRV switch ( L1 switch).
MRV switch interface gi 0/13 is connected to the CISCO switch interface gi 0/14.
I don’t see any errors on the gi 0/14 of the cisco switch. However, I see the errors on the gi 0/13 ,which is the interface coming from MRV. Does it mean that CISCO switch is telling that there is some problem in the MRV switch?
1557336 input errors, 1557204 CRC, 0 frame, 0 overrun, 0 ignored
My quesion is what the above error indicates to me.
 c3560g_1>sh interfaces gi 0/13
    GigabitEthernet0/13 is up, line protocol is up (connected)
      Hardware is Gigabit Ethernet, address is 0013.c4d0.570d (bia 0013.c4d0.570d)
      Description: -- MRV, 1.1.19 --
      MTU 1500 bytes, BW 1000000 Kbit, DLY 10 usec,
         reliability 255/255, txload 1/255, rxload 1/255
      Encapsulation ARPA, loopback not set
      Keepalive set (10 sec)
      Full-duplex, 1000Mb/s, media type is 10/100/1000BaseTX
      input flow-control is off, output flow-control is unsupported
      ARP type: ARPA, ARP Timeout 04:00:00
      Last input never, output 00:00:01, output hang never
      Last clearing of "show interface" counters never
      Input queue: 0/75/0/0 (size/max/drops/flushes); Total output drops: 0
      Queueing strategy: fifo
      Output queue: 0/40 (size/max)
      5 minute input rate 0 bits/sec, 0 packets/sec
      5 minute output rate 1000 bits/sec, 2 packets/sec
         80971440 packets input, 125278495288 bytes, 0 no buffer
         Received 0 broadcasts (0 multicasts)
         132 runts, 0 giants, 0 throttles
         1557336 input errors, 1557204 CRC, 0 frame, 0 overrun, 0 ignored
         0 watchdog, 0 multicast, 0 pause input
         0 input packets with dribble condition detected
         24289474 packets output, 36669631614 bytes, 0 underruns
         0 output errors, 0 collisions, 5 interface resets
         0 babbles, 0 late collision, 0 deferred
         0 lost carrier, 0 no carrier, 0 PAUSE output
         0 output buffer failures, 0 output buffers swapped out
Overview:
Interface and cable issues can be due to collisions, errors, duplex mismatch or speed mismatch
Study Notes:
Collisions
- In full-duplex Ethernet, collision detection is disabled
- A collision is the mechanism used by Ethernet to control access and allocate shared bandwidth among stations that want to transmit at the same time on a shared medium.
- Because the medium is shared, a mechanism must exist where two stations can detect that they want to transmit at the same time. This mechanism is collision detection.
- Ethernet uses CSMA/CD (Carrier Sense Multiple Access/Collision Detect) as its collision detection method. Here is a simplified example of Ethernet operation:
- Station A wishes to send a frame. First, it checks if the medium is available (Carrier Sense). If it isn’t, it waits until the current sender on the medium has finished.
- Suppose Station A believes the medium is available and attempts to send a frame. Because the medium is shared (Multiple Access), other senders might also attempt to send at the same time. At this point, Station B tries to send a frame at the same time as Station A.
- Shortly after, Station A and Station B realize that there is another device attempting to send a frame (Collision Detect). Each station waits for a random amount of time before sending again. The time after the collision is divided into time slots; Station A and Station B each pick a random slot for attempting a retransmission.
- Should Station A and Station B attempt to retransmit in the same slot, they extend the number of slots. Each station then picks a new slot, thereby decreasing the probability of retransmitting in the same slot.
- Collisions are a way to distribute the traffic load over time by arbitrating access to the shared medium. Collisions are not bad; they are essential to correct Ethernet operation.
- The deferred counter counts the number of times the interface has tried to send a frame, but found the carrier busy at the first attempt (Carrier Sense). This does not constitute a problem, and is part of normal Ethernet operation.
- An increasing collision rate (number of packets output divided by the number of collisions) does not indicate a problem: it is merely an indication of a higher offered load to the network. An example of this could be because another station was added to the network.
- There is no set limit for «how many collisions are bad» or a maximum collision rate.
- The collisions counter does not provide a very useful statistic to analyze network performance or problems.
- The station that reports a late collision merely indicates the problem; it is generally not the cause of the problem. Possible causes are usually incorrect cabling or a non-compliant number of hubs in the network. Bad network interface cards (NICs) can also cause late collisions.
- Excessive collisions indicate a problem. Common causes are devices connected as full-duplex on a shared Ethernet, broken NICs, or simply too many stations on the shared medium. The excessive collisions can be resolved by hardcoding speed and duplex.
Use this command to view collisions:
show interfaces
- CRC — a high number of CRCs is usually the result of collisions or a station transmitting bad data.
- frame — shows the number of packets received incorrectly having a CRC error and a noninteger number of octets. On a LAN, this is usually the result of collisions or a malfunctioning Ethernet device.
- collisions — gives the number of messages retransmitted due to an Ethernet collision. This is usually the result of an overextended LAN (Ethernet or transceiver cable too long, more than two repeaters between stations, or too many cascaded multiport transceivers). A packet that collides is counted only once in output packets.
https://www.cisco.com/c/en/us/support/docs/interfaces-modules/port-adapters/12768-eth-collisions.html
Errors
Use this command to view errors:
show interfaces
- Ethernet is up, down or administratively down
- packets input gives the total number of error-free packets received by the system
- bytes input gives the total number of bytes, including data and MAC encapsulation, in the error-free packets received by the system
- input error includes runts, giants, no buffer, CRC, frame, overrun, and ignored counts. Other input-related errors can also cause the input error count to be increased, and some datagrams may have more than one error; therefore, this sum may not balance with the sum of enumerated input error counts.
- frame shows the number of packets received incorrectly having a CRC error and a noninteger number of octets. On a LAN, this is usually the result of collisions or a malfunctioning Ethernet device
- input packets with dribble condition detected gives the dribble bit error, which indicates that a frame is slightly too long. This frame error counter is incremented just for informational purposes; the router accepts the frame
- output errors gives the sum of all errors that prevented the final transmission of datagrams out of the interface being examined. Note that this may not balance with the sum of the enumerated output errors because some datagrams may have more than one error, and others may have errors that do not fall into any of the specifically tabulated categories
- restarts gives the number of times a Type 2 Ethernet controller was restarted because of errors.
https://www.cisco.com/en/US/docs/internetworking/troubleshooting/guide/tr1904.html
Duplex and Speed
- duplex and speed should match on both ends or else you will have problems
- traffic can still pass with mismatched duplex and speed, but you will experience retransmissions and reduced throughput
- to verify duplex and speed run the command
show interface x/x
- If you want to hard code the speed and duplex on a switch that runs Cisco IOS Software (turn off auto-negotiation), issue the speed and duplex commands underneath the specific interface.
- Duplex is subservient to speed in the sense that if speed is set to auto, then the duplex cannot be manually set.
- You might see cyclic redundancy check (CRC) error messages when both the speed and duplex settings are hardcoded on the two devices. This might be because any one of the devices runs an earlier version of Cisco IOS.
- You can upgrade the Cisco IOS or set the speed and duplex to auto on both devices in order to resolve this.
https://www.cisco.com/c/en/us/support/docs/lan-switching/ethernet/10561-3.html
Upon doing a show interface command a lot of valuable information is displayed regarding the packets and errors on that interface.
USS-ASA/pri/act# sh int GigabitEthernet0/1
Interface GigabitEthernet0/1 "inside", is up, line protocol is up
  Hardware is i82546GB rev03, BW 1000 Mbps, DLY 10 usec
        Full-Duplex(Full-duplex), 100 Mbps(100 Mbps)
        Input flow control is unsupported, output flow control is off
        MAC address 442b.442b.442b, MTU 1500
        IP address 172.16.250.26, subnet mask 255.255.255.240
        16433456 packets input, 2581392514 bytes, 0 no buffer
        Received 111 broadcasts, 0 runts, 0 giants
        0 input errors, 0 CRC, 0 frame, 0 overrun, 0 ignored, 0 abort
        0 pause input, 0 resume input
        0 L2 decode drops
        24943232 packets output, 28662026144 bytes, 430 underruns
        0 pause output, 0 resume output
        0 output errors, 0 collisions, 0 interface resets
        0 late collisions, 0 deferred
        0 input reset drops, 0 output reset drops, 0 tx hangs
        input queue (blocks free curr/low): hardware (255/230)
        output queue (blocks free curr/low): hardware (254/0)
  Traffic Statistics for "inside":
        16433456 packets input, 2214576498 bytes
        24943662 packets output, 28202920165 bytes
        28768 packets dropped
      1 minute input rate 178 pkts/sec,  18825 bytes/sec
      1 minute output rate 267 pkts/sec,  306674 bytes/sec
      1 minute drop rate, 0 pkts/sec
      5 minute input rate 255 pkts/sec,  16417 bytes/sec
      5 minute output rate 422 pkts/sec,  548955 bytes/sec
      5 minute drop rate, 0 pkts/sec
Let’s break this down line by line.
General Interface Details
Interface GigabitEthernet0/1 "inside", is up, line protocol is up
Interface number, name, status. The “is up” status can be up or administratively down. The like protocol status is either up (indicating there is a working cable plugged into the interface) or down (indicating the cable is either unplugged or incorrect).
Hardware is i82546GB rev03, BW 1000 Mbps, DLY 10 usec
Hardware is the chip type used in the interface. The valid options here are:
- i82542 – Intel PCI Fiber Gigabit card used on PIX platforms
- i82543 – Intel PCI-X Fiber Gigabit card used on PIX platforms
- i82546GB – Intel PCI-X Copper Gigabit used on ASA platforms
- i82547GI – Intel CSA Copper Gigabit used as backplane on ASA platforms
- i82557 – Intel PCI Copper Fast Ethernet used on ASA platforms
- i82559 – Intel PCI Copper Fast Ethernet used on PIX platforms
- VCS7380 – Vitesse Four Port Gigabit Switch used in SSM-4GE
Displayed on this line is also the maximum bandwidth and delay that can be on this interface.
Full-Duplex(Full-duplex), 100 Mbps(100 Mbps)
Duplex and speed settings. If the line is down, the configured values are displayed. If the line is up the negotiated or actual values will be in parenthesis.
Input flow control is unsupported, output flow control is off
Optional message. Some examples are:
If you do not configure a name, you see the following message: Available but not configured via nameif
If an interface is a member of a redundant interface, you see the following message: Active member of Redundant5
On a multi context firewall, in the system context you might see the following message: Available for allocation to a context
MAC address 442b.442b.442b, MTU 1500
This is the interfaces MAC address and configured MTU. If the interface name is not set the MTU will display “MTU not set”.
IP address 172.16.16.16, subnet mask 255.255.255.240
This is the interfaces IP address and subnet mask.
Input Statistics
16433456 packets input, 2581392514 bytes, 0 no buffer
The number of packets and bytes received on this interface. The “no buffer” indicates the number of failures from block allocations.
Received 111 broadcasts, 0 runts, 0 giants
The number of broadcast packets received.
Runts are the number of packets that are discarded because they are smaller than the minimum packet size, which is 64 bytes. Runts are usually caused by collisions. They might also be caused by poor wiring and electrical interference.
Giants are the number of packets that are discarded because they exceed the maximum packet size. For example, any Ethernet packet that is greater than 1518 bytes is considered a giant.
0 input errors, 0 CRC, 0 frame, 0 overrun, 0 ignored, 0 abort
Input errors are the number of total input errors, including the types listed below. Other input-related errors can also cause the input error count to increase, and some datagrams might have more than one error; therefore, this sum might exceed the number of errors listed for the types below.
CRC errors are the number of Cyclical Redundancy Check errors. When a station sends a frame, it appends a CRC to the end of the frame. This CRC is generated from an algorithm based on the data in the frame. If the frame is altered between the source and destination, the ASA notes that the CRC does not match. A high number of CRCs is usually the result of collisions or a station transmitting bad data.
Frame errors are bad frames that have packets with an incorrect length or bad frame checksums. This error is usually the result of collisions or a malfunctioning Ethernet device.
Overrun errors are the number of times that the ASA was incapable of handing received data to a hardware buffer because the input rate exceeded the ASA capability to handle the data.
Ignored errors are not used. The value is always 0.
Abort errors are not used. The value is always 0.
0 pause input, 0 resume input
Pause input packets are unknown.
Resume input packets are unknown.
0 L2 decode drops
L2 decode drop packets are the number of packets dropped because the name is not configured (nameif command) or a frame with an invalid VLAN id is received.
Output Statistics
24943232 packets output, 28662026144 bytes, 430 underruns
Number of packets and bytes output from this interface.
Undderrun errors are the number of times that the transmitter ran faster than the ASA could handle.
0 pause output, 0 resume output
Pause output packets are unknown.
Resume output packets are unknown.
0 output errors, 0 collisions, 0 interface resets
Output errors are the number of frames not transmitted because the configured maximum number of collisions was exceeded. This counter should only increment during heavy network traffic.
Collisions are the number of messages retransmitted due to an Ethernet collision (single and multiple collisions). This usually occurs on an overextended LAN (Ethernet or transceiver cable too long, more than two repeaters between stations, or too many cascaded multiport transceivers). A packet that collides is counted only once by the output packets.
Interface resets are the number of times an interface has been reset. If an interface is unable to transmit for three seconds, the ASA resets the interface to restart transmission. During this interval, connection state is maintained. An interface reset can also happen when an interface is looped back or shut down
0 late collisions, 0 deferred
Late collisions is when the number of frames that were not transmitted because a collision occurred outside the normal collision window. A late collision is a collision that is detected late in the transmission of the packet. Normally, these should never happen. When two Ethernet hosts try to talk at once, they should collide early in the packet and both back off, or the second host should see that the first one is talking and wait. If you get a late collision, a device is jumping in and trying to send the packet on the Ethernet while the ASA is partly finished sending the packet. The ASA does not resend the packet, because it may have freed the buffers that held the first part of the packet. This is not a real problem because networking protocols are designed to cope with collisions by resending packets. However, late collisions indicate a problem exists in your network. Common problems are large repeated networks and Ethernet networks running beyond the specification.
Deferred packets are the number of frames that were deferred before transmission due to activity on the link.
0 input reset drops, 0 output reset drops, 0 tx hangs
Input reset drops are the number of packets dropped in the RX ring when a reset occurs.
Output reset drops are the number of packets dropped in the TX ring when a reset occurs.
TX hangs is unknown.
input queue (blocks free curr/low): hardware (255/230)
The number of packets in the input queue. Values in the parenthesis are: blocks free currently / the lowest number of blocks free.
output queue (blocks free curr/low): hardware (254/0)
The number of packets in the output queue. Values in the parenthesis are: blocks free currently / the lowest number of blocks free.
Additional Interface Statistics
Traffic Statistics for "inside":
16433456 packets input, 2214576498 bytes
The number of packets and bytes received.
24943662 packets output, 28202920165 bytes
The number of packets and bytes sent.
28768 packets dropped
The number of packets dropped. Typically this counter increments for packets dropped on the accelerated security path (ASP), for example, if a packet is dropped due to an access list deny.
See the ‘show asp drop’ command for reasons for potential drops on an interface.
1 minute input rate 178 pkts/sec, 18825 bytes/sec
1 minute output rate 267 pkts/sec, 306674 bytes/sec
1 minute drop rate, 0 pkts/sec
5 minute input rate 255 pkts/sec, 16417 bytes/sec
5 minute output rate 422 pkts/sec, 548955 bytes/sec
5 minute drop rate, 0 pkts/sec
Various interface bandwidth statistics.
Source: Cisco Documentation
Мышей нет.
Вытащить не могли.
tropa-sw1(config-if)#do sh int gi1/1
GigabitEthernet1/1 is up, line protocol is up (connected)
 Hardware is Gigabit Ethernet, address is e865.4921.7931 (bia e865.4921.7931)
 Description: to_CoreSwitch
 MTU 1500 bytes, BW 1000000 Kbit/sec, DLY 10 usec,
    reliability 255/255, txload 1/255, rxload 1/255
 Encapsulation ARPA, loopback not set
 Keepalive not set
 Full-duplex, 1000Mb/s, link type is auto, media type is 1000BaseLX SFP
 input flow-control is off, output flow-control is unsupported
 ARP type: ARPA, ARP Timeout 04:00:00
 Last input 00:00:02, output 00:00:09, output hang never
 Last clearing of "show interface" counters 19:03:34
 Input queue: 0/75/0/0 (size/max/drops/flushes); Total output drops: 0
 Queueing strategy: fifo
 Output queue: 0/40 (size/max)
 5 minute input rate 190000 bits/sec, 41 packets/sec
 5 minute output rate 123000 bits/sec, 86 packets/sec
    2585799 packets input, 2141082104 bytes, 0 no buffer
    Received 124743 broadcasts (105716 multicasts)
    0 runts, 0 giants, 0 throttles
    4667 input errors, 103 CRC, 0 frame, 0 overrun, 0 ignored
    0 watchdog, 105716 multicast, 0 pause input
    0 input packets with dribble condition detected
    2614772 packets output, 676446631 bytes, 0 underruns
    0 output errors, 0 collisions, 0 interface resets
    0 unknown protocol drops
    0 babbles, 0 late collision, 0 deferred
    0 lost carrier, 0 no carrier, 0 pause output
    0 output buffer failures, 0 output buffers swapped out
tropa-sw1(config-if)#do sh controllers ethernet-controller gi1/1

    Transmit GigabitEthernet1/1              Receive
  2652769635 Bytes                       3593300532 Bytes
  1225779726 Unicast frames               421572824 Unicast frames
      801590 Multicast frames              14550848 Multicast frames
      172147 Broadcast frames               2632100 Broadcast frames
           0 Too old frames               399896758 Unicast bytes
           0 Deferred frames             1070432125 Multicast bytes
           0 MTU exceeded frames          275784981 Broadcast bytes
           0 1 collision frames                   0 Alignment errors
           0 2 collision frames                 882 FCS errors
           0 3 collision frames                   0 Oversize frames
           0 4 collision frames                   0 Undersize frames
           0 5 collision frames                  14 Collision fragments
           0 6 collision frames
           0 7 collision frames              310329 Minimum size frames
           0 8 collision frames            75493020 65 to 127 byte frames
           0 9 collision frames            86368551 128 to 255 byte frames
           0 10 collision frames           17932266 256 to 511 byte frames
           0 11 collision frames           19539493 512 to 1023 byte frames
           0 12 collision frames           12861587 1024 to 1518 byte frames
           0 13 collision frames                  0 Overrun frames
           0 14 collision frames                  0 Pause frames
           0 15 collision frames
           0 Excessive collisions            102530 Symbol error frames
           0 Late collisions                  49271 Invalid frames, too large
           0 VLAN discard frames          226303014 Valid frames, too large
           0 Excess defer frames               1667 Invalid frames, too small
      310117 64 byte frames                       0 Valid frames, too small
   414023659 127 byte frames
   134780155 255 byte frames                      0 Too old frames
    26957263 511 byte frames                      0 Valid oversize frames
    16979313 1023 byte frames                     0 System FCS error frames
    57759976 1518 byte frames                     0 RxPortFifoFull drop frame
   575942980 Too large frames
           0 Good (1 coll) frames
           0 Good (>1 coll) frames
tropa-sw1(config-if)#do sh system mtu

System MTU size is 1500 bytes
System Jumbo MTU size is 1500 bytes
System Alternate MTU size is 1500 bytes
Routing MTU size is 1500 bytes
Изменено 12 августа, 2016 пользователем nawex3