This tutorial was originally posted on SigNoz Blog and is written by Muskan Paliwal
Log analysis is a very powerful feature for an application when it comes to debugging and finding out which flow is working properly in the application and which is not. Log management helps the DevOps team debug and troubleshoot issues faster, making it easier to identify patterns, spot bugs, and ensure they don’t come back to bite you!
In this article, we will discuss log analysis in Docker and how logging in Docker containers is different than in other applications. These logs are specific to Docker and are stored on the Docker host. We’ll thoroughly discuss the docker logs command and how we can configure a logging driver for containers.
Why is Docker logging different?
Life would be much simpler if applications running inside containers always behaved correctly. But unfortunately, as every developer knows, that is never the case.
With other systems, recording application log messages can be done explicitly by writing those messages to the system logger. This is done using syslog() system call from our application. But this doesn’t work for containerized logging; here’s why:
-
Containers are Multi-leveled
Containers are just like boxes inside a big box. No matter how simple the Docker installation is, we’ll have to deal with two levels of aggregation. One level is where you see logs inside the container in your Dockerized application, known as Docker Container Logs.The second level where you see the logs from the host servers (that is, system logs or Docker daemon logs). These are generally located in
/var/log.A log aggregator that has access to the host application can not pull log files from the Dockerized application as if they are the host log files. In these scenarios, we will have to find a way to correlate the logs.
-
Containers are ephemeral
Container-based environments keep changing very often but it doesn’t serve well to the monitor. Docker containers emit logs tostdoutandstderroutput streams.Logs are often stored on the Docker host because containers are stateless (failing to remember or save data from previous actions).
json-fileis the default logging driver which writes JSON-formatted logs to a container-specific file.Thejson-fileis stored in the/var/lib/docker/containers/directory on a Linux Docker host. Here’s how you can access the file:/var/lib/docker/containers/<container id>/<container-id>-json.logIt is dangerous to store logs in a Docker host because Docker doesn’t impose any size limit on log files, and they can build up over time and eat into your disk space. It is advised to store logs in a centralized location and enable log rotation for all the Docker containers.
docker logs command
docker logs command is used to get all the information logged by a running container. The docker service logs command is used to do the same by all the containers participating in a service.
The example below shows JSON logs created by the hello-world Docker image using json-file driver:
{"log":"Hello there!n","stream":"stdout","time":"2022-07-28T22:51:31.549390877Z"}
{"log":"This message shows that everything seems to be working correctly.n","stream":"stdout","time":"2022-07-28T22:51:31.549396749Z"}
Enter fullscreen mode
Exit fullscreen mode
The log follows a pattern of printing:
- Log’s origin
- Either
stdoutorstderr - A timestamp
In order to review a container’s logs from the command line, you can use the docker logs <container-id> command. Using this command, the logs shown above are displayed this way:
Hello there!
This message shows that everything seems to be working correctly.
Enter fullscreen mode
Exit fullscreen mode
Here are a few options in the command that you can use to modify the output of your log:
docker logs [OPTIONS] <container-id>
Enter fullscreen mode
Exit fullscreen mode
-
Using
-for--followoption, if you want to follow the logs:docker logs <container_id> --follow -
If you want to see the last
Nlog lines:docker logs <container-id> --tail N -
If you want to see the specific logs, use the
grepcommand:docker logs <container_id> | grep pattern -
If you want to show errors:
docker logs <container_id> | grep -i error
Once an application starts growing, you tend to start using Docker Compose. docker-compose logs command shows logs from all the services running in the containerized application.
Note that the offering from the
docker logscommand may vary based on the Docker version you are using. In case of Docker Community,docker logscan only read logs created by thejson-file, local, andjournalddrivers whereas in case of Docker Enterprise,docker logscan read logs created by any logging driver.
Configure a Docker container to use a logging driver
Step1: Configure the Docker daemon to a logging driver
Set the value of the log-driver key to the name of the logging driver in the daemon.json configuration file. Then restart Docker for the changes to take effect for all the newly created containers. All the existing containers will remain as they are.
Let’s set up a default driver with some additional information:
{
  "log-driver": "json-file",
  "log-opts": {
    "max-size": "20m",
    "max-file": "10",
  }
}
Enter fullscreen mode
Exit fullscreen mode
To find the current logging driver for the Docker daemon:
$ docker info --format '{{.LoggingDriver}}'

json-file
Enter fullscreen mode
Exit fullscreen mode
In order to use a different driver, you can override the default by adding the --log-driver option to the docker run command that creates a container.
For example, the following command creates an Apache httpd container, overriding the default logging driver to use the journald driver instead.
docker run --log-driver journald httpd
Enter fullscreen mode
Exit fullscreen mode
Step 2: Deciding the delivery mode of log messages from container to log driver
Docker provides two types of delivery modes for log messages.
-
Blocking(default mode)
As the name suggests, this mode blocks the main process inside a container to deliver log messages. And this will add latency to the performance of the application. But, it ensures that all the log messages will be successfully delivered to the log driver.The default log driver (
json-files) logs messages very quickly since it writes to the local file system. Therefore it’s unlikely to cause latency. But drivers likegcplogsandawslogsopen a connection to a remote server and are more likely to block and cause latency. -
Non-blocking
In this mode, the container writes logs to an in-memory ring buffer. This in-memory ring buffer works like a mediator between logging-driver and the container. When the logging-driver isn’t busy processing the logs, the container shares the logs to the driver immediately. But when the driver is busy, these logs are put into the ring-buffer.This provides you a safety check that a high volume of logging activity won’t affect the application’s performance running inside the container. But there is a downside. It doesn’t guarantee that all the log messages will be delivered to the logging driver. In cases where log broadcasts are faster than the driver processor, the ring buffer will soon run out of space. As a result, buffered logs are deleted to make space for the next set of incoming logs. The default value for
max-buffer-sizeis 1 MB.To change the mode:
# /etc/docker/daemon.json
{
    "log-driver": "json-file",
    "log-opts": {
        "max-size": "20m",
            "max-file": "10",
        "mode": "non-blocking"
    }
}
Alternatively, you can set the non-blocking mode on an individual container by using the
--log-optoption in the command that creates the container:docker run --log-opt mode=non-blocking alpine echo hello world
The default log driver stores data in a local file, but if you want more features, then you can opt for other log drivers as well, such as logagent, syslog, journald, elf, awslogs, etc.
Logging strategies
Docker logging means logging events of the dockerized application, host OS and the docker service. There are various ways to log events for a docker container.
Some of them are:
-
Application logging: In this strategy, the application inside the container can have its own logging framework. The logs can either be stored locally or sent to a centralized location using a log management tool.
-
Data volumes: Because containers are stateless, and to avoid losing logs data, you can bind the container’s directory to the host OS directory. Containers can now be terminated or shut down, and access logs from multiple containers. You can run a regular backup in order to prevent data corruption or loss in case of failure.
-
Docker logging driver: This type has already been discussed in detail. The configured driver reads the data broadcast by the container’s
stdoutorstderrstreams and writes it to a file on the host machine. You can then send this log data anywhere you want to.
Final Thoughts
Containerization surely provides an easy way to deal with application portability and scalability issues but it does requires maintenance time to time. Container environments are just like a box inside a box, with multiple layers of abstraction. So, it becomes hard to debug in such environments and if performed correctly, log-analysis can be your go-to friend to find out performance related issues.
In this guide, you learned how to configure the Docker logging driver for log analysis in containerized applications, how Docker logging is different from application logging hosted on a physical machine or virtual host, and in detail study of the docker logs command.
There are various logging strategies that you can follow for log analysis. This blog thoroughly discussed the default logging strategy — json-file and the two delivery modes of log messages. Containers being stateless, doesn’t ensure data persistence, hence to prevent data loss, you can use various log management tools.
But logs are just one aspect of getting insights from your software systems. Modern applications are complex distributed systems. For debugging performance issues, you need to make your systems observable. Logs, when combined with metrics and traces form an observability dataset that can help you debug performance issues quickly.
SigNoz, an open source APM can help you monitor your application by collecting all types of telemetry data. It correlates all your telemetry data(logs, metrics, and traces) into a single suite of monitoring. It is built to support OpenTelemetry natively. OpenTelemetry is becoming the world standard for instrumenting cloud-native applications.
You can check out SigNoz GitHub repo:
If you want to read more about SigNoz, check out the following blog:
SigNoz — an open source alternative to DataDog
Introduction to Docker Logging
Docker Logging helps to troubleshoot errors related to Docker. It is a mechanism to debug the issues if occured in our Docker environment. For example, if Docker daemon or any container running on Docker is not starting up properly then we need to check the logs to know what is causing the issue. Docker has two levels of logging one is at the Docker daemon level and another one is at the container level.
How does Logging work in Docker?
Docker has multiple mechanisms to log information from running containers and services. We say these mechanism logging drivers. There is a default logging driver, already configured for each Docker daemon that is used by containers if we do not configure it to use any different driver. There are also logging driver plugins other than built-in logging drivers that we can implement to extend and customize Docker’s logging capabilities.
We need to update the ‘daemon.json’ file to explicitly configure the default logging driver to any other logging driver, the ‘daemon.json’ file is located in /etc/docker/ on Linux hosts or c:programdatadockerconfig on windows server hosts. We can set options in the daemon.json file as json object with the key ‘log-opts’ if logging driver allows doing so. We use the ‘docker log’ command to check the logs generated by any container.
1. Docker logging at daemon level
Daemon level docker logging is used to fix issues and errors that are generated by Docker daemon itself.
There are four levels of logging available at the daemon level.
- Debug: It provides each and every possible information generated by the Docker daemon process.
- Info: It provides all types of information and errors generated by the Docker daemon process.
- Error: It provides all the errors generated by the daemon process.
- Fatal: It only provides details about all the fatal errors generated by the deamon process.
We can enable Docker daemon logging by command or editing the ‘daemon.json’ file. We need to stop the Docker process in either case.
Let’s do it by the command first. So first we need to stop the Docker daemon process using the below command:
sudo service docker stop
Or
sudo systemctl stop docker
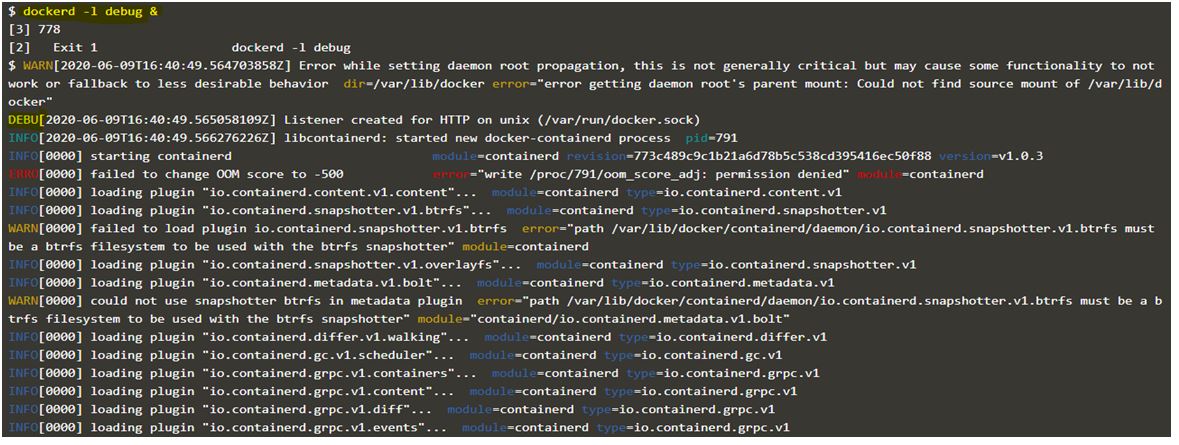
Then we need to start the Docker daemon process with the option ‘-l’ and specify the level of the logging. For example, debug, info, etc.
Code:
dockerd -l debug &
Output:
Code:
dockerd -l info &
Output:
Explanation:
In the above two snapshots, we can see when we specified the ‘debug’ option, we got all the information including debug information however when we specified the ‘info’ option, there is no ‘debug’ log in it, only error, warning, and info.
We can also edit the daemon.json file located at /etc/docker to change the default daemon logging level.
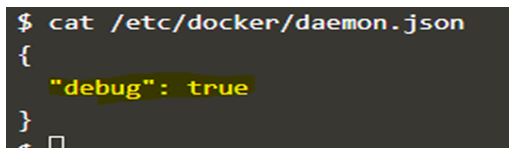
We add “debug”: true in the daemon.json file as shown below and start the Docker daemon process.
Code:
cat /etc/docker/daemon.json
Output:
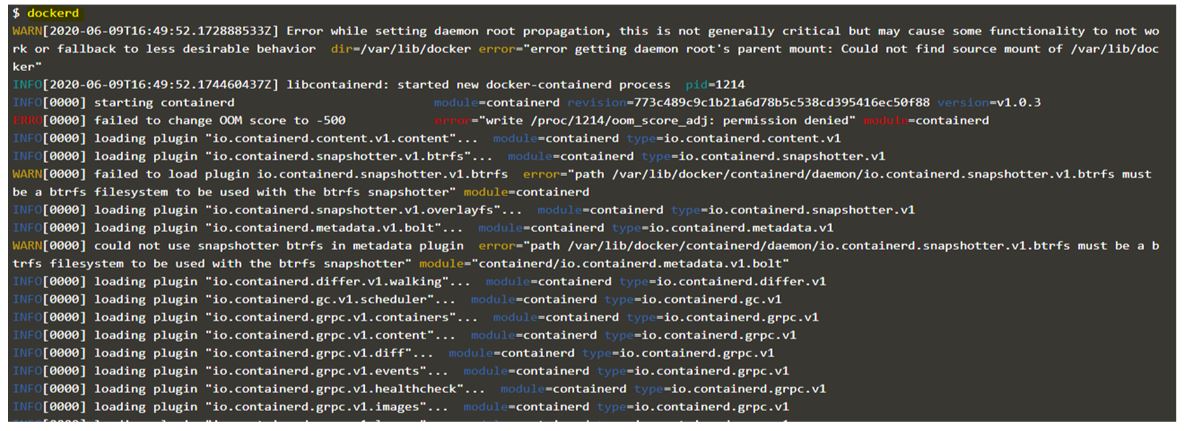
Below is the snapshot before enabling debug level daemon logging and the default logging level is set to ‘info’ as there is debug log showing in the below snapshot.
Code:
dockerd
Output:
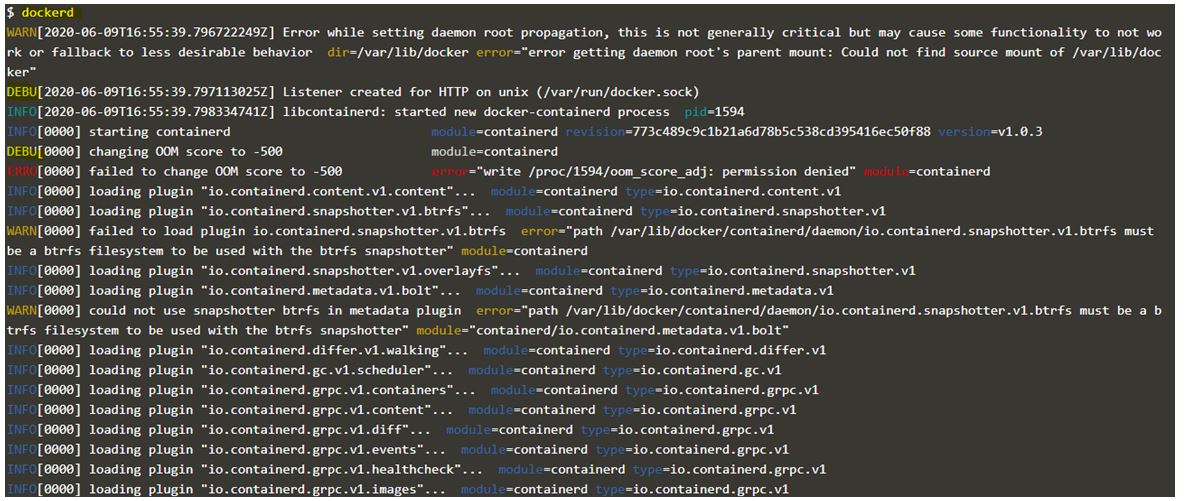
And below is the snapshot after enabling the debug level daemon logging by editing the ‘daemon.json’ file and there is debug log in the snapshot however we are using the same command as above again.
Code:
dockerd
Output:
2. Docker logging at container level
Container level Docker logging is used to debug errors and issues related to containers or services. For example, getting an error while starting a container or container continuously crashing or stuck in loopback, etc. The default logging driver for container level logging is ‘json-file’. We can again configure the ‘daemon.json’ file to change the default setting. We can set the value of ‘log-driver’ to the name of the logging driver and also specify the log options using the ‘log-opts’ key if different logging options are available for that driver.
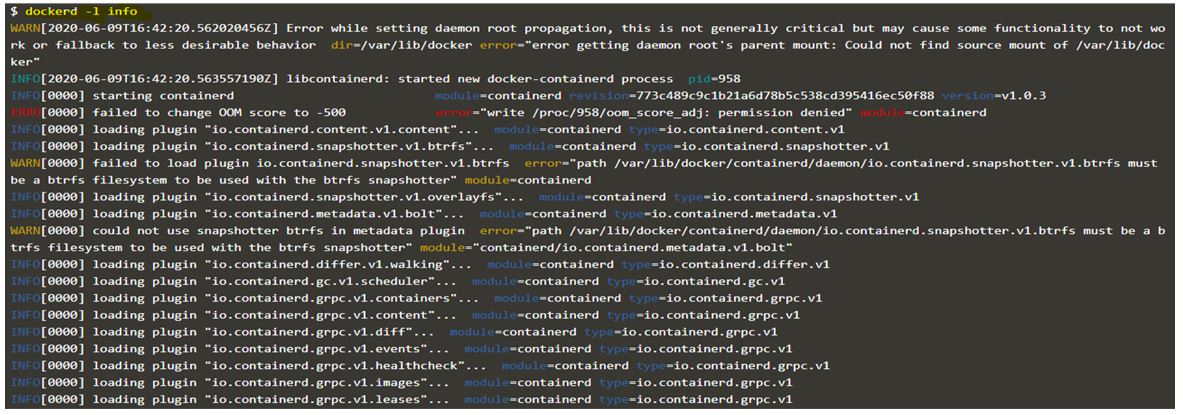
We use the ‘docker info’ command to know the default logging driver for containers as below.
Code:
docker info
Output:
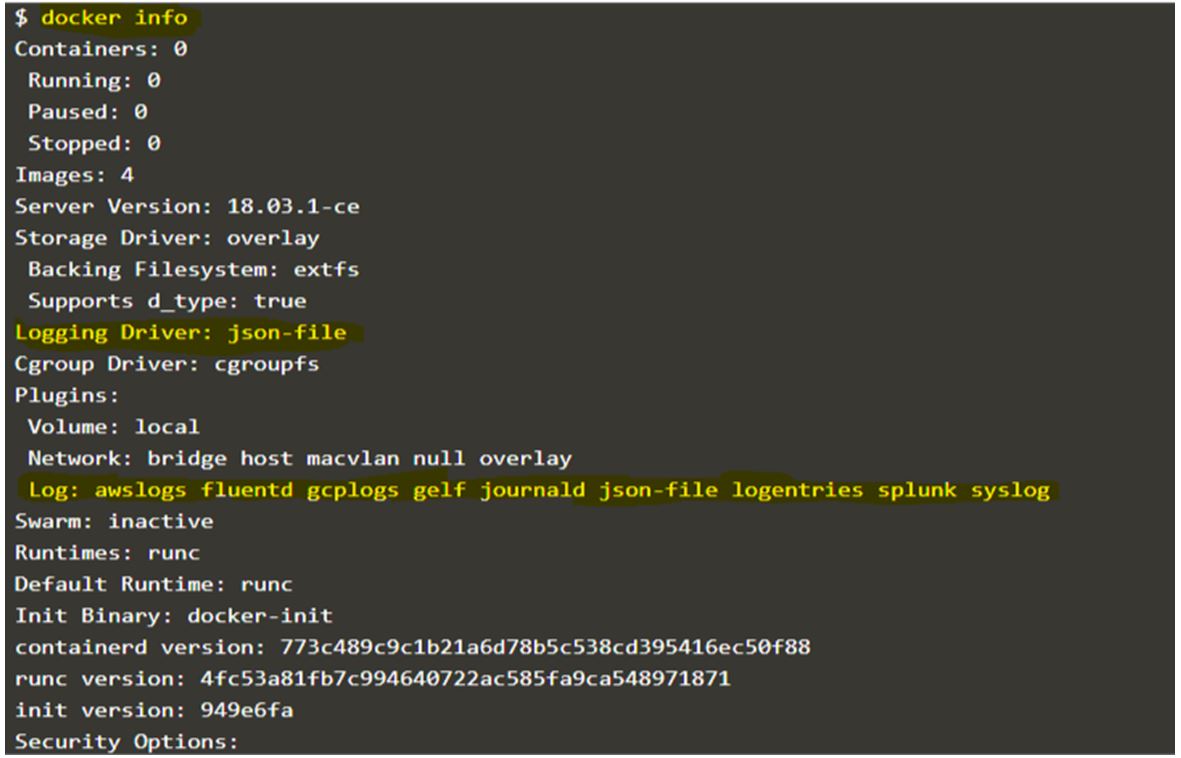
Explanation:
In the above snapshot, we see that ‘json-file’ is set as the default logging driver. It also gives details about plugins as well such as awslogs, fuentd, syslog, etc.
Let’s change the default logging driver to ‘syslog’ and set some log options as well in the ‘daemon.json’ file.
Code:
sudo cat /etc/docker/daemon.json
Output:
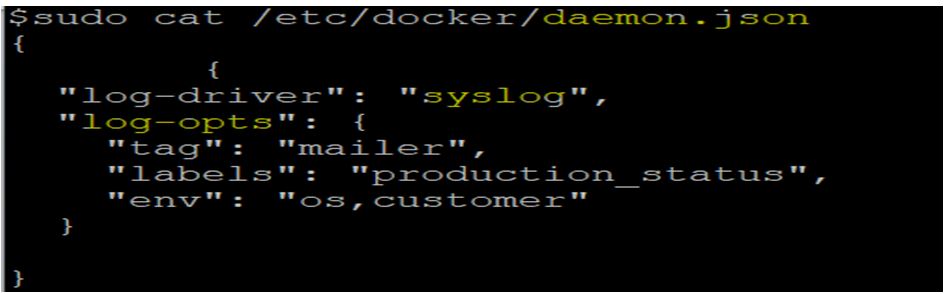
Explanation:
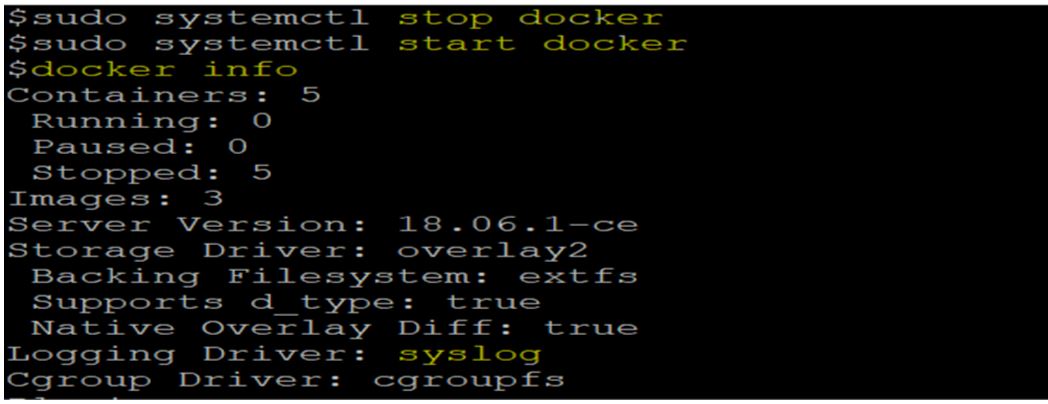
In the above example, the default logging driver has been set to ‘syslog’ with options like tag, labels, and env that is self-explanatory. We need to restart the docker to apply these changes. First stopped the docker daemon and then started it again. If we check now using the ‘docker info’ command, we can see the default logging driver has been changed to ‘syslog’.
Code:
sudo systemctl stop docker

sudo systemctl start docker

docker info
Output:
We can also configure the logging driver per container. We can do this by passing the ‘–log-driver’ flag while starting the container. It bypasses the default logging driver configured in the ‘daemon.json’ file.
Example:
Code:
docker run -d --log-driver syslog alpine
Output:
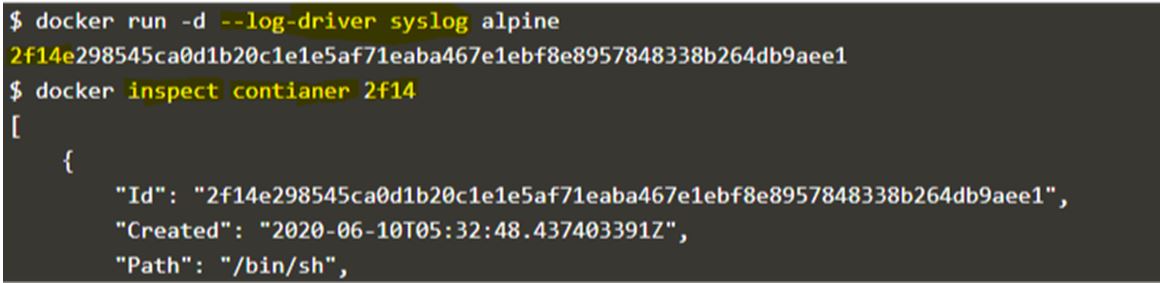
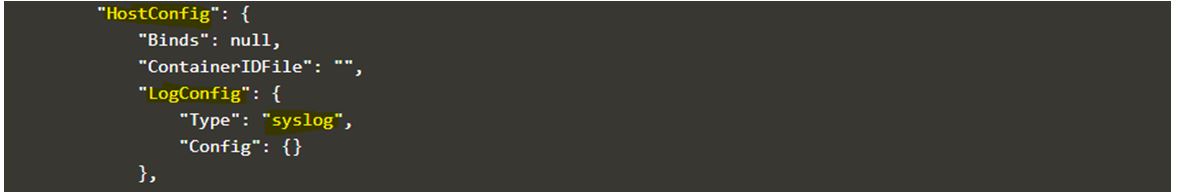
Explanation:
In the above example, started an alpine container and configured the container to use ‘syslog’ as the logging driver. If we want to check which logging driver is used by a container, we inspect the container as shown in the snapshot and scroll down and find the “HostConfig” key and look for the “LogConfig” type and here, it is ‘syslog’.
We can check the logs generated by the containers using ‘docker log’.
Syntax:
docker log <container_id or container_name>
Example:
Code:
docker run -d mysql

docker log 4b0ee
Output:
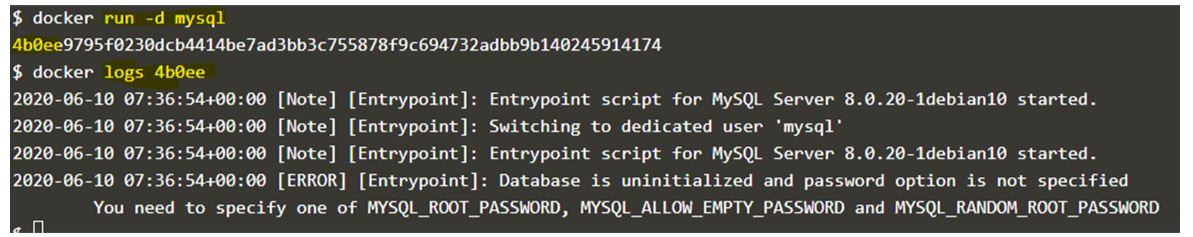
Explanation:
In the above snapshot, a container has been created with default logging driver and if we check the logs of the container it shows us errors and now we can understand why the container failed to start as it requires any one of the variable to be passed while running this container. So logging helps to troubleshoot the issues.
Conclusion
Docker logging is very useful and necessary to understand what is happening behind the scene. If we use different logging driver we need tools to read those logs as Docker logs cannot read logs generated by all other logging drivers. There are other plugins available however we need to configure those properly in the ‘daemon.json’ file and we can get the available options from the official website of those plugin providers.
Recommended Articles
This is a guide to Docker Logging. Here we discuss the introduction to Docker Logging and how does logging work with detailed explanation. You may also have a look at the following articles to learn more –
- Docker Essentials
- Docker Swarm Architecture
- What is Docker in Linux?
- Docker Alternatives
Логи в докере нужны в первую очередь для траблшутинга тех или иных проблем которые возникают у вас в ходе работы с контейнером.
Надеюсь что у вас уже имеется докер на хостевой машине, если нет, вот полезные статьи:
Установка Docker на Debian/Ubuntu
Установка Docker на CentOS/RedHat/Fedora
Установка docker-compose в Unix/Linux
Запуск docker контейнеров в Unix/Linux
Установка docker machine в Unix/Linux
Настройка docker swarm кластера в Unix/Linux
Запуск GUI-приложения в Docker
Запустить bash/SSH в контейнере с Docker
Создание base image для docker в Unix/Linux
Создание docker контейнера в Unix/Linux
Остановить/Удалить все Docker контейнеры/images
Работа с сетью (Networking) в Docker
Работа с томами (Volumes) в Docker
И так, приступим.
Работа с логами (Logs) в Docker
-=== СПОСОБ 1 ===-
Стандартное использование будет следующим:
$ docker logs $(docker ps -aql)

Version:    v0.4.9
Git commit: c4de4ad0
OS/Arch:    linux/amd64
Built:      Wed Aug 29 12:32:14 2018
time="2018-10-31T10:58:45Z" level=info msg="Controller ready"
Или если задали контейнер_нейм:
$ docker logs vault
-=== СПОСОБ 2 ===-
Логи монтируются на хостевую машину, по этому гегко понять где лежат логи:
$ docker inspect vault | grep -E "LogPath"
        "LogPath": "/var/lib/docker/containers/4e65e9b0f1412af155e30d0c50c52933d989c08346d9405e75c5945b53182b3b/4e65e9b0f1412af155e30d0c50c52933d989c08346d9405e75c5945b53182b3b-json.log",
И после чего, выполняем:
$ cat /var/lib/docker/containers/4e65e9b0f1412af155e30d0c50c52933d989c08346d9405e75c5945b53182b3b/4e65e9b0f1412af155e30d0c50c52933d989c08346d9405e75c5945b53182b3b-json.log
-=== СПОСОБ 3 ===-
Иногда бывает так, что приложенько не умеет выводить логи. Рассмотрим наглядный пример. Запустим контейнер:#
$ docker run -d -P myhttpd:latest
791c65b5aed05a11a40a953779675b5b94d090e691730c5c0bceaa33143fcbc4
Пробуем поулчить логи:
$ docker logs $(docker ps -lq)
AH00558: httpd: Could not reliably determine the server's fully qualified domain name, using 172.17.0.17. Set the 'ServerName' directive globally to suppress this message
Как видно с вывода, докер не может считать логи с контейнера. Первое что приходит в голову, — это не рабочий контейнер, да? Но пробуем получить данные:
$ curl localhost:$(docker port $(docker ps -lq) | cut -d: -f2)
my httpd container
Этим самым, видно что контейнер работает, но все еще не может отдавать логи.
Делов в том, что логи для Nginx лежат:
$ docker run nginx ls -l /var/log/nginx
total 0
lrwxrwxrwx 1 root root 11 Oct 2 19:20   access.log  -> /dev/stdout
lrwxrwxrwx 1 root root 11 Oct 2 19:20   error.log -> /dev/stderr
Для Apache лежат вот тут:
# docker run httpd cat conf/httpd.conf | egrep '^ *(Error|Custom)Log'
ErrorLog /proc/self/fd/2
   CustomLog /proc/self/fd/1 common
Пофиксим это дело следующим образом, в докерфайл (нужно дописатьпереопределить вывод):
FROM centos
LABEL maintainer="Vitaliy Natarov"
RUN yum install -y httpd web-assets-httpd && yum clean all
RUN echo "logs are sending to stdout" > /var/www/html/index.html

RUN ln -s /dev/stdout /var/log/httpd/access_log &&
    ln -s /dev/stderr /var/log/httpd/error_log

EXPOSE 80
CMD httpd -DFOREGROUND
Билдаем образ:
$ docker build -t myhttpd:2.0 .
Запускаем контейнер:
$ docker run -d -P myhttpd:2.0
1b0c3a82d0687519ffcd2ee06d345a4d3ad8d475dc0d7710fb279bdd836e5e88
Проверим:
$ docker logs $(docker ps -lq)

AH00558: httpd: Could not reliably determine the server's fully qualified domain name, using 172.17.0.17. Set the 'ServerName' directive globally to suppress this message
Дернем курл:
$ curl localhost:$(docker port $(docker ps -lq) | cut -d: -f2)
logs are sending to stdout
И прверим что пишется в лог:
$ docker logs $(docker ps -lq)
AH00558: httpd: Could not reliably determine the server's fully qualified domain name, using
172.17.0.18. Set the 'ServerName' directive globally to suppress this message
172.17.0.1 - - [29/Jul/2018:22:07:24 +0000] "GET / HTTP/1.1" 200 19 "-" "curl/7.29.0"
Ага! То что нужно было! Вот такой вот юзкейс.
Настройка Log Driver
Запустим контейнер с заданным именем и лог-драйвером, например:
$ docker run -d -P --name=myhttpd --log-driver=journald myhttpd:2.0
5748f3078b647c43a335bdc1f8bc7c8d9db31a491e635effd58b31b1429c8ee7
Проверим что вышло:
$ curl localhost:$(docker port $(docker ps -lq) | cut -d: -f2)
logs are sending to stdout
Получите log-и контейнера через journald ( с указанием CONTAINER_NAME), например:
# journalctl -b CONTAINER_NAME=myhttpd
-- Logs begin at Sat 2018-07-28 19:14:07 BST, end at Sun 2018-07-29 23:19:52 BST. --
Jul 29 23:19:29 localhost.localdomain 5748f3078b64[2806]: AH00558: httpd: Could not reliably determine the server's fully qualified domain name, using 172.17.
Jul 29 23:19:50 localhost.localdomain 5748f3078b64[2806]: 172.17.0.1 - - [29/Jul/2018:22:19:50 +0000] "GET / HTTP/1.1" 200 19 "-" "curl/7.29.0"
Запускаем кнтейнер с log-driver-ом и log-tag-ом:
$ docker run -d -P --log-driver=journald
--log-opt tag=myhttpd
myhttpd:latest
0555d7a41ab6af098dfea296e2fa7b4f1c6b73424e2156c387930b13bfcefb24
Чекаем:
$ curl localhost:$(docker port $(docker ps -lq) | cut -d: -f2)
   logs are sending to stdout
С такой командой, теперь можно получить логи через указанный тег:
$ journalctl -b CONTAINER_TAG=myhttpd
Поддерживаемые Log Driver-ы:
- none — Логи не доступны для контейнера, и логи самого докера не возвращают никакого вывода.
- json-file- Log-и отформатированы как JSON. Данный драйвер используется по умолчанию в Docker.
- syslog — Записывает логи в syslog. Демон syslog должен быть запущен на самом хосте.
- journald — Записывает логи в journald. Демон journald должен быть запущен на самом хосте.
- gelf — Записывает сообщения в Graylog (GELF) или Logstash.
- fluentd — Записывает сообщения на fluentd (forward input). Демон fluentd должен быть запущен на самом хосте.
- awslogs- Записывает сообщения в Amazon CloudWatch.
- splunk — Записывает сообщения в splunk с помощью сборщика HTTP событий (HTTP Event Collector).
- gcplogs — Записывает сообщения в Google Cloud Platform (GCP).
- logentries — Записывает сообщения в Rapid7 Logentries.
Проверим что используется поумолчанию:
$ docker info --format '{{.LoggingDriver}}'
json-file
Меняем на нужный:
# cat << EOF > /etc/docker/daemon.json {
"log-driver": "journald" }
EOF
Перезапустим сервисы:
# systemctl daemon-reload && systemctl restart docker.service
Проверяем, изменилось ли у нас что-то:
$ docker info --format '{{.LoggingDriver}}'
journald
Можно запустить контейнер:
$ docker run -d -P --name=myweb --log-opt tag=myweb_tag myhttpd:2.0
Проверим логи одним из способов:
$ journalctl -b CONTAINER_NAME=myweb
$ journalctl -b CONTAINER_TAG=myweb_tag
Вот и все, статья «Работа с логами (Logs) в Docker» завершена.
When building containerized applications, logging is definitely one of the most important things to get right from a DevOps standpoint. Log management helps DevOps teams debug and troubleshoot issues faster, making it easier to identify patterns, spot bugs, and make sure they don’t come back to bite you!
In this article, we’ll refer to Docker logging in terms of container logging, meaning logs that are generated by containers. These logs are specific to Docker and are stored on the Docker host. Later on, we’ll check out Docker daemon logs as well. These are the logs that are generated by Docker itself. You will need those to debug errors in the Docker engine.
Docker Logging: Why Are Logs Important When Using Docker
The importance of logging applies to a much larger extent to Dockerized applications. When an application in a Docker container emits logs, they are sent to the application’s stdout and stderr output streams.
The container’s logging driver can access these streams and send the logs to a file, a log collector running on the host, or a log management service endpoint.
By default, Docker uses a json-file driver, which writes JSON-formatted logs to a container-specific file on the host where the container is running. More about this in the section below called “What’s a Logging Driver?”
The example below shows JSON logs created using the json-file driver:
{"log":"Hello World!n","stream":"stdout","time":"2020-03-29T22:51:31.549390877Z"}
If that wasn’t complicated enough, you have to deal with Docker daemon logs and host logs apart from container logs. All of them are vital in troubleshooting errors and issues when using Docker.
We know how challenging handling Docker logs can be. Check out Top 10 Docker Logging Gotchas to see some of the best practices we discovered along the years.
Before moving on, let’s go over the basics.
What Is a Docker Container
A container is a unit of software that packages an application, making it easy to deploy and manage no matter the host. Say goodbye to the infamous “it works on my machine” statement!
How? Containers are isolated and stateless, which enables them to behave the same regardless of the differences in infrastructure. A Docker container is a runtime instance of an image that’s like a template for creating the environment you want.
What Is a Docker Image?
A Docker image is an executable package that includes everything that the application needs to run. This includes code, libraries, configuration files, and environment variables.
Why Do You Need Containers?
Containers allow breaking down applications into microservices — multiple small parts of the app that can interact with each other via functional APIs. Each microservice is responsible for a single feature so development teams can work on different parts of the application at the same time. That makes building an application easier and faster.
Popular Docker Logging Topics
How Is Docker Logging Different
Most conventional log analysis methods don’t work on containerized logging — troubleshooting becomes more complex compared to traditional hardware-centric apps that run on a single node and need less troubleshooting. You need more data to work with so you must extend your search to get to the root of the problem.
Here’s why:
Containers are Ephemeral
Docker containers emit logs to the stdout and stderr output streams. Because containers are stateless, the logs are stored on the Docker host in JSON files by default. Why?
The default logging driver is json-file. The logs are then annotated with the log origin, either stdout or stderr, and a timestamp. Each log file contains information about only one container.
You can find these JSON log files in the /var/lib/docker/containers/ directory on a Linux Docker host. Here’s how you can access them:
/var/lib/docker/containers/<container id>/<container id>-json.log
That’s where logging comes into play. You can collect the logs with a log aggregator and store them in a place where they’ll be available forever. It’s dangerous to keep logs on the Docker host because they can build up over time and eat into your disk space. That’s why you should use a central location for your logs and enable log rotation for your Docker containers.
Containers are Multi-Tiered
This is one of the biggest challenges to Docker logging. However basic your Docker installation is, you will have to work with two levels of aggregation. One refers to the logs from the Dockerized application inside the container. The other involves the logs from the host servers, which consist of the system logs, as well as the Docker Daemon logs which are usually located in /var/log or a subdirectory within this directory.
A simple log aggregator that has access to the host can’t just pull application log files as if they were host log files. Instead, it must be able to access the file system inside the container to collect the logs. Furthermore, your infrastructure will, inevitably, extend to more containers and you’ll need to find a way to correlate log events to processes rather than their respective containers.
Docker Logging Strategies and Best Practices
Needless to say, logging in Docker could be challenging. But there are a few best practices to have in mind when working with containerized apps.
Logging via Application
This technique means that the application inside the containers handles its own logging using a logging framework. For example, a Java app could use a Log4j2 to format and send the logs from the app to a remote centralized location skipping both Docker and the OS.
On the plus side, this approach gives developers the most control over the logging event. However, it creates extra load on the application process. If the logging framework is limited to the container itself, considering the transient nature of containers, any logs stored in the container’s filesystem will be wiped out if the container is terminated or shut down.
To keep your data, you’ll have to either configure persistent storage or forward logs to a remote destination like a log management solution such as Elastic Stack or Sematext Cloud. Furthermore, application-based logging becomes difficult when deploying multiple identical containers, since you would need to find a way to tell which log belongs to which container.
Logging Using Data Volumes
As we’ve mentioned above, one way to work around containers being stateless when logging is to use data volumes.
With this approach you create a directory inside your container that links to a directory on the host machine where long-term or commonly-shared data will be stored regardless of what happens to your container. Now, you can make copies, perform backups, and access logs from other containers.
You can also share volume across multiple containers. But on the downside, using data volumes make it difficult to move the containers to different hosts without any loss of data.
Logging Using the Docker Logging Driver
Another option to logging when working with Docker, is to use logging drivers. Unlike data volumes, the Docker logging driver reads data directly from the container’s stdout and stderr output. The default configuration writes logs to a file on the host machine, but changing the logging driver will allow you to forward events to syslog, gelf, journald, and other endpoints.
Since containers will no longer need to write to and read from log files, you’ll likely notice improvements in terms of performance. However, there are a few disadvantages of using this approach as well: Docker log commands work only with the json-file log driver; the log driver has limited functionality, allowing only log shipping without parsing; and containers shut down when the TCP server becomes unreachable.
Logging Using a Dedicated Logging Container
Another solution is to have a container dedicated solely to logging and collecting logs, which makes it a better fit for the microservices architecture. The main advantage of this approach is that it doesn’t depend on a host machine. Instead, the dedicated logging container allows you to manage log files within the Docker environment. It will automatically aggregate logs from other containers, monitor, analyze, and store or forward them to a central location.
This logging approach makes it easier to move containers between hosts and scale your logging infrastructure by simply adding new logging containers. At the same time, it enables you to collect logs through various streams of log events, Docker API data, and stats.
This is the approach we suggest you should use. You can set up Logagent as a dedicated logging container and have all Docker logs ship to Sematext Logs in under a few minutes as explained a bit further down.
Logging Using the Sidecar Approach
For larger and more complex deployments, using a sidecar is among the most popular approaches to logging microservices architectures.
Similarly to the dedicated container solution, it uses logging containers. The difference is that this time, each application container has its own dedicated container, allowing you to customize each app’s logging solution. The first container saves log files to a volume which are then tagged and shipped by the logging container to a third-party log management solution.
One of the main advantages of using sidecars is that it allows you to set up additional custom tags to each log, making it easier for you to identify their origin.
There are some drawbacks, however — it can be complex and difficult to set up and scale, and it can require more resources than the dedicated logging method. You must ensure that both application container and sidecar container are working as a single unit, otherwise, you might end up losing data.
Get Started with Docker Container Logs
When you’re using Docker, you work with two different types of logs: daemon logs and container logs.
What Are Docker Container Logs?
Docker container logs are generated by the Docker containers. They need to be collected directly from the containers. Any messages that a container sends to stdout or stderr is logged then passed on to a logging driver that forwards them to a remote destination of your choosing.
Here are a few basic Docker commands to help you get started with Docker logs and metrics:
- Show container logs:
docker logs containerName - Show only new logs:
docker logs -f containerName - Show CPU and memory usage:
docker stats - Show CPU and memory usage for specific containers:
docker stats containerName1 containerName2 - Show running processes in a container:
docker top containerName - Show Docker events:
docker events - Show storage usage:
docker system df
Watching logs in the console is nice for development and debugging, however in production you want to store the logs in a central location for search, analysis, troubleshooting and alerting.
What Is a Logging Driver?
Logging drivers are Docker’s mechanisms for gathering data from running containers and services to make it available for analysis. Whenever a new container is created, Docker automatically provides the json-file log driver if no other log driver option has been specified. At the same time, it allows you to implement and use logging driver plugins if you would like to integrate other logging tools.
Here’s an example of how to run a container with a custom logging driver, in this case syslog:
docker run -–log-driver syslog –-log-opt syslog-address=udp://syslog-server:514
alpine echo hello world
How to Configure the Docker Logging Driver?
When it comes to configuring the logging driver, you have two options:
- setup a default logging driver for all containers
- specify a logging driver for each container
In the first case, the default logging driver is a JSON file, but, as mentioned above, you have many other options such as logagent, syslog, fluentd, journald, splunk, etc. You can switch to another logging driver by editing the Docker configuration file and changing the log-driver parameter, or using your preferred log shipper.
# /etc/docker/daemon.json
{
  "log-driver": "journald"
}

systemctl restart docker
Alternatively, you can choose to configure a logging driver on a per-container basis. As Docker provides a default logging driver when you start a new container, you need to specify the new driver from the very beginning by using the -log-driver and -log-opt parameters.
docker run -–log-driver syslog –-log-opt syslog-address=udp://syslog-server:514
alpine echo hello world
Where Are Docker Logs Stored By Default?
The logging driver enables you to choose how and where to ship your data. The default logging driver as I mentioned above is a JSON file located on the local disk of your Docker host:
/var/lib/docker/containers/[container-id]/[container-id]-json.log.
Have in mind, though, that when you use another logging driver than json-file or journald you will not find any log files on your disk. Docker will send the logs over the network without storing any local copies. This is risky if you ever have to deal with network issues.
In some cases Docker might even stop your container, when the logging driver fails to ship the logs. This issue might happen depending on what delivery mode you are using.
Learn more about where Docker logs are stored from our post about Docker logs location.
Where Are Delivery Modes?
Docker containers can write logs by using either the blocking or non-blocking delivery mode. The mode you choose will determine how the container prioritizes logging operations relative to its other tasks.
Direct/Blocking
Blocking is Docker’s default mode. It will interrupt the application each time it needs to deliver a message to the driver.
It makes sure all messages are sent to the driver, but can introduce latency in the performance of your application. if the logging driver is busy, the container delays the application’s other tasks until it has delivered the message.
Depending on the logging driver you use, the latency differs. The default json-file driver writes logs very quickly since it writes to the local filesystem, so it’s unlikely to block and cause latency. However, log drivers that need to open a connection to a remote server can block for longer periods and cause noticeable latency.
That’s why we suggest you use the json-file driver and blocking mode with a dedicated logging container to get the most of your log management setup. Luckily it’s the default log driver setup, so you don’t need to configure anything in the /etc/docker/daemon.json file.
Non-blocking
In non-blocking mode, a container first writes its logs to an in-memory ring buffer, where they’re stored until the logging driver is available to process them. Even if the driver is busy, the container can immediately hand off application output to the ring buffer and resume executing the application. This ensures that a high volume of logging activity won’t affect the performance of the application running in the container.
When running in non-blocking mode, the container writes logs to an in-memory ring buffer. The logs are stored in the ring-buffer until it’s full. Only then is the log shipped. Even if the driver is unavailable, the container sends logs to the ring buffer and continues executing the application. This ensures high volume of logging without impacting performance. But there are downsides.
Non-blocking mode does not guarantee that the logging driver will log all the events. If the buffer runs out of space, buffered logs will be deleted before they are sent. You can use the max-buffer-size option to set the amount of RAM used by the ring buffer. The default value for max-buffer-size is 1 MB, but if you have more RAM available, increasing the buffer size can increase the reliability of your container’s logging.
Although blocking mode is Docker’s default for new containers, you can set this to non-blocking mode by adding a log-opts item to Docker’s daemon.json file.
# /etc/docker/daemon.json
{
        "log-driver": "json-file",
        "log-opts": {
                "mode": "non-blocking"
        }
}
Alternatively, you can set non-blocking mode on an individual container by using the --log-opt option in the command that creates the container:
docker run --log-opt mode=non-blocking alpine echo hello world
Logging Driver Options
The log file format for the json-file logging driver is machine readable JSON format with a timestamp, stream name and the log message. Therefore users prefer the docker logs command to see the logs on their console.
On the other hand the machine readable log format is a good base for log shippers to ship the logs to log management platforms, where you can search, visualise and alert on log data.
However, you have other log driver options as follows:
- logagent: A general purpose log shipper. The Logagent Docker image is pre-configured for log collection on container platforms. Logagent collects not only logs, it also adds meta-data such as image name, container id, container name, Swarm service or Kubernetes meta-data to all logs. Plus it handles multiline logs and can parse container logs.
- syslog: Ships log data to a syslog server. This is a popular option for logging applications.
- journald: Sends container logs to the systemd journal.
- fluentd: Sends log messages to the Fluentd collector as structured data.
- elf: Writes container logs to a Graylog Extended Log Format (GELF) endpoint such as Graylog or Logstash.
- awslogs: Sends log messages to AWS CloudWatch Logs.
- splunk: Writes log messages to Splunk using HTTP Event Collector (HEC).
- cplogs: Ships log data to Google Cloud Platform (GCP) Logging.
- logentries: Writes container logs to Rapid7 Logentries.
- etwlogs: Writes log messages as Event Tracing for Windows (ETW) events, thus only available on Windows platforms.
Use the json-file Log Driver With a Log Shipper Container
The most reliable and convenient way of log collection is to use the json-file driver and set up a log shipper to ship the logs. You always have a local copy of logs on your server and you get the advantage of centralized log management.
If you were to use Sematext Logagent there are a few simple steps to follow in order to start sending logs to Sematext. After creating a Logs App, run these commands in a terminal.
docker pull sematext/logagent

docker run -d --restart=always --name st-logagent
  -e LOGS_TOKEN=YOUR_LOGS_TOKEN
  -e LOGS_RECEIVER_URL="https://logsene-receiver.sematext.com"
  -v /var/run/docker.sock:/var/run/docker.sock
  sematext/logagent
This will start sending all container logs to Sematext.
How to Work With Docker Container Logs Using the docker logs Command?
Docker has a dedicated command which lists container logs. The docker logs command. The flow will usually involve you checking your running containers with docker ps, then check the logs by using a container’s ID.
docker logs <container_id>
This command will list all logs for the specified container. You can add a timestamp flag and list logs for particular dates.
docker logs <container_id> --timestamps
docker logs <container_id> --since (or --until) YYYY-MM-DD
What you’ll end up doing will be tailing these logs, either to check the last N number of lines or tailing the logs in real time.
The --tail flag will show the last N lines of logs:
docker logs <container_id> --tail N
Using the --follow flag will tail -f (follow) the Docker container logs:
docker logs <container_id> --follow
But what if you only want to see specific logs? Luckily, grep works with docker logs as well.
docker logs <container_id> | grep pattern
This command will only show errors:
docker logs <container_id> | grep -i error
Once an application starts growing, you tend to start using Docker Compose. Don’t worry, it has a logs command as well.
docker-compose logs
This will display the logs from all services in the application defined in the Docker Compose configuration file.
Get started with Docker with our Docker Commands Cheat Sheet!
How to Work with Docker Container Logs Using a Log Shipper?
While everyone’s infrastructure is growing — nowadays, mostly in the container space — so are the monitoring needs. However, monitoring containers is different — and more challenging — from traditional server monitoring.
Unlike non-containerized applications that write logs into files, containers write their logs to the standard output and standard error stream. Container logs can be a mix of plain text messages from start scripts and structured logs from applications, which makes it difficult for you to tell which log event belongs to what container and app, then parse it correctly and so on.
Although Docker log drivers can ship logs to log management tools, most of them don’t allow you to parse container logs. You need a separate tool called a log shipper, such as Logagent, Logstash or rsyslog to structure logs before shipping them to storage. The problem is that when your logging solution uses multiple tools with dependencies for log processing, the chances your logging pipeline will crash increases with every new tool.
But there are a few Docker logging driver alternatives that can help make your job easier, one of them being Sematext Logagent.
Logagent is an all-in-one general-purpose solution for container log processing that allows you to monitor container logs, as well as your whole infrastructure and applications if paired with the Sematext Agent container.
You can read more about how Logagent works and how to use it for monitoring logs in our post on Docker Container Monitoring with Sematext.
What About Docker Daemon Logs
Docker daemon logs are generated by the Docker platform and located on the host. Depending on the host operating system, daemon logs are written to the system’s logging service or to a log file.
If you were to collect only container logs you’d get insight into the state of your services. However, by traditional logging methods, you also need to be aware of the state of your Docker platform, which is what Docker daemon logs are for. They paint a clear picture of your overall microservices architecture.
On that note, the Docker daemon logs two types of events:
- Events generated by the Docker service itself
- Commands sent to the daemon through Docker’s Remote API
Depending on your Operating System, the Docker daemon log file is stored in different locations.
Check out Guide to Docker Logs Location to find out more.
Popular Docker Logging Topics
Logging is a key part of gathering insight into the state of your infrastructure, but only if it’s analyzed. However, log data comes in huge volumes so doing it manually would be like looking for a needle in a haystack. Which is why you need a log data analysis platform. You can opt for open-source solutions or commercial software to get the most out of your Docker logs.
Open-Source Log Analysis Solutions
With open-source solutions, you need an expert team ready to handle everything from setup to configuration, providing infrastructure, maintenance, and management.
The most popular open source log analysis software is Elastic Stack (formerly known as ELK Stack). It’s a robust platform comprising three different tools — Elasticsearch to store log data, Logstash to process it, and Kibana to visualize log data.
For more information on Elasticsearch, check out our Elasticsearch Complete Guide.
If you still want to use Elasticsearch and Kibana but don’t want to manage it yourself, Sematext Cloud has an Elasticsearch API and integrated Kibana in the UI, if you feel like using it instead of the default Sematext Dashboards. This makes migrating to a managed Elasticsearch cluster a walk in the park. In your log shipper configuration, you’d only change the Elasticsearch endpoints from your local Elasticsearch cluster to the Sematext Cloud Elasticsearch API endpoint.
Commercial Log Analysis Tools: Logging as a Service
If you don’t have the resources to deal with Docker log data on your own, you can reach out to vendors who provide “logging as a service” as part of a full log management solution. You only need to point out the Docker logs and they’ll take over managing your log data from collection to storage, analysis, monitoring, and presentation.
Sematext as a Log Management Solution for Docker Logs
The Docker logging driver and log delivery mode you choose can have a noticeable effect on the performance of your containerized applications. We recommend using the json-file driver for reliable logging, consistent performance, and observability by using a centralized logging tool like Sematext Logs, We want to give you an all-in-one solution that provides hassle-free log management and analytics for your infrastructure and applications. It allows you to filter, analyze, and alert on logs from all your applications. By storing your Docker logs, you can detect and troubleshoot issues easier, but also gather actionable insights from both your infrastructure and Dockerized applications.
Check out the video below to see how easy it is to set up Docker log shipping with Sematext Logs. Or watch this video tutorial to learn how to set up Docker log monitoring using Sematext to get the visibility you need to make sure your containers are performing as they should.
If you want to earn more about Sematext Logs, see how it stacks against similar solutions in our dedicated articles about the best log management tools, log aggregation tools, log analysis software, and cloud logging services.
For optimum performance, we recommend you collect logs along with metrics and traces. We talked more about this in our Docker monitoring series. Check it out if you’re into that:
- Docker Container Monitoring and Management Challenges
- Docker Container Performance Metrics to Monitor
- Docker Container Monitoring Tools
- Docker Monitoring with Sematext
Now that you know how logging works in Docker, you can take a look at Kubernetes logs as well. Learn more from our Kubernetes logging guide.
Docker, a popular OS-level virtualization platform that allows us to deliver applications in packages known as containers which in simple terms are isolated environments with their own software, libraries, and configuration files.
Like any other modern software, logging events and messages like warnings and errors is an inherent part of the Docker platform, which allows you to debug your applications and production issues.
We’ll be covering some simple ways in which you can manage and monitor logs for your containers. So let’s get started.
Docker Logs Command
The basic syntax to fetch logs of a container is:
$ docker logs [OPTIONS] <CONTAINER-NAME OR ID>OR
$ docker container logs [OPTIONS] <CONTAINER-NAME OR ID>Both of the syntaxes are essentially the same, so we’ll focus on the rest of the commands in this article as docker logs.
Though do note here that the above command is only functional for containers that are started with the json-file or journald logging driver.
Here OPTIONS refers to the available supported flags with docker logs command, which are listed below:
| Name, Shorthand | Default | Description |
|---|---|---|
--details |
Show extra details provided to logs. | |
--follow, -f |
Follow log output | |
--since |
Show logs since timestamp (e.g. 2021-08-28T15:23:37Z) or relative (e.g. 56m for 56 minutes) | |
--tail , -n |
all |
Number of lines to show from the end of the logs |
--timestamps, -t |
Show timestamps | |
--until |
API 1.35+ Show logs before a timestamp (e.g. 2021-08-28T15:23:37Z) or relative (e.g. 56m for 56 minutes) |
Example:
$ docker ps
CONTAINER ID   IMAGE     COMMAND                  CREATED         STATUS        PORTS     NAMES
28913415ed22   nginx     "/docker-entrypoint.…"   2 seconds ago   Up 1 second   80/tcp    gifted_edison
$ docker logs 28913415ed22
/docker-entrypoint.sh: /docker-entrypoint.d/ is not empty, will attempt to perform configuration
/docker-entrypoint.sh: Looking for shell scripts in /docker-entrypoint.d/
/docker-entrypoint.sh: Launching /docker-entrypoint.d/10-listen-on-ipv6-by-default.sh
10-listen-on-ipv6-by-default.sh: info: Getting the checksum of /etc/nginx/conf.d/default.conf
10-listen-on-ipv6-by-default.sh: info: Enabled listen on IPv6 in /etc/nginx/conf.d/default.conf
/docker-entrypoint.sh: Launching /docker-entrypoint.d/20-envsubst-on-templates.sh
/docker-entrypoint.sh: Launching /docker-entrypoint.d/30-tune-worker-processes.sh
/docker-entrypoint.sh: Configuration complete; ready for start up
2021/08/28 09:02:59 [notice] 1#1: using the "epoll" event method
2021/08/28 09:02:59 [notice] 1#1: nginx/1.21.1
2021/08/28 09:02:59 [notice] 1#1: built by gcc 8.3.0 (Debian 8.3.0-6)
2021/08/28 09:02:59 [notice] 1#1: OS: Linux 5.8.0-1039-azure
2021/08/28 09:02:59 [notice] 1#1: getrlimit(RLIMIT_NOFILE): 1048576:1048576
2021/08/28 09:02:59 [notice] 1#1: start worker processes
2021/08/28 09:02:59 [notice] 1#1: start worker process 31
2021/08/28 09:02:59 [notice] 1#1: start worker process 32
$
Docker Logs Location
Docker, by default, captures the standard output (and standard error) of all your containers and writes them in files using the JSON format. This is achieved using JSON File logging driver or json-file. These logs are by default stored at container-specific locations under /var/lib/docker filesystem.
/var/lib/docker/containers/<container_id>/<container_id>-json.logAs an example, for my redis container listed below, I can check its json logfile as shown in the snippet below:
$ docker ps
CONTAINER ID   IMAGE     COMMAND                  CREATED          STATUS          PORTS                                   NAMES
551c9273bbea   redis     "docker-entrypoint.s…"   19 minutes ago   Up 19 minutes   6379/tcp                                redis
6cc871763df1   nginx     "/docker-entrypoint.…"   7 hours ago      Up 7 hours      0.0.0.0:8080->80/tcp, :::8080->80/tcp   nostalgic_wescoff
$ sudo ls -l /var/lib/docker/containers/551c9273bbea6eaf66523ed735866b9ebe6924c3b504dfeb44bef90e69d59c73/551c9273bbea6eaf66523ed735866b9ebe6924c3b504dfeb44bef90e69d59c73-json.log
-rw-r----- 1 root root 1437 Aug 28 16:53 /var/lib/docker/containers/551c9273bbea6eaf66523ed735866b9ebe6924c3b504dfeb44bef90e69d59c73/551c9273bbea6eaf66523ed735866b9ebe6924c3b504dfeb44bef90e69d59c73-json.log
$ sudo tail -10 /var/lib/docker/containers/551c9273bbea6eaf66523ed735866b9ebe6924c3b504dfeb44bef90e69d59c73/551c9273bbea6eaf66523ed735866b9ebe6924c3b504dfeb44bef90e69d59c73-json.log
{"log":"1:C 28 Aug 2021 16:53:42.160 # oO0OoO0OoO0Oo Redis is starting oO0OoO0OoO0Oon","stream":"stdout","time":"2021-08-28T16:53:42.16031257Z"}
{"log":"1:C 28 Aug 2021 16:53:42.160 # Redis version=6.2.5, bits=64, commit=00000000, modified=0, pid=1, just startedn","stream":"stdout","time":"2021-08-28T16:53:42.160337871Z"}
{"log":"1:C 28 Aug 2021 16:53:42.160 # Warning: no config file specified, using the default config. In order to specify a config file use redis-server /path/to/redis.confn","stream":"stdout","time":"2021-08-28T16:53:42.160342171Z"}
{"log":"1:M 28 Aug 2021 16:53:42.160 * monotonic clock: POSIX clock_gettimen","stream":"stdout","time":"2021-08-28T16:53:42.160792578Z"}
{"log":"1:M 28 Aug 2021 16:53:42.161 * Running mode=standalone, port=6379.n","stream":"stdout","time":"2021-08-28T16:53:42.161148683Z"}
{"log":"1:M 28 Aug 2021 16:53:42.161 # Server initializedn","stream":"stdout","time":"2021-08-28T16:53:42.161170984Z"}
{"log":"1:M 28 Aug 2021 16:53:42.161 # WARNING overcommit_memory is set to 0! Background save may fail under low memory condition. To fix this issue add 'vm.overcommit_memory = 1' to /etc/sysctl.conf and then reboot or run the command 'sysctl vm.overcommit_memory=1' for this to take effect.n","stream":"stdout","time":"2021-08-28T16:53:42.161186984Z"}
{"log":"1:M 28 Aug 2021 16:53:42.161 * Ready to accept connectionsn","stream":"stdout","time":"2021-08-28T16:53:42.161484389Z"}
$
Show Extra Details
To show extra details provided to logs, use --details flag.
Example:
$ docker logs 6cc871763df1 --details
 /docker-entrypoint.sh: /docker-entrypoint.d/ is not empty, will attempt to perform configuration
 /docker-entrypoint.sh: Looking for shell scripts in /docker-entrypoint.d/
 /docker-entrypoint.sh: Launching /docker-entrypoint.d/10-listen-on-ipv6-by-default.sh
 10-listen-on-ipv6-by-default.sh: info: Getting the checksum of /etc/nginx/conf.d/default.conf
 10-listen-on-ipv6-by-default.sh: info: Enabled listen on IPv6 in /etc/nginx/conf.d/default.conf
 /docker-entrypoint.sh: Launching /docker-entrypoint.d/20-envsubst-on-templates.sh
 /docker-entrypoint.sh: Launching /docker-entrypoint.d/30-tune-worker-processes.sh
 /docker-entrypoint.sh: Configuration complete; ready for start up
 2021/08/28 10:29:05 [notice] 1#1: using the "epoll" event method
 2021/08/28 10:29:05 [notice] 1#1: nginx/1.21.1
 2021/08/28 10:29:05 [notice] 1#1: built by gcc 8.3.0 (Debian 8.3.0-6)
 2021/08/28 10:29:05 [notice] 1#1: OS: Linux 5.8.0-1039-azure
 2021/08/28 10:29:05 [notice] 1#1: getrlimit(RLIMIT_NOFILE): 1048576:1048576
 2021/08/28 10:29:05 [notice] 1#1: start worker processes
 2021/08/28 10:29:05 [notice] 1#1: start worker process 33
 2021/08/28 10:29:05 [notice] 1#1: start worker process 34
 172.17.0.1 - - [28/Aug/2021:10:29:26 +0000] "GET / HTTP/1.1" 200 612 "-" "curl/7.68.0" "-"
$
Follow Log Output
You can use --follow or -f flag to follow the log output. This allows you to monitor new updates in the log stream from continuously STDOUT and STDERR.
Example:
$ docker logs 6cc871763df1 -f
/docker-entrypoint.sh: /docker-entrypoint.d/ is not empty, will attempt to perform configuration
/docker-entrypoint.sh: Looking for shell scripts in /docker-entrypoint.d/
/docker-entrypoint.sh: Launching /docker-entrypoint.d/10-listen-on-ipv6-by-default.sh
10-listen-on-ipv6-by-default.sh: info: Getting the checksum of /etc/nginx/conf.d/default.conf
10-listen-on-ipv6-by-default.sh: info: Enabled listen on IPv6 in /etc/nginx/conf.d/default.conf
/docker-entrypoint.sh: Launching /docker-entrypoint.d/20-envsubst-on-templates.sh
/docker-entrypoint.sh: Launching /docker-entrypoint.d/30-tune-worker-processes.sh
/docker-entrypoint.sh: Configuration complete; ready for start up
2021/08/28 10:29:05 [notice] 1#1: using the "epoll" event method
2021/08/28 10:29:05 [notice] 1#1: nginx/1.21.1
2021/08/28 10:29:05 [notice] 1#1: built by gcc 8.3.0 (Debian 8.3.0-6)
2021/08/28 10:29:05 [notice] 1#1: OS: Linux 5.8.0-1039-azure
2021/08/28 10:29:05 [notice] 1#1: getrlimit(RLIMIT_NOFILE): 1048576:1048576
2021/08/28 10:29:05 [notice] 1#1: start worker processes
2021/08/28 10:29:05 [notice] 1#1: start worker process 33
2021/08/28 10:29:05 [notice] 1#1: start worker process 34
172.17.0.1 - - [28/Aug/2021:10:29:26 +0000] "GET / HTTP/1.1" 200 612 "-" "curl/7.68.0" "-"
Tail Logs
Container logs can be tailed to limit the number of output shown on the screen with --tail or -n flag. By default, this flag assumes all as an argument that shows the complete log stream. To show a fixed number of lines from the end of the logs, specify a positive integer number following --tail or -n flag.
Example:
$ docker logs 6cc871763df1 -n 10
/docker-entrypoint.sh: Configuration complete; ready for start up
2021/08/28 10:29:05 [notice] 1#1: using the "epoll" event method
2021/08/28 10:29:05 [notice] 1#1: nginx/1.21.1
2021/08/28 10:29:05 [notice] 1#1: built by gcc 8.3.0 (Debian 8.3.0-6)
2021/08/28 10:29:05 [notice] 1#1: OS: Linux 5.8.0-1039-azure
2021/08/28 10:29:05 [notice] 1#1: getrlimit(RLIMIT_NOFILE): 1048576:1048576
2021/08/28 10:29:05 [notice] 1#1: start worker processes
2021/08/28 10:29:05 [notice] 1#1: start worker process 33
2021/08/28 10:29:05 [notice] 1#1: start worker process 34
172.17.0.1 - - [28/Aug/2021:10:29:26 +0000] "GET / HTTP/1.1" 200 612 "-" "curl/7.68.0" "-"
$
Show Logs Since
We can limit log output by using --since flag and giving a timestamp like an absolute value with syntax 2021-08-28T15:23:37Z or a relative one like 56m for 56 minutes.
The --since option shows only the container logs generated after a given date. You can specify the date as an RFC 3339 date, a UNIX timestamp, or a Go duration string (e.g. 1m30s, 3h). The local time zone on the client will be used if you do not provide either a Z or a +-00:00 time zone offset at the end of the timestamp. You can combine the --since option with either or both of the --follow or --tail options.
Example:
$ docker logs --since=1m nostalgic_wescoff
172.17.0.1 - - [28/Aug/2021:15:19:24 +0000] "GET / HTTP/1.1" 200 612 "-" "curl/7.68.0" "-"
172.17.0.1 - - [28/Aug/2021:15:19:25 +0000] "GET / HTTP/1.1" 200 612 "-" "curl/7.68.0" "-"
$
In the above example, logs since only 2 minutes are shown where nostalgic_wescoff is the auto-generated name assigned for the nginx container.
Show Logs Until
Like --since flag, docker logs also support --until flag, which shows logs before the given timestamp. Similarly, the timestamp follows a similar convention as earlier and can be specified as an absolute value with syntax 2021-08-28T15:23:37Z or a relative one like 56m for 56 minutes.
Example:
$ docker logs --until=1h30m nostalgic_wescoff
/docker-entrypoint.sh: /docker-entrypoint.d/ is not empty, will attempt to perform configuration
/docker-entrypoint.sh: Looking for shell scripts in /docker-entrypoint.d/
/docker-entrypoint.sh: Launching /docker-entrypoint.d/10-listen-on-ipv6-by-default.sh
10-listen-on-ipv6-by-default.sh: info: Getting the checksum of /etc/nginx/conf.d/default.conf
10-listen-on-ipv6-by-default.sh: info: Enabled listen on IPv6 in /etc/nginx/conf.d/default.conf
/docker-entrypoint.sh: Launching /docker-entrypoint.d/20-envsubst-on-templates.sh
/docker-entrypoint.sh: Launching /docker-entrypoint.d/30-tune-worker-processes.sh
/docker-entrypoint.sh: Configuration complete; ready for start up
2021/08/28 10:29:05 [notice] 1#1: using the "epoll" event method
2021/08/28 10:29:05 [notice] 1#1: nginx/1.21.1
2021/08/28 10:29:05 [notice] 1#1: built by gcc 8.3.0 (Debian 8.3.0-6)
2021/08/28 10:29:05 [notice] 1#1: OS: Linux 5.8.0-1039-azure
2021/08/28 10:29:05 [notice] 1#1: getrlimit(RLIMIT_NOFILE): 1048576:1048576
2021/08/28 10:29:05 [notice] 1#1: start worker processes
2021/08/28 10:29:05 [notice] 1#1: start worker process 33
2021/08/28 10:29:05 [notice] 1#1: start worker process 34
172.17.0.1 - - [28/Aug/2021:10:29:26 +0000] "GET / HTTP/1.1" 200 612 "-" "curl/7.68.0" "-"
$
In the above example, all logs before 1 hour 30 minutes are shown.
Show Timestamps
Many container applications offer timestamps built in their log output, so Docker also shows them with docker logs command. If you need Docker to explicitly prefix its timestamps in the output, use --timestamps or -t flag.
Example:
$ docker logs -t redis
2021-08-28T16:53:42.160312570Z 1:C 28 Aug 2021 16:53:42.160 # oO0OoO0OoO0Oo Redis is starting oO0OoO0OoO0Oo
2021-08-28T16:53:42.160337871Z 1:C 28 Aug 2021 16:53:42.160 # Redis version=6.2.5, bits=64, commit=00000000, modified=0, pid=1, just started
2021-08-28T16:53:42.160342171Z 1:C 28 Aug 2021 16:53:42.160 # Warning: no config file specified, using the default config. In order to specify a config file use redis-server /path/to/redis.conf
2021-08-28T16:53:42.160792578Z 1:M 28 Aug 2021 16:53:42.160 * monotonic clock: POSIX clock_gettime
2021-08-28T16:53:42.161148683Z 1:M 28 Aug 2021 16:53:42.161 * Running mode=standalone, port=6379.
2021-08-28T16:53:42.161170984Z 1:M 28 Aug 2021 16:53:42.161 # Server initialized
2021-08-28T16:53:42.161186984Z 1:M 28 Aug 2021 16:53:42.161 # WARNING overcommit_memory is set to 0! Background save may fail under low memory condition. To fix this issue add 'vm.overcommit_memory = 1' to /etc/sysctl.conf and then reboot or run the command 'sysctl vm.overcommit_memory=1' for this to take effect.
2021-08-28T16:53:42.161484389Z 1:M 28 Aug 2021 16:53:42.161 * Ready to accept connections
$
Merge Flags
Docker offers to combine certain flags to get more filtered output rather than print all of the log contents on the screen. As a simple example, we can combine --tail flag with --since to get more restricted output.
Example:
$ docker logs --since=2h -f nostalgic_wescoff
172.17.0.1 - - [28/Aug/2021:15:19:24 +0000] "GET / HTTP/1.1" 200 612 "-" "curl/7.68.0" "-"
172.17.0.1 - - [28/Aug/2021:15:19:25 +0000] "GET / HTTP/1.1" 200 612 "-" "curl/7.68.0" "-"
This can work with other flags as well.
Filter With Shell Utilities
Linux shell utilities can also be used for more dexterity in the log output. Utilities like grep, head, tail etc. can be piped to docker logs output for more advanced operations.
Example:
$ docker logs --since=7h nostalgic_wescoff 2>&1 | grep GET
172.17.0.1 - - [28/Aug/2021:10:29:26 +0000] "GET / HTTP/1.1" 200 612 "-" "curl/7.68.0" "-"
172.17.0.1 - - [28/Aug/2021:15:19:24 +0000] "GET / HTTP/1.1" 200 612 "-" "curl/7.68.0" "-"
172.17.0.1 - - [28/Aug/2021:15:19:25 +0000] "GET / HTTP/1.1" 200 612 "-" "curl/7.68.0" "-"
$
Do note here that we need to redirect log streams to provide single piped input for grep using 2>&1.
Summary 👩💻
Docker is a versatile platform that offers numerous features to administer its environment. Managing logs for a system is one of the essential skills which every system administrator should know. Managing logs in Docker is easy once you know the available command and possible flags as per your requirements.
For further read on Docker and its functionalities, refer to Docker’s documentation.
Время прочтения
10 мин
Просмотры 24K
В рамках запуска практического интенсива по ELK подготовили для вас перевод полезного материала. Приглашаем также всех заинтересованных на онлайн-встречу с преподавателем интенсива, где преподаватель расскажет о программе, формате обучения и перспективах для выпускников.

По мере роста вашей инфраструктуры наличие роботов и надежная централизованная система логирования становится критически важными составляющими. Централизация логирования становится ключевым аспектом множества IT-задач и дает вам хороший обзор всей вашей системы.
Лучшее решение — агрегировать логи с метаданными из всех контейнеров. Это предоставит вам лучшие варианты отслеживания и возможность получить хорошую поддержку от сообщества. Здесь на сцену выходит ELK Stack. ELK, также известный как Elastic stack, представляет собой комбинацию современных инструментов с открытым исходным кодом, таких как ElasticSearch, Logstash и Kibana. Это полное решение для сквозного анализа журналов, которое вы можете использовать в своей системе.
Каждому компоненту отведена определенная роль: ElasticSearch лучше всего хранит необработанные логи, Logstash помогает собирать и преобразовывать логи в согласованный формат, а Kibana добавляет отличный уровень визуализации и помогает вам управлять вашей системой в удобной для пользователя манере.
В этом руководстве вы узнаете, как развернуть ELK и наладить агрегирование контейнерных логов. Мы собираемся объединить ELK с Filebeat, чтобы агрегировать контейнерные логи. Для этого мы собираемся создать собственный образ Docker.
Шаг 1 — Настройка Filebeat
Начнем с настройки Filebeat. Во-первых, для создания образа вам нужно создать Dockerfile:
$ mkdir filebeat_docker && cd $_
$ touch Dockerfile && nano Dockerfile
Теперь откройте Dockerfile в удобном для вас текстовом редакторе и скопируйте/вставьте указанные ниже строки:
FROM docker.elastic.co/beats/filebeat:7.5.1

COPY filebeat.yml /usr/share/filebeat/filebeat.yml
USER root
RUN mkdir /usr/share/filebeat/dockerlogs
RUN chown -R root /usr/share/filebeat/
RUN chmod -R go-w /usr/share/filebeat/
В каталоге filebeat_docker создайте файл filebeat.yml, содержащий конфигурацию для Filebeat. В этом руководстве мы будем детализировать файл filebeat.yml по минимуму.
filebeat.inputs:
  - type: docker
    containers:
      path: "/usr/share/dockerlogs/data"
      stream: "stdout"
      ids:
        - "*"
      cri.parse_flags: true
      combine_partial: true
      exclude_files: ['.gz$']

processors:
  - add_docker_metadata:
      host: "unix:///var/run/docker.sock"

filebeat.config.modules:
  path: ${path.config}/modules.d/*.yml
  reload.enabled: false

output.logstash:
  hosts: ["127.0.0.1:5044"]

log files:
logging.level: error
logging.to_files: false
logging.to_syslog: false
loggins.metrice.enabled: false
logging.files:
  path: /var/log/filebeat
  name: filebeat
  keepfiles: 7
  permissions: 0644
ssl.verification_mode: none
Теперь создадим образ Filebeat Docker:
$ docker build -t filebeatimage .
Sending build context to Docker daemon  3.584kB
Step 1/6 : FROM docker.elastic.co/beats/filebeat:7.5.1
7.5.1: Pulling from beats/filebeat
c808caf183b6: Already exists
a07383b84bc8: Pull complete
a3c8dd4531b4: Pull complete
5547f4a87d0c: Pull complete
d68e041d92cd: Pull complete
7cfb3f76a272: Pull complete
748d7fe7bf07: Pull complete
Digest: sha256:68d87ae7e7bb99832187f8ed5931cd253d7a6fd816a4bf6a077519c8553074e4
Status: Downloaded newer image for docker.elastic.co/beats/filebeat:7.5.1
 ---> 00c5b17745d1
Step 2/6 : COPY filebeat.yml /usr/share/filebeat/filebeat.yml
 ---> f6b75829d8d6
Step 3/6 : USER root
 ---> Running in 262c41d7ce58
Removing intermediate container 262c41d7ce58
 ---> 1ffcda8f39cf
Step 4/6 : RUN mkdir /usr/share/filebeat/dockerlogs
 ---> Running in 8612b1895ac7
Removing intermediate container 8612b1895ac7
 ---> 483d29e65dc7
Step 5/6 : RUN chown -R root /usr/share/filebeat/
 ---> Running in 4a6ad8b22705
Removing intermediate container 4a6ad8b22705
 ---> b779a9da7ac9
Step 6/6 : RUN chmod -R go-w /usr/share/filebeat/
 ---> Running in bb9638d12090
Removing intermediate container bb9638d12090
 ---> 85ec125594ee
Successfully built 85ec125594ee
Successfully tagged filebeatimage:latest
Чтобы проверить, был ли образ успешно построен:
$ docker images
REPOSITORY      TAG           IMAGE ID            CREATED             SIZE
filebeatimage   latest        85ec125594ee        7 seconds ago       514MB
Для контейнера filebeat_elk мы создали две точки монтирования с помощью параметра -v;
-
/var/lib/docker/containers:/usr/share/dockerlogs/data: мы проецируем логи хост-машины, которые находятся в/var/lib/docker/containersв/usr/share/dockerlogs/dataвнутри docker-контейнера. Обратите внимание, что вы использовали:ro, что означает, что у него есть разрешение только на чтение.
-
/var/run/docker.sockсвязан с docker-демоном контейнера Filebeat, который позволяет контейнеру Filebeat собирать метаданные Docker и записи логов контейнера.
Установка Filebeat через DEB:
Существует альтернативный способ установить Filebeat на вашу хост-машину. На момент написания статьи, версия Filebeat — 7.5.1, вы можете скачать последнюю версию filebeat отсюда.
Чтобы установить загруженный .deb файл:
$ wget https://artifacts.elastic.co/downloads/beats/filebeat/filebeat-7.5.1-amd64.deb

$ sudo dpkg -i filebeat-7.5.1-amd64.deb
Вы можете найти файл конфигурации в каталоге /etc/filebeat/filebeat.yml.
Шаг 2 — Настройка ELK или Elastic Stack
Вы можете использовать удаленный сервер для размещения своего ELK stack или запускать контейнеры в существующей системе.
Прежде чем начать, убедитесь, что слушают следующие порты:
-
Elasticsearch — порт 9200 и порт 9300
-
Logstash — порт 5044
-
Kibana — порт 5601
ElasticSearch:
Мы собираемся использовать самый последний официальный образ Elasticsearch. Итак, начнем с подтягивания образа из Docker Hub:
$ docker pull docker.elastic.co/elasticsearch/elasticsearch:7.5.1
7.5.1: Pulling from elasticsearch/elasticsearch
c808caf183b6: Already exists
05ff3f896999: Pull complete
82fb7fb0a94e: Pull complete
c4d0024708f4: Pull complete
136650a16cfe: Pull complete
968db096c092: Pull complete
42547e91692f: Pull complete
Digest: sha256:b0960105e830085acbb1f9c8001f58626506ce118f33816ea5d38c772bfc7e6c
Status: Downloaded newer image for docker.elastic.co/elasticsearch/elasticsearch:7.5.1
docker.elastic.co/elasticsearch/elasticsearch:7.5.1
Теперь создайте каталог с именем docker_elk, в котором будут находиться все ваши файлы конфигурации и Dockerfile:
$ mkdir docker_elk && cd $_Внутри docker_elk, создайте еще один каталог для elasticsearch и создайте файлы Dockerfile и elasticsearch.yml:
$ mkdir elasticsearch && cd $_
$ touch Dockerfile && touch elasticsearch.yml
Откройте файл elasticsearch.yml в любом текстовом редакторе и скопируйте настройки конфигурации как есть:
---
cluster.name: "docker-cluster"
network.host: 0.0.0.0

xpack.license.self_generated.type: basic
xpack.security.enabled: true
xpack.monitoring.collection.enabled: true
Обратите внимание, что вы можете поменять xpack.license.self_generated.type с basic на trial, если вы хотите попробовать коммерческую версию x-pack в течении 30 дней.
Откройте Dockerfile в любом текстовом редакторе, скопируйте указанные ниже строки и вставьте их как есть:
FROM docker.elastic.co/elasticsearch/elasticsearch:7.5.1
COPY --chown=elasticsearch:elasticsearch ./elasticsearch.yml /usr/share/elasticsearch/config/
Команда chown предназначена для изменения владельца файла на elasticsearch, как и для других файлов в контейнере.
Kibana:
Теперь мы собираемся настроить Dockerfile для Kibana, и снова вам нужно подтянуть последний образ из реестра Elastic Docker:
$ docker pull docker.elastic.co/kibana/kibana:7.5.1
7.5.1: Pulling from kibana/kibana
c808caf183b6: Already exists
e12a414b7b04: Pull complete
20714d0b39d8: Pull complete
393e0a5bccf2: Pull complete
b142626e938b: Pull complete
b28e35a143ca: Pull complete
728725922476: Pull complete
96692e1a8406: Pull complete
e4c3cbe1dbbe: Pull complete
bb6fc46a19d1: Pull complete
Digest: sha256:12b5e37e0f960108750e84f6b2f8acce409e01399992636b2a47d88bbc7c2611
Status: Downloaded newer image for docker.elastic.co/kibana/kibana:7.5.1
docker.elastic.co/kibana/kibana:7.5.1
Создайте каталог внутри вашего docker_elk, и внутри него вы должны создать файлы Dockerfile и kibana.yml:
$ mkdir kibana && cd $_
$ touch Dockerfile && touch kibana.yml
kibana.yml будет состоять из следующих конфигураций. Обратите внимание, что вам необходимо изменить значения elasticsearch.user и elasticsearch.password:
---
server.name: kibana
server.host: "0"
elasticsearch.hosts: [ "http://elasticsearch:9200" ]
xpack.monitoring.ui.container.elasticsearch.enabled: true

elasticsearch.username: elastic
elasticsearch.password: yourstrongpasswordhere
В то время как в Dockerfile это будет выглядеть примерно так:
FROM docker.elastic.co/kibana/kibana:7.5.1
COPY ./kibana.yml /usr/share/kibana/config/
Logstash:
Образ контейнера для Logstash доступен в реестре Elastic Docker. Опять же, на момент написания текущая версия — 7.5.1, последнюю версию Logstash вы можете найти здесь.
$ docker pull docker.elastic.co/logstash/logstash:7.5.1
7.5.1: Pulling from logstash/logstash
c808caf183b6: Already exists
7c07521065ed: Pull complete
d0d212a3b734: Pull complete
418bd04a229b: Pull complete
b22f374f97b1: Pull complete
b65908943591: Pull complete
2ee12bfc6e9c: Pull complete
309701bd1d88: Pull complete
b3555469618d: Pull complete
2834c4c48906: Pull complete
bae432e5da20: Pull complete
Digest: sha256:5bc89224f65459072931bc782943a931f13b92a1a060261741897e724996ac1a
Status: Downloaded newer image for docker.elastic.co/logstash/logstash:7.5.1
docker.elastic.co/logstash/logstash:7.5.1
Теперь создайте каталог для Logstash внутри docker_elk и добавьте необходимые файлы, как показано ниже:
$ mkdir logstash && cd $_
$ touch Dockerfile && touch logstash.yml
Скопируйте строки ниже в logstash.yml. Убедитесь, что вы вводите правильное имя пользователя и пароль в xpack.monitoring.elasticsearch.username и xpack.monitoring.elasticsearch.password соответственно:
---
http.host: "0.0.0.0"
xpack.monitoring.elasticsearch.hosts: [ "http://elasticsearch:9200" ]

xpack.monitoring.enabled: true
xpack.monitoring.elasticsearch.username: elastic
xpack.monitoring.elasticsearch.password: yourstrongpasswordhere
Теперь добавьте следующие строки в свой Dockerfile:
FROM docker.elastic.co/logstash/logstash:7.5.1
COPY ./logstash.yml /usr/share/logstash/config/
COPY ./logstash.conf /usr/share/logstash/pipeline/
Кроме этого, вам необходимо создать файл logstash.conf. Здесь, в справочнике elasticsearch, вы найдете host, user и password, убедитесь, что вы изменили значения в соответствии с вашей системой:
input {
    tcp {
    port => 5000
    codec => json
  }
}
output {
  elasticsearch {
    hosts => "elasticsearch:9200"
    user => elastic
    password => yourstrongpasswordhere
  }
}
Как только вы закончите установку компонентов вашего стека, структура каталогов вашего проекта должна выглядеть следующим образом:
.
├── elasticsearch
│   ├── Dockerfile
│   └── elasticsearch.yml
├── kibana
│   ├── Dockerfile
│   └── kibana.yml
└── logstash
    ├── Dockerfile
    ├── logstash.conf
    └── logstash.yml

3 directories, 7 files
Теперь пришло время создать файл Docker Compose, который позволит вам запустить стек.
Шаг 3 — Docker Compose
Создайте файл docker-compose.yml в каталоге docker_elk. Здесь вы будете определять и запускать свое многоконтейнерное приложение, состоящее из Elasticsearch, Kibana и Logstash.
Вы можете скопировать приведенный ниже контекст в файл docker-compose.yml. Убедитесь, что вы изменили значения ELASTIC_PASSWORD и ES_JAVA_OPTS. В этом руководстве для ES_JAVA_OPTS установлено значение в 256 МБ, но в реальных сценариях может потребоваться увеличить размер кучи в соответствии с вашими запросами.
version: '3.2'

services:
 elasticsearch:
   build:
     context: elasticsearch/
   volumes:
     - type: volume
       source: elasticsearch
       target: /usr/share/elasticsearch/data
   ports:
     - "9200:9200"
     - "9300:9300"
   environment:
     ES_JAVA_OPTS: "-Xmx256m -Xms256m"
     ELASTIC_PASSWORD: yourstrongpasswordhere
     discovery.type: single-node
   networks:
     - elk_stack

 logstash:
   build:
     context: logstash/
   ports:
     - "5000:5000"
     - "9600:9600"
   environment:
     LS_JAVA_OPTS: "-Xmx256m -Xms256m"
   networks:
     - elk_stack
   depends_on:
     - elasticsearch

 kibana:
   build:
     context: kibana/
   ports:
     - "5601:5601"
   networks:
     - elk_stack
   depends_on:
     - elasticsearch

networks:
 elk_stack:
   driver: bridge

volumes:
 elasticsearch:
Теперь, для того, чтобы собрать ELK stack, вам нужно запустить следующую команду в каталоге
docker_elk :
$ docker-compose up -d
Starting elastic_elk ... done
Starting kibana_elk   ... done
Starting logstash_elk ... done
Убедитесь, что конвейер работает нормально — запустите следующую команду, чтобы увидеть индексы Elasticsearch:
$ curl 'localhost:9200/_cat/indices?v' -u elastic:yourstrongpasswordhere

health status index                             uuid                   pri rep docs.count docs.deleted store.size pri.store.size
green  open   .triggered_watches                m-l01yMmT7y2PYU4mZ6-RA   1   0          0            0      6.5kb          6.5kb
green  open   .watcher-history-10-2020.01.10    SX3iYGedRKKCC6JLx_W8fA   1   0       1523            0        2mb            2mb
green  open   .management-beats                 ThHV2q9iSfiYo__s2rouIw   1   0          6            1     40.5kb         40.5kb
green  open   .ml-annotations-6                 PwK7Zuw7RjytoWFuCCulJg   1   0          0            0       283b           283b
green  open   .monitoring-kibana-7-2020.01.10   8xVnx0ksTHShds7yDlHQvw   1   0       1006            0    385.4kb        385.4kb
green  open   .monitoring-es-7-2020.01.10       CZd89LiNS7q-RepP5ZWhEQ   1   0      36412          340     16.4mb         16.4mb
green  open   .apm-agent-configuration          e7PRBda_QdGrWtV6KECsMA   1   0          0            0       283b           283b
green  open   .ml-anomalies-shared              MddTZQ7-QBaHNTSmOtUqiQ   1   0          1            0      5.5kb          5.5kb
green  open   .kibana_1                         akgBeG32QcS7AhjBOed3LA   1   0       1105           28    687.1kb        687.1kb
green  open   .ml-config                        CTLI-eNdTkyBmgLj3JVrEA   1   0         22            0     56.6kb         56.6kb
green  open   .ml-state                         gKx28CMGQiuZyx82bNUoYg   1   0          0            0       283b           283b
green  open   .security-7                       krH4NlJeThyQRA-hwhPXEA   1   0         36            0     83.6kb         83.6kb
green  open   .logstash                         7wxswFtbR3eepuWZHEIR9w   1   0          0            0       281b           281b
green  open   .kibana_task_manager_1            ft60q2R8R8-nviAyc0caoQ   1   0          2            1     16.2kb         16.2kb
yellow open   filebeat-7.5.1-2020.01.10-000001  1-RGhyG9Tf-wGcepQ49mmg   1   1          0            0       283b           283b
green  open   .monitoring-alerts-7              TLxewhFyTKycI9IsjX0iVg   1   0          6            0     40.9kb         40.9kb
green  open   .monitoring-logstash-7-2020.01.10 dc_S5BhsRNuukwTxbrxvLw   1   0       4774            0      1.1mb          1.1mb
green  open   .watches                          x7QAcAQZTrab-pQuvonXpg   1   0          6            6    120.2kb        120.2kb
green  open   .ml-notifications-000001          vFYzmHorTVKZplMuW7VSmw   1   0         52            0     81.6kb         81.6kb
Теперь пора посетить нашу панель управления (dashboard) Kibana. Откройте браузер и введите URL-адрес http://your-ip-addr-here:5601. Теперь введите заранее заданные имя пользователя и пароль; в нашем случае это elastic и yourstrongpasswordhere соответственно.
В панели управления Kibana перейдите на вкладку «Management» (Управление) и в разделе «Kibana» нажмите «Index Patterns» (Шаблоны индекса). В первой строке вы найдете индекс filebeat-*, который уже был идентифицирован Kibana.

Теперь перейдите к тегу Discover на панели инструментов Kibana и просмотрите логи контейнеров вместе с метаданными в соответствии с выбранным шаблоном индекса, который может выглядеть примерно так:
Заключение:
Вот вы и установили и настроили стек ELK Stack на своей хост-машине, которая собирает необработанные логи из вашего Docker в стек, который позже можно будет проанализировать или использовать для отладки приложений.
Об авторе — Судип — основатель Javelynn и Solution Architect с более чем 15-летним опытом работы. Он любит делиться своими знаниями, регулярно пишет для Hackernoon, DZone, Appfleet и многих других ресурсов. А если он не занят этим в данный момент, он наверняка рыбачит или играет в шахматы.
Узнать подробнее об экспресс-курсе ELK.Смотреть онлайн-встречу с преподавателем экспресс-курса ELK.
Introduction
Logging is an essential part of containerizing applications as it helps developers keep track of patterns, troubleshoot issues, and fix bugs. Docker offers built-in logging solutions and additional features that ensure effective log management.
Read on to learn about Docker container logs, the commands they relate to, and best practices developers can apply.
Where Are Docker Container Logs Stored?
Docker logs fetch the command’s stdout (normal output) and stderr (error messages) streams. All output and error messages are logged, passed to the container’s logging driver and forwarded to the desired location (a file, a log collector, or a log management service).
The default logging driver for Docker is the JSON-file driver that stores logs on the host. Locate the files in the following directory:
/var/lib/docker/containers/ID/ID-json.logReplace the ID in the path with the ID of the container.
Docker Command for Checking Container Logs
The docker logs command instructs Docker to fetch the logs for a running container at the time of execution. It only works with containers utilizing the JSON-file or journald logging driver.
The command syntax for retrieving container logs is:
sudo docker container logs [option] container_idReplace container_id with the ID number of the container you want to inspect. To find the container ID, use the docker ps command to list running containers.
In the example below, Docker is running a MySQL container with the ID ebebb5c7ae0d. To display its logs, run:
sudo docker logs ebebb5c7ae0dAs in the image below, Docker responds by listing the event logs for that specific container in the output.
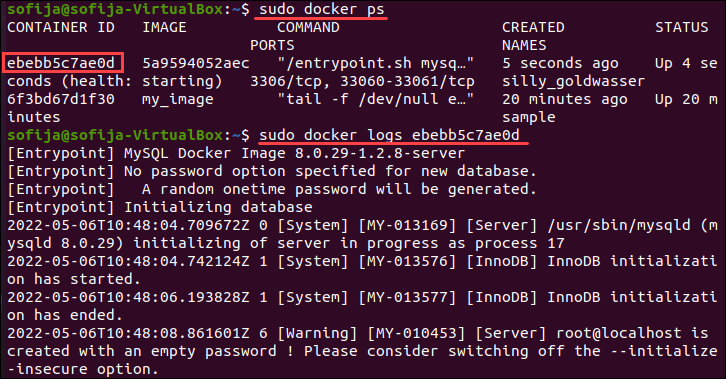
Docker Container Logs Command Options
Docker allows adding options to the command to configure the output according to individual needs.
The available command options include:
| Command Option | Description |
|---|---|
--details |
Display additional details provided to logs. |
--follow, -f |
Follow log output. |
--since |
Display logs since a specified timestamp (e.g. 2022-05-06T14:48:33Z) or relative (e.g. 20m). |
--tail, -n |
Specify the number of lines to show from the end of the logs. |
--timestamps, -t |
Show timestamp. |
--until |
Display logs before a specified timestamp. |
Docker provides multiple logging mechanisms for tracking and managing logs, some of which are built-in and set up by default.
Consider the following recommended approaches and best practices that help keep container logs on-point and secure.
Choose a Docker Logging Driver
Docker provides built-in logging drivers within containers to serve as log management systems. The driver reads the container output (the data broadcast by its stdout and stderr streams), formats the logs, and stores them in a file on the host machine or a defined endpoint.
The type of driver determines the format of the logs and where they are stored. By default, Docker uses the JSON-file driver, which writes JSON-formatted logs on the container’s host machine. You can use other built-in drivers to forward collected records to logging services, log shippers, or a centralized management service.
If none of the existing drivers meet your requirements, Docker allows you to create a custom logging driver, add it as a plugin to a container and even distribute it through a Docker registry.
Note: To run a container and use a different logging driver, add the --log-driver option to the docker run command and specify the wanted driver.
Select a Delivery Mode
Delivery modes determine how messages are prioritized and delivered to the log driver from the container.
Docker has two delivery modes:
- Direct, blocking delivery. Blocking is the default mode that sends all messages directly to the driver, interrupting the application when a new message occurs. This option ensures all output is immediately logged, but it can potentially affect application performance and cause latency if the logging driver requires more time to block.
- Non-blocking delivery. Non-blocking is a delivery mode that includes an intermediate ring buffer within the container where logs are stored until the logging driver processes them. If the logging driver is busy, the logs are kept in the in-memory ring buffer and passed on only until the driver is ready to process them.
Important: Although non-blocking helps prevent latency, it can potentially lead to data loss. If the buffer memory is full, the oldest message is dropped, even if it has not been delivered to the logging driver.
Note: Docker utilizes the blocking delivery mode by default. To log messages in the non-blocking mode, add the mode=non-blocking attribute to the docker run command when spinning up the container.
Logging via Application
Application-based Docker logging includes managing and analyzing logging events using the application’s framework. This means Docker logs are handled and stored inside the application’s containers.
The main advantage of utilizing logging via application is that developers gain more control over the logging events. On the other hand, saving logs inside a container is not recommended because of its transient nature. If a container shuts down, its filesystem is destroyed.
Configure persistent storage or transmit logs to a remote management solution to ensure persistency.
Logging Using Data Volumes
Keeping Docker logs within a container may result in data loss if the container shuts down. One way of solving this issue is to use data volumes as persistent storage for log events.
Docker volumes are file systems stored on the host and mounted on Docker containers to preserve data generated by the running container. Volumes are independent of the container life cycle, which means the data is secure even if the container fails. Additionally, its independence means you can easily copy, backup, and share file systems between containers.
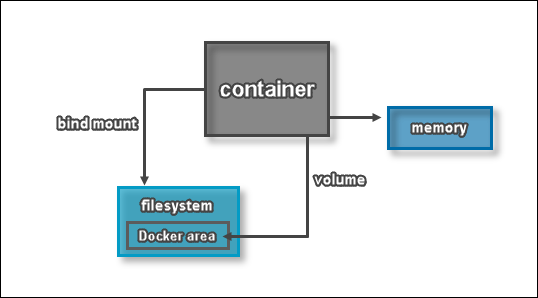
Use Dedicated Logging Container
Collect and manage Docker logs using a dedicated logging container that is not dependent on the host machine. This container collects the log files from the Docker environment, monitors and inspects the logs before sending them to a centralized location.
As the logging container is an independent unit, you can easily move it between different environments. What’s more, scaling the logging infrastructure is straightforward — if needed, add new logging containers to the existing setup.
Another great advantage to utilizing dedicated logging containers is that they do not require installing a configuration code. On the other hand, the application and logging containers must be correctly defined to ensure smooth automated loggings.
Apply the Sidecar Approach
The sidecar approach is one of the most popular methods of managing microservice architecture for more complex deployments.
Sidecars are services deployed alongside the parent application within a container as a secondary process. They share the volume and network with the primary container and ultimately increase the app’s functionality.
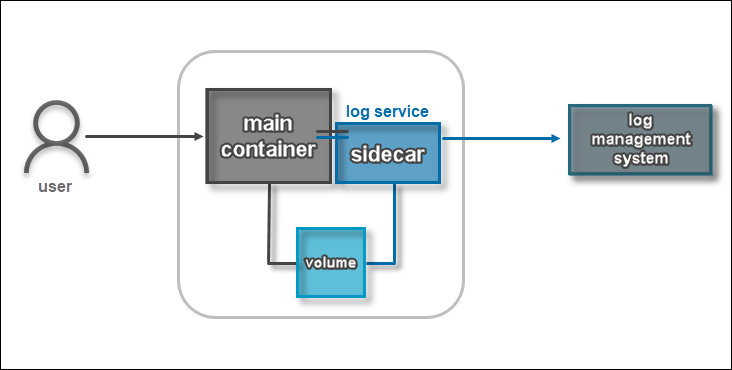
Each application has its own dedicated container as a log service customized for and tailored to the program. The logging container saves log files to the volume, labels, and ships them to a third-party log management solution.
Important: The primary (application) container and the sidecar (logging) container must work as a single unit to prevent any potential data loss.
Managing Docker logs using the sidecar approach simplifies identifying and tracking the origin of each log through the use of custom tags. On the other hand, the sidecar method is more complex and requires more resources than the dedicated logging solution.
Conclusion
After reading this article, you should have a better understanding of how Docker logs work, how to use the basic commands for working with them, and what the best practices for managing Docker logs are.
To learn more Docker commands you will most certainly use while working with containers, check out our List of Docker Commands: Cheat Sheet.