To view Error Log of Eclipse follow the below steps,
- Go to: Window > Show View > Others…,
- Now in «type text filer» searh for «Error Log»,
- Click on Open and you should see the error log tab.
Error Log
Under the Error log tab you should be able to see filters such as:
- Message: Displays the short description of the error/warning/info
- Plugin-in: Name of the plugin that the message is displayed for,
- Date: Date and Time on which the error was displayed.
The logs can be sorted based on Message, Plug-in ID, or Date in either ascending or descending order by clicking on the column headers.
The logs can also be grouped based on Session or Plugin ID.
Log Filter Eclipse
You can make use of the log filters option to display only specific event types: OK, Information, Warning, or Error. The number of visible events can also be changed — the default is 50. The maximum size of logs is 1 MB by default — this can be changed here as well.
Error Events can further be filtered based on «All events» or «Most recent events». One can also add filters to hide stack trace elements by adding them using the Add button.
See more details Eclipse Error Log Event
When you double click on any event message — you would see a pop-up that displays more details for the error log as below.
Eclipse Error Log Event Details
- Plugin: Name of the eclipse plugin
- Severity: Event Severity — Info/Warning/Error
- Date: Date and Time of the Event.
- Message: Detailed summary fo the event.
- Exception Stack Trace: Displayed if there is (Java) stack trace related to the event.
- Session Data: data related to the session.
Example:
eclipse.buildId=4.19.0.I20210303-1800
java.version=15.0.2
java.vendor=Oracle Corporation
BootLoader constants: OS=macosx, ARCH=x86_64, WS=cocoa, NL=en_US
Framework arguments:  -product org.eclipse.epp.package.java.product -keyring /Users/code2care/.eclipse_keyring
Command-line arguments:  -os macosx -ws cocoa -arch x86_64 -product org.eclipse.epp.package.java.product -keyring /Users/code2care/.eclipse_keyring
How to export Eclipse Error Log?
Error log can be exported by right-clicking on an event and selecting the option Export Log… by default the log will be saved with a .log extension.
How to copy the Eclipse Error Log?
Error log can be copied by simply right-clicking on the event message and selecting the option Copy. The log details will be copied to the clipboard.
Have Questions? Post them here!
Jump to: navigation,
search
Whenever it encounters a problem that does not warrant launching a dialog, Eclipse saves a report in the workspace log file. The log file can be looked at in four alternative ways.
- Window > Show View > PDE Runtime > Error Log. This gives you a view with the contents of the .log file.
- Help > About Eclipse Platform > Configuration Details. This prints out a great number of details about the environment and also concatenates the .log file. Great for including in a bug report.
- Locate the file yourself, see workspace/.metadata/.log or eclipse/configuration/*.log
- Start Eclipse using -consoleLog. This will print the messages that normally go to the .log file in the enclosing shell/command window.
When the Java VM suffers a hard crash, it produces a separate logging file named something like hs_err_pidXXXXX.log. These files are also helpful for diagnosing problems.
See Also:
- FAQ How do I use the platform logging facility?
This FAQ was originally published in Official Eclipse 3.0 FAQs. Copyright 2004, Pearson Education, Inc. All rights reserved. This text is made available here under the terms of the Eclipse Public License v1.0.
I installed eclipse oxygen (4.7.0) «Eclipse IDE for Java Developers».
After installation I mentioned that «error log» view is not available any more.
I restarted eclipse multiple times and used also other workspaces.
How can I get back the error log view?
asked Aug 25, 2017 at 8:04
![]()
Did you try resetting whichever perspective you are using ?
(Window -> Reset perspective…)
answered Aug 25, 2017 at 8:08
![]()
1
I have found a solution: Just install Eclipse SDK by
Help->Install New Software…

After this is done restart eclipse and you got back the error log view.
answered Aug 25, 2017 at 8:15
![]()
de-jcupde-jcup
1,1578 silver badges25 bronze badges
1
The Error Log View is missing on a default installation of the Eclipse Platform Runtime. I assume this was missing from the «Eclipse IDE for Java Developers» package for Eclipse Oxygen either (I didn’t test myself).
For sure, I’m experiencing this problem in 2018-09 and 2018-12 if I install the Eclipse Platform Runtime Binary (the bare-minimum Eclipse runtime I know of).
I opened bug 543120 for this.
I don’t have tested the hexadez suggested workaround, because having to install the whole Eclipse SDK just to have this view is too much for me.
Another workaround I found is to install the bundle «Mylyn Context Connector: Eclipse IDE» from the 2018-09 or 2018-12 update sites: it’s a much smaller compromise.
answered Jan 2, 2019 at 12:03
![]()
Mauro MolinariMauro Molinari
1,1942 gold badges13 silver badges23 bronze badges
3
Содержание
- Eclipse Logging- Tutorial
- Learn more in the Learning Portal. Check out our
- 1. Eclipse Logging
- 1.1. Platform logging
- 1.2. Logger service
- 2. SLF4J in eclipse applications
- 2.1. Obtaining the SLF4J library from Orbit
- 2.2. Using SLF4J
- 2.3. Configuring Logback
- Logging
- General Logging
- Logging Exceptions
- Platform UI Error Handling
- Contents
- Use cases
- Issue to solve
- See the error
- What does it mean to me the user?
- What can I do next?
- Status manager & Status handlers
- Status manager
- Styles
- Status handlers
- StatusAdapter
- The facility and Platform
- WorkbenchStatusHandler and IDEWorkbenchStatusHandler
- Error Messages: User Interface
- Error Messages User Interface Use Cases
- Eclipse mapping
- Use cases
- Main requirements
- New StatusDialog
- Overview
- Use cases
- Usage
Eclipse Logging- Tutorial
Using Eclipse logging. This tutorial gives an overview how to do logging in an Eclipse application.
Learn more in the Learning Portal. Check out our
1. Eclipse Logging
1.1. Platform logging
The Platform class provides simple logging API.
1.2. Logger service
The org.eclipse.e4.core.services plug-in contains the Logger class. An instance of this class can get injected via dependency injection. The default implementation is provided by the WorkbenchLogger class.
The Logger implementation wraps the IStatus into an simpler interface and provides several methods to log info, warning or error message. The following code shows example calls.
Customers can replace the WorkbenchLogger implementation in the Context with there own implementation. This way customers could log to the Eclipse system as well as to other external log systems.
The log level can be setup in the config.ini file of your application via the eclipse.log.level parameter. The value can be set to INFO, WARNING and ERROR, INFO will for example show all log message.
By default Eclipse logs all messages.
In case dependency injection is not available in the class where logging is requested, the logger can be obtained by using the service API:
2. SLF4J in eclipse applications
Many Java developers are more familiar with the SLF4J logging facade, which is more powerful than Eclipse’s default logger.
2.1. Obtaining the SLF4J library from Orbit
The Eclipse Orbit Project provides many different open source libraries, which can be obtained as OSGi bundles from Obrit’s p2 update sites. This makes it easy to use third party open source libraries for target definitions and a Maven Tycho build.
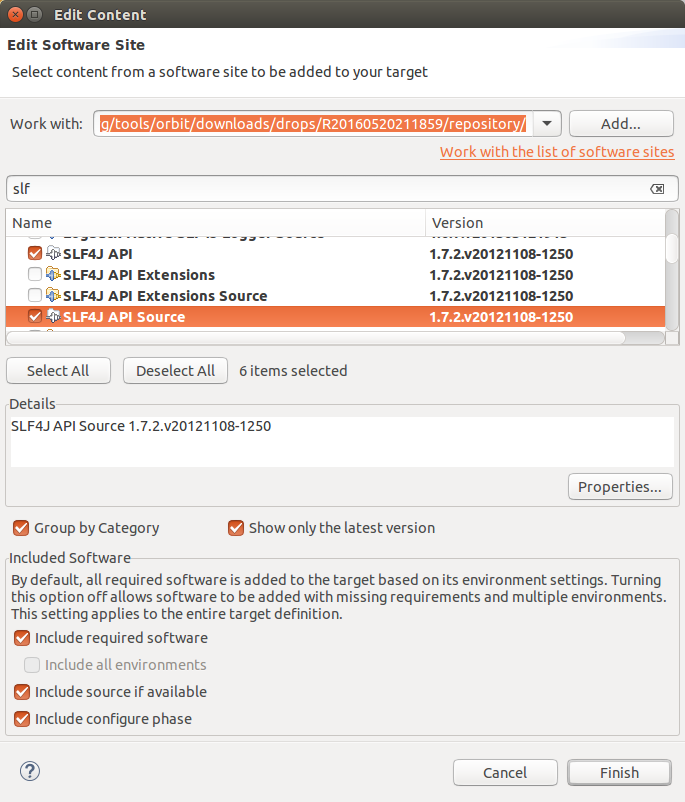
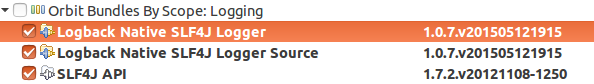
One of the most popular slf4j implementations is the Logback logger, which is also available on Orbit’s p2 update site.
The Orbit p2 update sites URLs change quite regularly. Therefore it is recommended to look in the Orbit downloads section to find the right p2 update site URL.
2.2. Using SLF4J
The SLF4J dependencies just have to be added to the desired bundle.
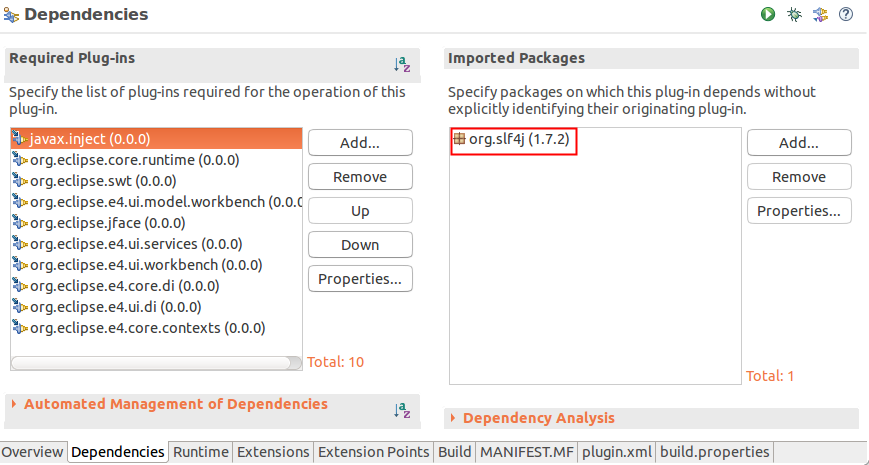
After doing this the SLF4J logger API can be used in the classes of the bundle.
It saves a lot of effort, when a Template for the creation of this LOG instance is created.
2.3. Configuring Logback
Usually Logback is configured by a logback.xml or logback-test.xml file. (see Logback configuration manual)
In an OSGi environment it is not that easy for Logback to automatically determine where the logback.xml logger configuration is stored.
For Logback the ch.qos.logback.classic.joran.JoranConfigurator is used to parse the logback.xml configuration file.
By obtaining the ch.qos.logback.classic.LoggerContext and using the JoranConfigurator the location of the logback.xml file can be set programmatically.
In some cases it is pretty handy to have this logback.xml logger configuration in the configuration folder of the RCP application rather than bundled in a JAR file. So logback.xml logger configuration can easily be changed in a production environment if necessary. The local version of the logback.xml is still kept so that the developer does not have to copy the logback.xml file manually to the Platform.getInstallLocation() location.
How to provide external static files like a logback.xml file for a product build with Maven Tycho can be found here: Eclipse Tycho Tutorial
The LOG_DIR property, which is overridden in the code above, can be obtained like this:
Источник
Logging
General Logging
Eclipse ICE uses has two different standards for logging: logging in production source code and logging in tests. Logging in tests should be done using System.out and System.err since tests are not generally production code and are never distributed with the final product. Indeed, using a real logging service in the tests could make it harder to monitor test behavior.
Logging in production source code is done using SLF4J instead of shipping it to System.out or System.err. To be completely honest, we used System.out and System.err for over three years, but finally decided to put on our grown-up pants and use a real logging service. Logging to System.out and System.err was convenient, but it required that we always display a console and finding the log output was very confusing for users. Switching to a service allows us to simultaneously write to a file and to the Eclipse Error Log View.
There are lots of good examples of using the Logger in the source code, with a very simple one being our singleton for holding a reference to the Client service, the ClientHolder class.
SLF4J must be imported in the bundle’s MANIFEST.mf file before if can be used.
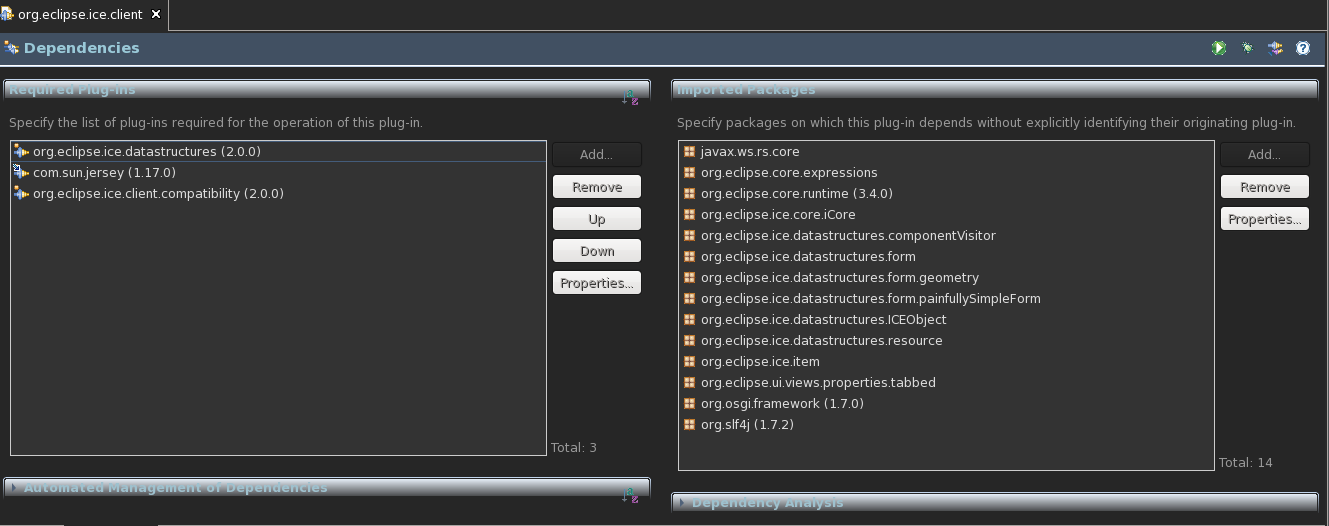
Declaring and using a logger is straightforward. It requires two imports
and can be declared as such
Messages can be log at multiple levels,
Loggers should be declared as shown above, in general, but there are special cases where declaring them differently is better. The ICEObject class is a good example of where a logger can be declared protected and final, but not static, so that it can be used by subclasses without explicitly declaring it them.
Logging Exceptions
It is acceptable to use e.printStacktrace() in tests, but in the production code something like the following should be used
because it will log the exception to a file and mark it as a serious error in the error log view.
Exceptions should never be marked as info or debug.
Источник
Platform UI Error Handling
This proposal is for error messages only. It does not include Log, trace or Application Life Cycle linked to errors in a software application. Yet, this proposal should fit very nicely in above mentioned features.
Contents
Use cases
We will use 4 different customers to ensure the proposal is scalable
- BigCompany is using Eclipse 3.3. They decide to buy different features from different companies. They want an AJAX feature from company AjaxWorldCom and they decide on a database tooling feature from SQLForever Company. All user will have the same desktop feature and all call should be routed to the BigCompany’s help desk. Users do not have access to the web.
- TaxInc develops an Tax Solution software. It has RCP clients and a server. TaxRUS bought the tax solution. They installed a server internally and deployed the RCP client to 250 employees around the world. The employees are not developers. They just use the RCP application to do Tax related tasks. They have an internal help desk.
- BigSoftware develops a set of Eclipse feature for a product named: J2EE development 13.0. User can buy the product off the shelf or order a large amount of products and install them in their enterprise. BigSoftware has a huge support center. BigSoftware also ships 3rd party features it supports in its tooling.
- John is a Java Perl developer. He downloaded Eclipse 3.3 and a Perl feature from the open source web site.
Issue to solve
This is the main issue to solve for the 4 customers
When an error occurs in the tooling (Error message, error dialog, error in the console view, error in the log view, error in the job dialog or any other error), Eclipse needs to provide a way for the users to:
- see what the error is
- understand what it means to the them
- how can they act on the error.
The behavior for each is based on policies.
- The feature who threw the error should have a chance to handle the error and help the customer.
- The feature should have an idea about what the error handler wants it to do.
- i.e. when there is an error opening a view should we show the error view or not
- also do we prompt when the workbench layout cannot be reset?
- The product/branding that is installed can override all feature’s behavior it ships and manage or delegate to them as appropriate.
See the error
It is very important to distinguish between expected and unexpected error.
- Expected Error is when a developer expects the exception to be thrown in particular situation (network not available, resource locked by another person, invalid license etc).
- Unexpected Error is an error that should not happen (internal error, NPE etc).
Generally expected errors should come with idea how to solve the problem, while it should be easy to report unexpected one and/or to get workaround.
When an error occurs, the developer may decide to show the error to the user. The code is opening an error dialog. However handler may ignore developer request and handle the error in different way, f.e. log it. Before opening the error dialog, and based on the policy, the flow can be re-routed and the error dialog may never show up like the developer intended to. There should be a hook in the code, based on policy that will express manage the behavior.
What does it mean to me the user?
Most users are not interested in the ‘stack trace’ of the error. When a user sees an error or actively double clicks on an error we ought to see the information on how to solve the error (without technological background). This presumes the feature or the product or the company provided the data the user can understand and that the associated policy allows such data to be shown.
What can I do next?
Based on the policy, it is the responsibility of the feature provider (component provider), the product provider or the company to decide what the ‘what to do next’ action will do. Eclipse could still provide a ‘show log’ button that policy provider can extend (this is a nice to have…)
Status manager & Status handlers
Status manager
StatusManager is the entry point for all statuses to be reported in the user interface. Handlers are not intended to be used directly. They should be referenced via the StatusManager which selects the handler corresponding to the product to apply. Right now it is impossible to have more than one handler per product because of scalability issues.
The following methods are the API entry points to the StatusManager
The StatusManager singleton is accessed using
The int parameter are for supplying style for handling. See Acceptable styles.
NOTE! the style is a suggestion and may not be honoured by the current handler. For instance a handler may choose to not show the user anything when the SHOW flag is sent. See Status handlers for more details.
The StatusManager gets it’s list of handlers from the extension point org.eclipse.ui.statusHandlers . Should none of those handlers process the status it will fall through to the default handler (the the SDk this is WorkbenchAdvisor#getWorkbenchErrorHandler() ). If a handler is associated with a product, it is used instead of this defined in advisor.
Styles
Below is a list of StatusManager styles which can be combined with logical OR.
- NONE — a style indicating that the status should not be acted on. This is used by objects such as log listeners that do not want to report a status twice
- LOG — a style indicating that the status should be logged only
- SHOW — a style indicating that handlers should show a problem to an user without blocking the calling method while awaiting user response. This is generally done using a non modal dialog
- BLOCK — a style indicating that the handling should block the calling method until the user has responded. This is generally done using a modal window such as a dialog
Status handlers
Status handlers are part of the status handling facility. The handlers are responsible for presenting statuses by logging or showing appropriate feedback to the user (generally dialogs). All status handlers extend org.eclipse.ui.statushandlers.AbstractStatusHandler which requires each handler to implement handle(StatusAdapter status, int style) . This method handles statuses based on a handling style. The style indicates how status handler should handle a status. See Acceptable styles.
There are two ways for adding handlers to the handling flow.
- using extension point org.eclipse.ui.statusHandlers
- by the workbench advisor and its method <@link WorkbenchAdvisor#getWorkbenchErrorHandler()>.
If a handler is associated with a product, it is used instead of this defined in advisor.
A status handler has the id and a set of parameters. The handler can use them during handling. If the handler is added as an extension, both are set during initialization of the handler using elements and attributes of statusHandler element.
WARNING! We have to take the extra action when something has to be logged using the default logging mechanism, because the facility is hooked into it. See Hooking the facility into Platform. For this special case the status manager provides API.
And below is the example of addLoggedStatus(IStatus status) proper usage.
StatusAdapter
The StatusAdapter wraps an instance of IStatus subclass and can hold additional information either by using properties or by adding a new adapter. Used during status handling process.
The facility and Platform
The places where the facility is hooked in
- WorkbenchAdvisor#eventLoopException(Throwable) — it handles all uncaught exceptions from main application loop
- Jobs framework
- Error log file (all logged messages are forwarded to the facility with the LOG style)
- Exceptions from opening a part (the error view and error editor)
Platform is still under refactoring aimed at introducing the status handling facility.
WARNING! The facility isn’t hooked into JFace ErrorDialog or MessageDialog in any way. The code has to be refactored if the facility is to be used.
should be refactored into
WorkbenchStatusHandler and IDEWorkbenchStatusHandler
There are two implementation of status handlers
- org.eclipse.ui.application.WorkbenchErrorHandler which is assigned to WorkbenchAdvisor
- org.eclipse.ui.internal.ide.IDEWorkbenchErrorHandler assigned to IDEWorkbenchAdvisor
The current advisor indicates which handler is the workbench one.
Error Messages: User Interface
Error Messages User Interface Use Cases
There are three types of user interfaces that will present a message, an error or a warning to a user. The three categories are
- Message that requires user’s action now
- Message that requires user’s action that can be done later
- List of messages.
Message that requires action now.
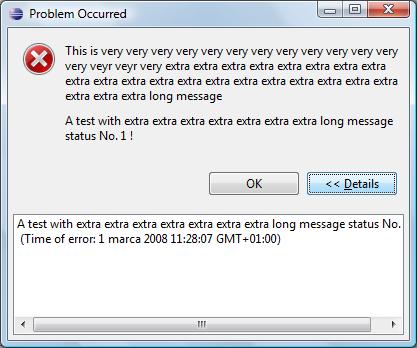
They are typically represented in a modal dialog box. The user has to act on it or he/she will not be able to finish the task. Such a dialog should provide a standard view with an icon and a message. The message can provide an advanced view, in which case a ‘details’ or ‘advanced’ button is present on the standard view. When the user selects the details button, the advanced information about the message are displayed. The provider of the message or the Error handler will provide the user interface that will be embedded in the dialog. The user can pres the details button again, and this will collapse the advanced view. Messages must be persisted in an external file. The message in the modal window is the most relevant to the user and is decided by the ErrorHandler. If the message has offspring, they will be rendered in the advanced user interface.
Message that can have action later.
They are messages that can be error, but do not prevent the user from pursuing his/her task. All message may need to be solved at a certain point, but do not require immediate action. They are usually represented by information and icon in the user interface. The user can finish some other part of the interface before solving the message. Concrete examples are wizard pages and editors. In wizard pages the message is presented at the top of the page, in an editor it is usually embedded in the form editor or on the side of the editor (right or left side) To get more information about the message, the user clicks on it. A modeless window opens with the information. When the user clicks elsewhere, the window closes. Messages do not have to be persistent. The owner of the user interface can decide to save them or decide to recalculate the messages when the user interface is reopened. The owner of the user interface can decide to not allow the task to be saved or finished if the message is not act upon.
The user is presented with a double pane view. One pane represents the list of messages. The user can filter them and reorganized them. Some filter could be based on the resources, the format (tree, table) or the dependency (ex: acting on this message will also resolve the following messages…). The filtering mechanism should be lighter in its usage than the current one. When the user selects a message, the second pane is filled with the details of the message. This will show the exact same information as #1. The messages are persistent. PS: the semantic of this user interface is like an ‘email reader’ where you select the email message to see the content of the email. A provider could replace the first pane of the list of errors. ErrorView and Problem view should be merged in a unique view.
Eclipse mapping
The user must act of them. The best practice is that only error message should appear to the user using this format. Warning and Information messages should not. The error handler can decide if a message is worth showing or not and will also provide the details.
Errors in a background process are of type 2.
We should not open a modal dialog when an issue occurs. The user can ‘glance’ in the result in the bottom right corner, click on it to see the list of errors and click on an error to see a detail.
Wizard messages are of type 1.
The user must act on them to go to the next page but also clicking on them will open a pop up. There is no ‘details’ button in the wizard user interface
Error log is of type 3
The view shows the different errors from the log. The user can click on an error in the list to see more details.
Use cases
The User Interface behavior will depend from the context of the error. If an error occurs during a Job, we will not prompt the user but rather notify the Job View. If the same error occurs in the plug-in itself, we will open a modal window.
The error manager framework must keep track of the context and if the error handler decides to show the error to the user, the Error Manager Framework should use the appropriate User Interface.
Context of the use cases
The plug-in is looking for a file named ‘result.txt’ on a web site. When executing, the plug-in is unable to connect to the web server. The plug-in throws an error using the error handler mechanism. The error is modified to notify the user that the remote site does not answer and that the user should check if there is any proxy of if the site is actually down.
Use Case 1 Modal Dialog
The framework realizes the context and opens an ErrorDialog. The ErrorDialog detail is filled with content from the plug-in error handler.
Use Case 2 Job Error
The framework realizes the context and modifies the user interface for the Job. A red ‘x’ appears in the bottom right hand corner of eclipse. The User double clicks on the red ‘x’ and a window opens, showing the message of the error. When the user clicks on the message; the framework opens a modal window like in use case #1.
Use Case 3 Wizard
The framework realizes the context and updates the top of the wizard with the message. When the user hovers over the message a pop up appears. If the user wants to see more details, a modal window opens.
Use Case 4 Error Log
The error handler decided to not show the user about the error. It decided to only log it. The error appears in the error log view. The user clicks on the entry and a modal dialog (like in #1) opens.
Main requirements
- shows list of the problems
- shows details of the problems
- shows view which helps user to handle or report the problems
Each problem on the list should have error reporting view associated to it. This relation can be set in error handler which handles the problem. This reporting view will be showed in the tray part of the dialog.
For workbench handler it can be simply a basic view with stack trace. For product handler it can be a html view with a form for registering the problem or for checking the state of the problem.
New StatusDialog
Overview
New Status Dialog is integrated with Status Handling facility. Unless no other handler is specified, the default dialog will be used.
- Message — This is the most important piece of information.
- Details — Sometimes there is not enough place to display all necessary info on the dialog, or we do not want to scary the user. Then we can place leading message on the dialog, and all other things make accessible via details area. Currently it is possible to set up one kind of details area provider, but there is no further requirement.
- Support — It is possible to place some contact form on the dialog, so the user will know where to look for help or will be able to easily contact vendor.
Support and Details are terms introduced to distinct the behavior and functionality although they extend common abstract class. One should remember that user expects more information after pressing «Details >>>» button.
Status Dialog uses following messages hierarchy:
- Job name (if available)
- StatusAdapter title
- IStatus message
- MultiStatus information (applies only if MultiStatus is handled).
- message extracted from exception
- exception name
Status Dialog displays always two the most important messages. If first one is not found then the dialog should give information about general error instead. If the second one is not found, dialog should point to the details.
- Only one status is handled
- First message displayed is the most important message.
- Second message displayed is the second most important message.
- Timestamp is displayed in the details (if available)
- More statuses handled — the selection list appears
- There is the most important message used on the selection list.
- The second most important message is displayed right to the severity icon.
- Timestamp (if available) is appended to the message in the selection list.
- Details area can be replaced — it does not display stack trace anymore, rather the error hierarchy (message from Status, Exception, Nested statuses, etc) by default. Product may decide to provide some high level description, or even retrieve description from database.
- Support area can be added — product may hook into the error dialog and place there f.e. browser with url pointing to the helpdesk, or some reporting mechanism.
The basic idea is that even unexperienced user should be able to understand what is going on while looking at details, and should be able to report/get help using support area.
- Only one status is reported. Primary message and secondary message should be displayed. Secondary message should have timestamp if one is available.
- Job reported an error. Display message informing which job, and primary message.

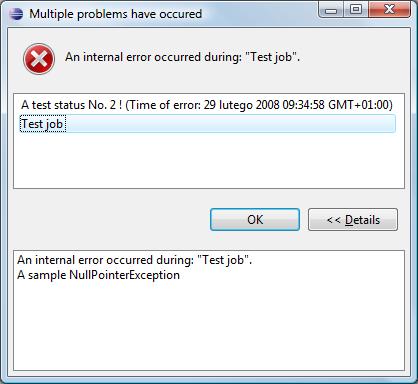
- Multiple errors occured. On the list should be displayed job name or primary message of the status. In the title primary message should appear for jobs and secondary for statuses.
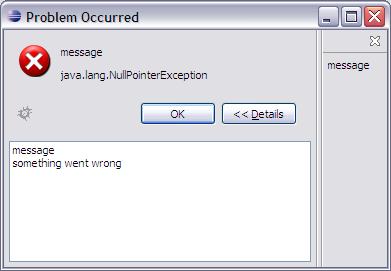
- One stastus has been reported and support is available.

after pressing bug icon:
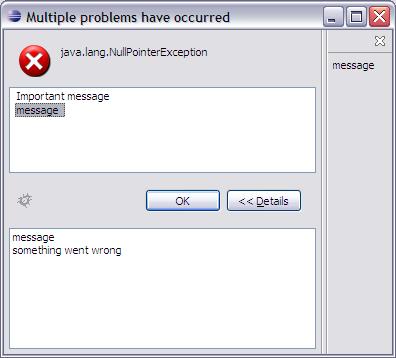
and many statuses. The selected in the list Status is a base for support area.
Use cases
Usage
Note for WorkbenchStatusDialog clients
Please note that WorkbenchStatusDialog#getPrimaryMessage & WorkbenchStatusDialog#getSecondaryMessage begin searching for the message from StatusAdapter title. It means that when we are handling job statuses we display:
- single status
- job name as the first message
- WorkbenchStatusDialog#getPrimaryMessage result as second message
- list
- job name (and eventually timestamp) as the position on the list.
- WorkbenchStatusDialog#getPrimaryMessage result right to the severity icon.
Источник
The ability to trace your program’s execution may prove invaluable when you are trying to hunt down an elusive problem. Although the Eclipse Java Debugger is a powerful tool, there are situations when it just cannot be used effectively. Even during regular program execution, various error conditions can occur, and not necessarily due to bugs in your code. Systematically logging these errors aids in diagnosing the conditions under which a particular error occurred.
Eclipse Error Log
The Eclipse runtime makes a standard logging facility available to all plug-ins. However, those familiar with logging frameworks commonly used in enterprise applications, such as Log4J, might be disappointed—Eclipse logging is far less powerful at the first glance. For instance, it uses its own flat-text format, provides rather limited API, and generally lacks configurability (for example, you can only log to the console, or a rolling file located at a fixed path under your instance area). That said, it is fit for its purpose, and if all else fails, you can always implement an alternative solution (see the Resources section for some pointers).

Figure 1: Platform Error Log view.
The easiest way to view your IDE’s error log is to open the Error Log view. It is not all too apparent where to find it, unless you’re in the PDE perspective—it is tucked away under the PDE Runtime category (also try pressing Alt+Shift+Q, L). Once you open it, you’ll see a table of log entries showing the status message (typically an error, but there are also warnings and information entries), the identifier of the plug-in that logged the entry, and the timestamp. Some entries may have “child” entries—this happens when multiple errors were grouped and logged together under one entry. Double-clicking an entry brings up the Event Details dialog, which also displays any attached exception stack trace, as well as your workbench session data.
You can also import and export a log to and from the view, respectively. If you’re curious what its actual file contents look like, you can open the log in a text editor by clicking Open Log from the view’s toolbar. In the filesystem, the log file is located in your workspace directory under .metadata/.log (note the leading dots).
Logging And Reporting Exceptions
To write to the Eclipse log, one must first obtain an instance of ILog. Each plug-in is provisioned with one for its own internal use. It can be obtained by calling Plugin.getLog(). All logging then is performed by calling log(IStatus). The argument is an instance of IStatus, which is used to represent the outcome of operations in Eclipse. As such, it is also used to carry detailed error information in CoreException, which is the standard checked exception used throughout Eclipse.
In most cases, you can use the Status class whenever you need to provide an IStatus (for instance, when throwing a CoreException). You also can subclass it to add application-specific data. If multiple status objects need to be aggregated and reported as one “super-status,” you can use the MultiStatus and add child status objects to it. When a MultiStatus is logged, its children are properly expanded.
Listing 1: Logging a CoreException generated outside of your plug-in.
...
} catch (CoreException e) {
  IStatus status = new Status(IStatus.ERROR,
      TracePlugin.PLUGIN_ID, 0,
      "Could not perform requested action.", e);
  TracePlugin.getDefault().getLog().log(status);
  ErrorDialog.openError(
      window.getShell(), "Error", null, status);
}
Note that it also is possible to listen to an individual plug-in’s logging requests. To do that, one would first obtain the plug-in’s log by calling Platform.getLog(Bundle), and then registering an ILogListener, which is notified every time an entry is logged. For notification of all logging requests regardless of the origin, register your listener by calling Platform.addLogListener(ILogListener).
In a typical usage scenario, a plug-in would catch an exception generated elsewhere. As part of processing the exception, it would create a Status object describing the outcome of the operation (its own, not the one that threw the exception) and attach the caught exception to it. Finally, it would log the status to its log. If the attached exception is a CoreException, the logger detects it and expands the resulting status hierarchy (in other words, it retrieves the exception’s status, and so on). Because the generated CoreException contains a status object created by the originating plug-in, it is not recommended (though quite tempting) to simply log the attached status to the receiver’s log. Doing so results in a loss of context—you know that a basic operation failed, but you don’t know where it was called and why. The attached example project illustrates the logging of various types of exceptions.
Optionally, the status object may be reused to report the error to the user by calling one of the ErrorDialog.openError(…) methods, which will pop up a standard error dialog capable of displaying status information. Note that as of version 3.3, a new service—StatusManager—is recommended for handling (that is, logging as well as reporting) exceptions. This service supports pluggable status handlers that can control the manner in which errors are logged and reported across the application.
Tracing Code Execution
In many logging frameworks, tracing is not much different from other kinds of logging. Typically, the same logging facilities also are used to capture the program’s execution trace. Tracing, however, often generates a large amount of detailed information and thus it is not normally enabled in production other than for debugging. In Eclipse, tracing is a rather specific activity. In fact, it doesn’t have all that much to do with logging. Rather, it has a lot to do with debugging.

Figure 2: Launching the example plug-in with tracing enabled.
Although there are no special facilities for logging trace messages (in fact, as horrible as it may sound, System.out.println() will often suffice), there is a special “debug mode” in which the platform can be launched. Plug-ins that support tracing must detect whether they are running in this debug mode (which, for good measure, has nothing to do with Java debugging) and only then generate trace messages. This is to avoid likely performance penalties, which are often incurred when tracing is enabled. Plug-ins may also query for “debug options,” which is a simple property-based mechanism for configuring tracing.
Typically, a plug-in would first call Platform.inDebugMode(). This returns true if the platform was launched with the -debug argument. By convention, the plug-in should also check if the debug option <pluginId>/debug evaluates to true by calling Platform.getDebugOption(«<pluginId>/debug»). This is considered the “root” debug option that determines whether a particular plug-in should enable tracing. Other arbitrary options may be used (by convention they should follow the pattern <pluginId>/debug/<option>). The PDE Launch dialog provides a Tracing tab that allows you to enable tracing (for example, launch the platform in “debug mode”) and configure debug options for each plug-in. A plug-in must advertise which options it supports by specifying their default values in a .options file (note the leading dot), which must be located in the plug-in’s root.
The example plug-in provided in the Resources section contains a small class (Debug) that can be used to implement simple tracing. Note that you should always check whether you are to generate a trace message before composing it, because not doing so could strain your resources unnecessarily. That is, rather than creating a generic trace method that takes arbitrary data to be logged and only then checks if tracing is enabled, do an if check before allocating any strings or other arguments for the message.
Example
The example plug-in provided in the Resources section demonstrates both logging and tracing. It contributes a top-level menu (Logging & Tracing) with actions that perform various logging and error reporting activities. The plug-in also supports several sample tracing options.
To get started, import the attached archive into your Eclipse SDK 3.3 as an Existing Project; click File -> Import, and then select General -> Existing Projects into Workspace. Provide the path to the downloaded zip file and click Finish.
To enable tracing for the plug-in, first create a launch configuration for it. Click Run -> Open Run Dialog, and then select Eclipse Application and click New. Go to the Tracing tab and check Tracing, and then select and check com.developer.tracing. Also, check all its debug options on the right. Figure 2 shows the configured Tracing tab. Click Run and observe debug messages in the console view as you invoke the various contributed actions.
Resources
- Source code for the example—import the archive into your Eclipse SDK 3.3 as an Existing Project
- Plug-in Development Environment Guide: Error Log
- Platform Plug-in Developer Guide: Eclipse runtime options
- Eclipse FAQ: How do I use the platform logging facility?
- Eclipse FAQ: How do I use the platform debug tracing facility?
- EclipseZone: Using Log4J in Eclipse Equinox/OSGi
About the Author
Peter Nehrer is a software consultant specializing in Eclipse-based business applications and development tools. He is the founder of Ecliptical Software Inc. and a contributor to several Eclipse-related Open Source projects. He holds an M.S. in Computer Science from the University of Massachusetts at Amherst, MA. Peter can be reached at pnehrer AT eclipticalsoftware DOT com.