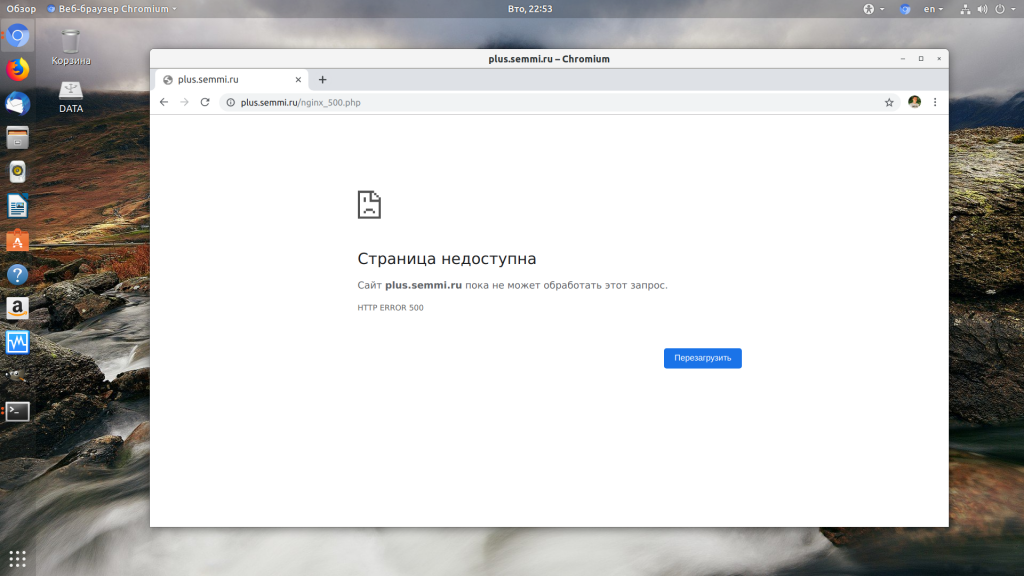
При разработке веб-сайтов и веб-приложений можно столкнуться с ошибкой 500 internal server error. Сначала она может испугать и ввести в заблуждение, поскольку обычно веб-сервер выдает более конкретные ошибки, в которых указана точная причина проблемы, например, превышено время ожидания, неверный запрос или файл не найден, а тут просто сказано что, обнаружена внутренняя ошибка.
Но не все так страшно и в большинстве случаев проблема вполне решаема и очень быстро. В этой статье мы разберем как исправить ошибку Internal server error в Nginx.
Дословно Internal server error означает внутренняя ошибка сервера. И вызвать её могут несколько проблем. Вот основные из них:
- Ошибки в скрипте на PHP — одна из самых частых причин;
- Превышено время выполнения PHP скрипта или лимит памяти;
- Неправильные права на файлы сайта;
- Неверная конфигурация Nginx.
А теперь рассмотрим каждую из причин более подробно и разберем варианты решения.
1. Ошибка в скрипте PHP
Мы привыкли к тому, что если в PHP скрипте есть ошибки, то сразу же видим их в браузере. Однако на производственных серверах отображение сообщений об ошибках в PHP отключено, чтобы предотвратить распространение информации о конфигурации сервера для посторонних. Nginx не может отобразить реальную причину ошибки, потому что не знает что за ошибка произошла, а поэтому выдает универсальное сообщение 500 internal server error.
Чтобы исправить эту ошибку, нужно сначала понять где именно проблема. Вы можете включить отображение ошибок в конфигурационном файле php изменив значение строки display_errors с off на on. Рассмотрим на примере Ubuntu и PHP 7.2:
vi /etc/php/7.2/php.ini
display_errors = On
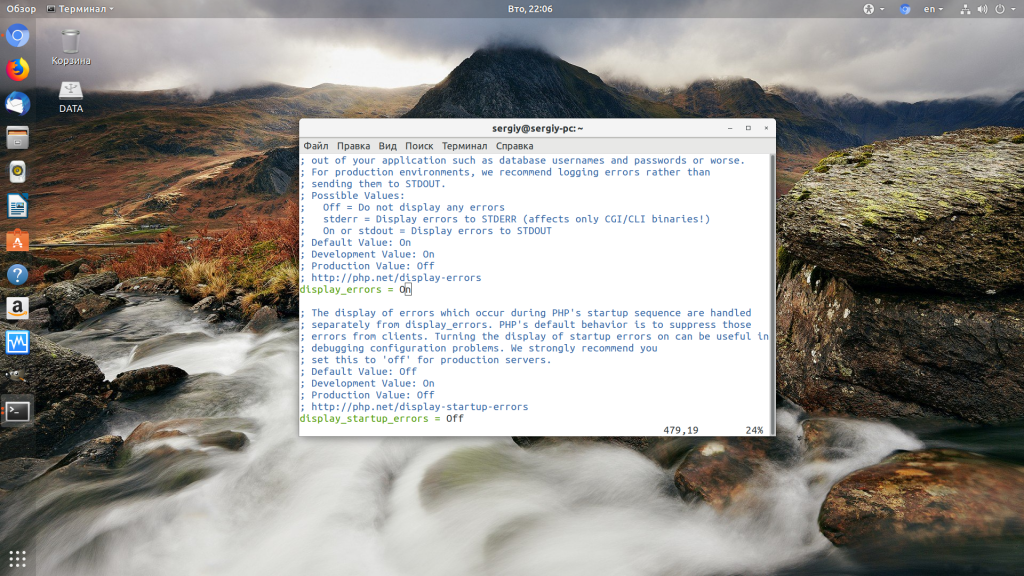
Перезапустите php-fpm:
sudo systemctl restart php-fpm
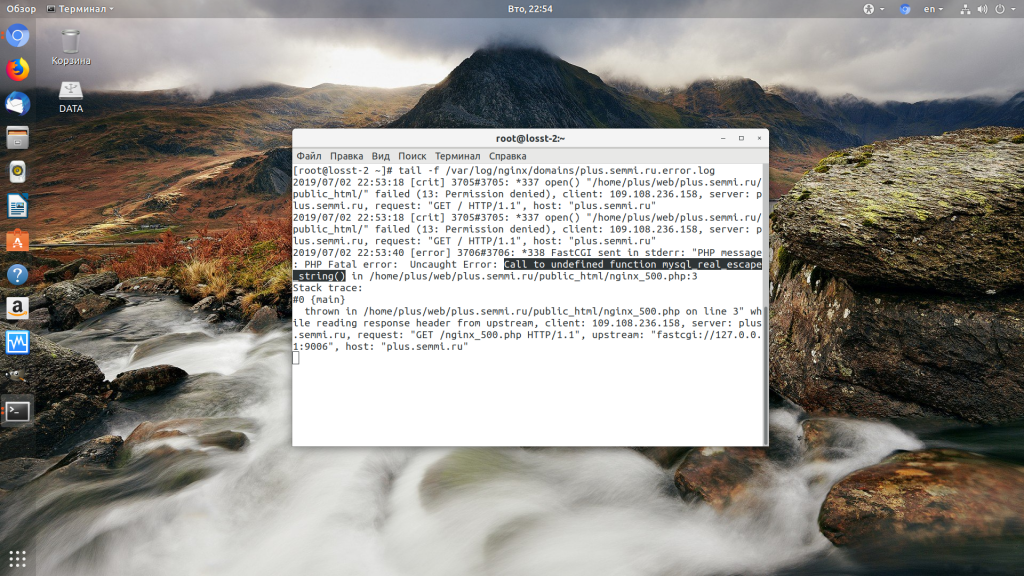
Затем обновите страницу и вы увидите сообщение об ошибке, из-за которого возникла проблема. Далее его можно исправить и отключить отображение ошибок, тогда все будет работать. Ещё можно посмотреть сообщения об ошибках PHP в логе ошибок Nginx. Обычно он находится по пути /var/log/nginx/error.log, но для виртуальных доменов может настраиваться отдельно. Например, смотрим последние 100 строк в логе:
tail -n 100 -f /var/log/nginx/error.log
Теперь аналогично, исправьте ошибку и страница будет загружаться нормально, без ошибки 500.
2. Превышено время выполнения или лимит памяти
Это продолжение предыдущего пункта, так тоже относится к ошибкам PHP, но так, как проблема встречается довольно часто я решил вынести её в отдельный пункт. В файле php.ini установлены ограничения на время выполнения скрипта и количество оперативной памяти, которую он может потребить. Если скрипт потребляет больше, интерпретатор PHP его убивает и возвращает сообщение об ошибке.
Также подобная ошибка может возникать, если на сервере закончилась свободная оперативная память.
Если же отображение ошибок отключено, мы получаем error 500. Обратите внимание, что если время ожидания было ограничено в конфигурационном файле Nginx, то вы получите ошибку 504, а не HTTP ERROR 500, так что проблема именно в php.ini.
Чтобы решить проблему увеличьте значения параметров max_execution_time и memory_limit в php.ini:
sudo vi /etc/php/7.2/php.ini
max_execution_time 300

memory_limit 512M
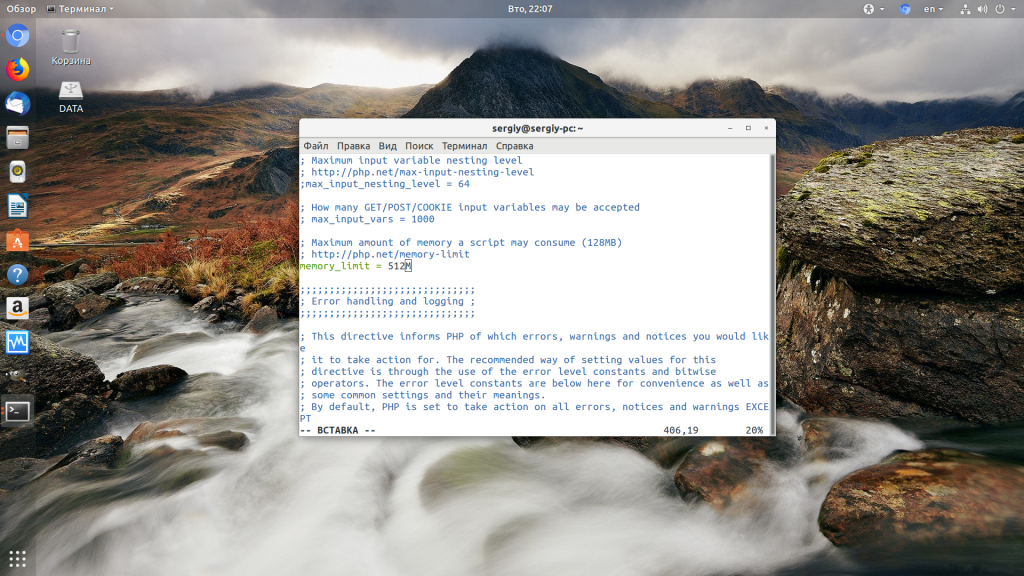
Также проблема может быть вызвана превышением других лимитов установленных для скрипта php. Смотрите ошибки php, как описано в первом пункте. После внесения изменений в файл перезапустите php-fpm:
sudo systemctl restart php-fpm
3. Неверные права на файлы
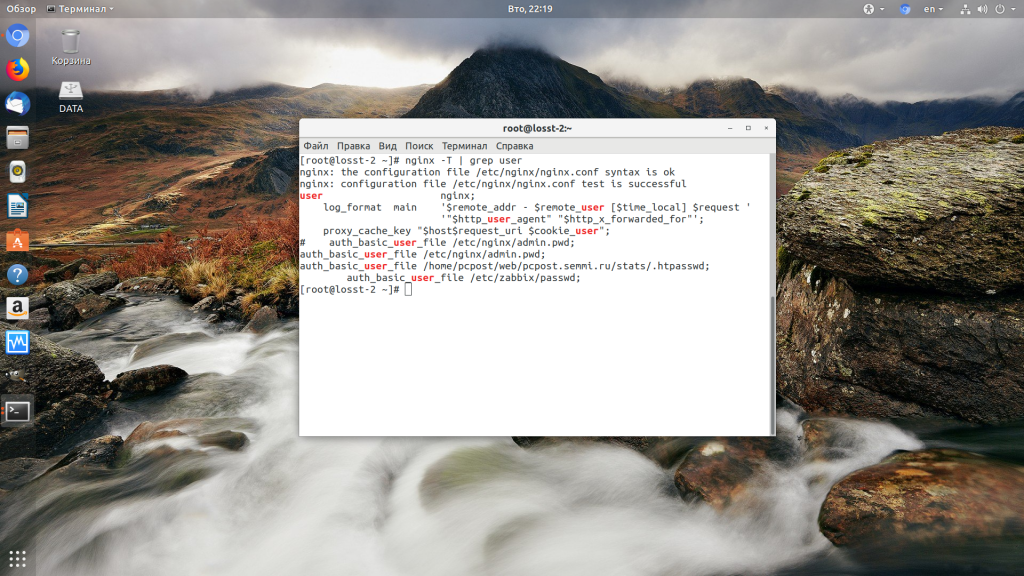
Такая ошибка может возникать, если права на файлы, к которым обращается Nginx установлены на правильно. Сервисы Nginx и php-fpm должны быть запущены от имени одного и того же пользователя, а все файлы сайтов должны принадлежать этому же пользователю. Посмотреть от имени какого пользователя запущен Nginx можно командой:
nginx -T | grep user
Чтобы узнать от какого пользователя запущен php-fpm посмотрите содержимое конфигурационного файла используемого пула, например www.conf:
sudo vi /etc/php-fpm.d/www.conf
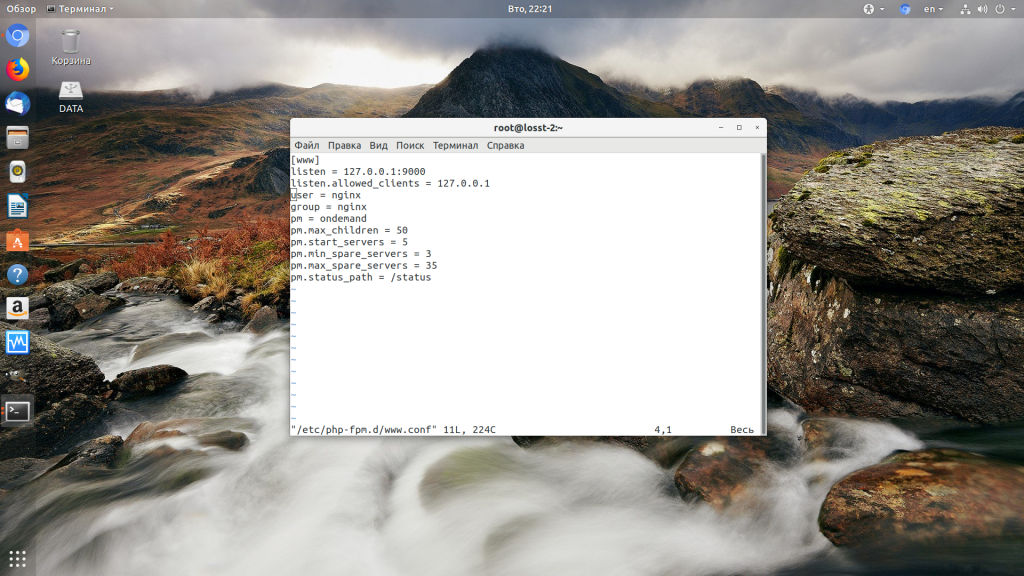
В моем случае это пользователь nginx. Теперь надо убедится, что файлы сайта, к которым вы пытаетесь обратиться принадлежат именно этому пользователю. Для этого используйте команду namei:
namei -l /var/www/site
Файлы сайта должны принадлежать пользователю, от имени которого запущены сервисы, а по пути к каталогу с файлами должен быть доступ на чтение для всех пользователей. Если файлы принадлежат не тому пользователю, то вы можете все очень просто исправить:
sudo chown nginx:nginx -R /var/www/site
Этой командой мы меняем владельца и группу всех файлов в папке на nginx:nginx. Добавить права на чтение для всех пользователей для каталога можно командой chmod. Например:
sudo chmod o+r /var/www/
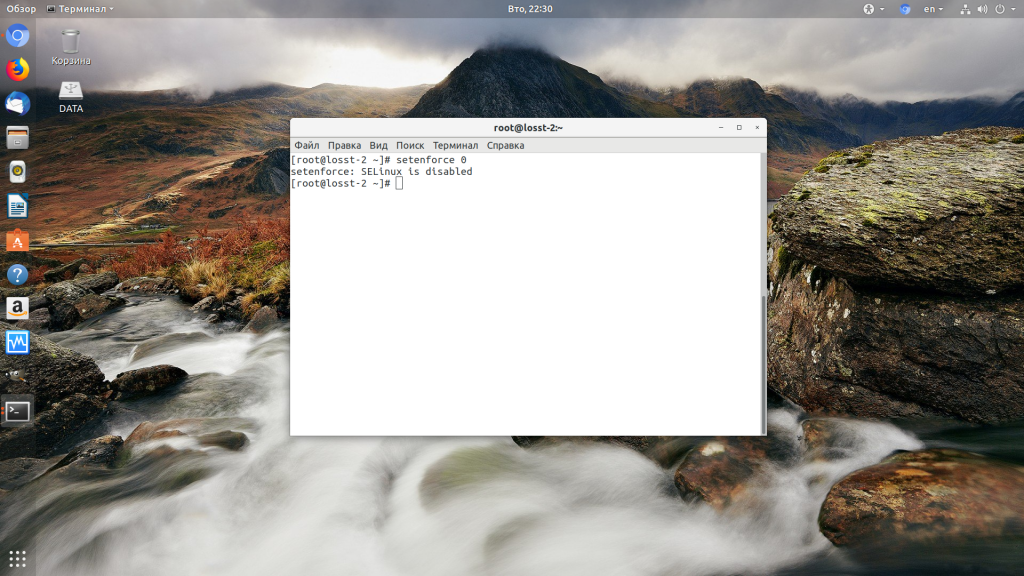
Далее все должно работать. Также, проблемы с правами может вызывать SELinux. Настройте его правильно или отключите:
setenforce 0
Выводы
В этой статье мы разобрали что делать если на вашем сайте встретилась ошибка 500 internal server error nginx. Как видите проблема вполне решаема и в большинстве случаев вам помогут действия описанные в статье. А если не помогут, напишите свое решение в комментариях!

Статья распространяется под лицензией Creative Commons ShareAlike 4.0 при копировании материала ссылка на источник обязательна .
Nor do nginx or php-fpm reports a error 500 output, In fact the 500 response is on the access log and not on the nginx error log. The script is running ok in my dev environment.
nginx version: nginx/1.6.2
PHP 5.5.19 (fpm-fcgi)
Tried this
catch_workers_output = 1
Restarted everything, still not working
nginx access log shows:
x.x.x.x - - [12/Dec/2014:19:25:08 -0200] "GET /merchant/customer/mobile/data?sEcho=1&iColumns=3&sColumns=%2C%2C&iDisplayStart=0&iDisplayLength=10&mDataProp_0=0&sSearch_0=&bRegex_0=false&bSearchable_0=true&mDataProp_1=1&sSearch_1=&bRegex_1=false&bSearchable_1=true&mDataProp_2=2&sSearch_2=&bRegex_2=false&bSearchable_2=true&sSearch=&bRegex=false&_=1418418256370 HTTP/1.1" 500 589 "-" "Mozilla/5.0 (X11; Linux x86_64) AppleWebKit/537.36 (KHTML, like Gecko) Chrome/39.0.2171.71 Safari/537.36"
Note the 500 error, which should be on error.log and with the php trace that’s is happening on other errors.
Any clues?
asked Dec 12, 2014 at 21:39
![]()
Guilherme ViebigGuilherme Viebig
6,8613 gold badges28 silver badges30 bronze badges
When PHP display_errors are disabled, PHP errors can return Nginx 500 error.
Take a look into your php-fpm logs, i’m sure you’ll find the error there. With CentOS 7 :
tail -f /var/log/php-fpm/www-error.log
You can finally show PHP errors. In /etc/php.ini, change :
display_errors = Off
to :
display_errors = On
Hope it helps.
answered Jan 21, 2016 at 21:19
![]()
In case it helps someone else (Google brought me here), I had a similar problem (although in Apache, not nginx).
An older app I was installing was giving a 500 error with no output anywhere, in spite of every conceivable error logging setting turned to the most verbose level.
It turns out the problem was the controversial error-control operator, «@». As the red warning box in the docs states, no matter how verbose your logging is, if an @-prefixed command causes PHP to stop because of a typo, or because it is not available (say, because you have forgotten to install a critical module like php-mysql), PHP will exit with absolutely no indication as to why.
So, if you find yourself with a 500-error and no logs, check your codebase for «@» symbols.
answered Jul 14, 2018 at 22:22
![]()
pixpix
5,0022 gold badges23 silver badges25 bronze badges
Verify php-fpm service is running
sudo service php-fpm status
This will display the hostnames that can execute php.
Next edit php.ini to display errors. this will display errors on page..to make things easy to diagnose
sudo vim /etc/php.ini
then hit key [/] and type
display_errors
hit key [i] user arrow keys and backspace to set display_errors = on
then restart php-fpm service
On system type redhat /centos etc..
sudo service php-fpm restart
answered Jul 10, 2016 at 15:48
![]()
3
If a 5xx happens and no one is around to see it, is it still an error?

No matter how rigorously or how long you test your software, there’s nothing like the production environment to uncover bugs. Whether it’s caused by a weird race condition that happens only under the unpredictable concurrency patterns of live traffic, or an input validation blow‑up for data you couldn’t imagine a user ever typing, “throwing a 500” is a big deal.
HTTP 5xx error messages are highly visible to your users, highly embarrassing for the business, and can lead to reputational damage in a very short space of time. Furthermore, debugging them in your production environment can be extremely difficult. For starters, the sheer volume of log data can make the job of isolating a problematic session like searching for a needle in a haystack. And even when you have collated logs from all components, you may still not have enough data to understand the problem.
When using NGINX as a reverse proxy or load balancer for your application, there are a number of features that can assist you with debugging in a production environment. In this blog post we will describe a specific use of the error_page directive as we explore a typical reverse proxy application infrastructure, with a twist.
Introducing the Debug Server
The twist is that we’re going to set up a special application server – we’ll call it the Debug Server – and feed it only requests that have caused errors on a regular application server. We’re taking advantage of how NGINX can detect 5xx errors coming back from an upstream application server and retry the responsible requests with a different upstream group, in our case the one containing the Debug Server. This means that Debug Server only receives requests that have already produced errors, so its log files contain only erroneous events, ready for investigation. This reduces the scope of your needle search from a haystack to merely a handful of needles.
Unlike the main application servers, the Debug Server does not have to be built for performance. Therefore you can enable all of the available logging and diagnostic tools at your disposal, such as:
- Running your application in debug mode, with full stack trace enabled
- Debug logging of application servers
- Application profiling, so that interprocess timeouts can be identified
- Logging of server resource usage
Debugging tools like these are usually reserved for a development environment, because production environments are tuned for performance. However, as the Debug Server only ever receives erroneous requests, you can safely enable debug mode on as many components as possible.
Here’s what our application infrastructure looks like.
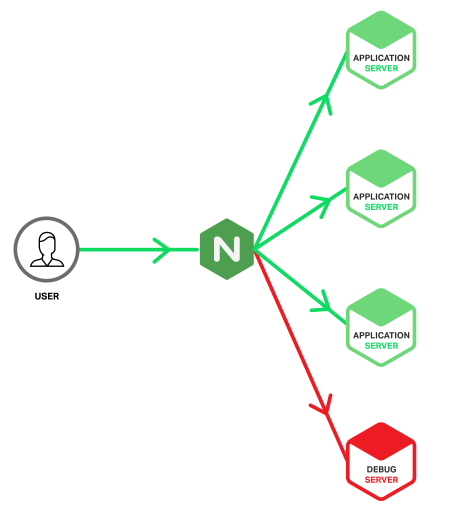
Ideally, the provisioning and configuration of the Debug Server is identical to the application servers, but there are also benefits from building the Debug Server as a virtual machine so that it can be cloned and copied for offline analysis. However, this does carry the risk that the server might be overwhelmed if a significant problem produces a sudden spike of 5xx errors. With NGINX Plus you can protect the Debug Server from such spikes by including the max_conns parameter on the server directive to limit the number of concurrent connections sent to it (see the sample configuration below).
Furthermore, because the Debug Server is not as heavily loaded as the main application servers, not everything that generates a 5xx on an application server will cause one on the Debug Server. Such situations may suggest that you are reaching the scaling limits of the main application servers and that resource exhaustion rather than a software bug is responsible. Regardless of the root cause, such situations improve the user experience by saving them from a 5xx error.
Configuration
The following sample NGINX configuration shows how we can configure the Debug Server to receive requests that have already generated a 5xx error on a main application server.
upstream app_server {
    server 172.16.0.1;
    server 172.16.0.2;
    server 172.16.0.3;
}

upstream debug_server {
    server 172.16.0.9 max_conns=20;
}

server {
    listen *:80;
    location / {
        proxy_pass http://app_server;
        proxy_intercept_errors on;
        error_page 500 503 504 @debug;
    }

    location @debug {
        proxy_pass http://debug_server;
        access_log /var/log/nginx/access_debug_server.log detailed;
        error_log  /var/log/nginx/error_debug_server.log;
    }
}
The first thing we do is specify the addresses of our application servers in the upstream app_server block. Then we specify the single address of our Debug Server in the upstream debug_server block.
The first location block configures a simple reverse proxy, using the proxy_pass directive to load balance requests across the application servers in our app_server upstream group (we don’t specify a load‑balancing algorithm, so the default Round Robin algorithm is used). The proxy_intercept_errors directive means that any response with HTTP code 300 or greater is handled by the error_page directive. In our configuration we are intercepting only 500, 503, and 504 errors, and passing them to the @debug location. Any other response codes, such as 404s, are sent back to the client unmodified.
The location @debug block does two things. First, it proxies all requests to the debug_server upstream group, which of course contains our special Debug Server. Second, it writes duplicate log entries into separate access and error log files. By isolating messages generated for erroneous requests on the application servers from regular access messages, you can more easily correlate the errors with those generated on the Debug Server itself.
Note that the access_log directive references a special log format, called detailed. We define the format by including the following log_format directive in the top‑level http context, above the server block.
log_format detailed '$remote_addr - $remote_user [$time_local] '
                    '"$request" $status $body_bytes_sent "$http_referer" '
                    '"$http_user_agent" $request_length $request_time '
                    '$upstream_response_length $upstream_response_time '
                    '$upstream_status';
The detailed format extends the default combined format with a further five variables which provide more information about the requests forwarded to the Debug Server and its responses.
$request_length– Total size of the request, including header and body, in bytes$request_time– Request processing time, in milliseconds$upstream_response_length– Length of the response obtained from the Debug Server, in bytes$upstream_response_time– Time spent receiving the response from the Debug Server, in milliseconds$upstream_status– Status code of the response from the Debug Server
These additional fields in the log are very helpful in detecting both malformed and long‑running requests. The latter may point to timeouts within the application or other interprocess communication problems.
Consider Idempotency when Retrying Requests
There are times when you might not want to send failed requests to the Debug Server. For example, if your application or API failed partway through a request that involved making changes to multiple database records, then retrying the request could end up repeating database actions that already completed successfully. This can leave your database in a bigger mess than if you had not retried the failed request at all.
It is safe to retry a request only if it is idempotent – that is, it always has the same result no matter how many times you make it. HTTP GET, PUT, and DELETE requests are defined as idempotent, whereas POST is not (it is nonidempotent). However, exactly what HTTP methods are idempotent for your application may vary from the official definition.
The issue of idempotency gives us three options for our Debug Server:
- Run the Debug Server with a read‑only database connection; repeating requests is safe because no changes are possible anyway. We still log the requests that caused a
5xxerror but there is less diagnostic information available from the Debug Server with which to investigate the root cause. - Send only idempotent requests to the Debug Server. This isolates requests that caused a
5xxerror, but not if they used thePOSTmethod. - Deploy a second Debug Server with a read‑only database connection and send the nonidempotent requests to it, while continuing to send idempotent requests to the primary Debug Server. This captures all the failed requests but requires a second server and more configuration.
In the interests of completeness, let’s look at the configuration for option 3, with changes from the previous configuration highlighted.
upstream app_server {
    server 172.16.0.1;
    server 172.16.0.2;
    server 172.16.0.3;
}

upstream debug_server {
    server 172.16.0.9 max_conns=20;
}

upstream readonly_server {
    server 172.16.0.10 max_conns=20;
}

map $request_method $debug_location {
    'POST'  @readonly;
    'LOCK'  @readonly;
    'PATCH' @readonly;
    default @debug;
}

server {
    listen *:80;
    location / {
        proxy_pass http://app_server;
        proxy_intercept_errors on;
        error_page 500 503 504 $debug_location;
    }

    location @debug {
        proxy_pass http://debug_server;
        access_log /var/log/nginx/access_debug_server.log detailed;
        error_log  /var/log/nginx/error_debug_server.log;
    }

    location @readonly {
        proxy_pass http://readonly_server;
        access_log /var/log/nginx/access_readonly_server.log detailed;
        error_log  /var/log/nginx/error_readonly_server.log;
    }
}
With our new read‑only Debug Server in place, the map directive uses the $request_method variable to set a new variable, $debug_location, based on the idempotency of the request method. When we hit the error_page directive, we use the $debug_location variable to direct processing of the request to the Debug Server appropriate for the HTTP method used in the request.
It is common to use the proxy_next_upstream directive to have NGINX retry a failed request on the remaining servers in the upstream group (before trying the Debug Server). Though typically used for network‑level errors, it can also be extended to 5xx errors. In NGINX Open Source 1.9.13 and later, nonidempotent requests that fail with 5xx errors are not retried by default. If it’s acceptable to retry nonidempotent requests, add the non_idempotent parameter to the proxy_next_upstream directive. This behavior and the new parameter are also enabled in NGINX Plus R9 and later.
location / {
    proxy_pass http://app_server;
    proxy_next_upstream http_500 http_503 http_504 non_idempotent;
    proxy_intercept_errors on;
    error_page 500 503 504 @debug;
}
Conclusion
Throwing a 500 is a big deal. Whether you’re running a DevOps model, experimenting with continuous delivery, or simply wanting to mitigate the risk of a big bang upgrade, NGINX provides you with the tools that can help you react better to issues in the wild.
To try out a Debug Server in your own NGINX Plus environment, start your free 30‑day trial today or contact us to discuss your use cases.
Free O’Reilly eBook: The Complete NGINX Cookbook
Updated for 2022 – Your Guide to Everything NGINX
Introduction
500 errors can be caused by a variety of different factors, but by far the most common reason is errors within the codebase of your website.
There’s usually either a fatal error due to a PHP conflict, PHP error, or a lack of PHP memory due to a plugin needing above 256M to function correctly (more common on the backend than the frontend). This is the issue 99% of the time.
The messaging that displays with your 500 error may vary, but the variations don’t indicate any specific issues. Here are a few common examples:
- HTTP Error 500
- HTTP Error 500 – Internal Server Error
- HTTP 500
- 500 Error
- 500 Internal Server Error
- 500 Internal Server Error. Sorry, something went wrong.
But My Codebase Hasn’t changed?
If you’re keeping your website up-to-date, your codebase regularly changes, even if you aren’t adding new plugins. Updates can cause conflicts, and plugins can require more memory. Sometimes uninstalling a plugin can cause issues, and then there’s the possibility that malware has caused some damage to your codebase.
500 DEBUG
Below are our recommended steps, in order (check each section one after the other), to diagnose your 500 errors by quickly narrowing down the root of the cause.
Some of these checks may require you to connect to your server. Please see the following articles to get started:
Quick Checks
There are a few checks you can run to make sure it’s not a simple issue at the root of your 500 error.
1. Check Your Spelling and DNS Records
These will seem silly, but we have seen these happen in support on far too many occasions to not include.
First, double-check that you have spelled the domain name correctly.
Second, check that your website’s DNS is incorrect. We recommend this website: https://dnschecker.org/#A
If using Cloudflare you can use a local redirect to connect to the website directly and confirm the IP in the response headers, or quickly disable the proxy and use the website to confirm before switching the proxy back on.
2. Check the Website Without the Cache
First, check the website in an incognito window to rule out the browser cache. Clear your browser cache and cookies if the website now works correctly.
If that isn’t the cause, check the website when bypassing the cache (simply add a query string like ?123 to the end of your UR, e.g. website.com?123). If the website now works, clear your cache.
3. Reset Your Websites Permissions
If you’ve made any changes to your installation manually, you may have changed/set the ownership of those files to the root user instead of the system user.
When this happens, your website doesn’t have the correct permissions to access the files.
Head to the Tools page inside your GridPane account and do the following:
- Select Quick Fixes from the dropdown
- Select the appropriate server
- Select the appropriate site (or staging site)
- Select Reset Permissions
- Click the Start Task button
4. Rename the /plugins directory
Connect to your server over SFTP and rename the plugins folder inside /wp-content to plugins.off. Does this fix the issue? If yes, you now know that the issue is specific to a plugin in your website. Change the folder name back to plugins and you can start narrowing it down by following the same process for each of your individual plugin folders.
You may want to start with the plugins you have the least confidence in.
PHP Service Checks
If there’s an issue with PHP on your server, this can cause 500 errors.
1. Check if PHP is Down
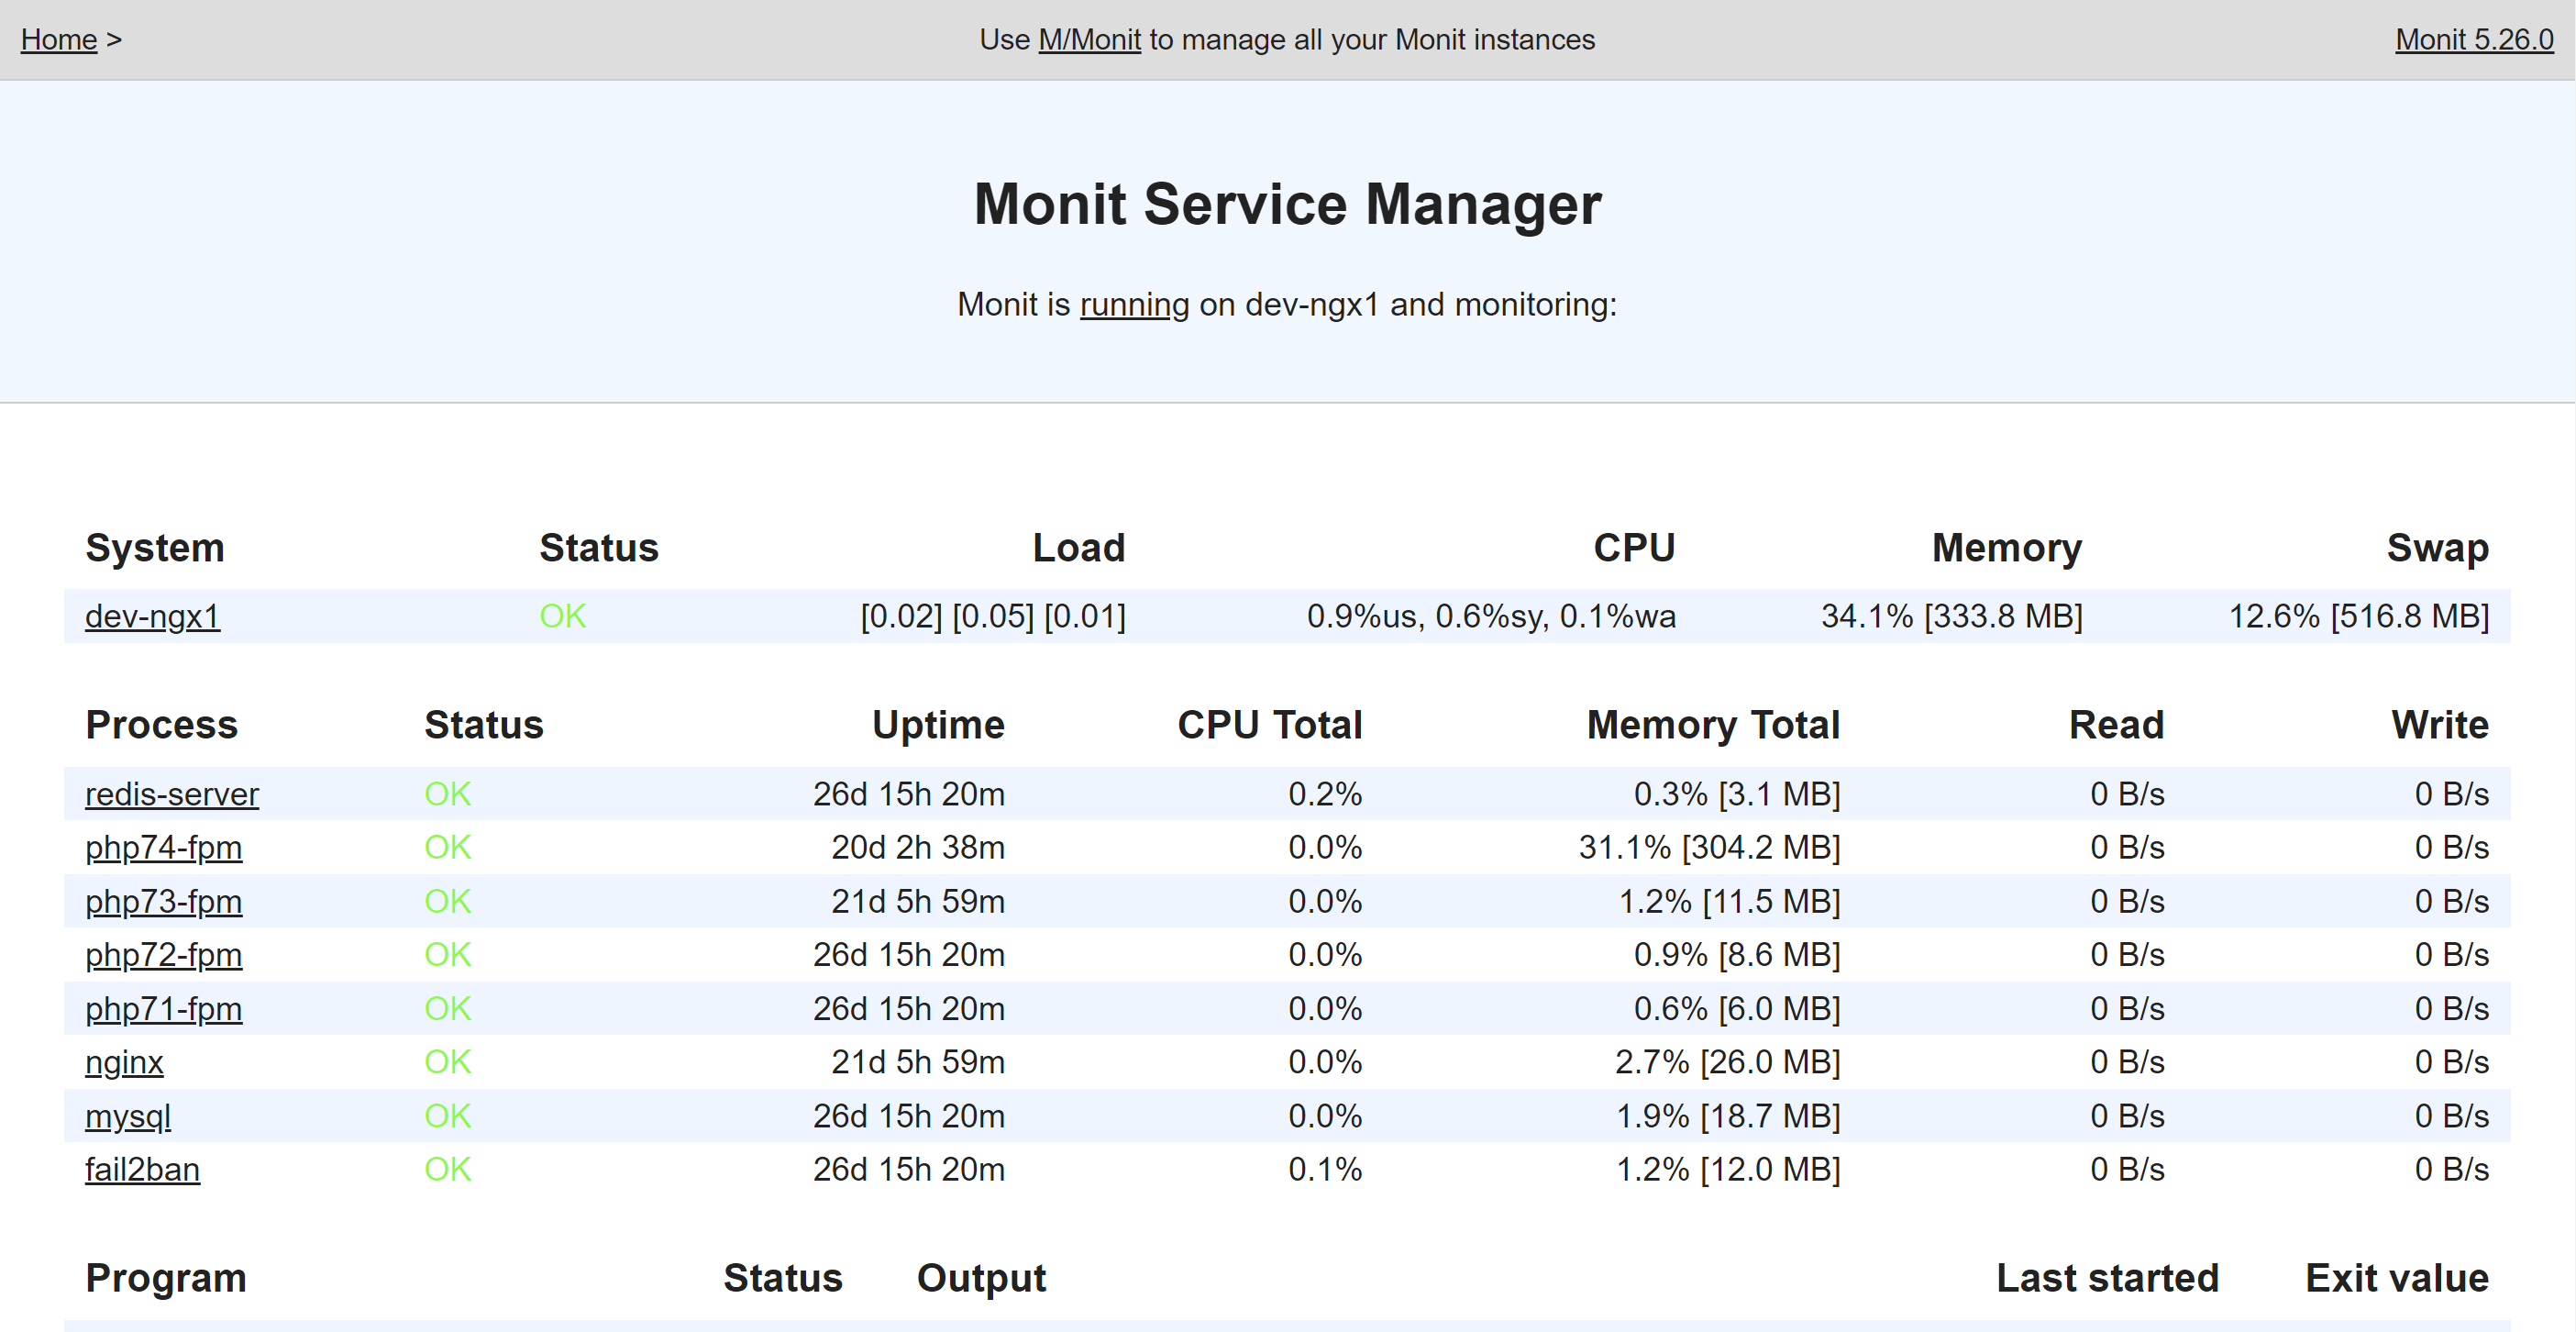
If PHP is down, Monit will have tried to alert you, but the quickest way to check is to head to your Servers page inside your GridPane account and click the piechart icon next to your server to open up Monit.
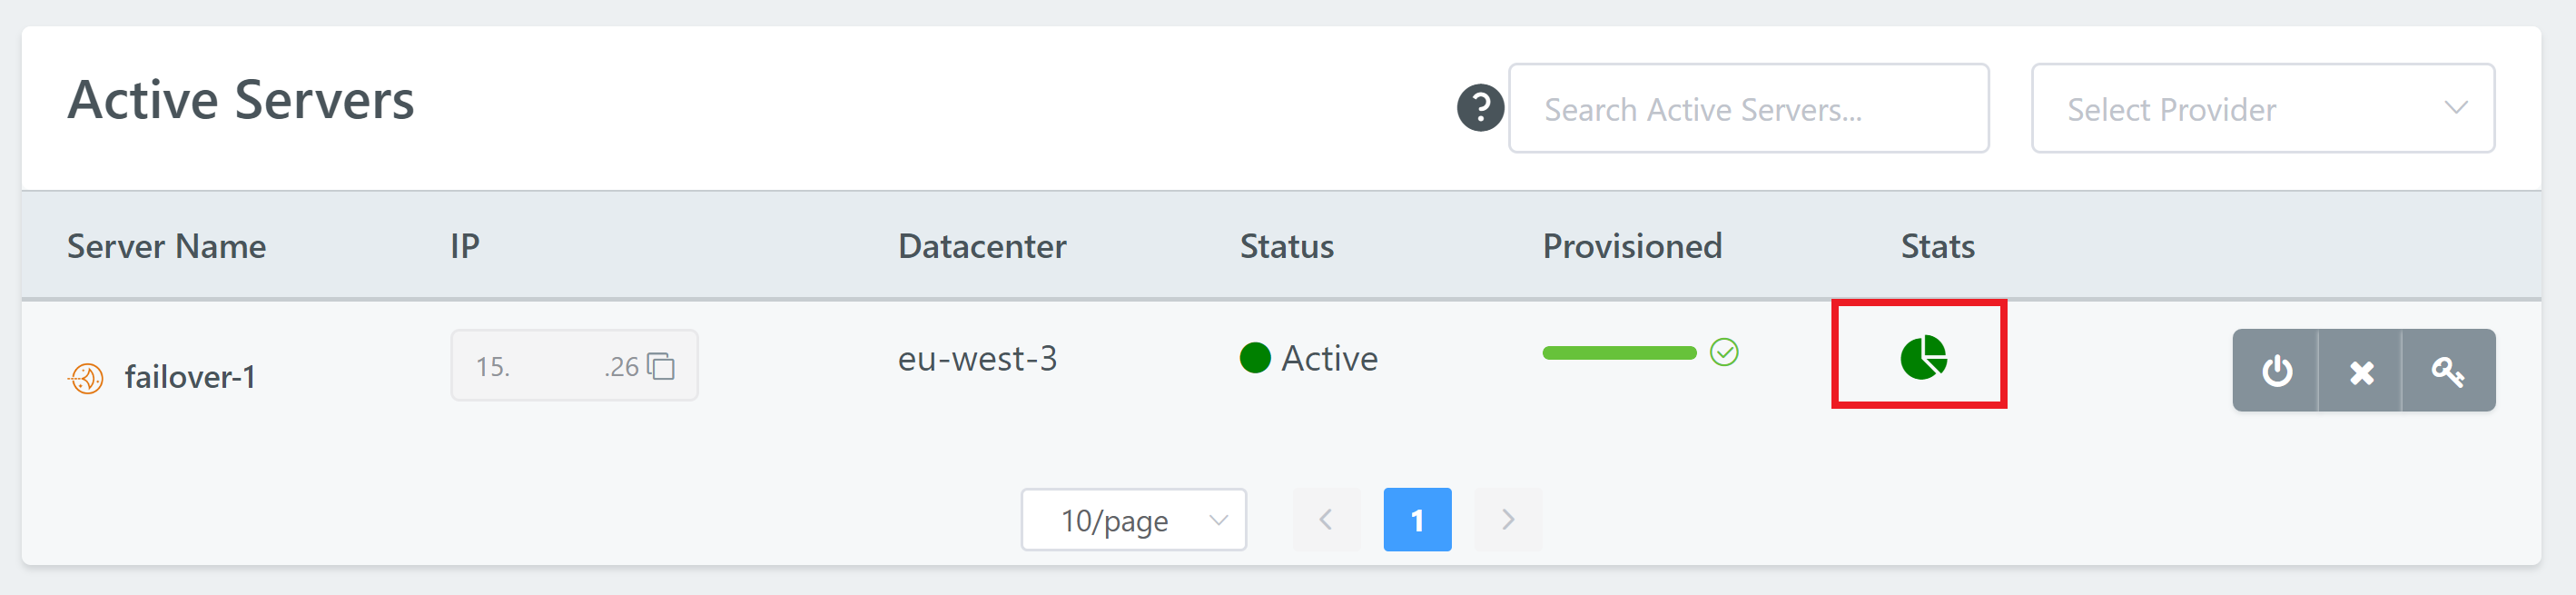
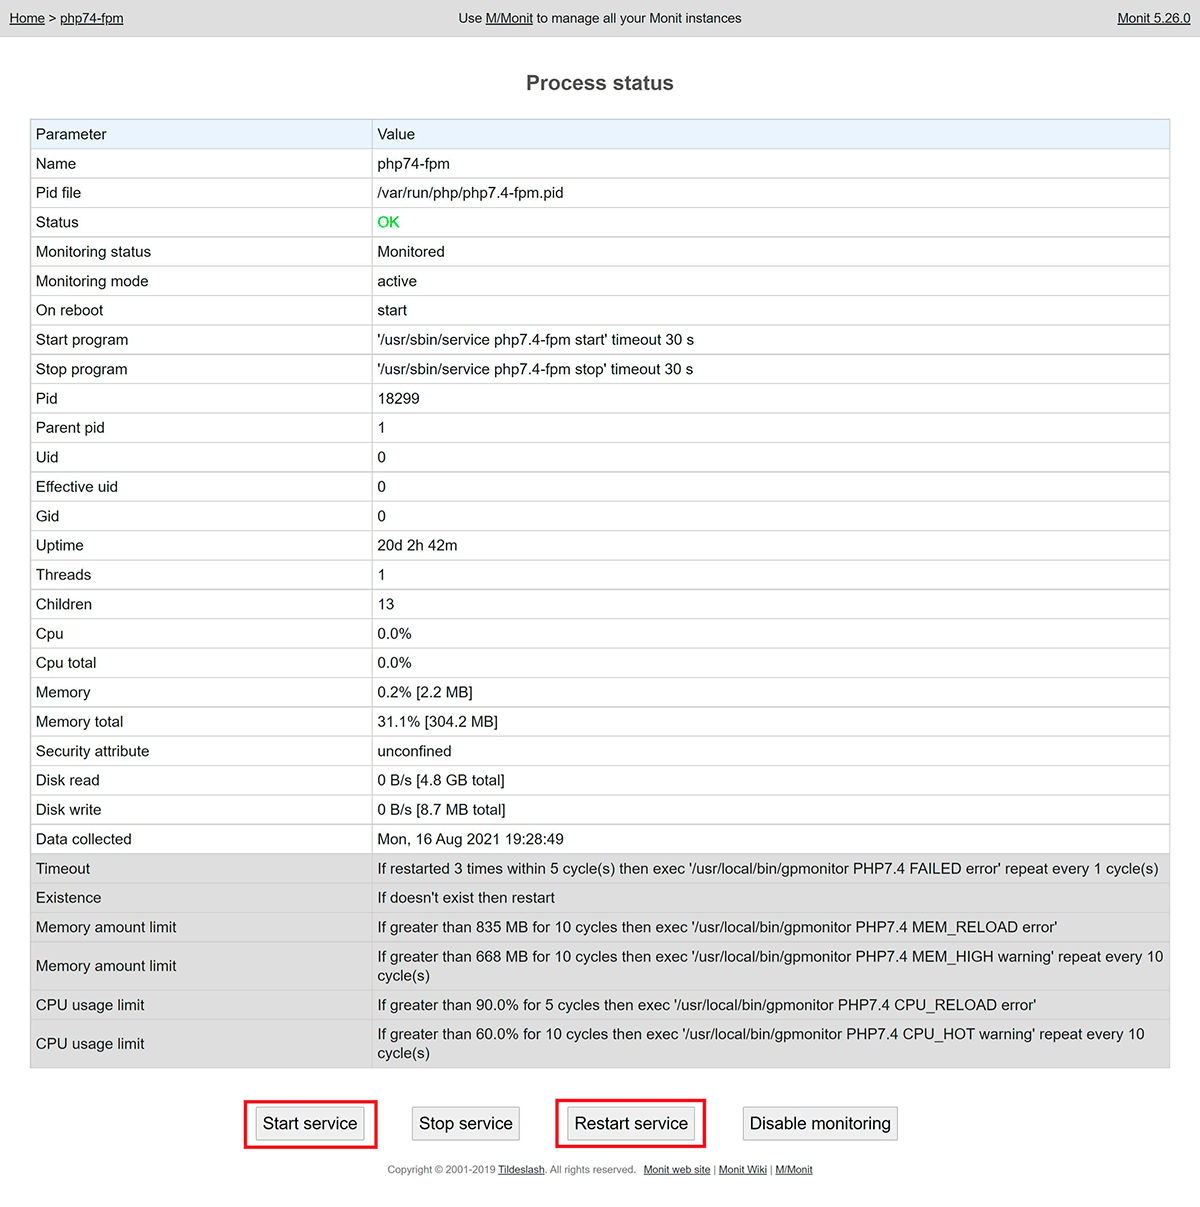
If you see that any PHP version is down, click on its name and you will be able to attempt to restart it at the bottom of its page.
Alternatively, on the command line you can run the following:
gp php {php.version} -restart
For example:
gp php 7.3 -restart
2. If PHP is Down and Won’t Restart
Switch your website to another PHP version, then contact the support team and let us know which specific PHP version is down and that it won’t restart. We’ll look into the issue.
Codebase Checks: PHP and WordPress
The most common cause of a 500 error is a fatal error within the website either due to a PHP error or a lack of PHP memory.
PHP errors can be caused by many things, including missing files and malware. The website Nginx/OpenLiteSpeed Error Logs are where you need to check.
1. Check the Nginx error log
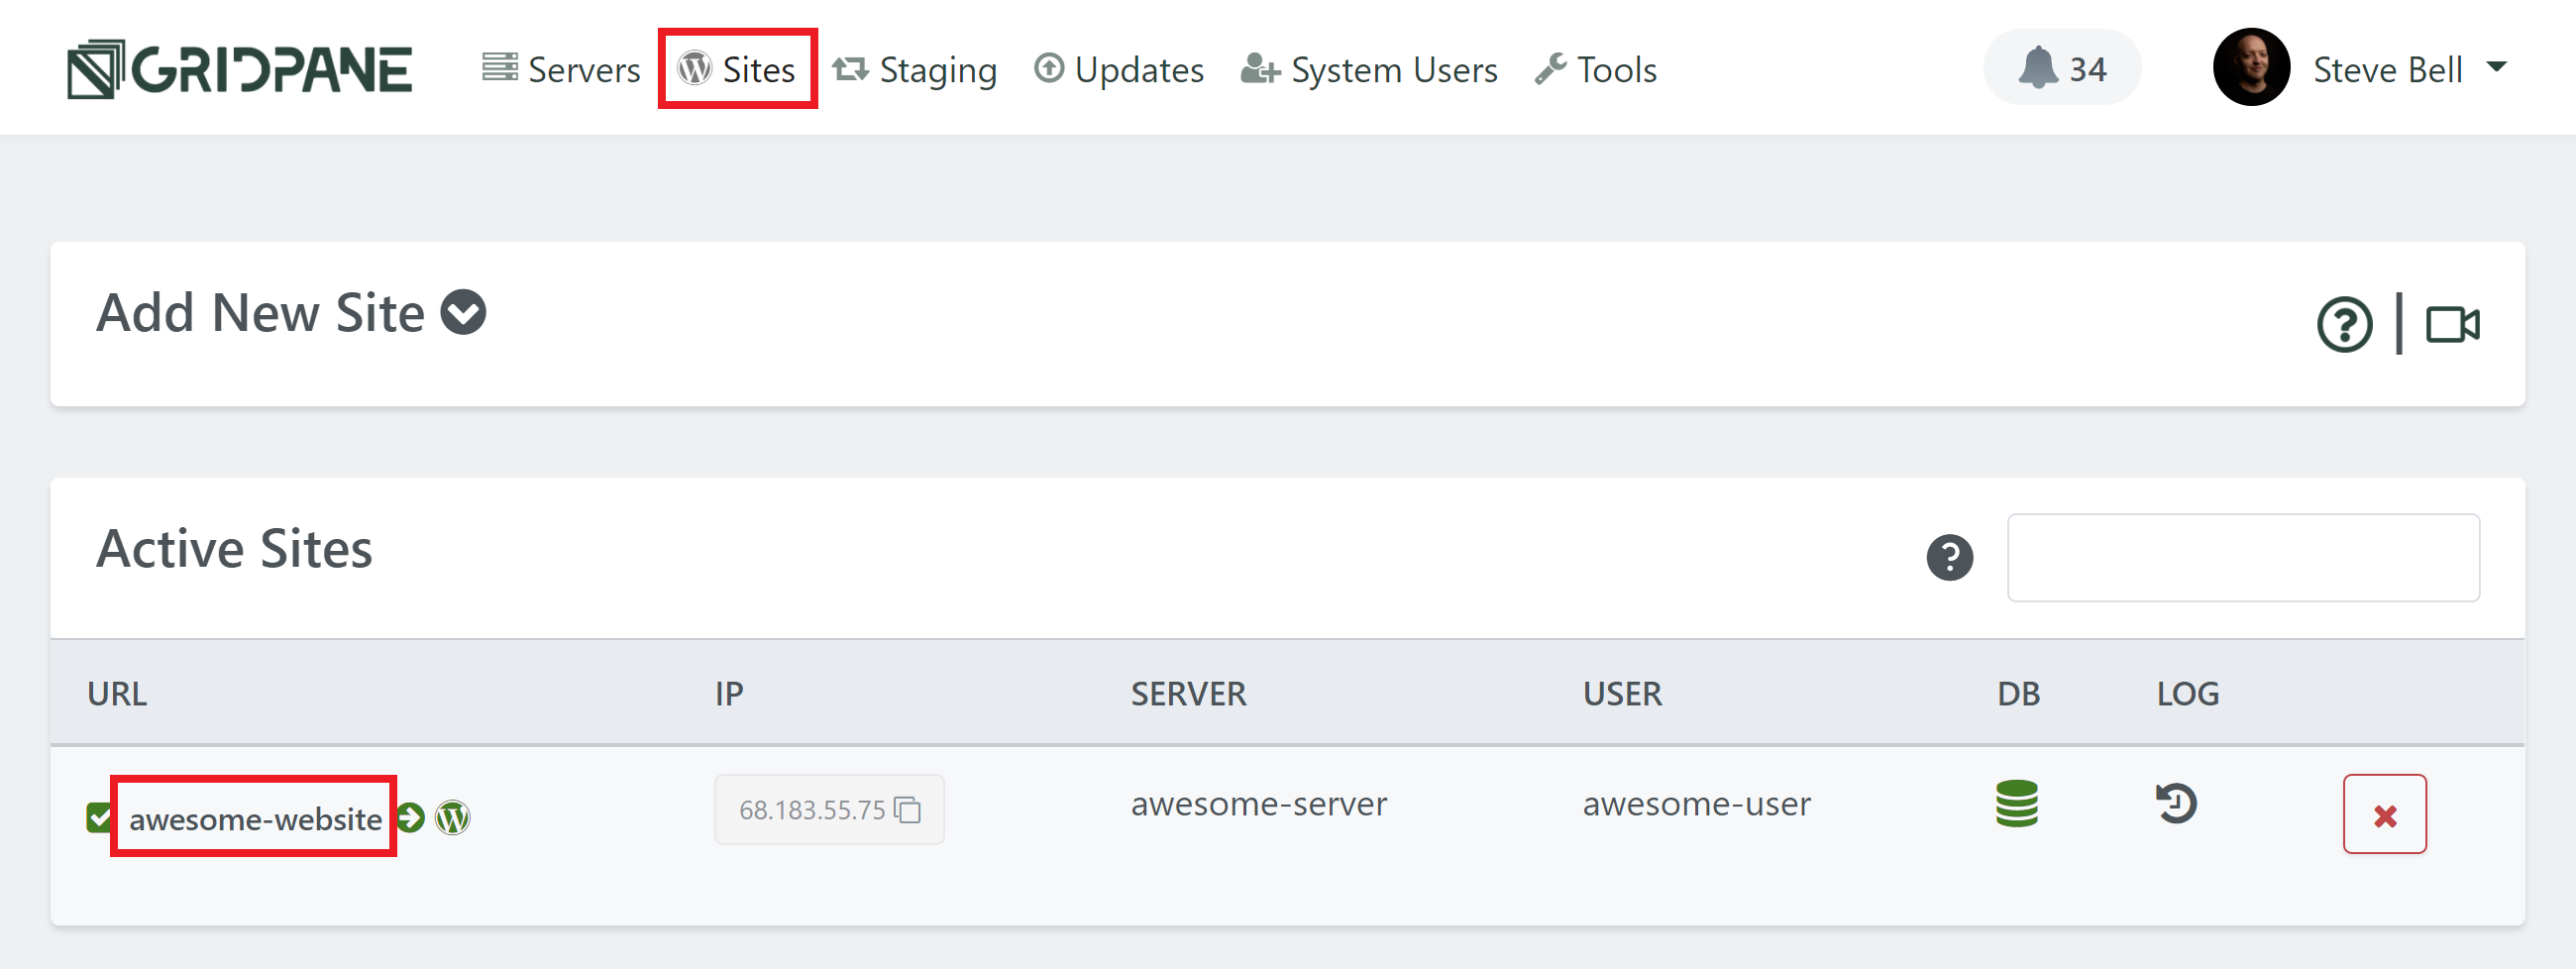
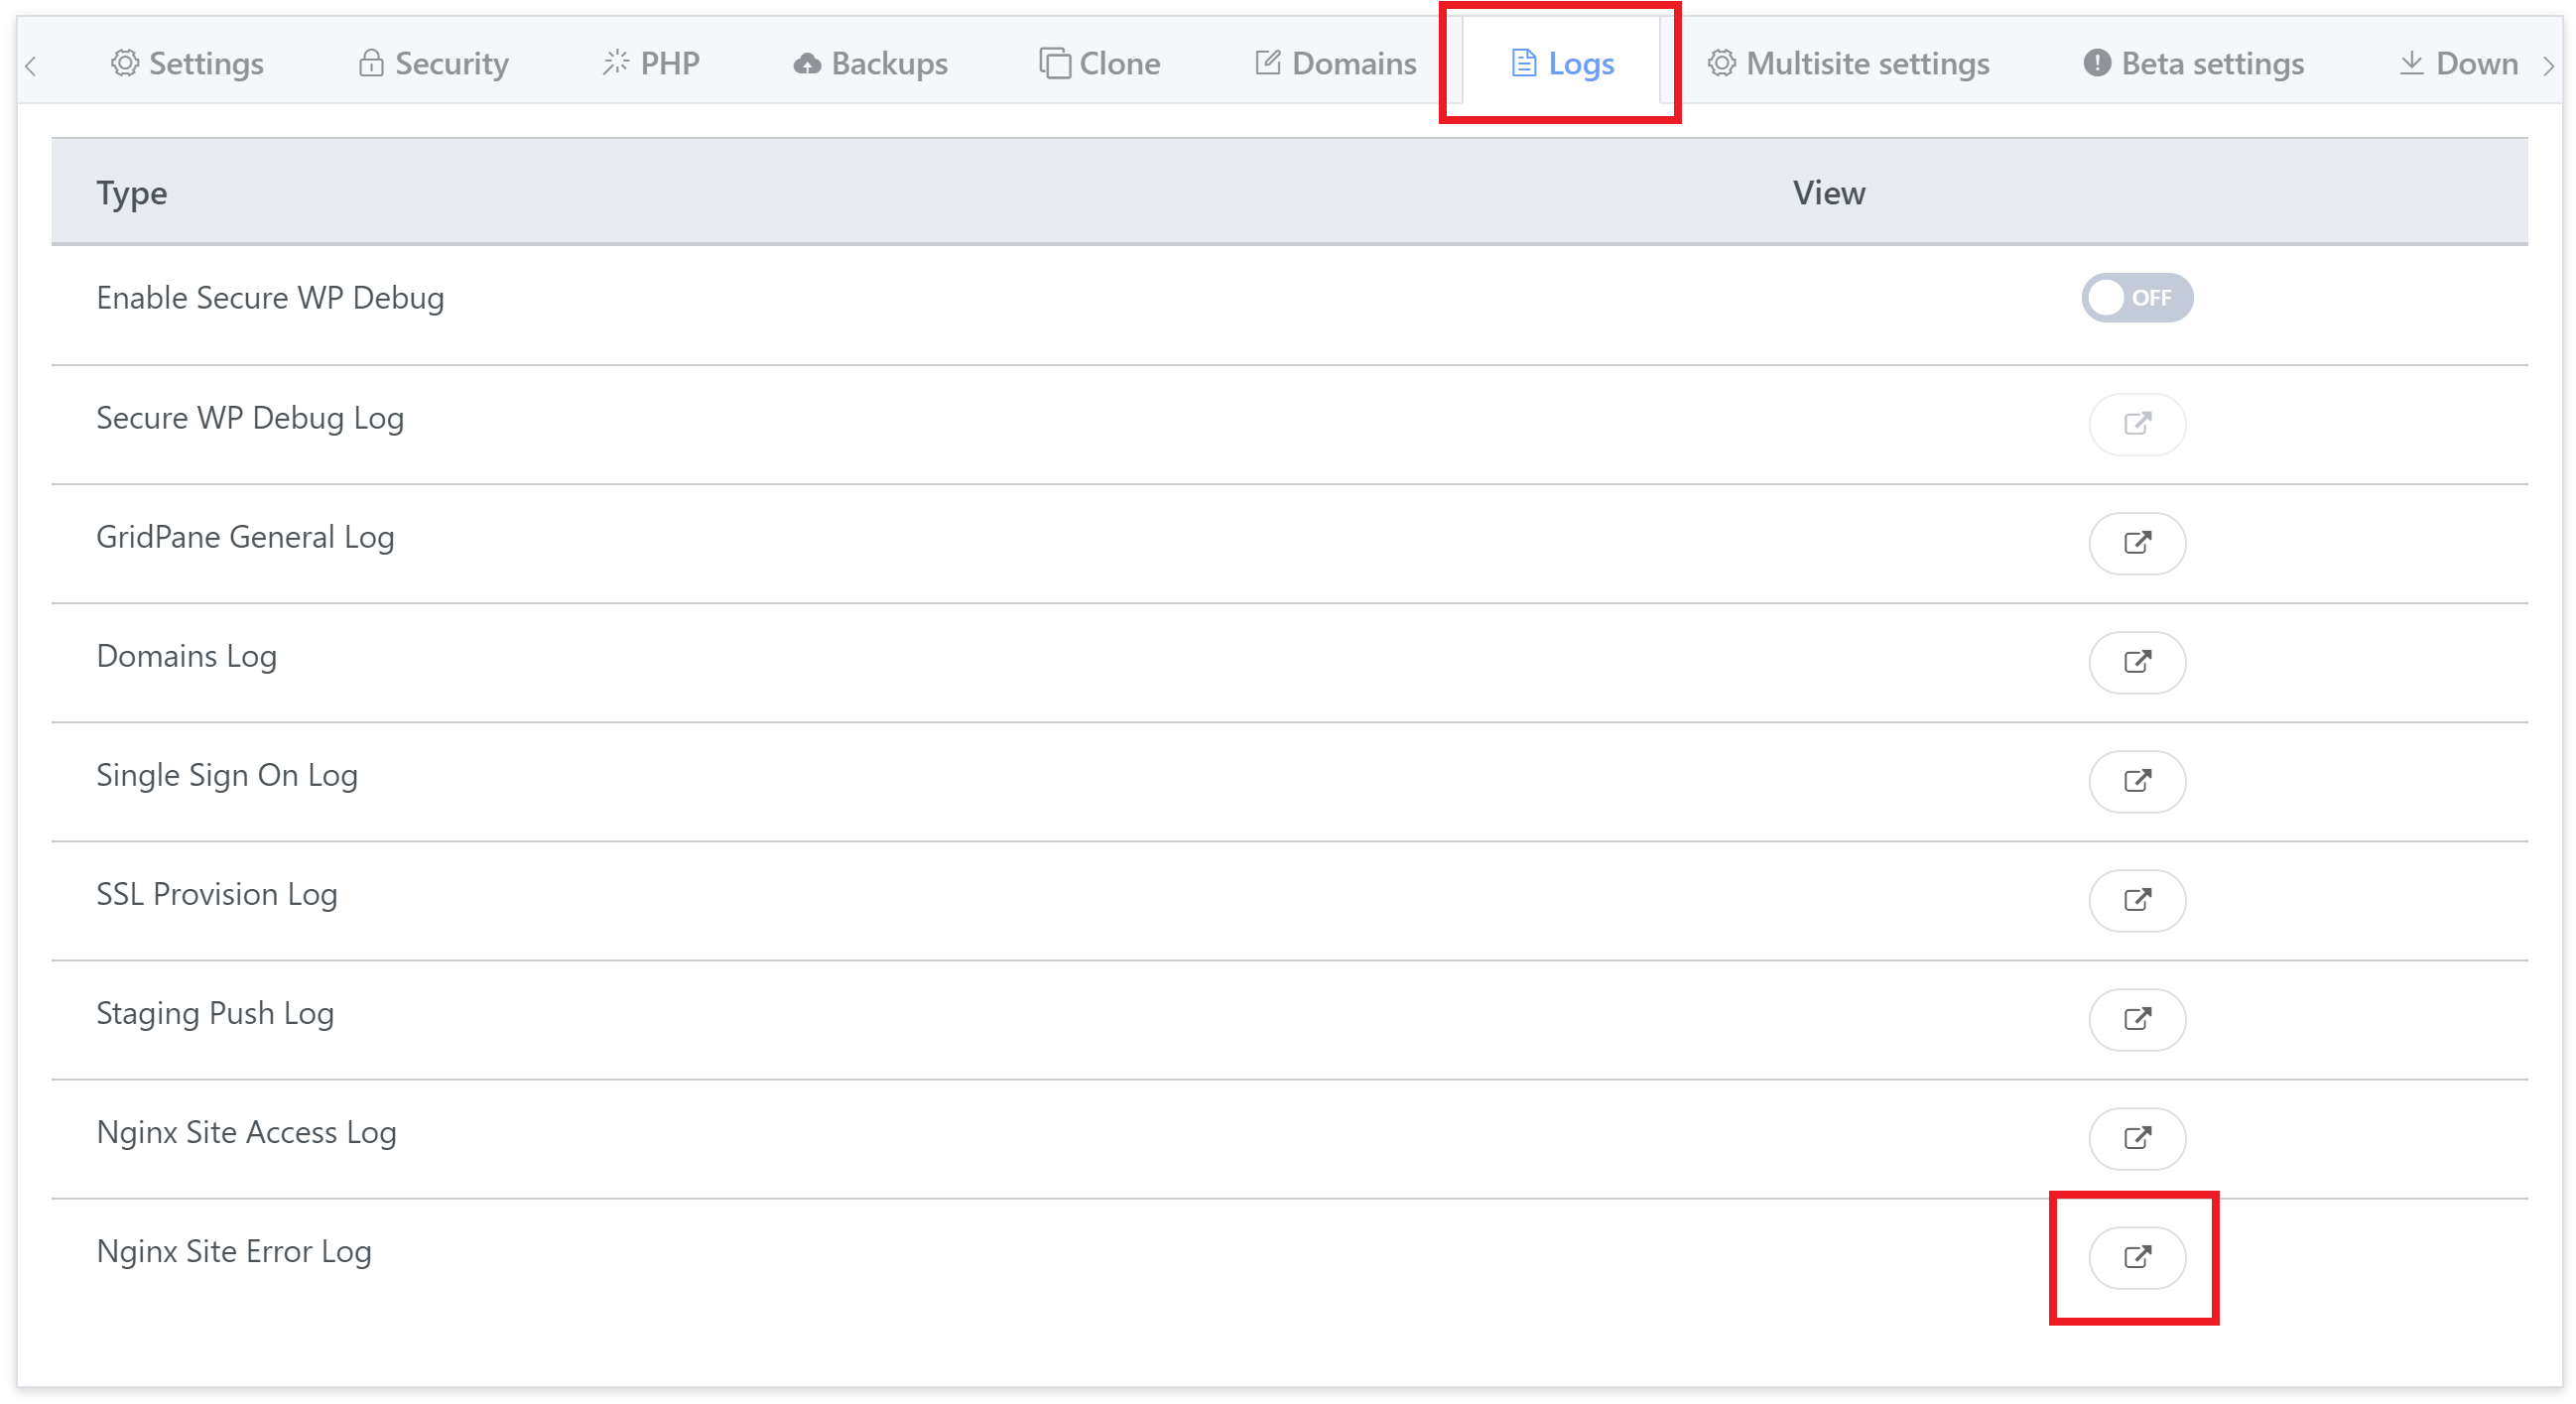
You’ll find all of your website-specific error logs inside your website’s customizer. Head to the Sites page within your account and click on the name of the website you’re having trouble with to open the customizer. Next, click through to the logs tab:
You’ll find the Nginx error log at the bottom:
When checking the log, look for the errors that correspond to your timestamps.
2. Are there any Fatal Errors?
If yes, it will tell you whether it’s due to it being a PHP error or a lack of memory. If it’s a codebase error you will need to fix the error to resolve the issue. This may mean deactivating the plugin, or diving into PHP.
If the error is only happening on one page, or when doing something in the WordPress backend, also activate WordPress debug with the toggle at the top of the logs tab.
Check the following:
- Check for Fatal PHP errors in the Nginx/OpenLiteSpeed Error Log (and WordPress debug log if it’s only happening on certain pages and not the whole website).
- Check that WordPress core files aren’t in the wrong place – check for files that should be in /htdocs one level up where the wp-config.php lives.
- Is there an additional wp-config.php file inside the /htdocs directory?
- Is the PHP version is incompatible with the current codebase? Change the website’s PHP version to the previous version and check the error again.
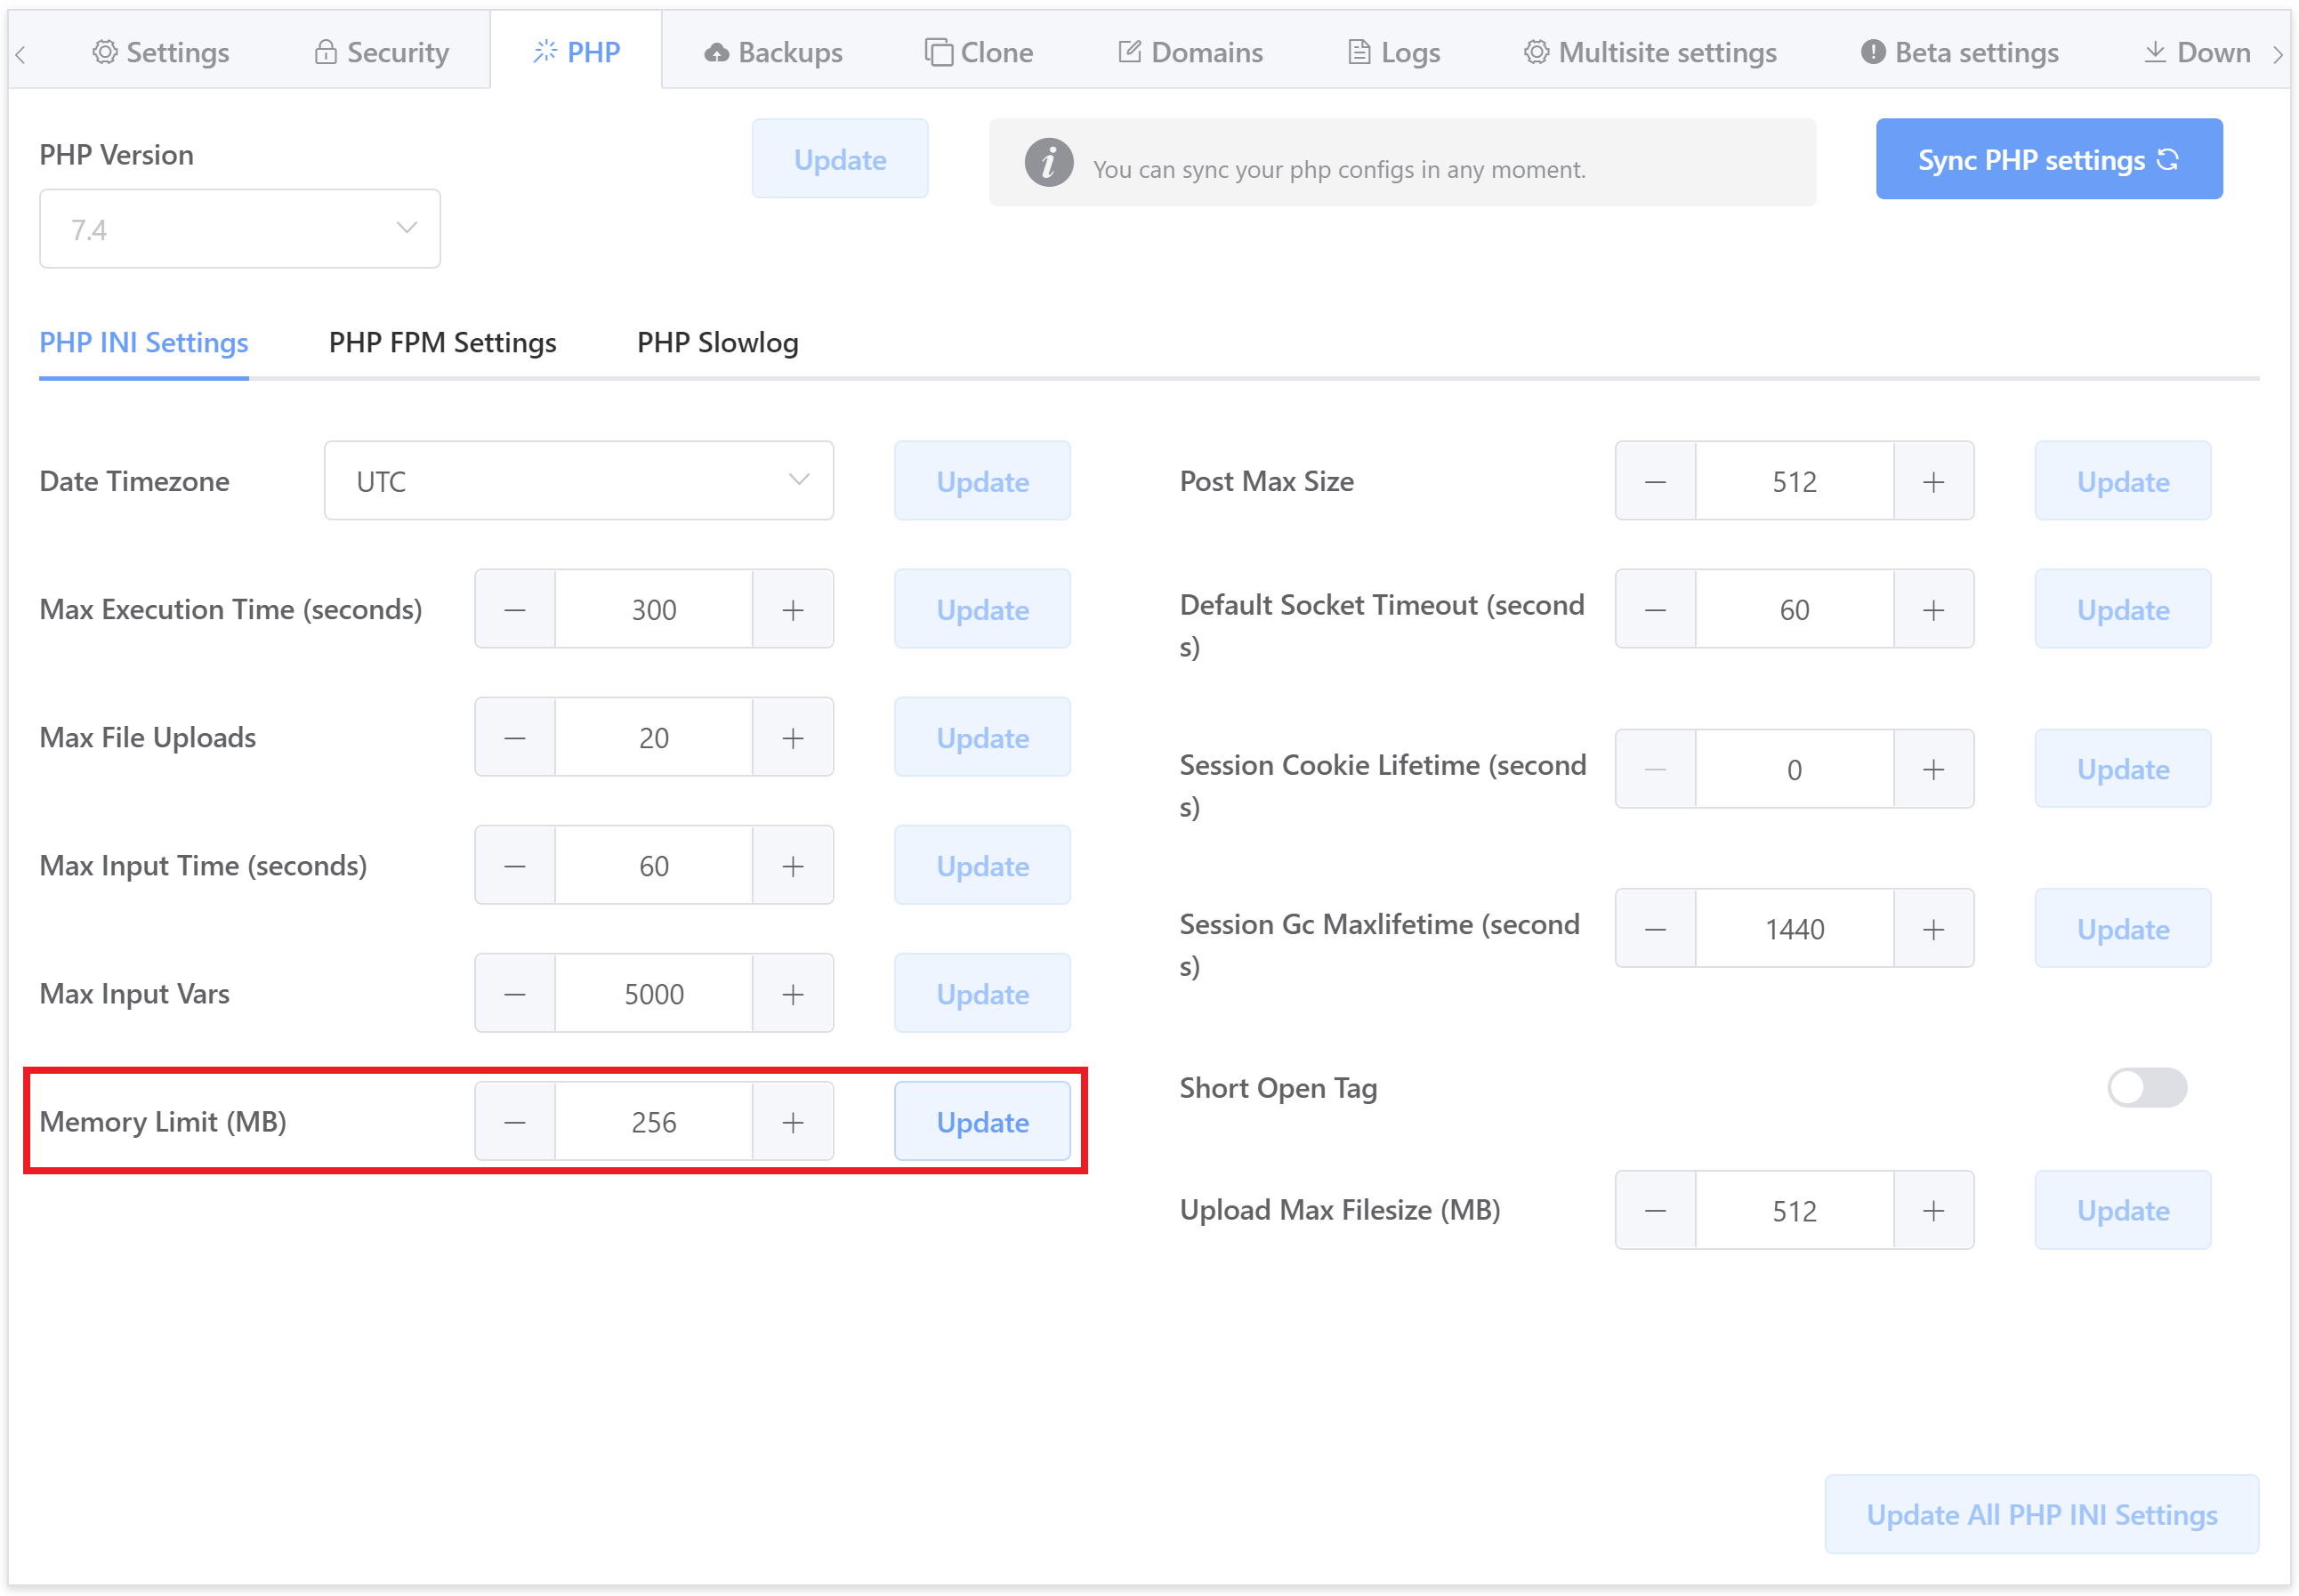
A common cause is a lack of PHP memory, which you can increase directly inside your website’s customizer.
3. Did the 500 Error Occur after activating or deactivating a plugin?
If things went wrong after a plugin activation, deactivate the plugin (manually if necessary by connecting to your server over SFTP or SSH and renaming the plugins folder).
If things went wrong after a plugin deactivation, try restarting PHP.
4. Are all WordPress installation files OK?
Check that your website core files aren’t missing or corrupted – a missing or misplaced file can cause 500 errors.
You can run a check with the following command (replace site.url with your domain name):
gp wp site.url core verify-checksums
For example:
gp wp yourwebsite.com core verify-checksums
This will check your core WordPress installation files and let you know if there are any issues that need to be addressed.
We rarely see 500 errors, but this is often the cause. A few examples we’ve seen are:
- wp-config.php was empty (unknown reason)
- A wp-config.php was also inside the /htdocs directory
More info: The wp-config.php Location at GridPane - index.php was missing (malware)
- wp-settings.php was moved outside of the /htdocs directory (client mistake)
wp-config.php backup
If you find that for some reason your wp-config.php is missing/corrupt/empty, you can find a backup of this file inside /opt/gridpane/site-configs.
5. Scan for Malware
If things look out of place, files are missing, or the above command returned that core files were incorrect, then you should check your website for malware.
If you’re on the Developer plan we can activate the Maldet scanner for you (contact us on support). WordPress scanners such as MalCare, NinjaScanner, and Wordfence can be great options as well.
OpenLiteSpeed Specific Checks
There are a couple of checks that are OpenLiteSpeed specific.
1. Check Your .htaccess File
If the .htaccess file is missing, corrupted, or misconfigured, it can cause 500 errors. There is a backup of your original .htaccess file inside your /htdocs directory called .htaccess.bk.
2. Deactivate the LiteSpeed Cache Plugin
Does deactivating the LiteSpeed Cache plugin resolve the issue?
Previously we diagnosed a very obscure error within OpenLiteSpeed itself that resulted in a 500 error due to the LiteSpeed Cache plugin.
Database Checks
Database issues are very rarely the cause of 500 errors, but if you’ve confirmed the issue isn’t any of the issues detailed in the previous two sections, you can make the following checks.
1. Incorrect Database Credentials
Incorrect database credentials in your websites wp-config.php file could potentially cause a 500 error.
Check your original database credentials with either of the site.env file:
/var/www/site.url/log/site.url.env
Or the wp-config.php backup:
/opt/gridpane/site-configs/site.url-wp-config-immutable.BUP
Do they match up with your current wp-config.php file?
2. There are Issues with your database server
Check Monit to see if MySQL up and running. If MySQL is down, you can attempt to restart it. If it doesn’t restart, contact us on support.
3. Corrupted database
Connect to your server over SSH, and check your database with the following command (replacing site.url with your websites domain):
gp wp site.url db check
If there’s an issue, you can attempt to run a repair with the following (again replacing site.url with your websites domain):
gp wp site.url db repair
When accessing some PHP scripts on my website, I’m getting the dreaded 500 error message. I’d like to know what’s wrong to fix it, but Nginx isn’t logging any PHP errors in the log file I have specified. This is my server block:
server {
    listen 80;
    server_name localhost;
    access_log /home/whitey/sites/localhost/logs/access.log;
    error_log /home/whitey/sites/localhost/logs/error.log error;
    root /home/whitey/sites/localhost/htdocs;
    index index.html index.php /index.php;

    location / {

    }

    location ~ .php$ {
        fastcgi_pass unix:/tmp/phpfpm.sock;
        fastcgi_param SCRIPT_FILENAME  $document_root$fastcgi_script_name;
        include fastcgi_params;
    }

    location ~* .(?:ico|css|js|gif|jpe?g|png)$ {
        expires max;
    }
}
Note that some PHP scripts work fine, and others don’t. So there isn’t a global problem with PHP, there’s just something in these scripts that’s causing Nginx to throw the 500 error.
How can I get to the bottom of this? The only thing in error.log is an error about favicon.ico not being found.
asked Aug 13, 2012 at 18:30
![]()
4
You have to add the following to your php-fpm pool configurations:
catch_workers_output = 1
You have to add this line to each defined pool!
answered Aug 20, 2012 at 23:21
![]()
FleshgrinderFleshgrinder
3,7082 gold badges16 silver badges20 bronze badges
1
I had a similar issue.
I tried deploy phpMyAdmin with php-fpm 7.0 and nginx on CentOS7. Nginx showed me 500.html but there was not errors in any log file.
I did all of this
catch_workers_output = 1
and
display_errors = On
Either nginx log or php-fpm log did not contained any error string.
And when I commented this line in nginx.conf I was able to see in browser page things that was wrong.
#    error_page 500 502 503 504 /50x.html;
#    location = /50x.html {
#    }
That was what helped me understand troubles.
answered Jul 13, 2017 at 12:20
![]()
venoelvenoel
1837 bronze badges
php-fpm throws everything in /var/log/php5-fpm.log
or similar.
answered Aug 13, 2012 at 18:37
![]()
erickzettaerickzetta
5892 silver badges4 bronze badges
6
Look in your nginx.conf for an error_log definition. Maybe nginx writes something in this error log.
You might also enable logging to file on PHP.
answered Aug 13, 2012 at 18:36
![]()
1
For me, this seemed to be a problem with upstart, which was routing the logs for php-fpm to it’s own custom location, e.g.:
/var/log/upstart/php5-fpm.log
There’s also some bugginess with ubuntu Precise, 12.04 that may contribute to the lack of logging ability: https://bugs.php.net/bug.php?id=61045 If you’re still running that version.
answered Jul 21, 2015 at 16:55
![]()
KzqaiKzqai
1,2784 gold badges18 silver badges32 bronze badges
When PHP display_errors are disabled, PHP errors can return Nginx 500 error.
You should take a look to your php-fpm logs, i’m sure you’ll find the error there. With CentOS 7 :
tail -f /var/log/php-fpm/www-error.log
You can also show PHP errors. In your php.ini, change :
display_errors = Off
to :
display_errors = On
Hope it helps.
answered Jan 22, 2016 at 0:34
![]()
This is what happened to me:
When I deleted my error log, nginx noticed that it was no longer missing. When I recreated this file nginx would no longer recognise that it existed, therefore not writing to the file.
To fix this, run these commands (I’m on Ubuntu 14.04 LTS):
sudo service nginx reload
If that doesn’t work, then try:
sudo service nginx restart
answered Aug 12, 2015 at 7:22
![]()
dspacejsdspacejs
1111 silver badge3 bronze badges
4
The dreaded 500 internal server error. It always seems to come at the most inopportune time and you’re suddenly left scrambling to figure out how to get your WordPress site back online. Trust us, we’ve all been there. Other errors that behave similarly that you might have also seen include the frightening error establishing a database connection and the dreaded white screen of death. But from the moment your site goes down, you’re losing visitors and customers. Not to mention it simply looks bad for your brand.
Today we’re going to dive into the 500 internal server error and walk you through some ways to get your site back online quickly. Read more below about what causes this error and what you can do to prevent it in the future.
- What is a 500 internal server error?
- How to fix the 500 internal server error
500 Internal Server Error (Most Common Causes):
500 Internal server error in WordPress can be caused by many things. If you’re experiencing one, there’s a high chance one (or more) of the following elements is causing the issue:
- Browser Cache.
- Incorrect database login credentials.
- Corrupted database.
- Corrupted files in your WordPress installation.
- Issues with your database server.
- Corrupted WordPress core files.
- Corrupted .htaccess file and PHP memory limit.
- Issues with third-party plugins and themes.
- PHP timing out or fatal PHP errors with third-party plugins.
- Wrong file and folder permissions.
- Exhausted PHP memory limit on your server
- Corrupted or broken .htaccess file.
- Errors in CGI and Perl script.
Check Out Our Ultimate Guide to Fixing the 500 Internal Server Error
What is a 500 Internal Server Error?
The Internet Engineering Task Force (IETF) defines the 500 Internal Server Error as:
The 500 (Internal Server Error) status code indicates that the server encountered an unexpected condition that prevented it from fulfilling the request.
When you visit a website your browser sends a request over to the server where the site is hosted. The server takes this request, processes it, and sends back the requested resources (PHP, HTML, CSS, etc.) along with an HTTP header. The HTTP also includes what they call an HTTP status code. A status code is a way to notify you about the status of the request. It could be a 200 status code which means “Everything is OK” or a 500 status code which means something has gone wrong.
There are a lot of different types of 500 status error codes (500, 501, 502, 503, 504, etc.) and they all mean something different. In this case, a 500 internal server error indicates that the server encountered an unexpected condition that prevented it from fulfilling the request (RFC 7231, section 6.6.1).
500 Internal Server Error Variations
Due to the various web servers, operating systems, and browsers, a 500 internal server error can present itself in a number of different ways. But they are all communicating the same thing. Below are just a couple of the many different variations you might see on the web:
-
- “500 Internal Server Error”
- “HTTP 500”
- “Internal Server Error”
- “HTTP 500 – Internal Server Error”
- “500 Error”
- “HTTP Error 500”
- “500 – Internal Server Error”
- “500 Internal Server Error. Sorry something went wrong.”
- “500. That’s an error. There was an error. Please try again later. That’s all we know.”
- “The website cannot display the page – HTTP 500.”
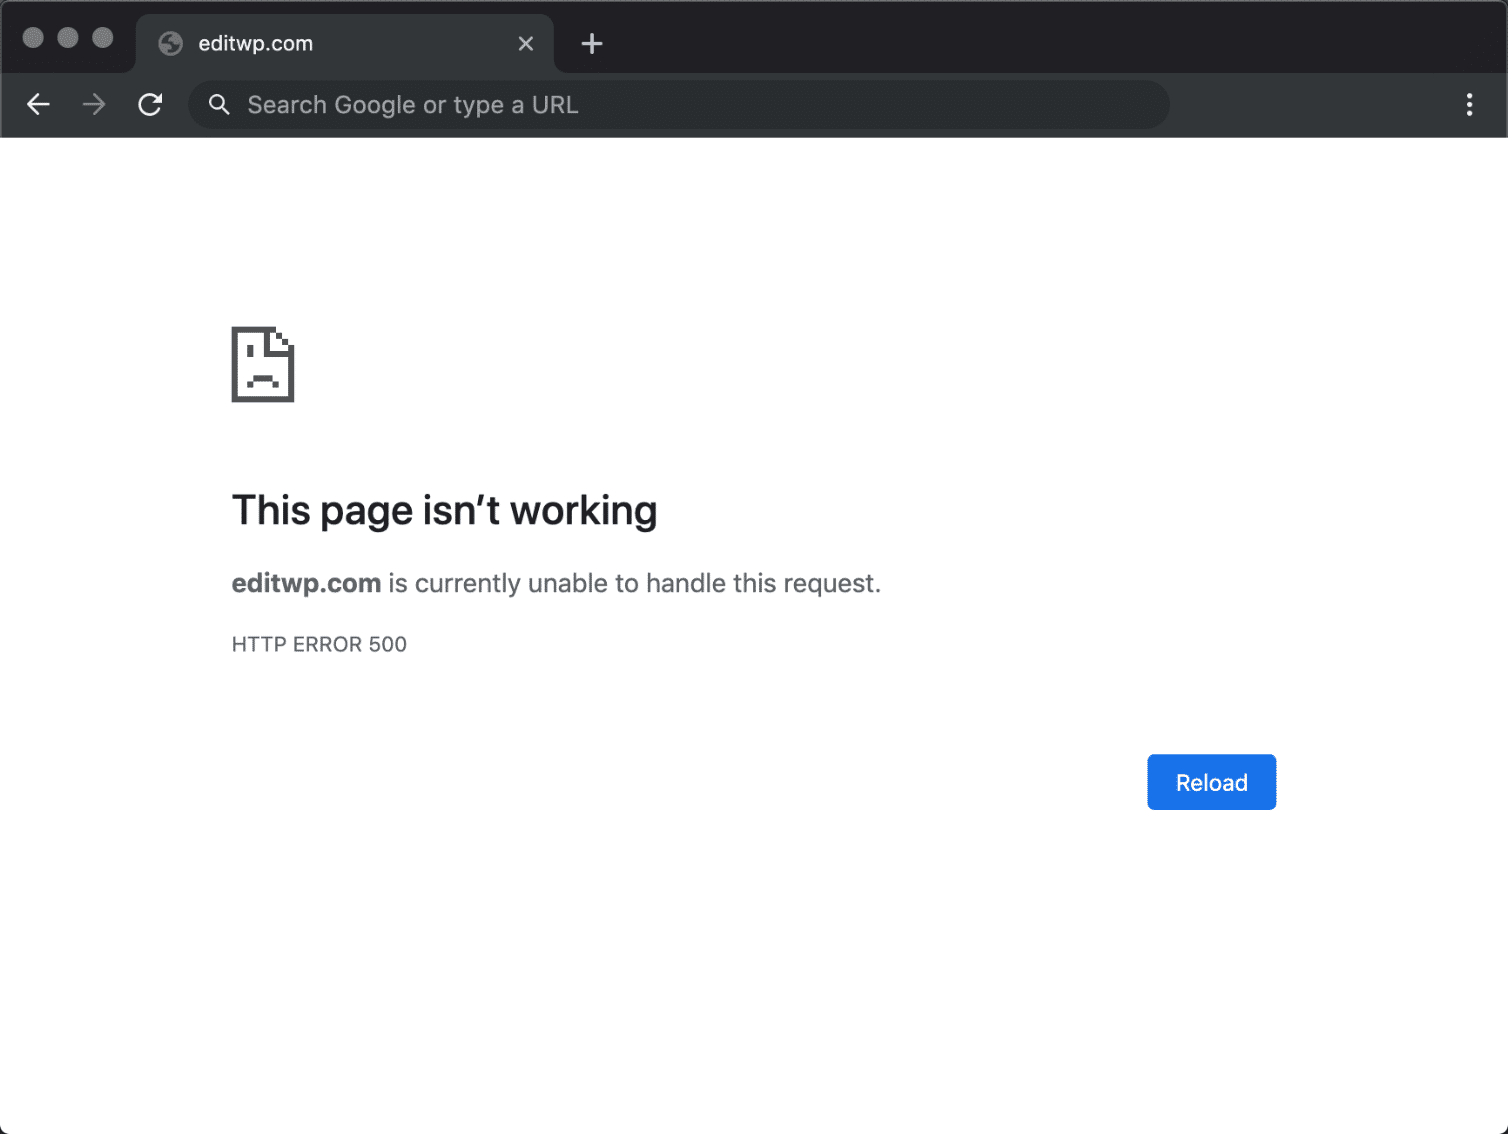
- “Is currently unable to handle this request. HTTP ERROR 500.”
You might also see this message accompanying it:
The server encountered an internal error or misconfiguration and was unable to complete your request. Please contact the server administrator, [email protected] and inform them of the time the error occurred, and anything you might have done that may have caused the error. More information about this error may be available in the server error log.

Other times, you might simply see a blank white screen. When dealing with 500 internal server errors, this is actually quite common in browsers like Firefox and Safari.

Bigger brands might even have their own custom 500 internal server error messages, such as this one from Airbnb.

Here is another creative 500 server error example from the folks over at readme.

Even the mighty YouTube isn’t safe from 500 internal server errors.

If it’s an IIS 7.0 (Windows) or higher server, they have additional HTTP status codes to more closely indicate the cause of the 500 error:
- 500.0 – Module or ISAPI error occurred.
- 500.11 – Application is shutting down on the web server.
- 500.12 – Application is busy restarting on the web server.
- 500.13 – Web server is too busy.
- 500.15 – Direct requests for global.asax are not allowed.
- 500.19 – Configuration data is invalid.
- 500.21 – Module not recognized.
- 500.22 – An ASP.NET httpModules configuration does not apply in Managed Pipeline mode.
- 500.23 – An ASP.NET httpHandlers configuration does not apply in Managed Pipeline mode.
- 500.24 – An ASP.NET impersonation configuration does not apply in Managed Pipeline mode.
- 500.50 – A rewrite error occurred during RQ_BEGIN_REQUEST notification handling. A configuration or inbound rule execution error occurred.
- 500.51 – A rewrite error occurred during GL_PRE_BEGIN_REQUEST notification handling. A global configuration or global rule execution error occurred.
- 500.52 – A rewrite error occurred during RQ_SEND_RESPONSE notification handling. An outbound rule execution occurred.
- 500.53 – A rewrite error occurred during RQ_RELEASE_REQUEST_STATE notification handling. An outbound rule execution error occurred. The rule is configured to be executed before the output user cache gets updated.
500.100 – Internal ASP error.
500 Errors Impact on SEO
Unlike 503 errors, which are used for WordPress maintenance mode and tell Google to check back at a later time, a 500 error can have a negative impact on SEO if not fixed right away. If your site is only down for say 10 minutes and it’s being crawled consistently a lot of times the crawler will simply get the page delivered from cache. Or Google might not even have a chance to re-crawl it before it’s back up. In this scenario, you’re completely fine.
However, if the site is down for an extended period of time, say 6+ hours, then Google might see the 500 error as a site level issue that needs to be addressed. This could impact your rankings. If you’re worried about repeat 500 errors you should figure out why they are happening to begin with. Some of the solutions below can help.
How to Fix the 500 Internal Server Error
Where should you start troubleshooting when you see a 500 internal server error on your WordPress site? Sometimes you might not even know where to begin. Typically 500 errors are on the server itself, but from our experience, these errors originate from two things, the first is user error (client-side issue), and the second is that there is a problem with the server. So we’ll dive into a little of both.
This is never not annoying 😖 pic.twitter.com/pPKxbkvI9K
— Dare Obasanjo 🐀 (@Carnage4Life) September 26, 2019
Check out these common causes and ways to fix the 500 internal server error and get back up and running in no time.
1. Try Reloading the Page
This might seem a little obvious to some, but one of the easiest and first things you should try when encountering a 500 internal server error is to simply wait a minute or so and reload the page (F5 or Ctrl + F5). It could be that the host or server is simply overloaded and the site will come right back. While you’re waiting, you could also quickly try a different browser to rule that out as an issue.
Another thing you can do is to paste the website into downforeveryoneorjustme.com. This website will tell you if the site is down or if it’s a problem on your side. A tool like this checks the HTTP status code that is returned from the server. If it’s anything other than a 200 “Everything is OK” then it will return a down indication.

We’ve also noticed that sometimes this can occur immediately after you update a plugin or theme on your WordPress site. Typically this is on hosts that aren’t set up properly. What happens is they experience a temporary timeout right afterward. However, things usually resolve themselves in a couple of seconds and therefore refreshing is all you need to do.
2. Clear Your Browser Cache
Clearing your browser cache is always another good troubleshooting step before diving into deeper debugging on your site. Below are instructions on how to clear cache in the various browsers:
- How to Force Refresh a Single Page for All Browsers
- How to Clear Browser Cache for Google Chrome
- How to Clear Browser Cache for Mozilla Firefox
- How to Clear Browser Cache for Safari
- How to Clear Browser Cache for Internet Explorer
- How to Clear Browser Cache for Microsoft Edge
- How to Clear Browser Cache for Opera
3. Check Your Server Logs
You should also take advantage of your error logs. If you’re a Kinsta client, you can easily see errors in the log viewer in the MyKinsta dashboard. This can help you quickly narrow down the issue, especially if it’s resulting from a plugin on your site.

If your host doesn’t have a logging tool, you can also enable WordPress debugging mode by adding the following code to your wp-config.php file to enable logging:
define( 'WP_DEBUG', true );
define( 'WP_DEBUG_LOG', true );
define( 'WP_DEBUG_DISPLAY', false );
The logs are typically located in the /wp-content directory. Others, like here at Kinsta might have a dedicated folder called “logs”.
")
You can also check the log files in Apache and Nginx, which are commonly located here:
- Apache: /var/log/apache2/error.log
- Nginx: /var/log/nginx/error.log
If you’re a Kinsta client you can also take advantage of our analytics tool to get a breakdown of the total number of 500 errors and see how often and when they are occurring. This can help you troubleshoot if this is an ongoing issue, or perhaps something that has resolved itself.

If the 500 error is displaying because of a fatal PHP error, you can also try enabling PHP error reporting. Simply add the following code to the file throwing the error. Typically you can narrow down the file in the console tab of Google Chrome DevTools.
ini_set('display_errors', 1);
ini_set('display_startup_errors', 1);
error_reporting(E_ALL);
And you might need to also modify your php.ini file with the following:
display_errors = on4. Error Establishing a Database Connection
500 internal server errors can also occur from a database connection error. Depending upon your browser you might see different errors. But both will generate a 500 HTTP status code regardless in your server logs.
Below is an example of what an “error establishing a database connection” message looks like your browser. The entire page is blank because no data can be retrieved to render the page, as the connection is not working properly. Not only does this break the front-end of your site, but it will also prevent you from accessing your WordPress dashboard.

So why exactly does this happen? Well, here are a few common reasons below.
- The most common issue is that your database login credentials are incorrect. Your WordPress site uses separate login information to connect to its MySQL database.
- Your WordPress database is corrupted. With so many moving parts with themes, plugins, and users constantly deleting and installing them, sometimes databases get corrupted. This can be due to a missing or individually corrupted table, or perhaps some information was deleted by accident.
- You may have corrupt files in your WordPress installation. This can even happen sometimes due to hackers.
- Issues with your database server. A number of things could be wrong on the web hosts end, such as the database being overloaded from a traffic spike or unresponsive from too many concurrent connections. This is actually quite common with shared hosts as they are utilizing the same resources for a lot of users on the same servers.
Check out our in-depth post on how to fix the error establishing a database connection in WordPress.
5. Check Your Plugins and Themes
Third-party plugins and themes can easily cause 500 internal server errors. We’ve seen all types cause them here at Kinsta, from slider plugins to ad rotator plugins. A lot of times you should see the error immediately after installing something new or running an update. This is one reason why we always recommend utilizing a staging environment for updates or at least running updates one by one. Otherwise, if you encounter a 500 internal server error you’re suddenly scrambling to figure out which one caused it.
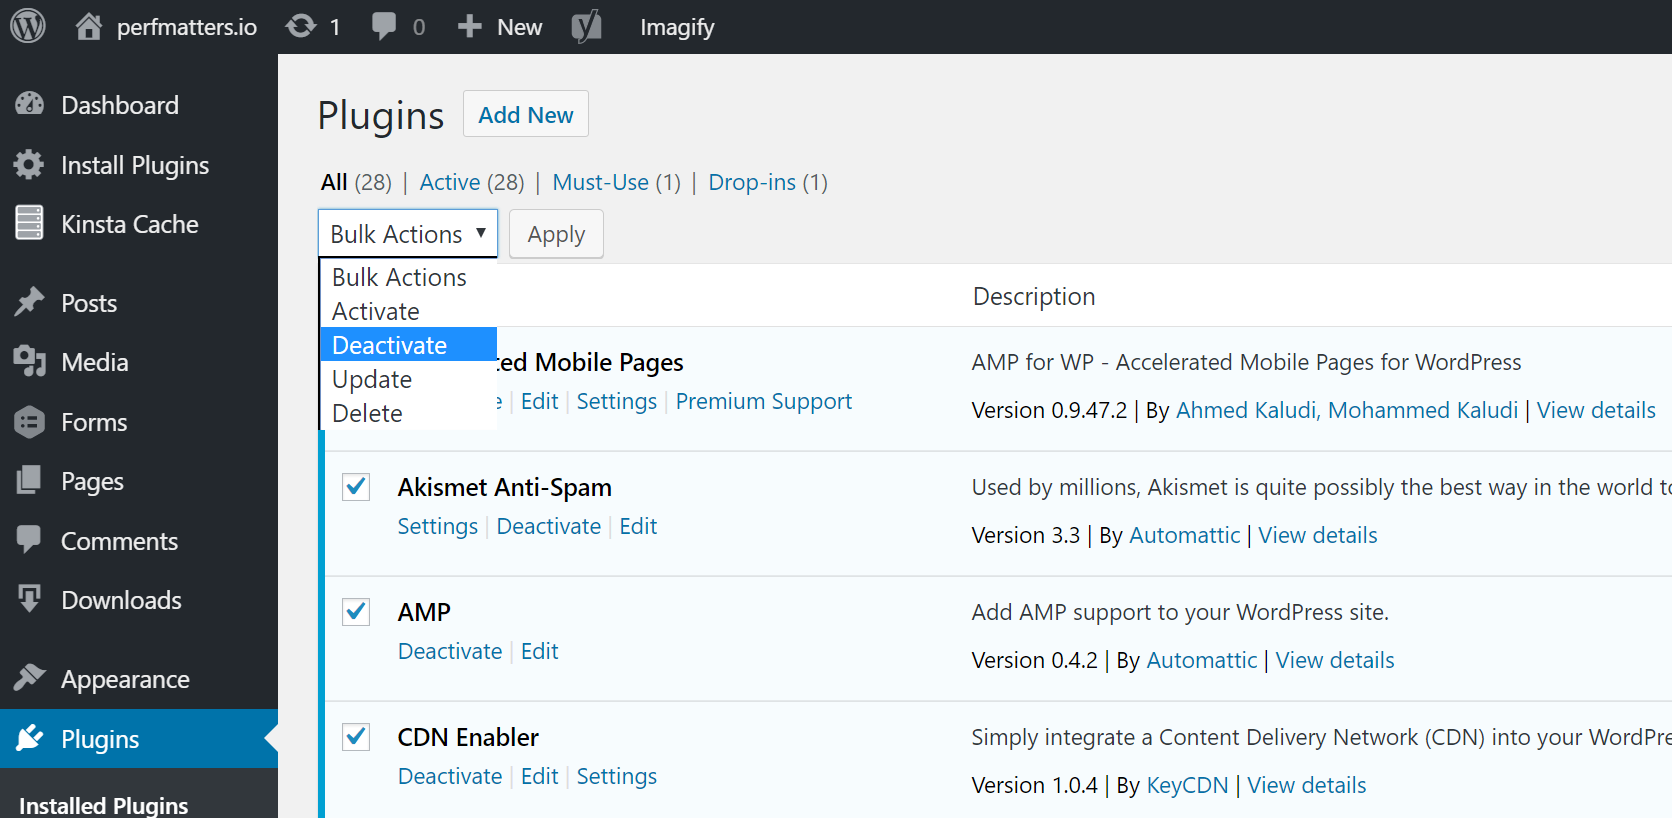
A few ways you can troubleshoot this is by deactivating all your plugins. Remember, you won’t lose any data if you simply deactivate a plugin. If you can still access your admin, a quick way to do this is to browse to “Plugins” and select “Deactivate” from the bulk actions menu. This will disable all of your plugins.
If this fixes the issue you’ll need to find the culprit. Start activating them one by one, reloading the site after each activation. When you see the 500 internal server error return, you’ve found the misbehaving plugin. You can then reach out to the plugin developer for help or post a support ticket in the WordPress repository.
If you can’t login to WordPress admin you can FTP into your server and rename your plugins folder to something like plugins_old. Then check your site again. If it works, then you will need to test each plugin one by one. Rename your plugin folder back to “plugins” and then rename each plugin folder inside of if it, one by one, until you find it. You could also try to replicate this on a staging site first.

Always makes sure your plugins, themes, and WordPress core are up to date. And check to ensure you are running a supported version of PHP. If it turns out to be a conflict with bad code in a plugin, you might need to bring in a WordPress developer to fix the issue.
6. Reinstall WordPress Core
Sometimes WordPress core files can get corrupted, especially on older sites. It’s actually quite easy to re-upload just the core of WordPress without impacting your plugins or themes. We have an in-depth guide with 5 different ways to reinstall WordPress. And of course, make sure to take a backup before proceeding. Skip to one of the sections below:
- How to reinstall WordPress from the WordPress dashboard while preserving existing content
- How to manually reinstall WordPress via FTP while preserving existing content
- How to manually reinstall WordPress via WP-CLI while preserving existing content
7. Permissions Error
A permissions error with a file or folder on your server can also cause a 500 internal server error to occur. Here are some typical recommendations for permissions when it comes to file and folder permissions in WordPress:
- All files should be 644 (-rw-r–r–) or 640.
- All directories should be 755 (drwxr-xr-x) or 750.
- No directories should ever be given 777, even upload directories.
- Hardening: wp-config.php could also be set to 440 or 400 to prevent other users on the server from reading it.
See the WordPress Codex article on changing file permissions for a more in-depth explanation.
You can easily see your file permissions with an FTP client (as seen below). You could also reach out to your WordPress host support team and ask them to quickly GREP file permissions on your folders and files to ensure they’re setup properly.

8. PHP Memory Limit
A 500 internal server error could also be caused by exhausting the PHP memory limit on your server. You could try increasing the limit. Follow the instructions below on how to change this limit in cPanel, Apache, your php.ini file, and wp-config.php file.
Increase PHP Memory Limit in cPanel
If you’re running on a host that uses cPanel, you can easily change this from the UI. Under Software click on “Select PHP Version.”

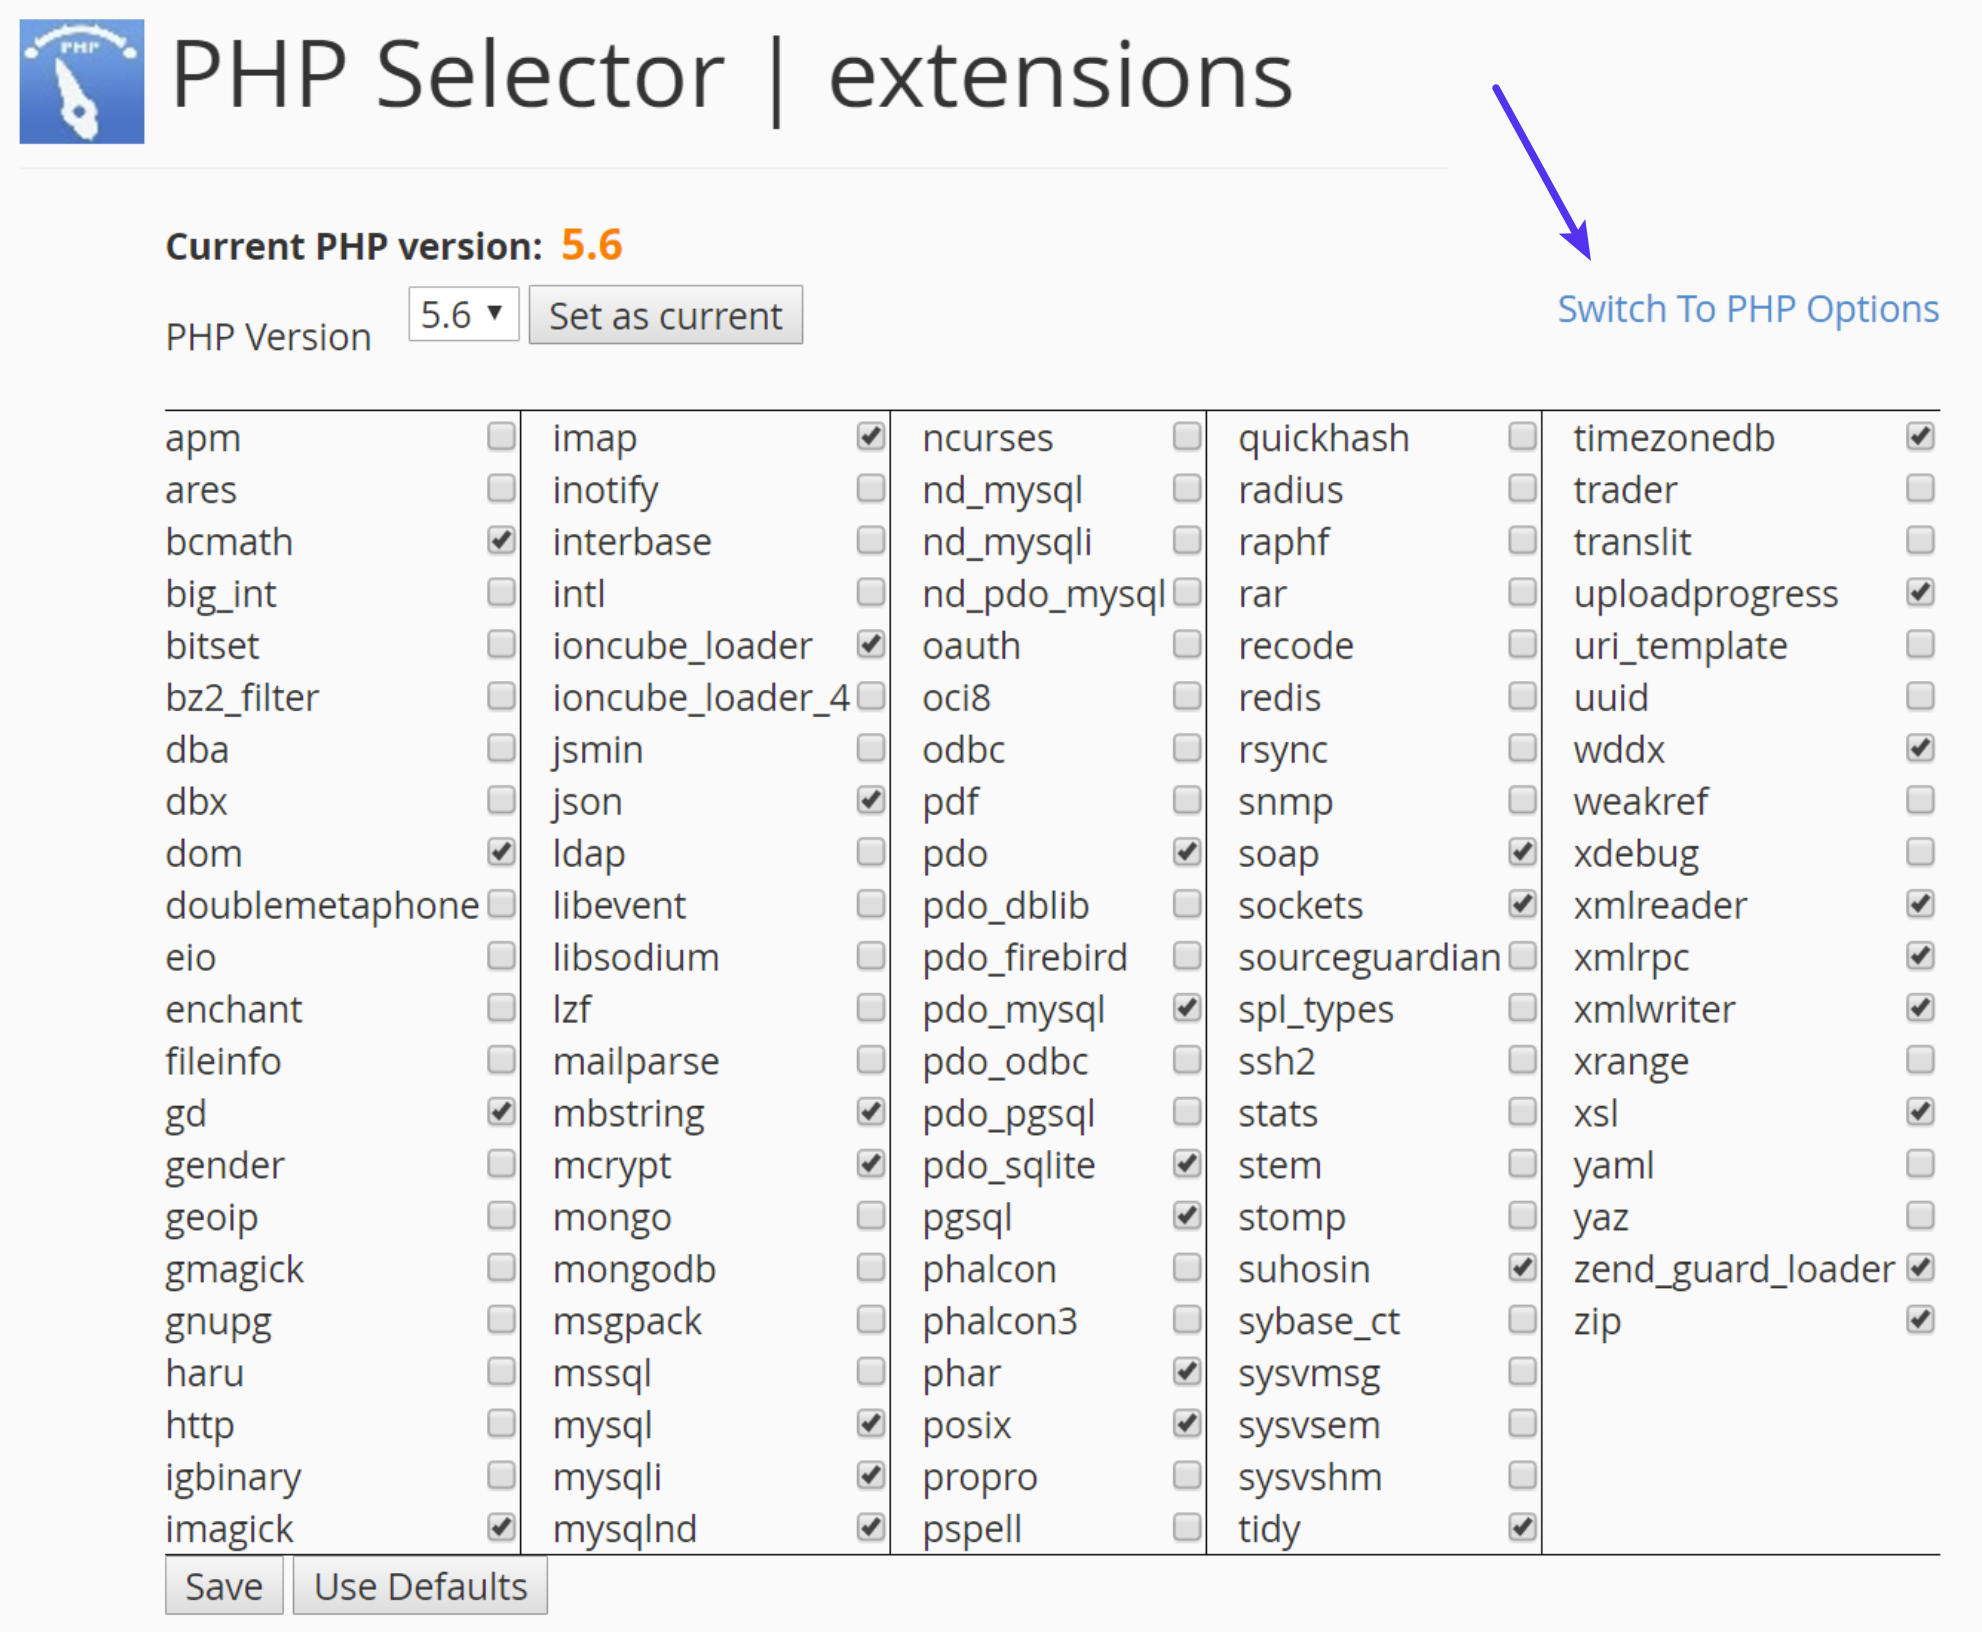
Click on “Switch to PHP Options.”
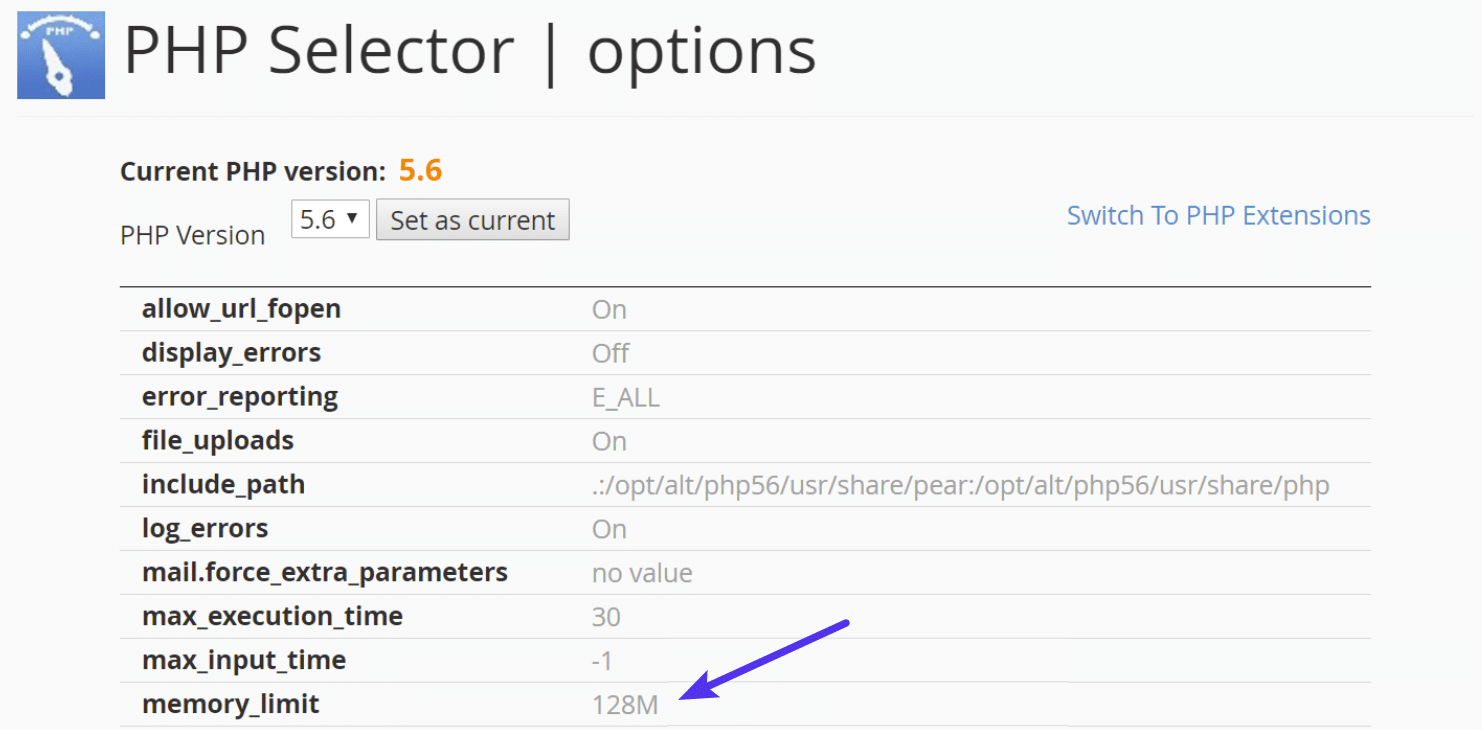
You can then click on the memory_limit attribute and change its value. Then click on “Save.”
Increase PHP Memory Limit in Apache
The .htaccess file is a special hidden file that contains various settings you can use to modify the server behavior, right down to a directory specific level. First login to your site via FTP or SSH, take a look at your root directory and see if there is a .htaccess file there.

If there is you can edit that file to add the necessary code for increasing the PHP memory limit. Most likely it is set at 64M or below, you can try increasing this value.
php_value memory_limit 128MIncrease PHP Memory Limit in php.ini File
If the above doesn’t work for you might try editing your php.ini file. Log in to your site via FTP or SSH, go to your site’s root directory and open or create a php.ini file.

If the file was already there, search for the three settings and modify them if necessary. If you just created the file, or the settings are nowhere to be found you can paste the code below. You can modify of course the values to meet your needs.
memory_limit = 128MSome shared hosts might also require that you add the suPHP directive in your .htaccess file for the above php.ini file settings to work. To do this, edit your .htaccess file, also located at the root of your site, and add the following code towards the top of the file:
<IfModule mod_suphp.c>
suPHP_ConfigPath /home/yourusername/public_html
</IfModule>
If the above didn’t work for you, it could be that your host has the global settings locked down and instead have it configured to utilize .user.ini files. To edit your .user.ini file, login to your site via FTP or SSH, go to your site’s root directory and open or create a .user.ini file. You can then paste in the following code:
memory_limit = 128MIncrease PHP Memory Limit in wp-config.php
The last option is not one we are fans of, but if all else fails you can give it a go. First, log in to your site via FTP or SSH, and locate your wp-config.php file, which is typically in the root of your site.

Add the following code to the top of your wp-config.php file:
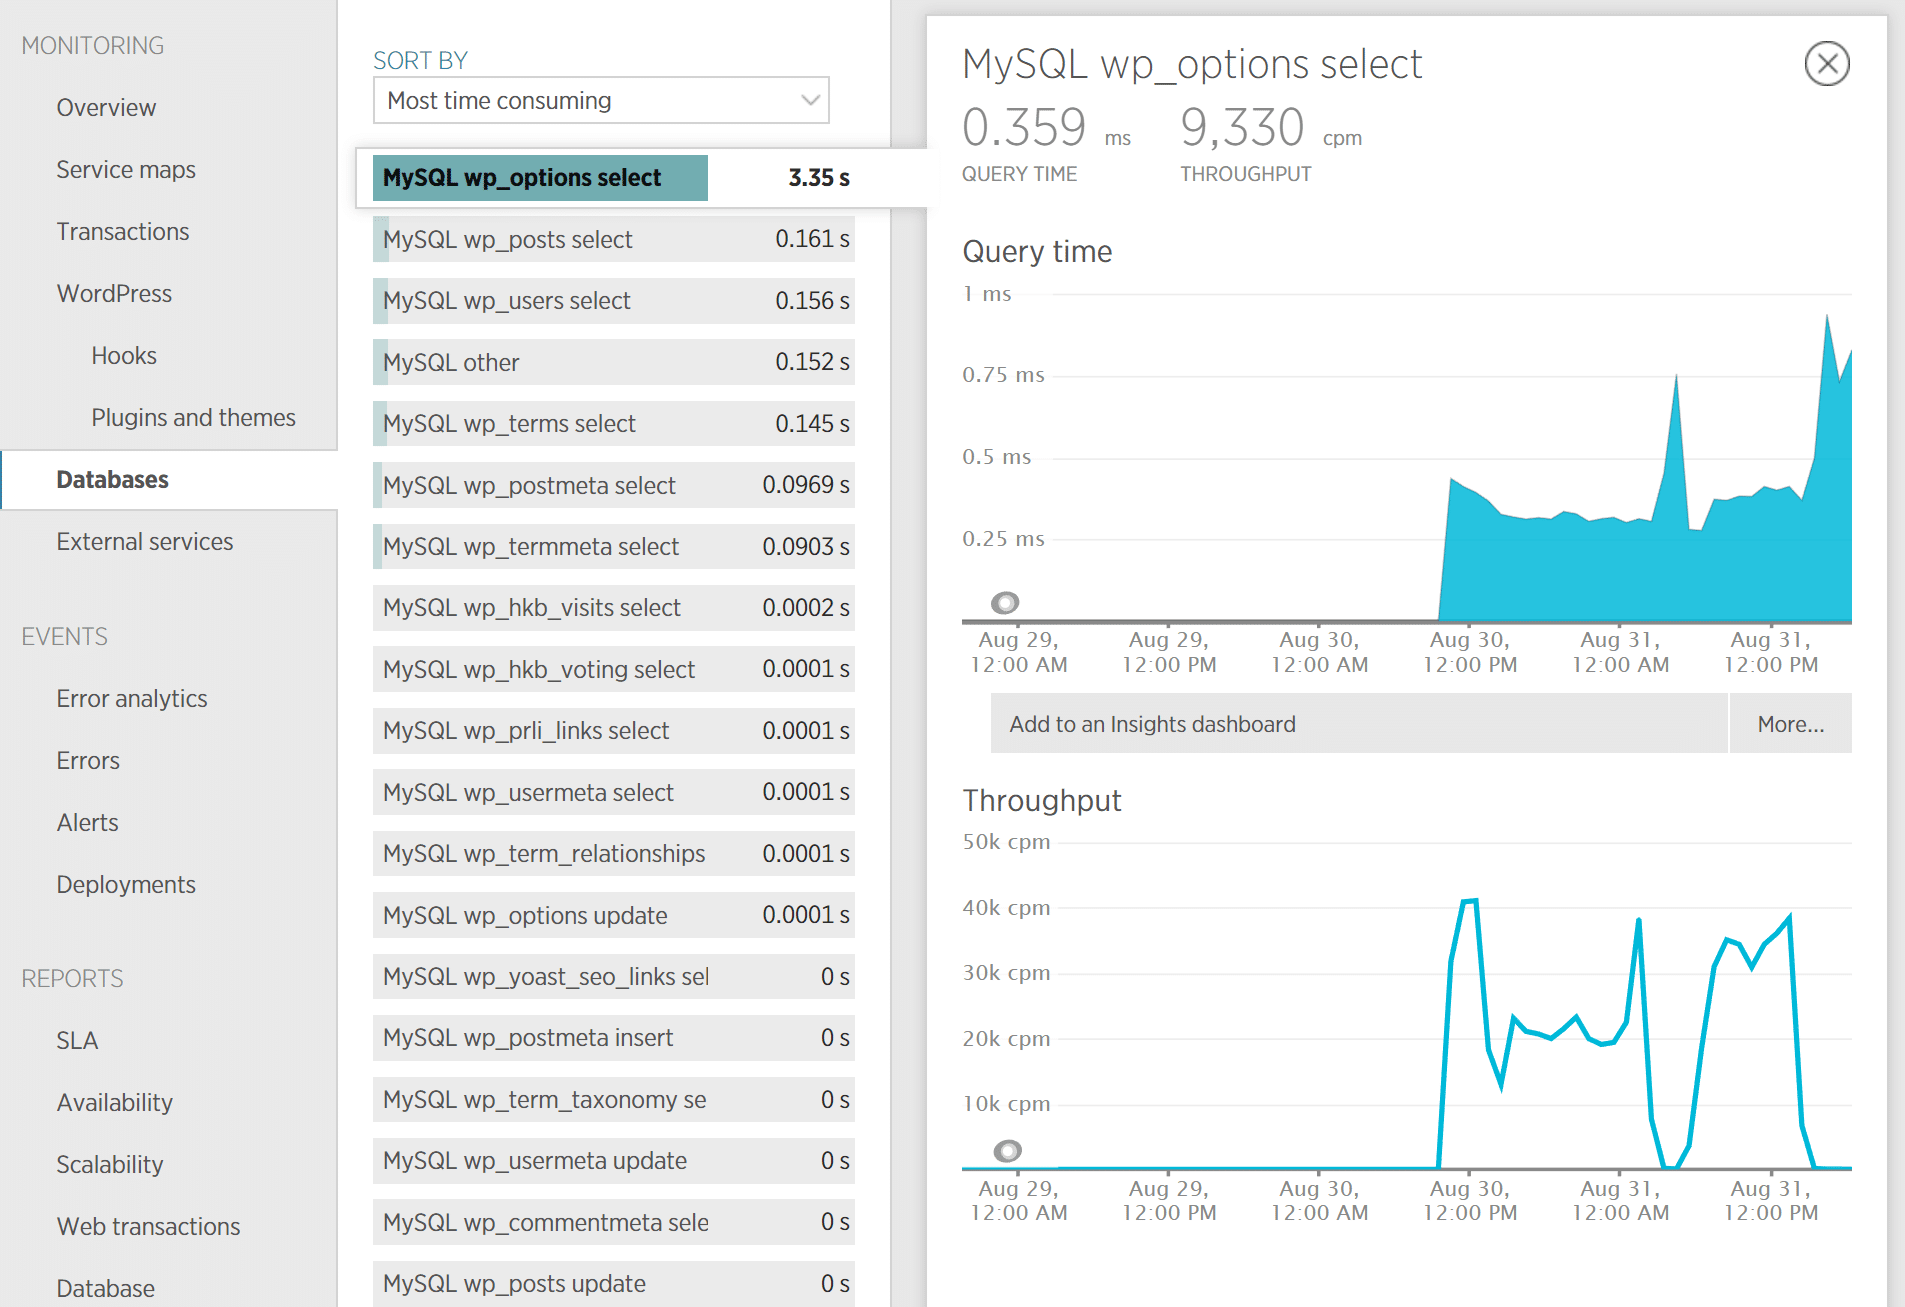
define('WP_MEMORY_LIMIT', '128M');You can also ask your host if you’re running into memory limit issues. We utilize the Kinsta APM tool and other troubleshooting methods here at Kinsta to help clients narrow down what plugin, query, or script might be exhausting the limit. You can also use your own custom New Relic key from your own license.
9. Problem With Your .htaccess File
Kinsta only uses Nginx, but if you’re using a WordPress host that is running Apache, it could very well be that your .htaccess file has a problem or has become corrupted. Follow the steps below to recreate a new one from scratch.
First, log in to your site via FTP or SSH, and rename your .htaccess file to .htaccess_old.
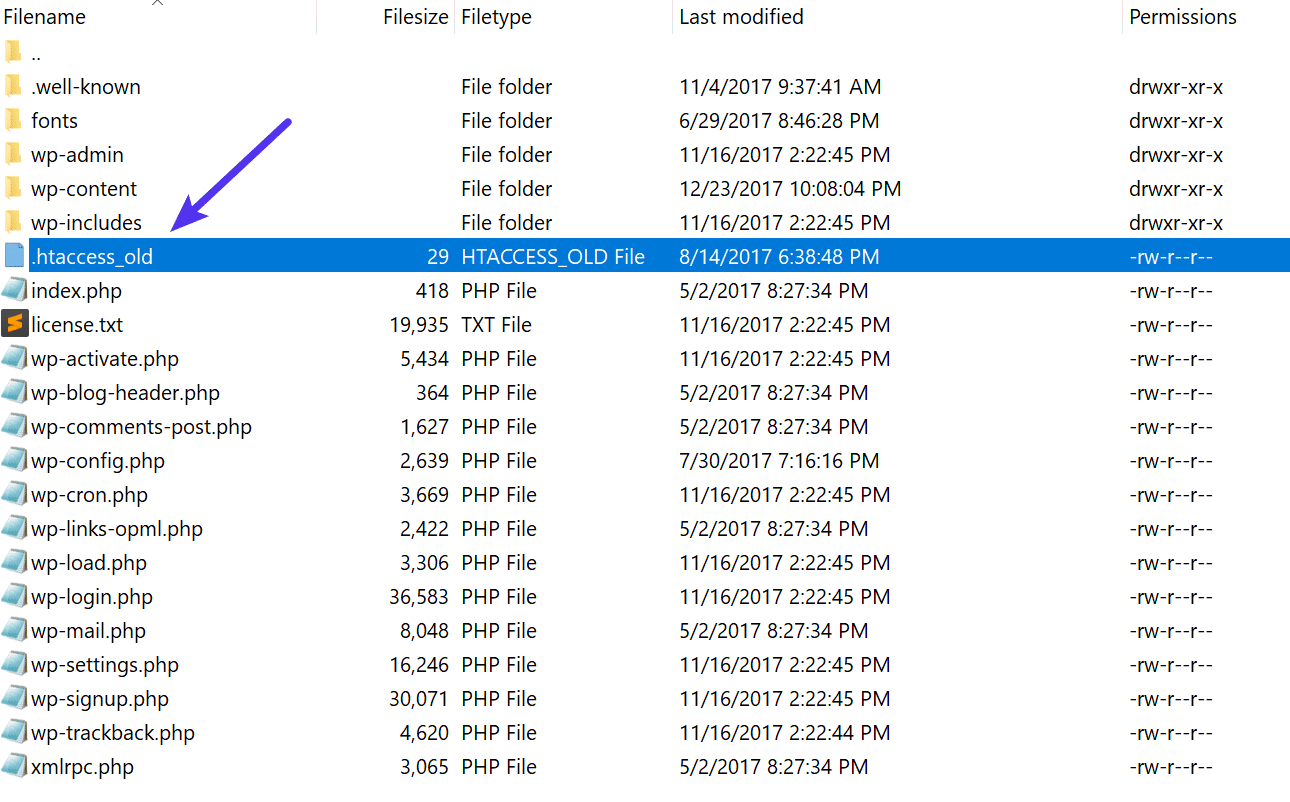
Normally to recreate this file you can simply re-save your permalinks in WordPress. However, if you’re in the middle of a 500 internal server error you most likely can’t access your WordPress admin, so this isn’t an option. Therefore you can create a new .htaccess file and input the following contents. Then upload it to your server.
# BEGIN WordPress
<IfModule mod_rewrite.c>
RewriteEngine On
RewriteBase /
RewriteRule ^index.php$ - [L]
RewriteCond %{REQUEST_FILENAME} !-f
RewriteCond %{REQUEST_FILENAME} !-d
RewriteRule . /index.php [L]
</IfModule>
# END WordPress
See the WordPress Codex for more examples, such as a default .htaccess file for multisite.
10. Coding or Syntax Errors in Your CGI/Perl Script
500 errors being caused by errors in CGI and Perl is a lot less common than it used to be. Although it’s still worth mentioning, especially for those using cPanel where there are a lot of one-click CGI scripts still being used. As AEM on Stack Overflow says:
CGI has been replaced by a vast variety of web programming technologies, including PHP, various Apache extensions like mod_perl, Java of various flavors and frameworks including Java EE, Struts, Spring, etc, Python-based frameworks like Django, Ruby on Rails and many other Ruby frameworks, and various Microsoft technologies.
Here are a few tips when working with CGI scripts:
- When editing, always used a plain text editor, such as Atom, Sublime, or Notepad++. This ensures they remain in ASCII format.
- Ensure correct permissions of chmod 755 are used on CGI scripts and directories.
- Upload your CGI scripts in ASCII mode (which you can select in your FTP editor) into the cgi-bin directory on your server.
- Confirm that the Perl modules you require for your script are installed and supported.
11. Server Issue (Check With Your Host)
Finally, because 500 internal server errors can also occur from PHP timing out or fatal PHP errors with third-party plugins, you can always check with your WordPress host. Sometimes these errors can be difficult to troubleshoot without an expert. Here are just a few common examples of some errors that trigger 500 HTTP status codes on the server that might have you scratching your head.
PHP message: PHP Fatal error: Uncaught Error: Call to undefined function mysql_error()...PHP message: PHP Fatal error: Uncaught Error: Cannot use object of type WP_Error as array in /www/folder/web/shared/content/plugins/plugin/functions.php:525We monitor all client’s sites here at Kinsta and are automatically notified when these types of errors occur. This allows us to be pro-active and start fixing the issue right away. We also utilize LXD managed hosts and orchestrated LXC software containers for each site. This means that every WordPress site is housed in its own isolated container, which has all of the software resources required to run it (Linux, Nginx, PHP, MySQL). The resources are 100% private and are not shared with anyone else or even your own sites.
PHP timeouts could also occur from the lack of PHP workers, although typically these cause 504 errors, not 500 errors. These determine how many simultaneous requests your site can handle at a given time. To put it simply, each uncached request for your website is handled by a PHP Worker.
When PHP workers are already busy on a site, they start to build up a queue. Once you’ve reached your limit of PHP workers, the queue starts to push out older requests which could result in 500 errors or incomplete requests. Read our in-depth article about PHP workers.
Monitor Your Site
If you’re worried about these types of errors happening on your site in the future, you can also utilize a tool like updown.io to monitor and notify you immediately if they occur. It periodically sends an HTTP HEAD request to the URL of your choice. You can simply use your homepage. The tool allows you to set check frequencies of:
- 15 seconds
- 30 seconds
- 1 minute
- 2 minutes
- 5 minutes
- 10 minutes
It will send you an email if and when your site goes down. Here is an example below.

This can be especially useful if you’re trying to debug a faulty plugin or are on a shared host, who tend to overcrowd their servers. This can give you proof of how often your site might actually be doing down (even during the middle of the night).
That’s why we always recommend going with an application, database, and managed WordPress host (like Kinsta).
Make sure to check out our post that explores the top 9 reasons to choose managed WordPress hosting.
Summary
500 internal server errors are always frustrating, but hopefully, now you know a few additional ways to troubleshoot them to quickly get your site back up and running. Remember, typically these types of errors are caused by third-party plugins, fatal PHP errors, database connection issues, problems with your .htaccess file or PHP memory limits, and sometimes PHP timeouts.
Was there anything we missed? Perhaps you have another tip on troubleshooting 500 internal server errors. If so, let us know below in the comments.
Get all your applications, databases and WordPress sites online and under one roof. Our feature-packed, high-performance cloud platform includes:
- Easy setup and management in the MyKinsta dashboard
- 24/7 expert support
- The best Google Cloud Platform hardware and network, powered by Kubernetes for maximum scalability
- An enterprise-level Cloudflare integration for speed and security
- Global audience reach with up to 35 data centers and 275 PoPs worldwide
Test it yourself with $20 off your first month of Application Hosting or Database Hosting. Explore our plans or talk to sales to find your best fit.
Sometimes NGINX server may give 500 Internal Server Error due to various reasons. In this article we will look at what does 500 Internal Server Error mean in NGINX and how to fix 500 Internal Server Error in NGINX.
NGINX gives 500 Internal Server Error when there is a server-side error that prevents NGINX from returning a proper response. It can be due to many different reasons such as faulty script, missing files referenced by code, inadequate file permissions, etc. NGINX is typically used as a reverse proxy server, so the most common reason for 500 Internal server is an error in one of its web servers like Apache that has encountered an issue and returned a 500 error response to NGINX, which is then returned to client browsers. There are various ways to fix internal server error in NGINX.
Bonus Read : How To Fix 504 Gateway Timeout Error in NGINX
How to Fix 500 Internal Server Error in NGINX
Here are the steps to fix 500 Internal Server Error in NGINX on localhost, CPanel, PHP, Ubuntu and other platforms.
1. Hard Refresh
Sometimes you may get 500 internal server error in NGINX because your server is being restarted at that moment, or there are too many requests for web server to handle.
So it doesn’t have enough resources to serve your request.
In such cases, you can simply do a hard refresh of your page to force the browser to get latest web page version and fix 500 internal server error in NGINX. You can do this by pressing
- Windows: Ctrl + F5
- Mac: Apple + R or Cmd + R
- Linux: F5
Bonus Read : How to Fix 502 Bad Gateway Error in NGINX
2. Examine Server Logs
Open your server log in a text editor to analyze the most recent requests. Every server log contains information about requested URLs and response code for each request.
Find out which requests result in 500 internal server error. It may be that only one page, or a few pages give this error while others work fine.
Find out which requests cause 500 internal server error. Once you have identified the problematic URLs, open a browser and request them again to confirm that is indeed the case.
Bonus Read : How to Increase Request Timeout in NGINX
3. Examine Your Script
Next, analyze the script to process the problematic requests. Is it actually present at the right location? Are you referencing it properly, in your URL mapping/routing file?
If your script refers to another file, find out if that file path is correct. If you have referenced any program/function, have you called it correctly?
4. Check File/Folder Permission
This can also be due to improper file/folder permissions. Did you add/modify any file/folder recently?
Typically, files need a 644 permission and folders need a 755 permission. You can use FileZilla (Windows) and Chmod (Linux) to modify file permissions.
You can also look at the permissions of other files & folders in your code and update the same for your files/folders accordingly.
Bonus Read : How to Increase File Upload Size in NGINX
5. Check redirections
If you have incorrectly setup any redirections in web server, it can give 500 internal server error. For example, if you use Apache web server, make sure you have properly configured mod_rewrite module and .htaccess file.
Also use a third-party tool to check the syntax of redirection/URL rewrite rules in your server configuration file.
6. Increase Script Timeout
You may also get 500 internal server error in NGINX if your web server (e.g Apache) is timing out on the request. In such cases, increase your web server (not NGINX) timeout value so that it stays connected to NGINX longer, and returns a proper response.
Hopefully, the above tips will help you fix 500 internal server error in NGINX.
Ubiq makes it easy to visualize data in minutes, and monitor in real-time dashboards. Try it Today!
Related posts:
- About Author
![]()