 The error: continuous value supplied to discrete scale pops up when the grouping variable isn’t provided as a factor. The issue is quite simple and can be solved with a slight change in the code.
Read on to know more about the cause and fix it at the earliest.
Contents
- Why Is Error: Continuous Value Supplied To Discrete Scale Occurring?
- – The Grouping Variable Isn’t a Factor
- How To Resolve the Continuous Value Error in R?
- – Convert the Grouping Variable To Fix Error: Continuous Value Supplied To Discrete Scale
- FAQ
- – What Does the Error: Discrete Value Supplied To Continuous Scale Informs?
- – What Are Discrete Values?
- – What do You Mean By Continuous Values?
- – What Are the Examples of Discrete and Continuous Data?
- – How To Convert Discrete Data Into Continuous in Tableau?
- – Why Continuous Data Is Better Than Discrete Data?
- Conclusion
The stated error is occurring because you haven’t converted the grouping variable or variables into factors. You can read the cause description below.
– The Grouping Variable Isn’t a Factor
You will get the continuous value vupplied to discrete scale error when the grouping variable doesn’t belong to the factor class. The following code snippet shows the erroneous code:
ggplot(data, aes(x, group = group, color = group)) +
geom_boxplot() +
scale_color_manual(values = c(“pink”, “green”, “purple”, “yellow”, “black”))
How To Resolve the Continuous Value Error in R?
You can resolve the given error by putting into use the following solution.
– Convert the Grouping Variable To Fix Error: Continuous Value Supplied To Discrete Scale
All that you need to do is to convert the grouping variable by passing the same to the factor() function. Here, you can use the factor() function like “as.factor()” or “factor().”
This code block has been provided to help you in resolving the error:
ggplot(data, aes(x, group = group, color = factor(group))) +
geom_boxplot() +
scale_color_manual(values = c(“pink”, “green”, “purple”, “yellow”, “black”))
FAQ
You can get the answers to your queries in this section. Please read below to ensure that you don’t miss out on some important information.
– What Does the Error: Discrete Value Supplied To Continuous Scale Informs?
The given error points towards the incorrect usage of the scale__continuous() function while using the ggplot() function. It informs that you are creating a continuous scale for a non-numeric or discrete value axis as seen here:
> a = data.frame(x = 1:20, y = c(“rose”, “sunflower”, “tulip”, “bluebell”, “snowdrop”))
> ggplot(a, aes(x, y)) + geom_point() + scale_y_continuous(limits = c(0, 15))
You can solve the said error by changing the axis in the scale__continuous() function as shown below:
> a = data.frame(x = 1:10, y = c(“rose”, “sunflower”, “tulip”, “bluebell”, “snowdrop”))
> ggplot(a, aes(x, y)) + geom_point() + scale_x_continuous(limits = c(0, 15))
– What Are Discrete Values?
Discrete values contain integers that can’t be subdivided into multiple parts. You will find the numeric, non-negative, finite, and countable integers under the given category.
– What do You Mean By Continuous Values?
Continuous values include the infinite number of values that lie between any two realistic points. The numeric and date/time values fall under this category.
– What Are the Examples of Discrete and Continuous Data?
The total count of planets in the Solar System is an example of discrete data. It is because the planets can be counted easily. On the other hand, the quantity of stars in the sky is an example of continuous data because it’s quite difficult to count the same.
– How To Convert Discrete Data Into Continuous in Tableau?
You can convert discrete data into continuous by clicking on the field and choosing continuous. However, if you want to perform the same action from the Data pane, then right-click on the required field and select “Convert to Continuous.” As a result, you’ll notice that the color of the field has changed.
Remember that the green fields represent continuous values while the blue fields represent discrete data.
– Why Continuous Data Is Better Than Discrete Data?
Continuous data is better than discrete data because the former involves an infinite number of values that ensure more accuracy. Furthermore, the continuous data helps in finding out how the variables change with the passing time.
Conclusion
Certainly, adding only a single function to your program makes things work as if there wasn’t any issue in the first place. Here is the one-liner that you should never forget to stay right with your R projects:
- Eror: continuous value supplied to discrete scale issue happens because you haven’t converted the grouping variable or variables into factors.
- Converting the grouping variable into a factor can help you in dealing with the continuous value error.
- You can use the factor() function like “as.factor()” or “factor().” to solve the error.
 Remember, not all errors need complex solutions but some only demand a slight change before they leave your program to never come back.
- Author
- Recent Posts

Position Is Everything: Your Go-To Resource for Learn & Build: CSS,JavaScript,HTML,PHP,C++ and MYSQL.
The “discrete value supplied to continuous scale” error message is one that results from a simple coding mistake. It is among the simplest mistakes to find and correct. Unfortunately, it is also an easy mistake to make in the first place. However, once you understand it it is also easy to avoid.
Special note: all the code examples used in this article require the ggplot2 package. If you do not have it installed you can use the following code to install it.
install.packages("ggplot2")Once it is installed you will need to run the following code before running any projects that use the ggplot2 package.
library("ggplot2")The circumstances of this error.
The “discrete value supplied to continuous scale” message occurs when using the ggplot() function along with the scale__continuous()scale function to specify a specific scale for a graph.
# r error discrete value supplied to continuous scale
> a = data.frame(x = 1:10, y = c("cat", "dog", "bat", "cow", "rat"))
> ggplot(a, aes(x, y)) + geom_point()
In this example of the basic usage of ggplot(), the scale function is not used. However, it does produce a successful graph of the data frame. Getting this message requires including the scale function and doing so incorrectly. That turns out to be the key to fixing the continuous variable problem and that is using the scale function correctly.
What is causing this error?
The “discrete value supplied to continuous scale” message is caused by erroneous use of the scale function along with ggplot().
# discrete value supplied to continuous scale r error
> a = data.frame(x = 1:10, y = c("cat", "dog", "bat", "cow", "rat"))
> ggplot(a, aes(x, y)) + geom_point() + scale_y_continuous(limits = c(0, 15))
Error: Discrete value supplied to continuous scale
The mistake in this example that leads to the error message is trying to create a continuous scale for the “y” axis. The problem is that the “y” vector is a discrete variable consisting of words, i.e. a character vector or categorical variable, not a numeric vector, which would create continuous data. This means that you are trying to create a continuous value for a discrete value axis. It does not work resulting in our message.
The “discrete value supplied to continuous scale” message can be fixed but making sure that at least one of the position scales in the data frame is a continuous value rather than a discrete scale and applying the scale function to that character vector to make it a numeric vector.
# discrete value supplied to continuous scale solution
> a = data.frame(x = 1:10, y = c("cat", "dog", "bat", "cow", "rat"))
> ggplot(a, aes(x, y)) + geom_point() + scale_x_continuous(limits = c(0, 15))
As you can see from this example using “x” instead of “y” in the scale function fixes the problem by supplying a numeric value list instead of characters. This factor makes all the difference.
# discrete value continuous scale r solution
> a = data.frame(x = 1:10, y = c(1:5))
> ggplot(a, aes(x, y)) + geom_point() + scale_y_continuous(limits = c(0, 7))
The other option as seen above is to turn “y” into a numeric list as illustrated above. The one problem with this solution is that the dataset graph, scatter plot, box plot, or bar chart is losing some of its meaning. This is because the model no longer has the categorical variable labels that it previously did.
The “discrete value supplied to continuous scale” error message is more of a minor nuisance than a serious problem. It is simply a matter of using the wrong vector from the data frame. Correcting that one continuous data mistake in your plotting code solves the problem in a simple and easy manner.
R Error: discrete value supplied to continuous scale
Hm, I was actually wrong — wrapping it with as.integer() doesn’t actually make a difference. I think I had actually switched to a different version of ggplot2 when I was doing that test.
At any rate, after playing with this some more, I think there are two challenges:
- issues with the legend. When the code worked (as in 0.9.0) it generated the image with a table of points, but there was no legend. Even if there were a legend, it would just be labeled 1, 2, 3, etc — not very meaningful.
- In order to make things work, I think things need to be changed in the scales package. Specifically, the
train_discretefunction inscale-discrete.rwould need to be modified to accept numerics in the way described in option 3 above. This will affect other aesthetics other than shape, so it’s important to decide whether this integer-only behavior should be used for all discrete identity scales.
At any rate, here’s a test:
test_that("shape identity scale works for numerics", {
  ssi <- scale_shape_identity()

  expect_identical(scale_train(ssi, 1:5), 1:5)

  expect_error(scale_train(ssi, c(.5, 1:4)))
})
If you don’t think that the scales package should be changed, here’s a quick fix for the code that’s breaking R CMD check:
df2 <- data.frame(x = 1:5 , y = 1:25, z = 1:25)
s <- ggplot(df2, aes(x = x, y = y))
s + geom_point(aes(shape = as.character(z)), size = 4) +
  scale_shape_manual(breaks = as.character(df2$z), values = df2$z, guide = FALSE)
One error you may encounter in R is:
Error: Discrete value supplied to continuous scale
This error occurs when you attempt to apply a continuous scale to an axis in ggplot2, yet the variable on that axis is not numeric.
This tutorial shares exactly how to fix this error.
How to Reproduce the Error
Suppose we have the following data frame in R:
#create data frame
df = data.frame(x = 1:12,
                y = rep(c('1', '2', '3', '4'), times=3))

#view data frame
df

    x y
1   1 1
2   2 2
3   3 3
4   4 4
5   5 1
6   6 2
7   7 3
8   8 4
9   9 1
10 10 2
11 11 3
12 12 4
Now suppose we attempt to create a scatterplot with a custom y-axis scale using the scale_y_continuous() argument:
library(ggplot2)

#attempt to create scatterplot with custom y-axis scale
ggplot(df, aes(x, y)) +
  geom_point() +
  scale_y_continuous(limits = c(0, 10))

Error: Discrete value supplied to continuous scale
We receive an error because our y-axis variable is a character instead of a numeric variable.
We can confirm this by using the class() function:
#check class of y variable
class(df$y)

[1] "character"
How to Fix the Error
The easiest way to fix this error is to convert the y-axis variable to a numeric variable before creating the scatterplot:
library(ggplot2)

#convert y variable to numeric
df$y <- as.numeric(df$y)

#create scatterplot with custom y-axis scale
ggplot(df, aes(x, y)) +
  geom_point() +
  scale_y_continuous(limits = c(0, 10))

Notice that we don’t receive any error because we used scale_y_continuous() with a numeric variable instead of a character variable.
You can find the complete online documentation for the scale_y_continuous() function here.
Additional Resources
The following tutorials explain how to perform other common plotting functions in ggplot2:
How to Set Axis Breaks in ggplot2
How to Remove Axis Labels in ggplot2
How to Rotate Axis Labels in ggplot2
This error occurs you try to set limits on the y-axis using scale_y_continuous() and the y variable is not numeric. This error can happen if you use character or factor type for the y variable in your data. You can solve this error by using numeric values instead of character or factor. Alternatively, you can subset the data frame before plotting the data.
This tutorial will go through the error in detail and how to solve it with code examples.
Table of contents
- Example
- Solution #1
- Solution #2
- Summary
Example
Consider the following data frame that consists of two variables. The first variable contains 100 numeric values, which are samples from the normal distribution. The second variable consists of four categories. Let’s look at the data frame:
set.seed(0)
data <- data.frame(x = rnorm(100),          # Create example data
                   y = c("0-18", "18-35", "35-45", "45+"))
head(data)
           x     y
1  1.2629543  0-18
2 -0.3262334 18-35
3  1.3297993 35-45
4  1.2724293   45+
5  0.4146414  0-18
6 -1.5399500 18-35
Let’s attempt to plot the data using ggplot2.
library("ggplot2") # load ggplot2 package


ggplot(data, aes(x, y)) +
  geom_point()
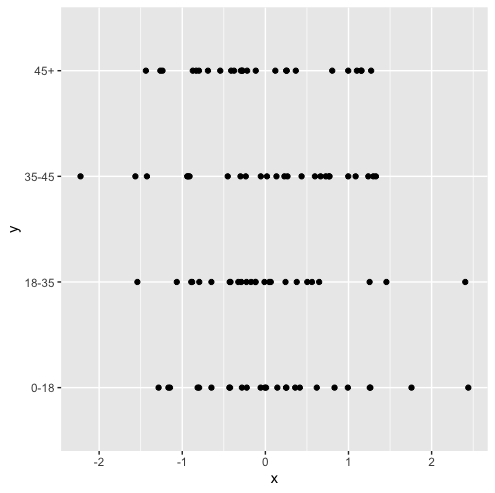
We successfully created a ggplot2 graph showing the example data.
Next, we will try to change the limits on the y-axis using scale_y_continuous(). We want to exclude values that are in the 45+ category. Let’s look at the code:
ggplot(data, aes(x, y)) +
  geom_point() +
  scale_y_continuous(limits = c(0, 45))
Let’s run the code to see what happens:
Error: Discrete value supplied to continuous scale
The error occurs because the y-variable is discrete, and scale_y_continuous() expects a numeric variable to limit.
Solution #1
We can solve this error by preprocessing our data. We can use subsetting to exclude the values that are in the 45+ category. Let’s look at the additional code:
data_new <- data[data$y != "45+", ]
Next, we will plot the data without using scale_y_continuous. Let’s look at the revised code:
ggplot(data_new, aes(x, y)) +
     geom_point()
Let’s run the code to get the result:
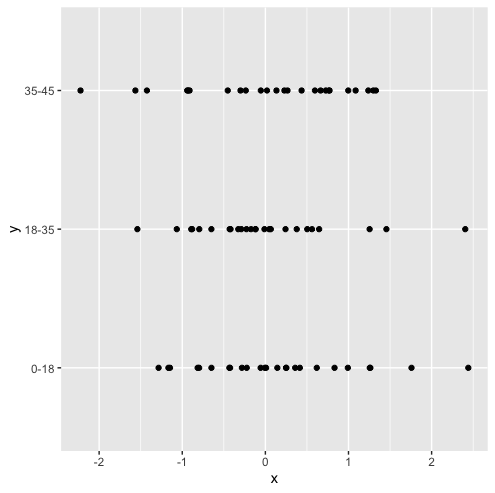
We successfully plotted the data with the values in the 45+ category excluded.
Solution #2
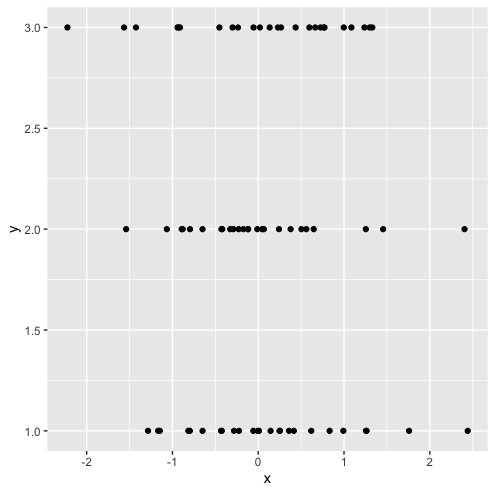
We can also solve this error by using numeric instead of character as the y variable. Let’s look at the revised code:
library("ggplot2")

set.seed(0)
data <- data.frame(x = rnorm(100),
                   y = c(1:4))
head(data)
In the above code, we use a vector of numeric values from 1 to 4 instead of a vector of character values. Let’s look at the data frame:
        x y
1  1.2629543 1
2 -0.3262334 2
3  1.3297993 3
4  1.2724293 4
5  0.4146414 1
6 -1.5399500 2
We can now use scale_y_continuous to exclude values that have a y value of 4, which is equivalent to excluding values from the previous data frame with a y value of 45+.
ggplot(data, aes(x, y)) +
     geom_point() +
     scale_y_continuous(limits = c(1, 3))
Let’s run the code to get the result:
Summary
Congratulations on reading to the end of this tutorial!
For further reading on R related errors, go to the articles:
- How to Solve R Error in file(file, “rt”) cannot open the connection
- How to Solve R Error: aesthetics must be either length 1 or the same as the data
- How to Solve R Error: continuous value supplied to discrete scale
- How to Solve R Error: missing values are not allowed in subscripted assignments of data frames
Go to the online courses page on R to learn more about coding in R for data science and machine learning.
Have fun and happy researching!
To create a plot using a continuous scale in ggplot2, you need to define a continuous variable as the aesthetic for the x or y-axis.
While continuous scale, you might face an error, and in today’s post, we will discuss that error and how to fix it.
The error: discrete value supplied to continuous scale occurs in R when you try to plot a categorical variable on a continuous scale.
Let’s see the R code that generates the error.
library(ggplot2)

df <- data.frame(x = 1:10, y = c("bmw", "audi", "mercedez", "ferrari", "jaguar"))

ggplot(df, aes(x, y)) + geom_point() + scale_y_continuous(limits = c(0, 10))
Output
Error: Discrete value supplied to continuous scalePlease run the above code in RStudio because this is a problem of plot and visualizing the plots in RStudio is easy.
We used the ggplot2 library in the above code to plot the data.
If you have not installed the ggplot2, you can install it in RStudio and by command.
install.packages("ggplot2")After installing, you need to import the library in your R Script.
The code you provided is causing the same error “discrete value supplied to continuous scale” because you’re trying to plot a categorical variable “y” on a continuous scale.
Even if you set the limits of the y-axis to a range of continuous values, it doesn’t change the fact that the variable “y” is categorical.
How to fix error: discrete value supplied to continuous scale in R
There are two easy ways to fix the error.
- Use the numeric vector.
- Map the categorical variable to a discrete scale, such as a factor using the as.factor() function.
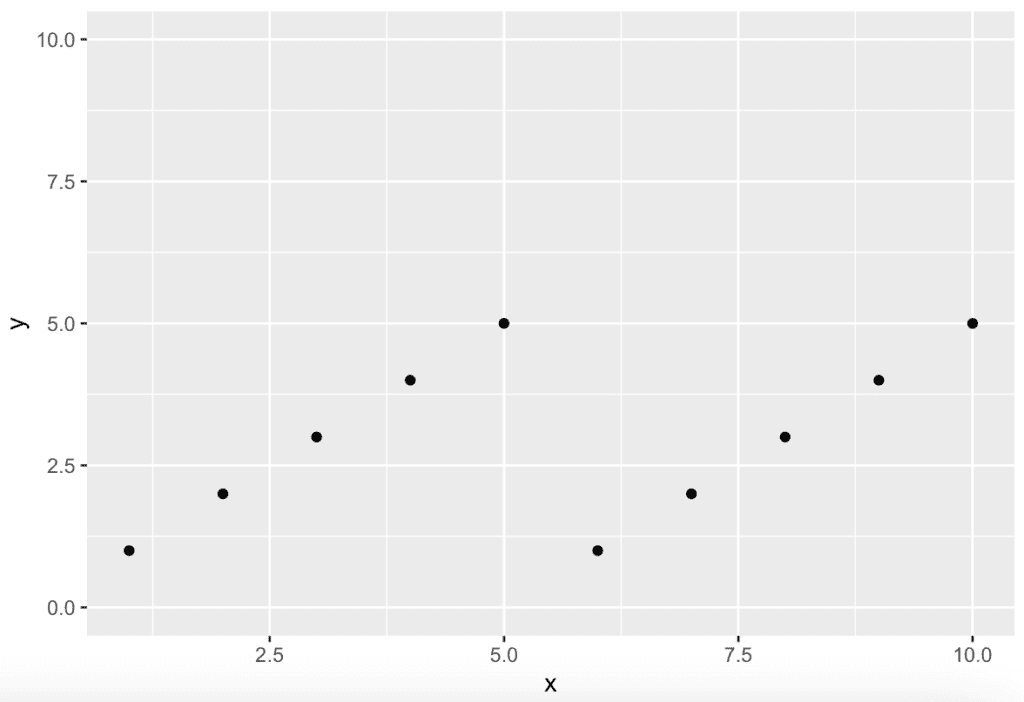
Solution 1: Use the numeric vector
library(ggplot2)

df <- data.frame(x = 1:10, y = c(1:5))

ggplot(df, aes(x, y)) + geom_point() + scale_y_continuous(limits = c(0, 10))
Output
Solution 2: Use the as.factor() function
To fix the error, use the as.factor() function and convert the variable “y” to a factor before plotting it.
The as.factor() is a built-in R function that converts an R object like a vector or a data frame column from numeric to factor.
ggplot(df, aes(x, as.factor(y))) + geom_point() + scale_y_continuous(limits = c(0, 10))It will probably resolve the error you are facing!
Conclusion
The error: discrete value supplied to continuous scale is raised when you plot a categorical variable on a continuous scale. The easy fix is using the numeric vector or converting the vector into a factor using the as.factor() function.

Krunal Lathiya is a Software Engineer with over eight years of experience. He has developed a strong foundation in computer science principles and a passion for problem-solving. In addition, Krunal has excellent knowledge of Data Science and Machine Learning, and he is an expert in R Language.
As easy as programming has become over the years, it’s still full of random bugs and glitches that keep popping up from time to time. A missed semi-colon here, the wrong syntax there and the entire code comes crashing down.
In this article, we’re talking about how to fix the “discrete value supplied to continuous scale” in the R programming language.
What causes this error?
The error mostly triggers due to incorrect use of the Scale function in R, along with the ggplot() function. Since discrete variables contain character vectors or categorical variables, and not continuous data (which requires a numeric vector), you get the error.
This isn’t exactly a bug in the function, just a mathematical matter of using the wrong vector for a particular data frame. Correcting this one mistake will resolve the error with both the scale and ggplot functions.
Also read: Fix: Python was not found; run without arguments to install
How to fix this?
The easiest way to resolve the issue is by ensuring that at least one of the position scales being used to plot the graph has a continuous value instead of a discrete vector (or scale) and then using the scale function.
a = data.frame(x = 1:10, y = c("This", "is", "a", "code", "snippet"))
ggplot(a, aes(x, y)) + geom_point() + scale_x_continuous(limits = c(0, 15))
The aforementioned example has a numeric vector and a discrete vector. Using x in place of y with the ggplot function resolves the error for us as x is a numeric vector.
The second approach would be to convert at least one of the discrete vectors into a numeric vector, hence gaining a continuous value for plotting. Keep in mind that this applies to all other values as well. If you’re experiencing the error with other data types and/or values, try using a numeric vector to fix the issue.
Also read: What is ErP ready?

Someone who writes/edits/shoots/hosts all things tech and when he’s not, streams himself racing virtual cars.
You can contact him here: [email protected]
In this article, I’ll illustrate how to handle the ggplot2 error “Discrete value supplied to continuous scale” in R programming.
Preparing the Examples
data(iris)                                         # Iris flower data as example data.frame
head(iris)
#   Sepal.Length Sepal.Width Petal.Length Petal.Width Species
# 1          5.1         3.5          1.4         0.2  setosa
# 2          4.9         3.0          1.4         0.2  setosa
# 3          4.7         3.2          1.3         0.2  setosa
# 4          4.6         3.1          1.5         0.2  setosa
# 5          5.0         3.6          1.4         0.2  setosa
# 6          5.4         3.9          1.7         0.4  setosa
install.packages("ggplot2")                        # Install ggplot2 package
library("ggplot2")                                 # Load ggplot2
With the default specifications, it works fine:
ggplot(iris,                                       # ggplot2 plot of iris data
       aes(x = Species,
           y = Petal.Width)) +
  geom_point()

Example 1: Replicating the Error Message: Discrete value supplied to continuous scale
ggplot(iris,                                       # False usage of scale_x_continuous
       aes(x = Species,
           y = Petal.Width)) +
  geom_point() +
  scale_x_continuous(limits = c(0, 100))
# Error: Discrete value supplied to continuous scale
Example 2: Solving the Error Message: Discrete value supplied to continuous scale
Create a subset of the data frame:
iris_subset <- iris[iris$Species != "setosa", ] # Remove category from data
Draw ggplot2 plot of subset:
ggplot(iris_subset,                                # ggplot2 plot with less categories
       aes(x = Species,
           y = Petal.Width)) +
  geom_point()

 report this ad