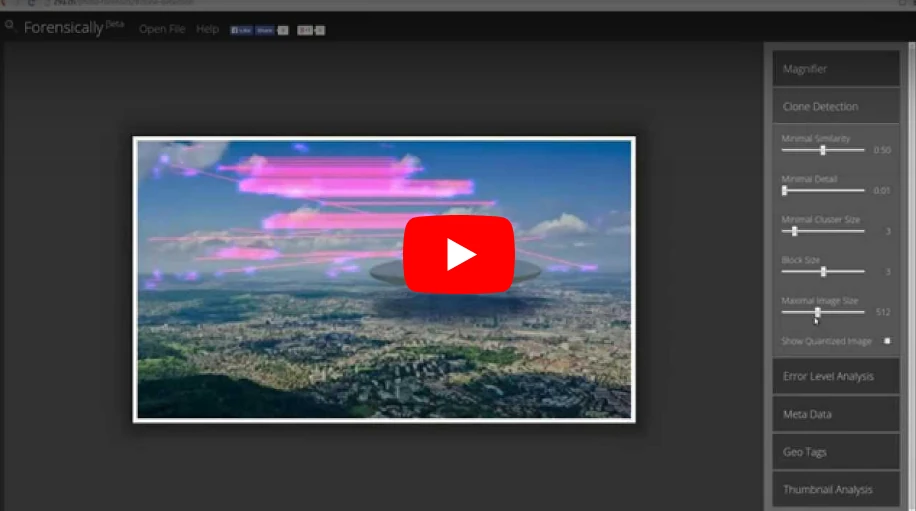
Forensically is a set of free tools for digital image forensics. It includes clone detection, error level analysis, meta data extraction and more. It is made by Jonas Wagner.
You can read a bit more about it in this blog post.
You should think of forensically as a kind of magnifying glass.
It helps you to see details that would otherwise be hidden.
Just like a magnifying glass it can’t tell true from false or good from evil,
but it might just help you to uncover the truth.
Also absence of evidence is still not evidence of absence
and Extraordinary claims require extraordinary evidence.
Tutorial Video
The Tools
Magnifier
The magnifier allows you to see small hidden details in an image.
It does this by magnifying the size of the pixels and the contrast within the window.
MagnificationAlso known as the zoom factor.
EnhancementThere are three different enhancements available at the moment. Histogram Equalization, Auto Contrast and Auto Contrast by Channel. Auto Contrast mostly keeps the colors intact, the others can cause color shifts. Histogram Equalization is the most robost option. You can also set this to none.
Clone Detection
The clone detector highlights similar regions within an image. These can be a good indicator that a picture
has been manipulated using the clone tool. Note that this tool is a first attempt and not yet very refined.
Regions that are similar are marked in blue and connected with a red line.
If a lot of regions overlap the result can look white.
Minimal SimilarityDetermines how similar the cloned pixels need to be to the original.
Minimal DetailBlocks with less detail than this are not considered when searching for clones.
Minimal Cluster SizeDetermines how many clones of a similar region need to be found in order for them to show up as results.
Blocksize (2n)Determines how big the blocks used for the clone detection are.
You generally don’t want to touch this.
Maximal Image SizeThe maximal width or height of the image used to perform the clone search. Bigger images take longer to analyze.
Show Quantized ImageShows the image after it has been compressed. Can be useful to tweak Minimal Similarity and Minimal Detail. Blocks that have been rejected because they do not have enough detail show up as black.
Error Level Analysis
This tool compares the original image to a recompressed version.
This can make manipulated regions stand out in various ways.
For example they can be darker or brighter than similar regions which
have not been manipulated.
There is a good tutorial on ELA on fotoforensics.com.
The results of this tool can be misleading, watch the video and read the tutoria for details.
JPEG QualityThis should match the original quality of the image that has been photoshopped.
Error ScaleMakes the differences between the original and the recompressed image bigger
Magnifier EnhancementThere are three different enhancements available at the moment. Histogram Equalization, Auto Contrast and Auto Contrast by Channel. Auto Contrast mostly keeps the colors intact, the others can cause color shifts. Histogram Equalization is the most robost option. You can also set this to none.
OpacityThe opacity of the differences layer. If you lower it you will see more of the original image.
Noise Analysis
This is tool is basically a reverse denoising algorithm. Rather than
removing the noise it removes the rest of the image.
It is using a super simple separable median filter to isolate the noise.
It can be useful for identifying manipulations to the image like
airbrushing, deformations, warping and perspective corrected cloning.
It works best on high quality images. Smaller images tend to contain to
little information for this to work.
You can read more about noise analysis in my blog post Noise Analysis for Image Forensics.
Noise AmplitudeMakes the noise brighter.
Equalize HistogramApplies histogram equalization to the noise.
This can reveal things but it can also hide them.
You should try both histogram equalization and scale
to analyze to noise.
Magnifier EnhancementThere are three different enhancements available at the moment. Histogram Equalization, Auto Contrast and Auto Contrast by Channel. Auto Contrast mostly keeps the colors intact, the others can cause color shifts. Histogram Equalization is the most robost option. You can also set this to none.
OpacityThe opacity of the noise layer. If you lower it you will see more of the original image.
Level Sweep
This tool allows you to quicky sweep through the histogram of an image.
It magnifies the contrast of certain brightness levels.
On use of this tool is to make edges that were introduced when copy pasting content more visible.
To use this tool simple move your mouse over the image and scroll with your mouse wheel.
Look for interesting discontinuities in the image.
A position of 0.5 and a width of 32 would mean that
127-32/2 would be the equal to 0 in the output. 127+32/2 would be equal to 256.
SweepThe position in the histogram to be inspected.
You can quickly change this parameter by using the mouse wheel while hovering over the image,
this allows you to sweep through the histogram.
WidthThe amount of values (or width of the slice of the histogram) to be inspected.
You the default should be fine.
OpacityThe opacity of the sweep layer. If you lower it you will see more of the original image.
Luminance Gradient
The luminance gradient tool analyses the changes in brightness along the x and y axis of the image.
It’s obvious use is to look at how different parts of the image are illuminated in order to find anomalies.
Parts of the image which are at a similar angle (to the light source) and under similar illumination should have a similar color;
Another use is to check edges. Similar edges should have similar gradients.
If the gradients at one edge are significantly sharpe than the rest it’s a sign that the image could have been copy pasted.
It does also reveal noise and compression artifacts quite well.
PCA
This tool performs principal component analysis on the image.
This provides a different angle to view the image data which makes discovering
certain manipulations & details easier. This tool is currently single threaded and quite
slow when running on big images.
I have provided an example of how this tool can be used in my short article Principal Component Analysis for Photo Forensics.
InputThe data to run the PCA on.
Mode
- Projection: projection of the value in the image onto the principal component.
- Difference: Difference between the input and the closest point on the selected principal component.
- Distance: Distance between the input and the closest point on the selected principal component.
- Component: The closest point on the selected principal component.
ComponentThe component of the PCA you want to inspect.
The first component contains the most variance.
The later components can reveal more hidden details.
LinearizeEnables operation in linear space rather than in gamma space. Slower.
InvertInverts the output data.
EnhancementThere are three different enhancements available at the moment. Histogram Equalization, Auto Contrast and Auto Contrast by Channel. Auto Contrast mostly keeps the colors intact, the others can cause color shifts. Histogram Equalization is the most robost option. You can also set this to none.
OpacityThe opacity of the sweep layer. If you lower it you will see more of the original image.
Meta Data
This tool displays the hidden exif meta data in the image, if there is any.
Geo Tags
This tool shows the GPS location where the image was taken, if it is stored in the image.
Thumbnail Analysis
This tool shows the hidden preview image inside of the original image if there is one.
The preview can reveal details of the original image or the camera it was taken with.
Opacityopacity of the preview image on top of the original image.
Show Differencesenabled this will show the differences between the original image and the preview stored within it.
JPEG Analysis
This tool extracts meta data out of JPEG Files. You can learn more about it in my post JPEG Forensics in Forensically.
Comments
Some applications store interesting data in the comments of a JPEG file.
Quantization Tables
The quantization matrices used to compress a JPEG file
reveals information about what software was last used to save the file in question.
Forensically currently recognizes three types of quantization matrices:
- Standard JPEG
- Adobe (latest CC should be complete, the rest is still incomplete)
- Non Standard
I’m missing a complete set of sample images for older photoshop versions using the 0-12 quality scale. If you happen to have one and would be willing to share it please let me know.
Most software and internet services save their files using the quantization matrices defined by the standard.
The exception to this rule are Adobe products, which use their own custom quantization tables.
Jpegs produces by digital cameras often use non standard color matrices.
So if you know that the camera that an image was supposedly taken with uses one type of quantization matrix
and the image you are trying to verify uses a different type of quantization matrix this can be a good indicator
that the file has been edited or at least resaved.
From what I have seen iPhones use non standard quantization tables with qualities around 92.
Android phones tend to use the standard quantization matrices, but there are exceptions to this.
For more information about this technique please look at the presentation
Using JPEG Quantization Tables to Identify Imagery Processed by Software
by Jesse Kornblum.
Structure
The sequence of markers in a JPEG file.
In general JPEG images taken with a camera with the same settings should result in the same sequence.
String Extraction
This tool scans for binary contents of the image looking for sequences of ascii characters.
It is a great fallback to view meta data that is in an image in a format that Forensically does not understand yet.
It will output sequences of alpha numeric characters longer than 4, or sequences of 8 or more non control ascii characters.
This allows you to discover meta data that is hidden or not recognized by forensically.
The relevant data is genreally stored at the beginning or end of the file.
An interesting string to look for is bFBMD followed by a sequence of numbers and letters a-f (hex encoding).
This string is added to (some) images by facebook.
It is inspired by the classic unix strings command.
You can find some more information about how to use this tool in my post JPEG Forensics in Forensically.
FAQ
Are my images uploaded to your server?
No! I respect your privacy. All of your images stay on your computer. They are never uploaded to any cloud or server.
Can I open RAW images using this app?
No, RAW images are not supported. The highest
quality format you can use is 24-bit PNG.
Can I use this app offline?
Yes you can if you are using a modern web browser like firefox or chrome.
Offline mode is enabled. You can open this application even if you are offline.Offline mode is not working with your current setup.
What other similar software can you recommend?
Ghiro looks pretty cool and is open source. You can try it online on imageforensic.org.
Changelog
2017-06-14
Fixed a typo in the JPEG module which recognized progressive JPEGs as lossless. Updated help page.
2017-02-05
Added JPEG Analysis and String Extraction tools. See JPEG Forensics in Forensically.
2016-07-14
Added PCA tool.
2016-07-02
Added luminance gradient tool. Tweaked clone detection default settings.
2016-06-30
Added offline support for modern browsers via service workers.
2015-08-21
Added noise analysis tool.
2015-08-20
Added a new enhancement option to the magnifier (histogram equalization). Added magnifier to Error Level Analysis.
2015-08-16
Initial Public release
Credits
Clone Detection
The clone detection tool was inspired by the paper Detection of Copy-Move Forgery in Digital Images by Jessica Fridrich, David Soukal, and Jan Lukáš. But the actual algorithm used is my own.
Error Level Analysis
I got the concept out of the presentation A Picture’s Worth… Digital Image Analysis and Forensics by Neal Krawetz
Luminance gradient
This is another tecnique inspired by Neal Krawetz
Open Source Libraries
This software was built using the following open source components.
I want to thank all of their authors for making my life easier, and projects like this possible.
- babel
- babel-polyfill
- babel-preset-es2015
- babelify
- bluebird
- canvas-to-blob
- chai
- chai-as-promised
- chai-spies
- console-polyfill
- exif-parser
- grunt
- grunt-autoprefixer
- grunt-browserify
- grunt-contrib-compress
- grunt-contrib-connect
- grunt-contrib-copy
- grunt-contrib-cssmin
- grunt-contrib-jade
- grunt-contrib-uglify
- grunt-contrib-watch
- grunt-rsync
- grunt-sass
- grunt-shell
- hammerjs
- jquery
- ml-matrix
- ml-pca
- mocha
- natural-sort
- sass
- sinon
- sinon-chai
- source-map-support
- sw-precache
- underscore
- yargs
Как определить монтаж на фото
Разоблачаем фейки, фотошоп и ретушь
02 апреля 2017 — 40 комментариев — 189559 просмотров — 3300 слов
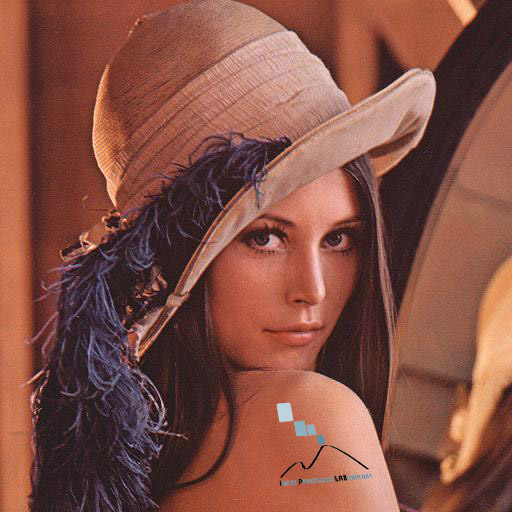
В 1855 году пионер портретной фотографии Оскар Рейландер сфотографировал себя несколько раз и наложил негативы друг на друга при печати. Получившееся двойное селфи считается первым фотомонтажом в истории. Наверное лайков тогда собрал, уух…
Теперь же каждый подросток с фотошопом, смартфоном и интернетом сможет даже лучше. Правда чаще всего эти коллажи неимоверно доставляют. А вот профессионалы научились скрывать свою работу весьма качественно. Это был вызов.
Совокупность методов анализа модифицированных изображений назвали Image Forensics, что можно перевести как «криминалистика изображений». В интернете существует куча сервисов, заявляющих, что они за два клика помогут определить подлинность фото. Особенно доставляют самые тупые, которые идут смотреть EXIF и если там нет оригинальных метаданных камеры начинают громко вопить «вероятно фото было модифицировано». И про них даже в New York Times пишут (а про тебя нет).
Я пересмотрел около десятка сервисов и остановился на одном: Forensically. В нём реализовано большинство описанных в статье алгоритмов, я буду часто на него ссылаться. Все описанные методы названы оригинальными английскими названиями, чтобы не было путаницы.
Однако возможность загрузить свою фотку в какой-то сервис и посмотреть на красивые шумы не сделает из вас сыщика. Поначалу может быть трудно и непонятно, а первые эксперименты точно окажутся неудачными. У меня так же было. Тут как в спорте — нужен намётанный глаз и опыт как должно и не должно быть. Умение не просто смотреть на шумные картинки, а видеть еле заметные искажения в них.
Не существует 100% метода, позволяющего определить фейк. Но есть человеческие ошибки.
Найдет самые глупые косяки
Главный инструмент — наши глаза. Так что первым делом стоит открыть фото в любимом графическом редакторе или просмотрщике, поставить зум в 1000% внимательно втыкать в предположительное место монтажа. С этого начинается любой анализ. Чем более неопытный монтажер попался — тем проще будет найти косяки, артефакты и склейки. Иногда фейки настолько кривые, что можно нагуглить оригинал используя поиск по изображениям или заметив несоответствия в EXIF.
Помимо этого, в любом уважающем себя редакторе есть инструменты для цветокоррекции. В Preview.app на маке они спрятаны в меню Tools > Adjust Color… Вытягивание различных ползунков поможет лучше разглядеть детали.
Brightness and contrast. Сделать темные области ярче, а яркие темнее. Теоретически поможет лучше разглядеть артефакты, склейки и другие места, которые неопытный фотошопер просто замазюкал темненьким и посчитал, что не заметят.
Color adjustment. Увеличивая насыщенность или яркость разных цветов, можно заметить неестественные переливы и границы склейки.
Invert. Часто помогает увидеть скрытую информацию в однотонных объектах.
Sharpen and blur. Добавление резкости поможет прочитать надписи на табличках, есть целые сервисы, которые могут побороть заблюренные области.
Normalization and histograms. Работа с гистограммой по сути объединяет сразу несколько методов в один. Если вы прошарены в графике — гистограммы будут серьезным оружием.
Даже если определить фейковость сразу не удалось, у вас уже могли появиться полезные наблюдения, чтобы перейти к следующим методам с страшными математическими названиями.
Найдет свежую кисть, деформацию, клонирование и вставку чужеродных частей
Реальные фотографии полны шума. От матрицы камеры или фотосканера, от алгоритмов сжатия или по естественным природным причинам. Графические редакторы же этот шум не создают, их инструменты живут в «идеальном мире», потому чаще всего «размазывают» шум оригинального изображения. Кроме того, два изображения чаще всего обладают разной степенью зашумленности.
Заметить шум глазом не так-то просто, но можно взять любой инструмент Noise Reduction и инвертировать его действие, оставив от фотографии только шум. Хорошо работает для свежеобработанных изображений и в случаях, когда автор решил, что нашел очень подходящие на вид изображения. Но легко обманывается, если знать как.
Поиграть самому можно здесь.
Добавить своего шума. Самый очевидный вариант. Хочешь скрыть свои косяки — навали на фото столько шума, чтобы забить оригинальный.
Пережать JPEG. Уменьшение качества изображение в два раза делает шумы неразличимыми (вот исследование).
Найдет свежие артефакты наложения изображений или текста
Каждый раз при сохранении картинки ваш редактор заново прогоняет её через кучу преобразований — конвертирует цвета, делит на блоки, усредняет значения пикселей, и.т.д. Он занимается этим даже если вы выбрали 100% качество при сохранении, так уж устроен алгоритм JPEG. Интересующиеся могут почитать про него глубокую статью полную косинусных преобразований.
Так как JPEG — формат сжатия с потерями, то при каждом сохранении растет количество математических усреднений, ошибок или более популярный термин — «артефактов». Два сохранения с 90% сжатием примерно эквивалентно одному с 81% по количеству этих самых артефактов. На практике это может принести пользу. Даже если зоркий глаз не видит разницы между 80% и 85% сжатием, то наверное есть инструменты, которые наглядно покажут это различие? Да, Error Level Analysis или ELA.
Фейки с наложениями чаще всего делают подыскав нужные изображения где-нибудь в гугле. Вероятность, что найденные изображения будут с одинаковым уровнем артефактов, ну, крайне мала. Социальные сети или даже специализированные хранилища фотографий всё равно пережимают изображения под себя при загрузке, чтобы не платить за хранение гигабайтов ваших селфи из отпуска. Обратное тоже верно — если вы накладываете на найденное в интернете изображение свежую фотографию со своей камеры, она будет заметно выделяться по качеству. Заметно не для глаза, а для ELA — он покажет разительно меньше артефактов на вашей новой фотографии.
Простота и известность делает ELA самым популярным методом работы мамкиных интернет-сыщиков, от чего его начинают пихать везде, где только могут. Как будто других методов просто не существует и ELA может объяснить всё. Тот же Bellingcat использует его чуть ли не в каждом втором своём расследовании. Хотелось немного остудить пыл всех услышавших новую умную аббревиатуру.
ELA — не панацея. Сфотографируйте летящую чайку на фоне ровного синего неба (ага, особенно в Москве), сохраните её в jpg и прогоните через анализатор ошибок. Результат покажет просто огромное количество артефактов на чайке и их полное отсутствие на фоне, из чего начинающие сразу сделают вывод — чайка прифотошоплена. Да что там начинающие, сама команда Bellingcat с этим бывало глупо и по-детски наёбывалась. Алгоритм JPEG достаточно чисто работает на ровных цветовых областях и градиентах, и куда больше ошибается на резких переходах — отсюда такой результат, а не из-за ваших домыслов.
Из-за растущей популярности Error Level Analysis я уже слышал призывы запретить и не принимать его всерьез. Не буду столь категоричен, лишь посоветую не бежать писать разоблачения, если ELA показал вам какие-то шумы на краях. ОН НЕ ТАК РАБОТАЕТ. Думайте головой и помните как JPEG устроен внутри. Вот если ELA очертил четкий квадрат там, где его не должно быть, либо заметил разительную разницу в шумах при неотличимости на глаз — наверное стоит задуматься. Не уверены — проверяйте другими методами.
Поиграть с ELA можно тут.
Много раз пересохранить. Все свои манипуляции алгоритм JPEG делает внутри блоков максимум 8×8 пикселей. В теории нужно 64 раза пересохранить изображение, чтобы уровни ошибок стали неотличимы друг от друга. На практике же это происходит гораздо раньше, достаточно пересохранить картинку раз 10 и ELA, да и некоторые другие методы, больше не увидят ничего полезного.
Изменить размер. Чтобы не напрягаться с пересохранением можно поступить еще проще — отресайзить изображение на какой-нибудь коэффициент не кратный степени двойки. То есть в 2 раза (50%) уменьшить не подойдет, а вот что-нибудь типа на 83% — уже всё, никакой ELA больше не поможет.
Смонтировать из одного источника или из lossless-формата. Вы сфотографировали двух людей на свой фотоаппарат, или скачали фотографии из какого-нибудь блога, где автор скорее всего пересохранял их всего раз-два. Либо наложили друг на друга две PNG’шки. Во всех этих случаях ELA не покажет ничего интересного.
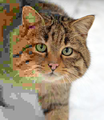
Найдет ретушь, компьютерную графику, хромакей, Liquify, Blur
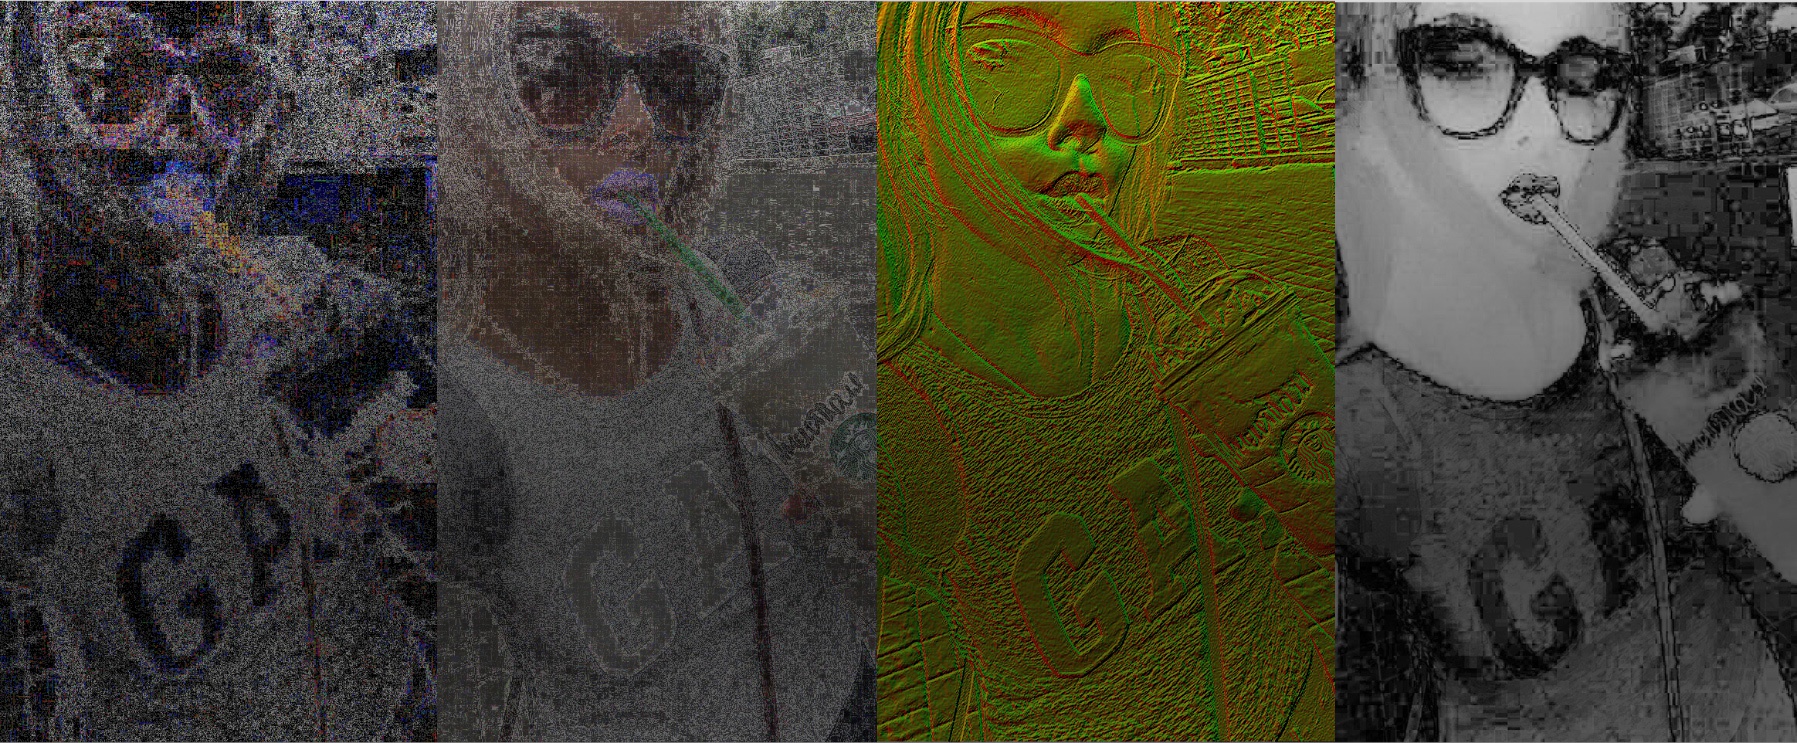
В жизни свет никогда не падает на объекты абсолютно равномерно. Области ближе к источнику всегда ярче, дальше — темнее. Никакого расизма, только физика. Если разбить изображения на небольшие блоки, скажем 3×3 пикселя, то внутри каждого можно будет заметить переход от более темных пикселей к светлым. Примерно так:
Направление этого перехода так и называется — градиент освещенности. Можно попробовать нарисовать кучу маленьких стрелочек на изображении и понаблюдать за их направлением.
На первом изображении свет падает сверху и стрелочки направлены хаотически — это характеризует рассеянный свет. Второе изображение — компьютерная графика, на ней свет падает слишком идеально, никаких шумов и отклонений как на настоящем фото. Третье изображение — фотография с резким переходом, в центре стрелочки массово смотрят в самую яркую сторону, а на фоне — рассеяны так же, как на первом фото.
Рисовать стрелочки хоть и наглядно, но мы физически не сможем изобразить все градиенты освещенности для каждого блока поверх картинки. Стрелочки займут всё изображение и мы не увидим ничего. Потому для большей наглядности придумали не рисовать их, а использовать цветовое кодирование. Для направления вектора понадобится две координаты, и еще одна для его длины — а у нас как раз есть для этого три цветовых компоненты — R, G, B. В итоге получатся вот такие карты освещенности.
В реальной жизни нас окружает ограниченное число источников света. В помещении это лампы, вспышки, окна. В ясный день на улице чаще всего источник света только один — это Иисус, спаситель наш солнце. Если на карте освещенности находящиеся рядом объекты сильно отличаются по направлению падения света — у нас есть главный кандидат на монтаж.
Но еще лучше карты освещенности справляются с определением ретуши. Surface Blur, Liquify, Clone Stamp и другие любимые инструменты фотографов начинают светиться на картах освещенности как урановые ломы тихой весенней ночью. Нагляднее всего выглядит анализ фотографий из журналов или рекламных плакатов — там ретушеры не жалеют блюра и морфинга, а это непаханное поле для практики.
Лично я считаю карты освещенности одним из самых полезных методов, потому что он чаще всего срабатывает и мало кто знает как его обмануть. Поиграться можно здесь.
Не знаю. Говорят помогает изменение яркости и насыщенности цветов по отдельности, но на бытовых фотографиях такие вещи всегда будут заметны глазу. Если вы знаете простой и действующий метод — расскажите в комментах под этим абзацем, всем будет интересно.
Найдет копипаст, вытягивание и несоотвествие цветов, Healing Brush, Clone Stamp
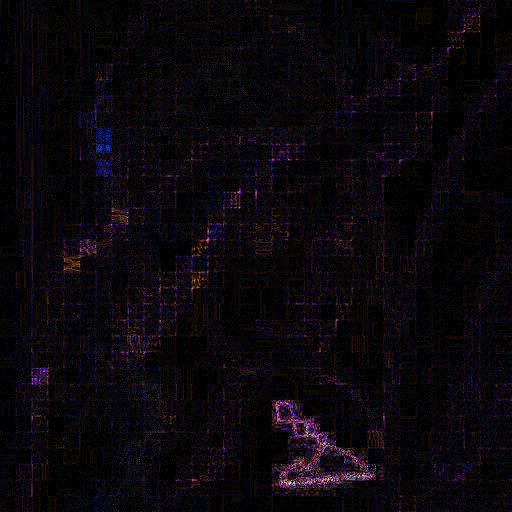
Метод PCA или на русском «метод главных компонент». Чтобы ко мне не придрались, мол, слишком просто всё рассказываешь и наверное не шаришь, вот описание PCA для рептилоидов.
Метод главных компонент осуществляет переход к новой системе координат y1,…,ур в исходном пространстве признаков x1,…,xp которая является системой ортонормированных линейных комбинаций. Линейные комбинации выбираются таким образом, что среди всех возможных линейных нормированных комбинаций исходных признаков первая главная компонента обладает наибольшей дисперсией. Геометрически это выглядит как ориентация новой координатной оси у1 вдоль направления наибольшей вытянутости эллипсоида рассеивания объектов исследуемой выборки в пространстве признаков x1,…,xp. Вторая главная компонента имеет наибольшую дисперсию среди всех оставшихся линейных преобразований, некоррелированных с первой главной компонентой. Она интерпретируется как направление наибольшей вытянутости эллипсоида рассеивания, перпендикулярное первой главной компоненте. Следующие главные компоненты определяются по аналогичной схеме.
А теперь для людей: представьте, что цветовые компоненты R, G и B мы взяли как оси координат — каждая от 0 до 255. И на этом трехмерном графике точками отметили все пиксели, которые есть на нашем изображении. Получится что-то похожее на картинку ниже.
Можно заметить, что наши пиксели не рассосались по графику равномерно, а вытянулись в округлую колбасятину. Все реальные изображения так устроены, потому что science, bitches. Теперь мы можем построить новые оси — вдоль колбасятины (это самая главная) и две поперек — это и будут те самые «главные компоненты». Для каждого изображения набор цветов будет разным, колбасятина и главные компоненты будут направлены по-своему.
Так что вся эта математика нам дает? Дело в том, что если какие-то цвета на изображении стоят «не на своих местах» — они будут сильно выделяться из этого облака пикселей, то есть на карте PCA начнут светиться ярким белым цветом. Это может означать локальную цветокоррекцию или же полную вклейку. Диаграммы PCA может построить тот же Forensically. На них будет изображено расстояние от каждого пикселя картинки до плоскости 1, 2 и 3 главной компоненты. Так как расстояние — это число, то изображения будут черно-белыми.
Но еще более полезным свойством PCA является то, что он превращает JPEG-артефакты в очень заметные «квадраты». Даже если вы обманули ELA из предыдущего пункта пережатиями и ресайзом, то PCA этим не проведешь — он работает с цветом. Иногда артефакты сразу видно, например если исходное изображение увеличивали для вклейки. В других случаях сматриваться придется чуть более внимательно, чтобы заметить разницу в квадратах на изображении.
Как видно из примеров, PCA не очень наглядный и требует ну уж очень сильно присматриваться к таким мелким косякам, которые вполне могут оказаться случайностями. Потому PCA редко используется в одиночку, его применяют как дополнение к другим.
Самому поиграться можно здесь.
Заблюрить. Любой блюр смазывает соседние цвета и делает «колбасятину» более округлой. Хороший блюр сильно затруднит исследование по методу PCA.
Еще хитрее изменить размер. Хотя PCA и более устойчив к изменение размеров изображения, говорят можно попробовать подобрать такой процент, чтобы обмануть даже его.
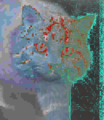
Найдет различия в резкости, отклонения в фокусе, ресайз
Дискретное вейвлет-преобразование очень чувствительно к резкости объектов в кадре. Если фотографии сняты на разные объективы, использовался зум или просто немного отличалась точка фокусировки — после DWT эти отличия будут намного виднее. То же самое произойдет, если у какого-то объекта в кадре изменяли размер — резкость таких частей будет заметно ниже.
Без лишних погружений в теорию сигналов, вейвлет — это такая простенькая волнушка, как на картинке ниже.
Их придумали лет 100 назад, чтобы приблизительно описывать аналоговые сигналы. Одну большую длинную волну представляли набором мелких вейвлетов, тогда некоторые её характеристики внезапно становилось проще анализировать, да и места чтобы хранить надо было меньше. На вейвлет-сжатии например был построен формат JPEG-2000, который к нашему времени (к счастью) сдох.
Картинка — это тоже двухмерный сигнал из цветных пикселей, а значит её можно разложить на вейвлеты. Для достаточно точного приближения изображения 800×600 требуется до 480000 вейвлетов на цветовой канал. Если уменьшать это количество — будет сильно падать резкость и цветопередача. Но что это даёт, кроме сжатия?
А вот что: вейвлеты приближают области с разной резкостью по-разному. Чем плавнее переходы — тем проще плавному по своей природе вейвлету его воспроизвести, а чтобы приблизить резкий переход — надо больше вейвлетов. Это как пытаться сделать из кучи шариков идеальный куб.
Если части изображения были смонтированы с изначально разной резкостью — это можно будет заметить. Увеличили картинку — проиграли в резкости, уменьшили — наоборот всё стало слишком резким. Даже если взять две фотографии снятые на камеру с автофокусом из одной точки — они будут отличаться по резкости из-за погрешности автофокуса. DWT устойчив даже перед блюром, ведь редакторы ничего не знают про резкость исходных частей изображения.
На практике полезно рассматривать приближения с помощью 1%, 3% или 5% вейвлетов. На этом количестве перепады в резкости становятся достаточно заметны глазу, как видно на примере одного из участников соревнования по фотомонтажу, который не определяется другими методами, но заметен при вейвлет-преобразовании.
Сделать фотографии с одной точки, одним объективом с фиксированным фокусом и сразу обработать в RAW. Редкие студийные условия, но всё может быть. Сколько вон лет разбирали всякие видео с Усамой Бен-Ладеном, целые книги писали.
Изображение очень маленькое. Чем меньше изображение — тем сложнее его анализировать вейвлетами. Картинки меньше 200х200 пикселей можно даже не пытаться прогонять через DWT.
Погружаясь в тему Image Forensics начинаешь понимать, что любой из методов можно обмануть. Одни легко обходятся с помощью пережатых до 10 шакалов JPEG’ов, другие цветокоррекцией, блюром, ресайзом или поворотом изображения на произвольные углы. Оцифровка журнала или TV-сигнала тоже добавляет ошибок в исходник, усложняя анализ. И тут вы начинаете понимать:
Вполне возможно отфотошопить изображение так, что никто не докажет обратное. Но для этого надо не быть глупеньким.
Зная эти методы, можно скрыть монтаж настолько, чтобы потом сказать в стиле пресс-секретаря президента: «эти картинки — лишь домыслы ангажированной кучки людей, мы не видим на них ничего нового». И такое вполне вероятно.
Но это не значит, что занятие полностью бесполезно. Здесь как в криптографии: пока те, кто делает фейки не знают матчасти так же глубоко — сила на стороне знаний, математики и анализа.
Приглашаю экспертов высказаться в комментарии. При подготовке поста я написал нескольким разбирающимся в теме профессионалам в лички, но ответа до сих пор не получил.
_Ну а чтобы стимулировать новые посты, подпишитесь на рассылку или пошарьте этот пост у себя. Специльно сделал удобные кнопочки чуть ниже. Так я буду видеть, что всё это хоть кому-то интересно.
Содержание
- Forensically βeta
- Tutorial Video
- The Tools
- Magnifier
- Clone Detection
- Error Level Analysis
- Noise Analysis
- Level Sweep
- Luminance Gradient
- Meta Data
- Geo Tags
- Thumbnail Analysis
- JPEG Analysis
- Comments
- Quantization Tables
- Structure
- String Extraction
- Changelog
- 2017-06-14
- 2017-02-05
- 2016-07-14
- 2016-07-02
- 2016-06-30
- 2015-08-21
- 2015-08-20
- 2015-08-16
- Credits
- Clone Detection
- Error Level Analysis
- Luminance gradient
- Open Source Libraries
- Tutorial: Error Level Analysis
- What To Look For
- Lossy & Lossless
- File Formats
- Applying ELA to Lossy Images
- JPEG Encoding Blocks
- Applying ELA to Lossless Images
- Evaluating ELA
- Rainbowing
- Improving Results
- Advanced Uses
- Caveats
- Sample Image: Oriental Dancer Smiling
- Seeing Red
- End of the Rainbow
Forensically βeta
Forensically is a set of free tools for digital image forensics. It includes clone detection, error level analysis, meta data extraction and more. It is made by Jonas Wagner. You can read a bit more about it in this blog post.
You should think of forensically as a kind of magnifying glass. It helps you to see details that would otherwise be hidden. Just like a magnifying glass it can’t tell true from false or good from evil, but it might just help you to uncover the truth.
Offline mode enabled. You can use this application while offline.
Tutorial Video
Magnifier
The magnifier allows you to see small hidden details in an image. It does this by magnifying the size of the pixels and the contrast within the window.
MagnificationAlso known as the zoom factor.
EnhancementThere are three different enhancements available at the moment. Histogram Equalization, Auto Contrast and Auto Contrast by Channel. Auto Contrast mostly keeps the colors intact, the others can cause color shifts. Histogram Equalization is the most robost option. You can also set this to none.
Clone Detection
The clone detector highlights similar regions within an image. These can be a good indicator that a picture has been manipulated using the clone tool. Note that this tool is a first attempt and not yet very refined.
Regions that are similar are marked in blue and connected with a red line. If a lot of regions overlap the result can look white.
Minimal SimilarityDetermines how similar the cloned pixels need to be to the original.
Minimal DetailBlocks with less detail than this are not considered when searching for clones.
Minimal Cluster SizeDetermines how many clones of a similar region need to be found in order for them to show up as results.
Blocksize (2 n )Determines how big the blocks used for the clone detection are. You generally don’t want to touch this.
Maximal Image SizeThe maximal width or height of the image used to perform the clone search. Bigger images take longer to analyze.
Show Quantized ImageShows the image after it has been compressed. Can be useful to tweak Minimal Similarity and Minimal Detail. Blocks that have been rejected because they do not have enough detail show up as black.
Error Level Analysis
This tool compares the original image to a recompressed version. This can make manipulated regions stand out in various ways. For example they can be darker or brighter than similar regions which have not been manipulated.
There is a good tutorial on ELA on fotoforensics.com.
The results of this tool can be misleading, watch the video and read the tutoria for details.
JPEG QualityThis should match the original quality of the image that has been photoshopped.
Error ScaleMakes the differences between the original and the recompressed image bigger
Magnifier EnhancementThere are three different enhancements available at the moment. Histogram Equalization, Auto Contrast and Auto Contrast by Channel. Auto Contrast mostly keeps the colors intact, the others can cause color shifts. Histogram Equalization is the most robost option. You can also set this to none.
OpacityThe opacity of the differences layer. If you lower it you will see more of the original image.
Noise Analysis
This is tool is basically a reverse denoising algorithm. Rather than removing the noise it removes the rest of the image. It is using a super simple separable median filter to isolate the noise. It can be useful for identifying manipulations to the image like airbrushing, deformations, warping and perspective corrected cloning. It works best on high quality images. Smaller images tend to contain to little information for this to work. You can read more about noise analysis in my blog post Noise Analysis for Image Forensics.
Noise AmplitudeMakes the noise brighter.
Equalize HistogramApplies histogram equalization to the noise. This can reveal things but it can also hide them. You should try both histogram equalization and scale to analyze to noise.
Magnifier EnhancementThere are three different enhancements available at the moment. Histogram Equalization, Auto Contrast and Auto Contrast by Channel. Auto Contrast mostly keeps the colors intact, the others can cause color shifts. Histogram Equalization is the most robost option. You can also set this to none.
OpacityThe opacity of the noise layer. If you lower it you will see more of the original image.
Level Sweep
This tool allows you to quicky sweep through the histogram of an image. It magnifies the contrast of certain brightness levels. On use of this tool is to make edges that were introduced when copy pasting content more visible.
To use this tool simple move your mouse over the image and scroll with your mouse wheel. Look for interesting discontinuities in the image.
A position of 0.5 and a width of 32 would mean that 127-32/2 would be the equal to 0 in the output. 127+32/2 would be equal to 256.
SweepThe position in the histogram to be inspected. You can quickly change this parameter by using the mouse wheel while hovering over the image, this allows you to sweep through the histogram.
WidthThe amount of values (or width of the slice of the histogram) to be inspected. You the default should be fine.
OpacityThe opacity of the sweep layer. If you lower it you will see more of the original image.
Luminance Gradient
The luminance gradient tool analyses the changes in brightness along the x and y axis of the image. It’s obvious use is to look at how different parts of the image are illuminated in order to find anomalies. Parts of the image which are at a similar angle (to the light source) and under similar illumination should have a similar color; Another use is to check edges. Similar edges should have similar gradients. If the gradients at one edge are significantly sharpe than the rest it’s a sign that the image could have been copy pasted. It does also reveal noise and compression artifacts quite well.
This tool performs principal component analysis on the image. This provides a different angle to view the image data which makes discovering certain manipulations & details easier. This tool is currently single threaded and quite slow when running on big images.
I have provided an example of how this tool can be used in my short article Principal Component Analysis for Photo Forensics.
InputThe data to run the PCA on.
Mode
- Projection: projection of the value in the image onto the principal component.
- Difference: Difference between the input and the closest point on the selected principal component.
- Distance: Distance between the input and the closest point on the selected principal component.
- Component: The closest point on the selected principal component.
ComponentThe component of the PCA you want to inspect. The first component contains the most variance. The later components can reveal more hidden details.
LinearizeEnables operation in linear space rather than in gamma space. Slower.
InvertInverts the output data.
EnhancementThere are three different enhancements available at the moment. Histogram Equalization, Auto Contrast and Auto Contrast by Channel. Auto Contrast mostly keeps the colors intact, the others can cause color shifts. Histogram Equalization is the most robost option. You can also set this to none.
OpacityThe opacity of the sweep layer. If you lower it you will see more of the original image.
Meta Data
This tool displays the hidden exif meta data in the image, if there is any.
Geo Tags
This tool shows the GPS location where the image was taken, if it is stored in the image.
Thumbnail Analysis
This tool shows the hidden preview image inside of the original image if there is one. The preview can reveal details of the original image or the camera it was taken with.
Opacity opacity of the preview image on top of the original image.
Show Differences enabled this will show the differences between the original image and the preview stored within it.
JPEG Analysis
This tool extracts meta data out of JPEG Files. You can learn more about it in my post JPEG Forensics in Forensically.
Some applications store interesting data in the comments of a JPEG file.
Quantization Tables
The quantization matrices used to compress a JPEG file reveals information about what software was last used to save the file in question.
Forensically currently recognizes three types of quantization matrices:
- Standard JPEG
- Adobe (latest CC should be complete, the rest is still incomplete)
- Non Standard
I’m missing a complete set of sample images for older photoshop versions using the 0-12 quality scale. If you happen to have one and would be willing to share it please let me know.
Most software and internet services save their files using the quantization matrices defined by the standard. The exception to this rule are Adobe products, which use their own custom quantization tables. Jpegs produces by digital cameras often use non standard color matrices.
So if you know that the camera that an image was supposedly taken with uses one type of quantization matrix and the image you are trying to verify uses a different type of quantization matrix this can be a good indicator that the file has been edited or at least resaved.
From what I have seen iPhones use non standard quantization tables with qualities around 92. Android phones tend to use the standard quantization matrices, but there are exceptions to this.
For more information about this technique please look at the presentation Using JPEG Quantization Tables to Identify Imagery Processed by Software by Jesse Kornblum.
Structure
The sequence of markers in a JPEG file. In general JPEG images taken with a camera with the same settings should result in the same sequence.
This tool scans for binary contents of the image looking for sequences of ascii characters. It is a great fallback to view meta data that is in an image in a format that Forensically does not understand yet. It will output sequences of alpha numeric characters longer than 4, or sequences of 8 or more non control ascii characters. This allows you to discover meta data that is hidden or not recognized by forensically. The relevant data is genreally stored at the beginning or end of the file.
An interesting string to look for is bFBMD followed by a sequence of numbers and letters a-f (hex encoding). This string is added to (some) images by facebook.
It is inspired by the classic unix strings command.
You can find some more information about how to use this tool in my post JPEG Forensics in Forensically.
Are my images uploaded to your server?
No! I respect your privacy. All of your images stay on your computer. They are never uploaded to any cloud or server.
Can I open RAW images using this app?
No, RAW images are not supported. The highest quality format you can use is 24-bit PNG.
Can I use this app offline?
Yes you can if you are using a modern web browser like firefox or chrome.
Offline mode is enabled. You can open this application even if you are offline. Offline mode is not working with your current setup.
What other similar software can you recommend?
Ghiro looks pretty cool and is open source. You can try it online on imageforensic.org.
Changelog
2017-06-14
Fixed a typo in the JPEG module which recognized progressive JPEGs as lossless. Updated help page.
2017-02-05
Added JPEG Analysis and String Extraction tools. See JPEG Forensics in Forensically.
2016-07-14
2016-07-02
Added luminance gradient tool. Tweaked clone detection default settings.
2016-06-30
Added offline support for modern browsers via service workers.
2015-08-21
Added noise analysis tool.
2015-08-20
Added a new enhancement option to the magnifier (histogram equalization). Added magnifier to Error Level Analysis.
2015-08-16
Initial Public release
Credits
Clone Detection
The clone detection tool was inspired by the paper Detection of Copy-Move Forgery in Digital Images by Jessica Fridrich, David Soukal, and Jan Lukáš. But the actual algorithm used is my own.
Error Level Analysis
I got the concept out of the presentation A Picture’s Worth. Digital Image Analysis and Forensics by Neal Krawetz
Luminance gradient
This is another tecnique inspired by Neal Krawetz
Open Source Libraries
This software was built using the following open source components. I want to thank all of their authors for making my life easier, and projects like this possible.
Источник
Tutorial: Error Level Analysis
What To Look For
ELA highlights differences in the JPEG compression rate. Regions with uniform coloring, like a solid blue sky or a white wall, will likely have a lower ELA result (darker color) than high-contrast edges. The things to look for:
| Property | Expectations |
|---|---|
| Edges | Similar edges should have similar brightness in the ELA result. All high-contrast edges should look similar to each other, and all low-contrast edges should look similar. With an original photo, low-contrast edges should be almost as bright as high-contrast edges. |
| Textures | Similar textures should have similar coloring under ELA. Areas with more surface detail, such as a close-up of a basketball, will likely have a higher ELA result than a smooth surface. |
| Surfaces | Regardless of the actual color of the surface, all flat surfaces should have about the same coloring under ELA. |
Look around the picture and identify the different high-contrast edges, low-contrast edges, surfaces, and textures. Compare those areas with the ELA results. If there are significant differences, then it identifies suspicious areas that may have been digitally altered.
Resaving a JPEG removes high-frequencies and results in less differences between high-contrast edges, textures, and surfaces. A very low quality JPEG will appear very dark.
Scaling a picture smaller can boost high-contrast edges, making them brighter under ELA. Similarly, saving a JPEG with an Adobe product will automatically sharpen high-contrast edges and textures, making them appear much brighter than low-texture surfaces.
Lossy & Lossless
File Formats
There are a wide range of file formats. Some are lossy, while others are lossless. The following table identifies some of the common image formats:
| Lossy | Lossless | Either | |
|---|---|---|---|
| Full Color | JPEG2000, JBIG | PNG, BMP, JPEG-LS, PPM, RAW * | TIFF, PDF, WebP, HEIC, HD Photo |
| Reduced Color | JPEG | GIF, PGM |
* RAW is not a standalone file format. Rather, different cameras use different file formats for storing lossless («RAW») camera photos. RAW files are typically either lossless TIFF or JPEG-LS file formats.
In addition to lossy and lossless, there are some file formats that only support reduced colors. Full color file formats support at least 3 bytes per pixel (1 byte for red, 1 byte for green, and 1 byte for blue). This results in over 16 million possible colors per pixel, and each pixel is independent. In contrast, reduced color formats must alter the picture’s color range to something less than full color. For example:
- GIF: GIF is a lossless format that only supports a maximum of 256 colors. If the picture has fewer than 257 colors (e.g., a grayscale image or clipart), then GIF is a highly compressed lossless format. However, if there are more than 256 colors, then some will need to be combined. This may result in dot dithering or merging similar colors. Although colors must be reduced to fit GIF’s 256-color limitation, all subsequent saves are lossless.
- PGM: The Portable Gray Map file format only supports grayscale images.
- JPEG: All lossy file formats cause colors to shift. However, the JPEG algorithm is only capable of reliably storing about 2.4 million of the 16.7 million possible colors. (Technically, this is due to JPEG’s integer conversion from RGB to YCrCb, and not due to the lossy compression.)
Some file formats include options to encode pictures in both lossy and lossless modes. For example:
- TIFF may include a lossless bitmap encoding, reduced FAX-based encoding, or a lossy encoding based on JPEG. Many cameras support RAW mode that saves images in a TIFF (or TIFF-like) file format using lossless compression.
- JPEG-LS is the lossless version of JPEG. Typically, JPEG uses the common lossy method, but there is also a lossless encoding method. The lossless encoding is almost exclusively used by a few cameras that record raw photos with JPEG.
- WebP is an image format from Google. It is commonly used for lossy encoding. By some accounts, it generates files that are 25%-35% smaller than similar quality JPEG files. However, it also includes a lossless format that typically compresses better than PNG.
- HEIC (also called HEIF or HEVC) is an alternative to JPEG that is being promoted by Apple. HEIC has virtually no support outside of iPhone and is not supported by any web browsers. HEIC is commonly used for lossy encoding and claims higher compression rates compared to the same quality from JPEG. However in practice, HEIC’s lossly mode drops off high frequencies, resulting in blurry pictures.
- HD Photo (also called JPEG XR or JXR) is an alternative to JPEG that is being promoted by Microsoft. This format has virtually no support outside of Windows desktop systems and is only supported by Microsoft’s IE and Edge browsers. When used, HD Photo is commonly used for lossy encoding and claims higher compression rates compared to the same quality from JPEG.
The conversion to a reduced color file format typically results in a significant alteration to the pixel values. For this reason, ELA is not applicable on severely reduced color images like GIF. However, ELA is explicitly designed for use with JPEG.
Applying ELA to Lossy Images
JPEG images use a lossy compression system. Each re-encoding (resave) of the image adds more quality loss to the image. Specifically, the JPEG algorithm operates on an 8×8 pixel grid. Each 8×8 square is compressed independently. If the image is completely unmodified, then all 8×8 squares should have similar error potentials. If the image is unmodified and resaved, then every square should degrade at approximately the same rate.
ELA saves the image at a specified JPEG quality level. This resave introduces a known amount of error across the entire image. The resaved image is then compared against the original image.
If an image is modified, then every 8×8 square that was touched by the modification should be at a higher error potential than the rest of the image. Modified areas will appear with a higher potential error level.
JPEG Encoding Blocks
JPEG stores colors using the YUV color space. ‘Y’ is the luminance, or gray-scale intensity of the image, ‘U’ and ‘V’ are the chrominance-blue and chrominance-red color portions. For displaying, the JPEG decoder converts the image from YUV to RGB.
JPEG always encodes luminance with an 8×8 grid. However, chrominance may be encoded using 8×8, 8×16, 16×8, or 16×16. The chrominance subsampling is a JPEG encoding option. Depending on the selected chrominance subsampling, each 8×8, 8×16, 16×8, 16×16 grid will be independently encoded.
When a file is converted from a lossy file format to a lossless format, resave artifacts are retained. This permits ELA to highlight alterations made to a JPEG image that was converted to a PNG.
Not all lossy file formats are compatible. For example, the lossy WebP, HEIC, and HD Photo (JPEG XR) formats use different compression algorithms than JPEG. Even if a JPEG image has been repeatedly saved, it may still result in first-time-saved artifacts if it is converted to these other file formats. This happens because the WebP, HEIC, and HD Photo artifacts are applied for the first time.
FotoForensics can apply ELA to all supported file formats. However, ELA assumes that non-JPEG files were converted from JPEG images. (This is a reasonable assumption since there are no commercially available cameras that natively capture pictures in PNG, WebP, HD Photo, etc.) As a result, all ELA tests are compared against JPEG lossy compression.
Applying ELA to Lossless Images
Evaluating ELA
With ELA, every grid that is not optimized for the quality level will show grid squares that change during a resave. For example, digital cameras do not optimize images for the specified camera quality level (high, medium, low, etc.). Original pictures from digital cameras should have a high degree of change during any resave (high ELA values). Each subsequent resave will lower the error level potential, yielding a darker ELA result. With enough resaves, the grid square will eventually reach its minimum error level, where it will not change anymore.
| Image | ELA |
|---|---|
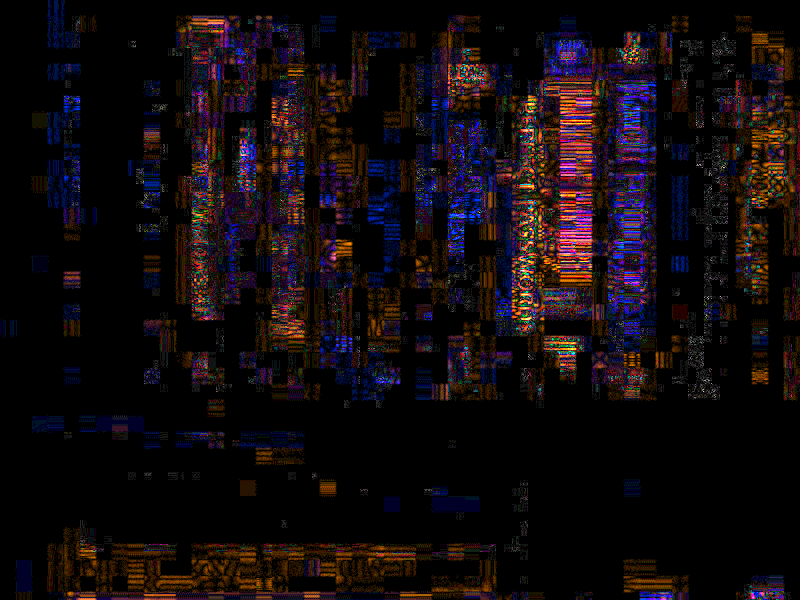
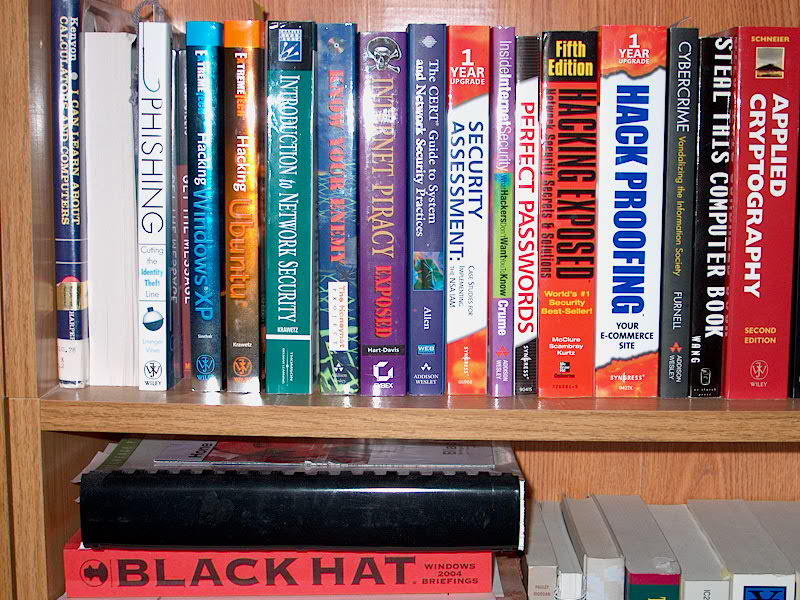 |
 |
| An original digital photograph (Source: Hacker Factor) has high ELA values, represented by white colors in the ELA. The sections that are black correspond to the solid white book and the black 8×8 squares in the original image. Solid colors compress very well, so these are already at their minimum error levels. | |
 |
 |
| The original image was resaved one time. To the human eye, there is no visible difference between the original and the resave image. However, ELA shows much more black and more dark colors. If this image were resaved again, it will have even lower (darker) ELA values. | |
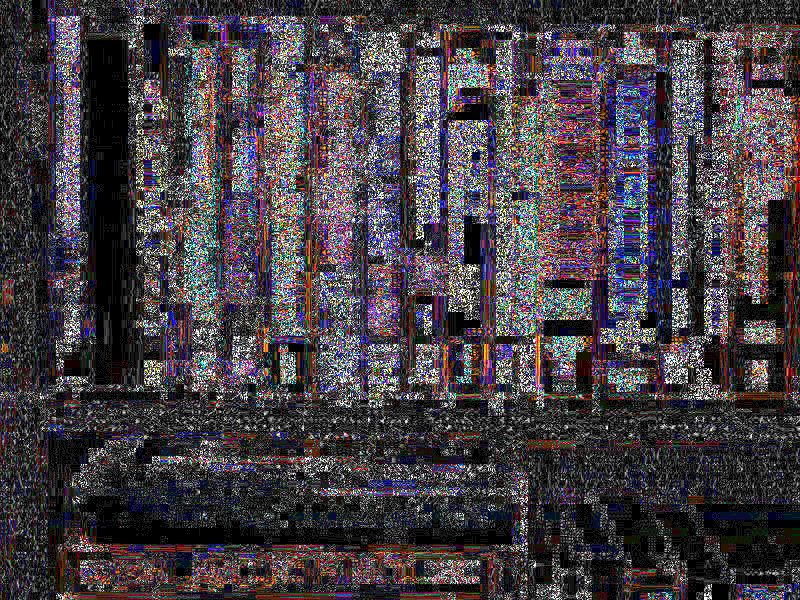
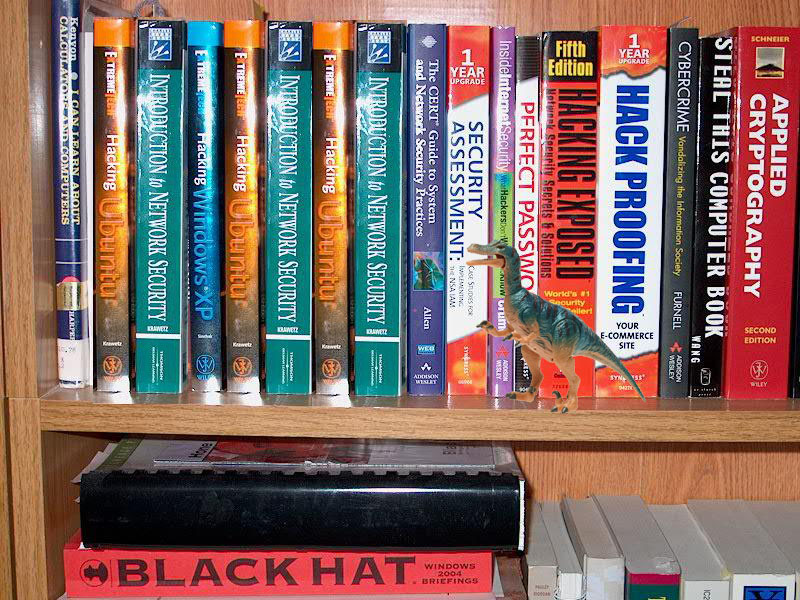 |
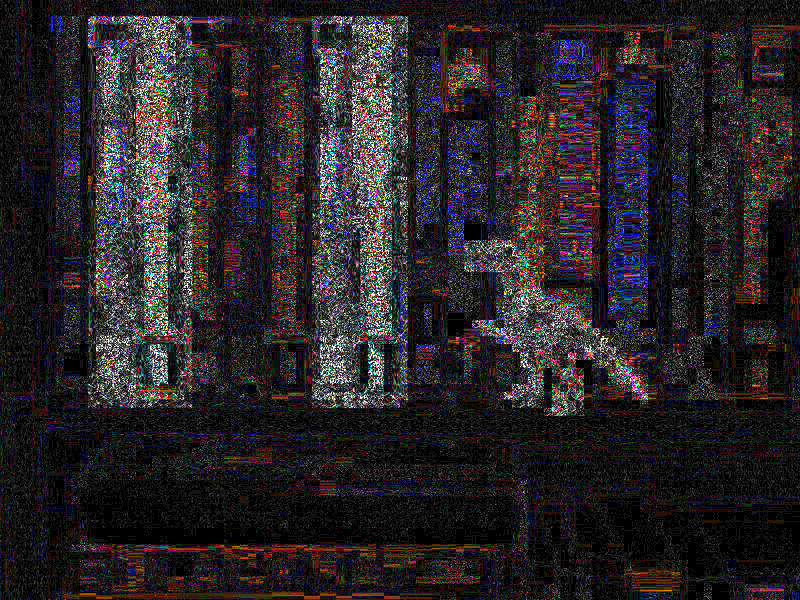 |
| The resaved image was digitally modified: books were copied and a toy dinosaur was added. ELA clearly shows the modified areas as having higher ELA values. |
It is important to recognize that high frequency areas, such as edges along objects, will usually have higher ELA values than the rest of the picture. For example, the text on the books stands out because the light/dark contrast creates a high frequency edge. In general, you should compare edges with edges and surfaces with surfaces. If all surfaces except one have similar ELA values, then the outlier should be suspect.
Rainbowing
Rather than saving colors by their red, green, and blue components, JPEG separates colors into luminance and chrominance channels. The luminance is effectively the gray-scale intensitity of the image. The chrominance-red and chrominance-blue components identify the amount of coloring, independent of the full color’s intensity.
With ELA and resaved images, there may be a visible separation between the luminance and chrominance channels as a blue/purple/red coloring called rainbowing. Drawing tools such as Photoshop can introduce a distinct rainbowing pattern surfaces that have near-uniform coloring.
| Image | ELA |
|---|---|
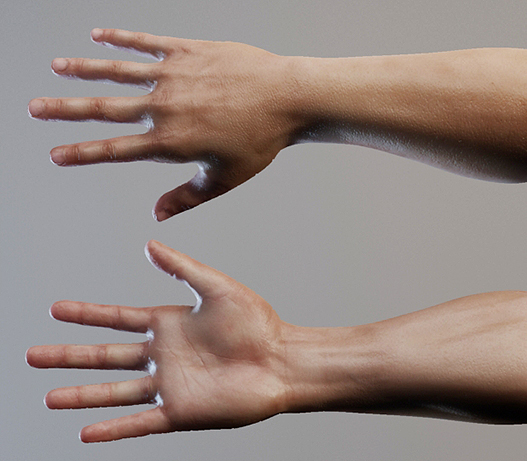 |
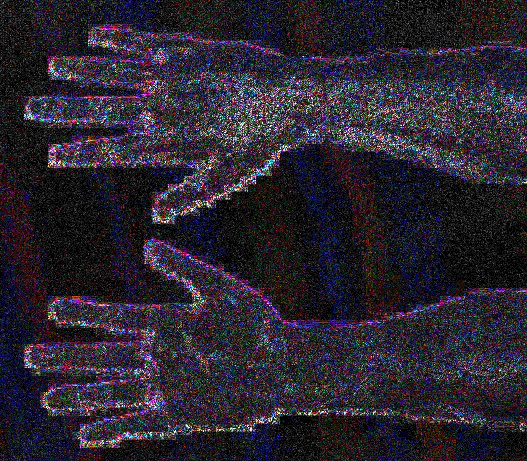 |
| Computer-generated hands. («NMRIH Hands», Matthew Fagan, 2009). The ELA shows red and blue rainbowing as background stripes. In other pictures, rainbowing may appear as large patches. |
In general, Photoshop and other Adobe products generate a large amount of rainbowing. However, rainbowing is not an exclusive artifact to Adobe products. For example, the open source GIMP program generates little rainbowing and some high-quality camera photos may also include rainbowing along uniform-colored surfaces, such as white walls or blue skies. Some drawing tools, such as Microsoft’s Paint, do not generate rainbowing.
The presence of rainbowing artifacts indicates a color adjustment, but does not identify intentional modifications.
- Prior to 2020, the strong presence of rainbowing suggested that an Adobe product, like Photoshop or Lightroom, was used to save the image. This is because Adobe automatically applies their own color adjustments to pictures.
- In 2020, Apple introduced iOS 14, which also can generate strong rainbowing artifacts due to the camera’s automatic color correction system.
- Beginning in mid-2020, some Android devices incorporated color correction systems similar to Apple.
With some of these devices and applications, there is no option to turn off the automatic color adjustments.
Some older digital cameras can produce rainbowing. However, there is an easy way to distinguish a camera’s rainbowing from Photoshop. With digital cameras, the rainbowing is usually not restricted to the JPEG grid. The edges of a camera’s rainbowing area will appear to have smooth contours. This happens because the chrominance separation is introduced before the first JPEG encoding. With Photoshop and other graphics applications, rainbowing is stictly limited to the JPEG grid because it is applied during or after the JPEG encoding. If the edges of the rainbowing area appear blocky in 8×8 or 16×16 chunks, then the rainbowing is likely caused by a graphics program such as Photoshop or an in-camera adjustment on newer (2020 or later) iPhone or Android devices.
Improving Results
The results from ELA are directly dependent on the image quality. You may want to know if something was added, but if the picture is a copy of a copy of a copy, then ELA may only permit detecting the resaves. Try to find the best quality version of the picture.
For example, many pictures are hosted at Flickr. Flickr provides small, medium, large, and original images. The small, medium, and large are derivative images (resaves) created by Flickr. The «original» is whatever the user sent to Flickr, so the original will be the best quality. Similarly, pictures on news sites are usually resaved. If they have a tagline like «Source: AP Images», then go to the source and use that picture instead. News sites typically recolor, resize, and crop images before saving them at a very low quality. Go for the original source (or get as close as you can to the original source) to improve the image’s quality and the ELA results.
Two easy ways to tell that the image is not an original are to look at the image size and attributions. In general, digital cameras do not generate small pictures. Pictures that are sized for the web are likely resized from other pictures, and even those may not be camera-original. Also, many web sites add their logo or URL to a corner of the picture. That means the base picture was resaved and the last modification was likely the addition of the attribution.
For best results, try to find the source picture. If you don’t know where to start, then try TinEye. Many pictures on the web are resaved as they pass from user to user. TinEye doesn’t know every picture on the web, but it knows many pictures. If the picture is being passed around, then TinEye can help find the source (or at least a better copy of the image). In general, the biggest image is usually the best quality. (But some sites do scale images larger. )
Advanced Uses
With training and practice, ELA users can also learn to identify image scaling, quality, cropping, and resave transformations. For example, if a non-JPEG image contains visible grid lines (1-pixel wide in 8×8 squares), then it means the picture started as a JPEG and was converted to the non-JPEG (e.g., PNG) format. If some areas of the picture lack grid lines or the grid lines shift, then it denotes a splice or drawn portion in the non-JPEG image.
As another example, PNG files are a lossless file format. If a picture is an original PNG, then ELA should produce very high values for edges and textures. However, if ELA generates weak results (dark or black coloring) along edges and textures, then the PNG was likely created from a JPEG. This is because the conversion process from JPEG to PNG is lossless and will retain JPEG artifacts.
When combined with other algorithms, ELA becomes a very powerful evaluation tool.
Caveats
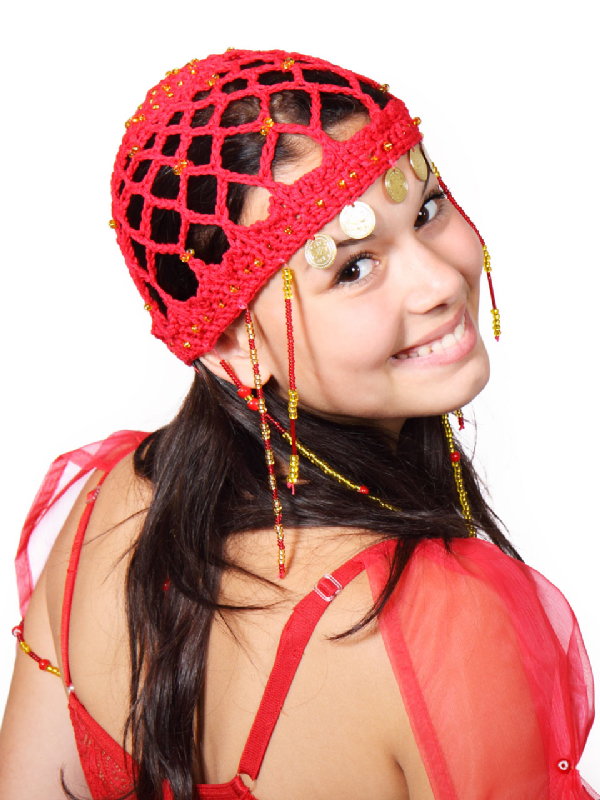
Sample Image: Oriental Dancer Smiling
I was looking for a public domain picture that would make a good ELA example when I came across «Oriental Dancer Smiling» by Petr Kratochvil.

According to the web site, this picture was captured with a Canon EOS 50D.
| Camera Information | |
|---|---|
| Model | Canon EOS 50D |
| Manufacturer | Canon |
| Shutter speed | 1/250 |
| Aperture | f 8.0 |
| Sensitivity | ISO 100 |
| Focal length of the lens | 46 mm |
There is no mention that this picture was touched up. But what exactly was done to it? To answer that question, let’s apply Error Level Analysis (ELA).
ELA shows the amount of difference that occurs during a JPEG resave. More white means more change, and black indicates no change.
A real, camera-original picture, should have a lot of white, almost like noise, over the entire picture. As the picture is repeatedly resaved (not copied, but actually loaded into a program and saved again as a JPEG), high frequencies and fine details are removed. With each resave, more frequencies/details are lost until the picture cannot get any worse (returning a black ELA picture).
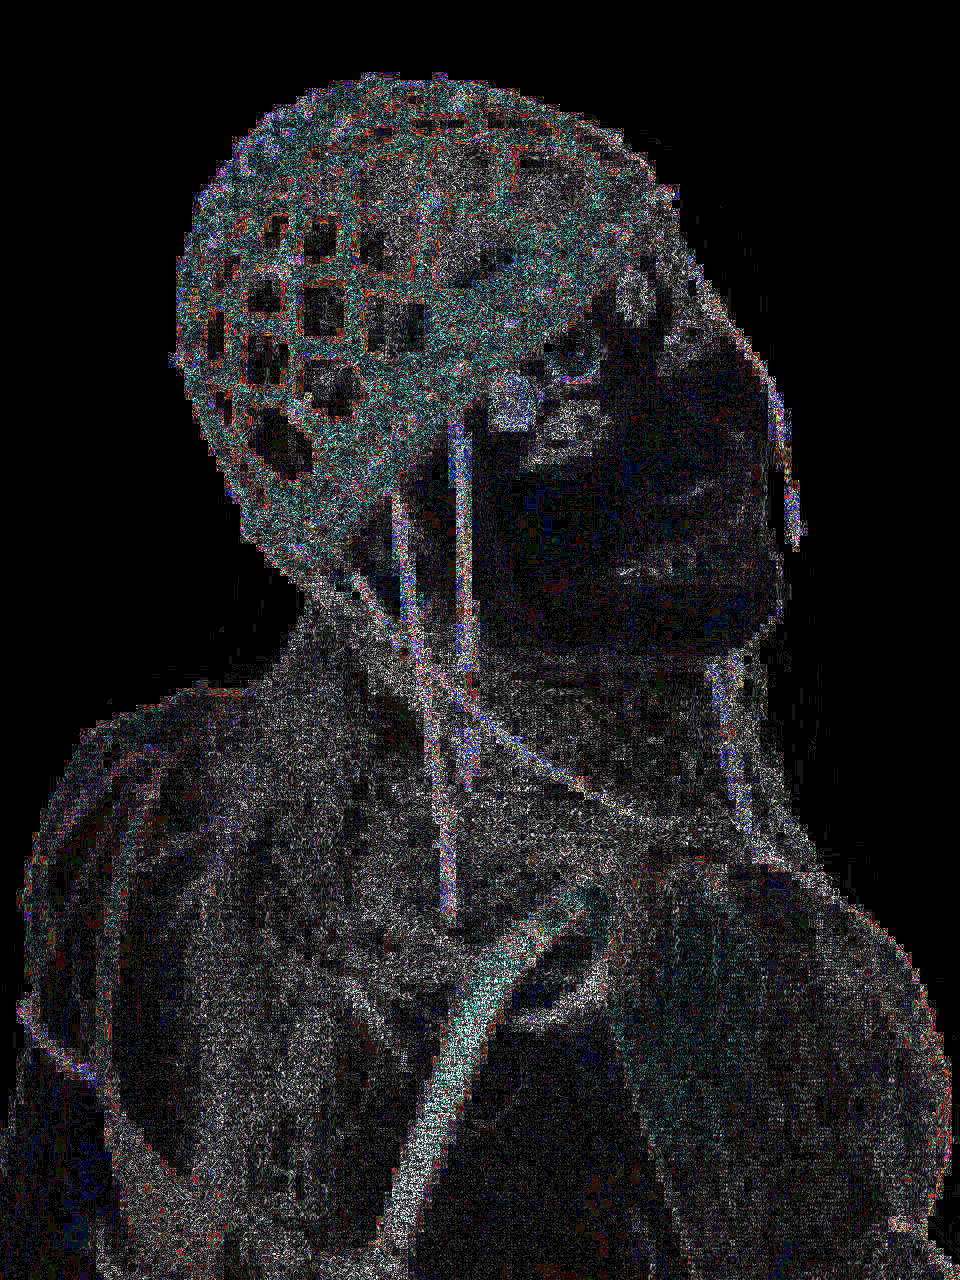
In this picture, the background is completely black, but the person is not. That means that the background is at a different quality level compared to the rest of the picture; the background was digitally modified. In this case, it was enhanced to make the white look brighter.
Seeing Red
With ELA, all edges should be at about the same error level. Similar surfaces should all have similar error levels, similar coloring should have similar error levels, similar patterns, etc. But that isn’t the case here. For example, her red headdress has a different intensity compared to the back of her dress, and she has one red strap that is much brighter than anything else. Even the red dangles from the hat are much brighter than the hat itself. The hat dangles appear brighter than the armband (photo lower left). Interestingly, the red bead in her hair (middle of her back) has a much lower ELA value.
Based on this, we can tell that the red in the hat was brightened, the dangles and one strap were reworked, and the original red color was probably darker — like the red bead seen in the middle of her back.
Mouseover to toggle between the image and the ELA.
We can also tell that her eyelashes were touched up. For example, her faint lower eyelashes cast a very strong ELA value — stronger than the edges of her nose and lips. And the lines of her cheeks have just as much contrast as her lower eyelashes, but they have no noticeable ELA variation. This means that her eyelashes were enhanced, while her cheeks were not. (Well, not significantly.)
For bonus points, look at the bright ELA spots in the middle of her eyes. Is that a brightened specular reflection, or were her eyes originally looking in a different direction? We know that her eyes were touched up because we can observe that the sclera (whites of her eyes) contains no red veins. (All eyes have veins, and at this resolution they should be visible.) The veins were removed when the eyes were enhanced.
There may have been other changes made to this picture, but these are the things that ELA can readily identify.
End of the Rainbow
The final item that we can tell from this picture comes from the faint blue and red patches. For example, her left arm (photo left-bottom corner) has a faint blue patch. There is a red patch on her back near her right armpit (lower-right corner). In fact, her face has many small blue patches and only a few small red patches.
The red/blue patches are rainbowing. They are a tell-tail sign that an Adobe product was used on this picture. This is confirmed from the metadata: this picture was last saved with Adobe Photoshop ‘Save-for-Web’ (and not ‘Save As’) and the user selected a quality level of 60%.
Источник
Современный интернет настолько насыщен всевозможными фейками, что уже с трудом понимаешь чему верить, а чему нет. Если новости еще можно как-то проверить и убедиться в их достоверности, то определить фейковые фотографии очень сложно.
- Можно ли определить монтаж на фото? Немного теории
- Онлайн проверка фото на Фотошоп. От теории к практике
- Magnifier
- Clone Detection
- Error Level Analysis
- Noise Analysis
- Level Sweep
- Luminance Gradient Analysis
- Principal Component Analysis
- Прочие инструменты анализа фото
- Выводы
Программы фотомонтажа достигли такого уровня, что имея даже базовые навыки работы в Photoshop, можно сделать фотофейк, который с трудом удастся отличить от реального снимка. Как же проверить: фотошоп перед вами или нет? С помощью данной статьи вы сможете буквально за считанные минуты анализировать любое фото и с уверенностью определять использованы ли в нем приемы монтажа.
Можно ли определить монтаж на фото? Немного теории
В государственных структурах, о которых не принято говорить вслух, существуют специальные отделы, которые занимаются экспертизой фотографий. При помощи сложных методов в специально разработанных для этого программах они анализируют попадающие к ним медиа файлы и выносят вердикт о том, насколько велика вероятность того, что при их создании был использован Фотошоп либо аналогичные фоторедакторы.
Всё дело в том, что при обработке фото, добавлении либо удалении из кадра каких-то объектов, всегда остаются характерные артефакты. Они могут быть невидны невооруженным взглядом и даже при большом увеличении, но при наложении определенных фильтров они становятся различимы. Скрыть следы от Photoshop не так и просто как может показаться.
В интернете вы найдете сотни статей с советами о том как определить явный фотошоп:
- Ищите проблемы со светом и тенями.
- Внимательно смотрите на фон фото и ищите искажения.
- Проверьте исходные метаданные файла (EXIF).
- Обратите внимание на общую реалистичность картинки и т.д.
Да, эти советы применимы, когда фото было сделано на скорую руку, а вот если к созданию фейка подошли профессионалы, то без специальных средств анализа вы уже не сможете распознать в нем фотомонтаж.
Онлайн проверка фото на Фотошоп. От теории к практике
Forensically — бесплатный онлайн сервис, который считается лучшим на сегодняшний день для экспертизы на фотошоп. Он использует передовой набор уникальных алгоритмов анализа, при помощи которых вы сможете выявить мельчайшие несостыковки на снимке и быстро выявить фейки.
Наглядно суть работы Forensically, а также конкретные примеры вы можете увидеть из ролика, созданного автором сервиса:
Настоятельно рекомендую не пожалеть пять минут времени и посмотреть видео, потому что в нем наглядно продемонстрирована работа каждого инструмента Forensically, и приведены интересные примеры монтажа и их выявления.
Я же в свою очередь кратко расскажу как анализировать фотографии в Forensically и тоже покажу парочку примеров.

В верхней части окна браузера есть две кнопки:
- «Open File» — загрузить свой файл
- Help – вызов справки (на английском языке)
В правой части окна находятся инструменты для анализа фотографии. Объясню назначение и работу каждого из них.
Magnifier
Инструмент Magnifier (Лупа, или увеличительное стекло) позволяет увидеть мельчайшие детали изображения, скрытые для обычного взгляда. Работа инструмента основана на увеличении размеров пикселей и контраста внутри исследуемой области.

Наводя лупу на различные области изображения вы сможете увидеть мельчайшие несостыковки, которые будут свидетельствовать о его возможной обработке в Photoshop.
Лупа имеет три варианта работы, отличающиеся по настройкам контраста и гистограммы. Их выбор доступен из выпадающего списка.
Clone Detection
Инструмент выявляет похожие области на изображении, которые часто создаются при помощи клонирующего штампа (Clone Stamp) Фотошопа. Похожие области на фотографии будут подсвечены голубым (белым) цветом и соединены розовой линией.

Клонированные фрагменты отчетливо видны
Инструмент имеет пять настроек с ползунками, перемещая которые вы производите поиск дублированных областей, уточняя параметры этого поиска.
Если при использовании данного инструмента появляется надпись «No clones have been detected», попробуйте сначала поиграть с ползунками «Minimal Similarity» и «Minimal Detail», а потом переходите к остальным.
Error Level Analysis
Каждый раз, когда вы сохраняете изображение в фотошопе, оно подвергается целому набору преобразований, даже если визуально и при большом увеличении кажется, что с картинкой ничего не произошло. Артефакты преобразования остаются всегда, особенно когда дело касается файлов JPEG (JPG).
Инструмент Error Level Analysis (ELA) сравнивает исходную версию изображения с повторно сжатой и указывает на разницу между ними. Области, которые подвергались фотомонтажу, могут быть светлее, темнее или ярче чем те области, которые не подвергались обработке.

ELA легко обнаружил признаки монтажа на фото
Когда вы читаете в интернет разного рода разоблачения на основе фотографий, то чаще всего онлайн изобличители используют Error Level Analysis для выявления фейков. Однако с этим инструментом следуют быть осторожным при вынесении выводов, потому что при определенных условиях он может давать ложные срабатывания. В частности, если вы имеете контрастный объект на относительно чистом однородном фоне (самолет на фоне неба).
Noise Analysis
Noise Analysis, или Анализатор Шума, с очень специфичным алгоритмом работы: вместо того, чтобы снижать шум на фото, он наоборот его увеличивает.
Всё дело в том, что каждое изображение имеет свой уровень шума, который зависит от матрицы фотоаппарата, условий съемки, параметров сжатия картинки и пр. Если на одно фото разметить любой фрагмент другого фото, то они будут иметь разную интенсивность и характер шума.

Отчетливо заметен иной характер шума у вставленного объекта
Анализатор шума как раз и выявляет такие несоответствия, указывающие на наличие у фотографии элементов монтажа.
Level Sweep
Этот инструмент позволяет быстро просмотреть гистограмму изображения. Он увеличивает контраст определенных уровней яркости и делает более заметными края объектов, которые были добавлены в оригинальное фото.

Просто наведите курсор на изображение и вращайте колесико мыши, пытаясь найти характерные «разрывы» в картинке.
Luminance Gradient Analysis
Как мы хорошо знаем, световые лучи падают на объекты неравномерно, что делает одни участки боле светлыми, другие — более темными. Создается так называемый градиент освещенности.
Части объекта, находящиеся под одинаковым углом к источнику света и при одинаковом освещении должны иметь одинаковый цвет.

Заметен качественно иной характер освещения вставленного объекта
Данный инструмент анализирует изменения яркости по осям X и Y изображения, ища неравномерности и аномалии в освещении разных частей изображения. Также инструмент неплохо выявляет шумы и имеющиеся артефакты сжатия.
Principal Component Analysis
Principal Component Analysis (PCA) имеет очень сложный и заумный алгоритм работы. Не буду его описывать, скажу лишь, что он выполняет анализ основных компонентов изображения и выявляет таким образом на снимке наличие определенных манипуляций и деталей.

С исходной фотографии вырезано летящее насекомое
Данный метод редко используется как основной для проверки фотографий на фотошоп, а в связке с другими хорошо дополняет общую картину.
Прочие инструменты анализа фото
- Meta Data — показывает скрытые данные EXIF, если такое имеются у изображения.
- Geo Tags — основываясь на данных GPS показывает место на карте, где была снята фотография.
- Thumbnail Analysis — отображает скрытое превью исходного изображения. Если само изображение было обработано в Фотошопе, то превью часто остаётся прежним.
- JPEG Analysis — дает информацию о матрицах квантования (quantization matrices) и некоторых служебных мета данных, на основе которых можно судить о внесении редактуры в изображение. Например, если вы знаете, что фотокамера, на которую было снято изображение, использует один тип матрицы квантования, а изображение, которое вы пытаетесь проверить, использует другой тип матрицы квантования, то это неплохой индикатор того, что файл был отредактирован или, по крайней мере, пересохранен в какой-то программе.
- String Extraction — обнаруживает скрытые мета данные, которые служат для дальнейших выводов о наличии монтажа и обработки.
Выводы
При помощи Forensically вы без труда можете проверить онлайн любое фото на предмет его правки в Photoshop или ином редакторе. При помощи удобных инструментов вы проанализируете различные составные части изображения и быстро выявите несостыковки и очевидные несоответствия фотомонтажа.
Конечно же, любой инструмент можно обмануть, скрыв следы фотошопа, и создать таким образом практически «идеальный фейк», неотличимый от реального фото. Однако таких примеров очень мало, а большинство фейков создано довольно грубо и легко поддаются разоблачению.

Сергей Сандаков, 42 года.
С 2011 г. пишу обзоры полезных онлайн сервисов и сайтов, программ для ПК.
Интересуюсь всем, что происходит в Интернет, и с удовольствием рассказываю об этом своим читателям.
Error Level Analysis for ImageJ
History:
This plugin was implemented in July 2012
ImageJ’s version:
1.46a (used to develop this plugin)
Installation:
Download ErrorLevelAnalysis.rar and unzip its content in the plugins folder then compile «Error_Level_Analysis.java» with the «Compile and Run» command. Restart ImageJ to add the «Error Level Analysis» command to the Plugins menu.
Description:
This plugin implements Error Level Analysis (ELA) in ImageJ.
ELA shows the amount of difference that occurs during a JPEG resave. More white means more change, and black indicates no change.
A real, camera-original picture, should have a lot of white, almost like noise, over the entire picture. As the picture is repeatedly resaved (not copied, but actually loaded into a program and saved again as a JPEG), high frequencies and fine details are removed. With each resave, more frequencies/details are lost until the picture cannot get any worse (returning a black ELA picture).
ELA works by intentionally resaving the image at a known error rate, such as 95%, and then computing the difference between the images. If there is virtually no change, then the cell has reached its local minima for error at that quality level. However, if there is a large amount of change, then the pixels are not at their local minima and are effectively original.
Usage
Here is a brief description:
Open an image to analyze. Then follow these steps:
-
Click on Error Level Analysis in the Plugins menu;
-
Select the desidered quality for the image to save;
-
Select the scale level;
-
Click on the “OK” button to apply the filter to the image;
The plugin will show the corresponding Error Level Analysis image. This plugin can also save a report of the operations executed.
Example
Original
Digital Manipulation
ELA
From Wikipedia, the free encyclopedia
Error level analysis (ELA) is the analysis of compression artifacts in digital data with lossy compression such as JPEG.
Principles[edit]
When used, lossy compression is normally applied uniformly to a set of data, such as an image, resulting in a uniform level of compression artifacts.
Alternatively, the data may consist of parts with different levels of compression artifacts. This difference may arise from the different parts having been repeatedly subjected to the same lossy compression a different number of times, or the different parts having been subjected to different kinds of lossy compression. A difference in the level of compression artifacts in different parts of the data may therefore indicate that the data has been edited.
In the case of JPEG, even a composite with parts subjected to matching compressions will have a difference in the compression artifacts.[1]
In order to make the typically faint compression artifacts more readily visible, the data to be analyzed is subjected to an additional round of lossy compression, this time at a known, uniform level, and the result is subtracted from the original data under investigation. The resulting difference image is then inspected manually for any variation in the level of compression artifacts. In 2007, N. Krawetz denoted this method «error level analysis».[1]
Additionally, digital data formats such as JPEG sometimes include metadata describing the specific lossy compression used. If in such data the observed compression artifacts differ from those expected from the given metadata description, then the metadata may not describe the actual compressed data, and thus indicate that the data have been edited.
-

A composite image, where the different parts have different JPEG compression levels
-
The same image with a uniform 90% quality JPEG compression
-
The difference between the two images shows a variation of the JPEG compression artifacts

Limitations[edit]
By its nature, data without lossy compression, such as a PNG image, cannot be subjected to error level analysis. Consequently, since editing could have been performed on data without lossy compression with lossy compression applied uniformly to the edited, composite data, the presence of a uniform level of compression artifacts does not rule out editing of the data.
Additionally, any non-uniform compression artifacts in a composite may be removed by subjecting the composite to repeated, uniform lossy compression.[2] Also, if the image color space is reduced to 256 colors or less, for example, by conversion to GIF, then error level analysis will generate useless results.[3]
More significant, the actual interpretation of the level of compression artifacts in a given segment of the data is subjective, and the determination of whether editing has occurred is therefore not robust.[1]
Controversy[edit]
In May 2013, Dr Neal Krawetz used error level analysis on the 2012 World Press Photo of the Year and concluded on his Hacker Factor blog that it was «a composite» with modifications that «fail to adhere to the acceptable journalism standards used by Reuters, Associated Press, Getty Images, National Press Photographer’s Association, and other media outlets». The World Press Photo organizers responded by letting two independent experts analyze the image files of the winning photographer and subsequently confirmed the integrity of the files. One of the experts,
Hany Farid, said about error level analysis that «It incorrectly labels altered images as original and incorrectly labels original images as altered with the same likelihood». Krawetz responded by clarifying that «It is up to the user to interpret the results. Any errors in identification rest solely on the viewer».[4]
In May 2015, the citizen journalism team Bellingcat wrote that error level analysis revealed that the Russian Ministry of Defense had edited satellite images related to the Malaysia Airlines Flight 17 disaster.[5] In a reaction to this, image forensics expert Jens Kriese said about error level analysis: «The method is subjective and not based entirely on science», and that it is «a method used by hobbyists».[6] On his Hacker Factor Blog, the inventor of error level analysis Neal Krawetz criticized both Bellingcat’s use of error level analysis as «misinterpreting the results» but also on several points Jens Kriese’s «ignorance» regarding error level analysis.[7]
See also[edit]
- Image analysis
References[edit]
- ^ a b c Wang, W.; Dong, J.; Tan, T. (October 2010). «Tampered Region Localization of Digital Color Images». Digital Watermarking: 9th International Workshop, IWDW 2010. Seoul, Korea: Springer. pp. 120–133. ISBN 9783642184048.
We are hardly able to tell the tampered region from the unchanged one sometimes just by human visual perception of JPEG compression noise
- ^ «FotoForensics». fotoforensics.com. Retrieved 2015-09-20.
If an image is resaved multiple times, then it may be entirely at a minimum error level, where more resaves do not alter the image. In this case, the ELA will return a black image and no modifications can be identified using this algorithm
- ^ «FotoForensics — FAQ». fotoforensics.com. Retrieved 2015-09-20.
- ^ Steadman, Ian (2013-05-16). «‘Fake’ World Press Photo isn’t fake, is lesson in need for forensic restraint». Wired UK. Retrieved 2015-09-11.
- ^ «bellingcat — MH17 — Forensic Analysis of Satellite Images Released by the Russian Ministry of Defence». bellingcat.com. 2015-05-31. Retrieved 2015-09-29.
Error level analysis of the images also reveal the images have been edited
- ^ Bidder, Benjamin (2015-06-04). «‘Bellingcat Report Doesn’t Prove Anything’: Expert Criticizes Allegations of Russian MH17 Manipulation». Spiegel Online. Retrieved 2015-07-23.
- ^ «Image Analysis — The Hacker Factor Blog». hackerfactor.com. Retrieved 2015-10-17.
- «Tutorial: Error Level Analysis». fotoforensic.com. Retrieved 2015-07-23.
External links[edit]
- Image Forensics : Error Level Analysis
- FotoForensics
Для проверки иллюстраций в сервисе Forensically мы использовали две фотографии. : одна с сайта pixabay.com (пользователя под ником friday2022), вторая — она же, но дополнительно обработанная и с добавленным элементом.
Откройте сервис Forensically. Нажмите «Open File» (открыть файл) в верхней строке, загрузите изображение для проверки.

Инструменты для экспертизы фотографий находятся в колонке справа.
Magnifier (Лупа)
Цифровое увеличительное стекло — наведите мышку на фотографию, чтобы поближе рассмотреть даже самые мелкие детали на изображении. Цифровая лупа увеличивает размер файла в пикселях в дополнение к контрасту в окне.
Чтобы изменить контраст файла для анализа, выберите в «Enhancement» (улучшение) одну функцию из трех:
- Histogram Equalization (выравнивание гистограммы) — более продвинутый вариант, он сохраняет исходное качество файла и предотвращает потенциальную потерю данных,
- Auto Contrast (автоконтраст) — сохраняет цвета нетронутыми,
- Auto Contrast by Channel (автоконтраст по каналам) — вы может изменить исходную контрастность изображения или файла.
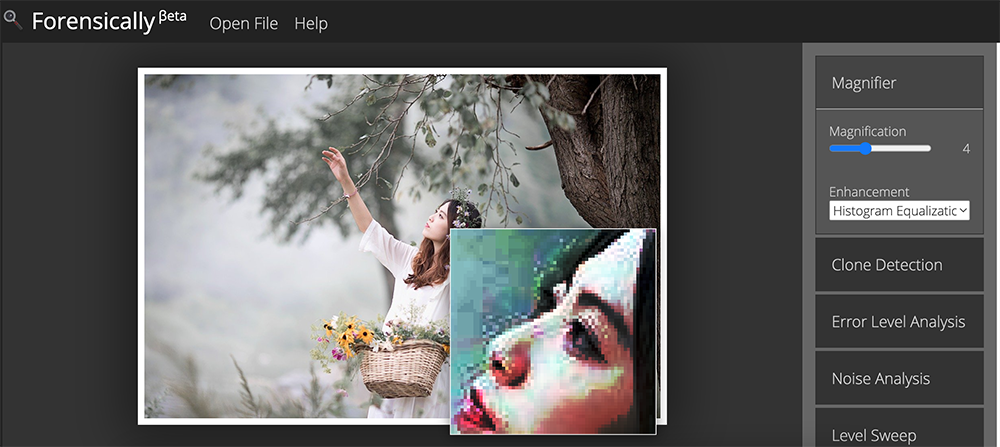
Clone Detection (клон)
Детектор клонов выделяет похожие области на изображении и служит индикатором того, что изображение было изменено с помощью инструмента клонирования. Каждый скопированный элемент имеет синюю отметку и соединен с красной линией. Если функция обнаруживает несколько перекрывающихся областей, это означает, что фотография является клоном или была изменена. В последнем случае все эти области будут белыми.
Настройки функции:
- Minimal Similarity (минимальное сходство) — определяет, насколько клонированные пиксели должны быть похожи на оригинал,
- Minimal Detail (минимальные детали) — блоки с меньшей детализацией не учитываются при поиске клонов,
- Minimal Cluster Size (минимальный размер кластера) — определяет, сколько клонов необходимо найти, чтобы они отображались в результатах,
- Blocksize (размер блока) — определяет размер блоков, используемых для обнаружения клонов,
- Maximal Image Size (максимальный размер изображения) — максимальная ширина или высота изображения, используемого для поиска клона. Для анализа больших изображений требуется больше времени,
- Show Quantized Image (показать квантованное изображение) — показывает изображение после его сжатия. Полезно настроить минимальное сходство и минимальную детализацию. Блоки, которые были отклонены из-за недостаточной детализации, отображаются черным цветом.
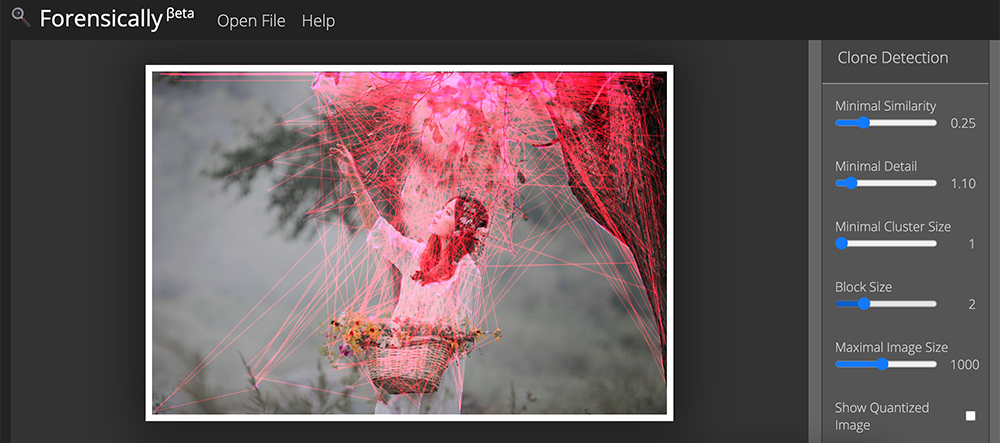
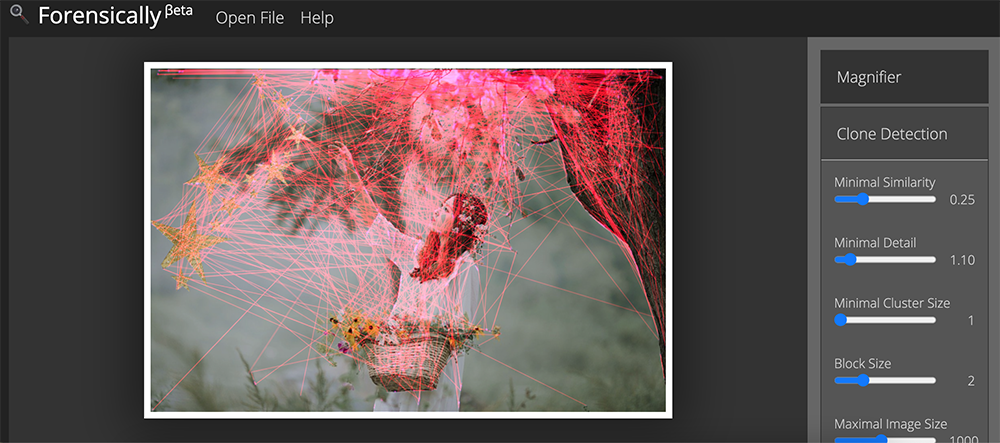
Error Level Analysis (анализ уровня ошибок)
Изображение делается для сравнения со сжатой версией. Этот процесс очень помогает в обнаружении манипуляций на фотографии. При анализе уровня ошибок любая область, которая светлее или темнее других, свидетельствует о том, что она была изменена.
Рекомендуется использовать этот инструмент с осторожностью, поскольку результаты могут поначалу несколько сбивать с толку.
На что обращать внимание:
- края — они должны иметь одинаковую яркость в результате анализа уровня ошибок. Все высококонтрастные края должны быть похожи друг на друга, все низкоконтрастные края должны выглядеть одинаково. На оригинальной фотографии низкоконтрастные края должны быть почти такими же яркими, как и высококонтрастные,
- текстуры — похожие текстуры должны иметь аналогичную окраску. Области с большей детализацией поверхности, такие как крупный план баскетбольного мяча, скорее всего, будут иметь более высокий результат анализа уровня ошибок, чем гладкая поверхность,
- поверхности — независимо от фактического цвета поверхности, все плоские поверхности должны иметь примерно одинаковую окраску.
Исходная фотография с камеры должна иметь много белых областей при отправке указанной фотографии на анализ ошибок. Эти белые области должны выглядеть как белый шум или белая краска, нанесенная аэрографом. Когда фотография загружается в различные программы просмотра или редактирования и сохраняется в формате JPEG, теряется высокий уровень детализации и частоты.
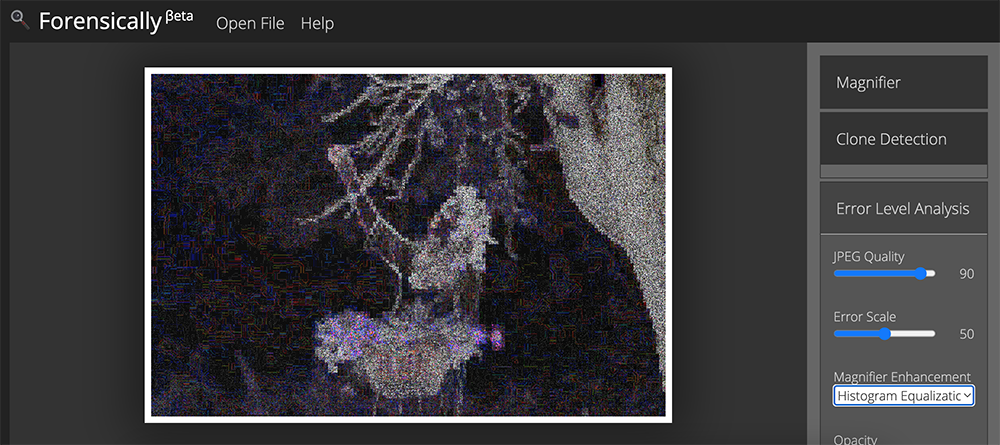
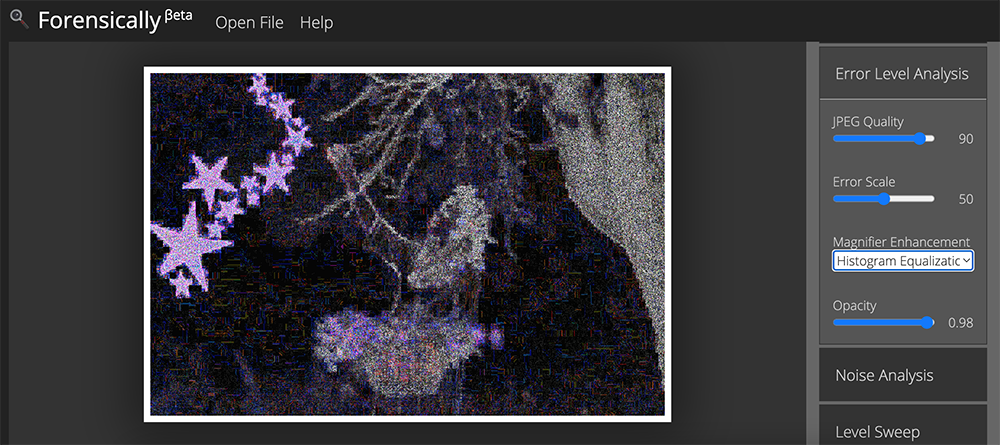
Noise Analysis (анализ шума)
Основан на алгоритме обратного подавления шума. Вместо того, чтобы удалять шум из изображения, он удаляет остальную часть изображения. Это чрезвычайно полезно, если вы хотите обнаружить определенные манипуляции с изображением, таких как аэрография, деформации, деформация и клонирование с коррекцией перспективы. Для достижения наилучших результатов рекомендуется использовать изображения очень высокого качества.
Функции инструмента:
- Noise Amplitude (амплитуда шума) — делает шум ярче;
- Equalize Histogram (выравнивание гистограммы) — применяет выравнивание гистограммы к шуму. Это может раскрыть вещи, но также может их скрыть. Вы должны попробовать как выравнивание гистограммы, так и масштабирование для анализа на шум;
- Magnifier Enhancement (улучшение лупы) — доступно три различных улучшения: выравнивание гистограммы, автоконтраст и автоконтраст по каналам;
- Opacity (непрозрачность) — если вы уменьшите его, увидите больше исходного изображения.
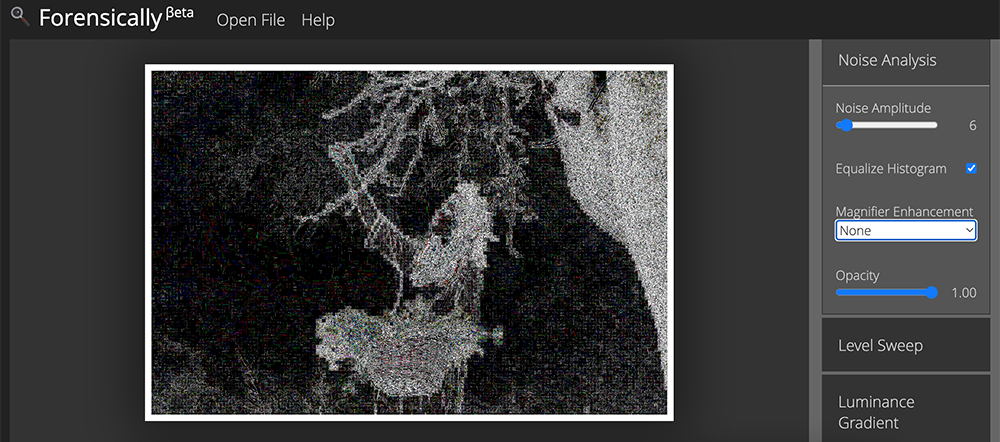
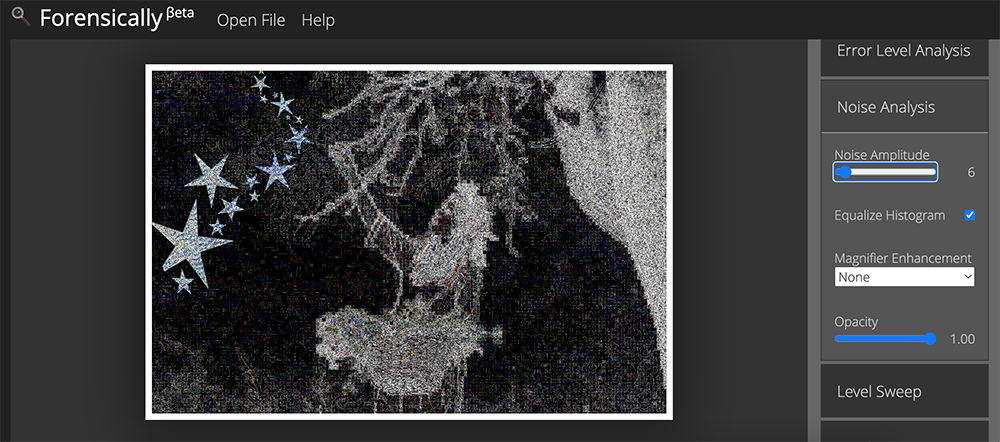
Level Sweep (развертка уровня)
Инструмент позволяет быстро просмотреть гистограмму изображения. Он увеличивает контраст определенных уровней яркости. Использование этого инструмента заключается в том, чтобы сделать края, которые были введены при копировании и вставке содержимого, более заметными.
Чтобы использовать этот инструмент, просто наведите указатель мыши на изображение и прокрутите колесико мыши. Ищите интересные разрывы в изображении.
В настройки инструмента входит:
- Sweep — позиция на гистограмме для проверки, параметр меняется колесиком мыши при наведении курсора на изображение, это позволяет прокручивать гистограмму,
- Width — ширина среза гистограммы для проверки,
- Opacity — если вы уменьшите его, увидите больше исходного изображения.
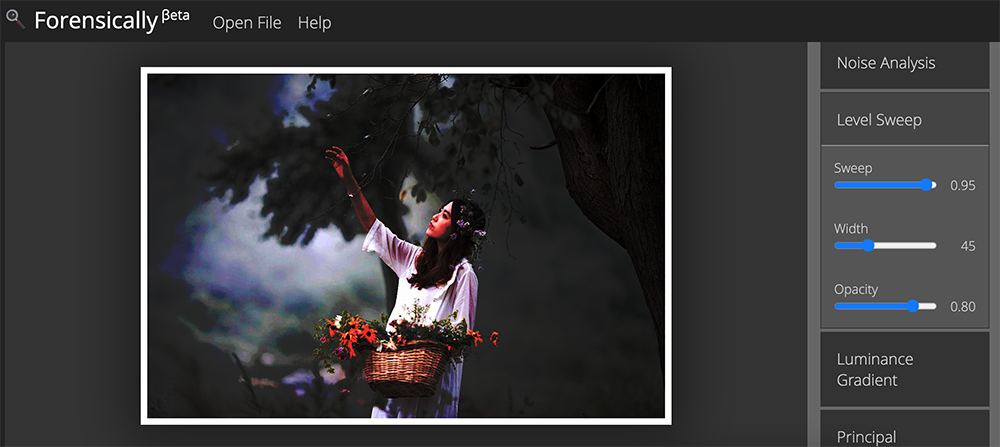

Luminance Gradient (градиент яркости)
Инструмент анализирует изменения яркости по осям «x» и «y» изображения. Он показывает, как освещены разные части изображения, чем помогает найти аномалии. Части изображения, находящиеся под одинаковым углом (к источнику света) и при одинаковом освещении, должны иметь одинаковый цвет.
Другое использование — проверка краев. Подобные ребра должны иметь одинаковые градиенты. Если градиенты на одном краю значительно острее, чем на остальных, это признак того, что изображение могло быть скопировано. Инструмент также хорошо выявляет шумы и артефакты сжатия.
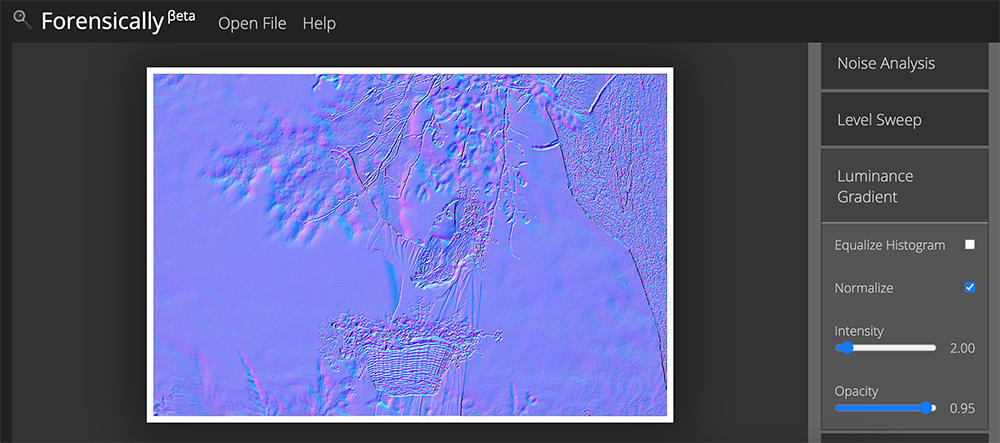
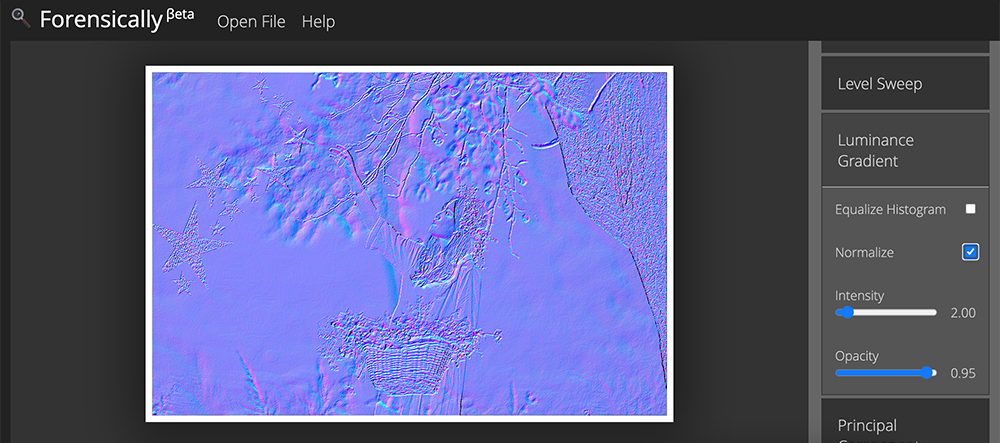
Исходя из анализа иллюстраций, проведенного в сервисе Forensically, первоначальное изображение было обработано, на нем был замене фон. Или на новый фон добавлены элементы: женщина и дерево.
Инструкция актуальна на май 2022 года.
Photoshop в настоящее время является самым востребованным и популярным графическим редактором. Изначально только дизайнеры пользовались программой Photoshop для создания и дизайна своих веб-страниц и изображений. Сейчас же практически каждый использует этот незамысловатый инструмент для редактирования изображений.
Люди пользуются им, чтобы сделать свои фотографии более привлекательными и скрыть какие-то недостатки. А изображения с обложек журналов и рекламы полностью обрабатываются с помощью программы Photoshop, благодаря чему имеют столь привлекательный вид.
Но есть и махинаторы, которые создают ложные фото для того, чтобы выложить их в социальные сети и заработать побольше «лайков» и «раздач«. Такие фотографии выглядят вполне реальными, а иногда настолько причудливыми, что сложно поверить увиденному. Они удаляют все дефекты, что действительно сложно отличить реальное фото от подлога. Таким образом, как же отличить обработанное фото в редакторе Photoshop от оригинала? На самом деле, такие, так сказать, художники оставляют следы своей деятельности, по которым можно судить об оригинальности фотографии.
В редакторах изображений обрабатывается сотни фотографий в день, но они лишь устраняют дефекты, меняют фон, усиливают какие свойства, что делает внешний вид фотографии более привлекательным в целом. Но если присмотреться, то можно увидеть некоторые недочеты, разногласия и следы обработки фотографии в графическом редакторе. Возможно, вас заинтересует статья 10 частей тела, которые фотошопят чаще всего.
Так как же определить, была фотография обработана, или нет?
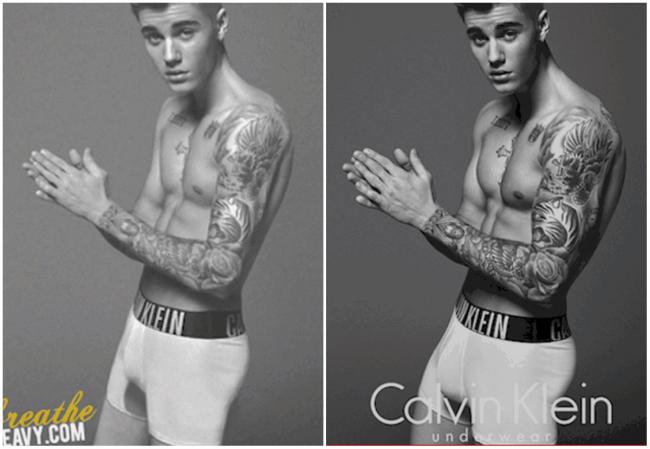
Выявить фальсификацию можно разными способами, например, изучить фон, проверить постановку, отражения и т.д. Существуют даже специальные приложения, способные проверить изображение. Данная статья призвана помочь выявлять фальсифицированные изображения. Ну что ж, приступим.
Без использования специализированных приложений
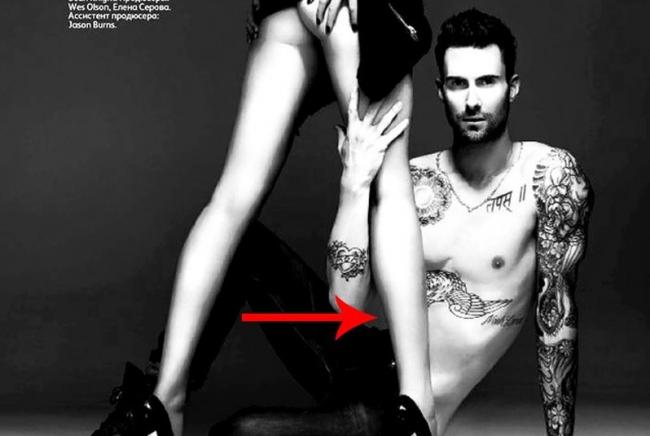
Как уже говорилось ранее, эффективным способом отличить фальшивку от реальной фотографии можно с помощью детального изучения самого изображения. Не важно, на сколько профессионально изображение завуалировано, при детально осмотре всегда можно найти какие-то недочеты. Такие недочеты являются ключом к распознаванию подделки. Вот несколько ключевых моментов, которые помогут отличить оригинальную фотографию от обработанной в приложении Photoshop.
1. Изучение фона
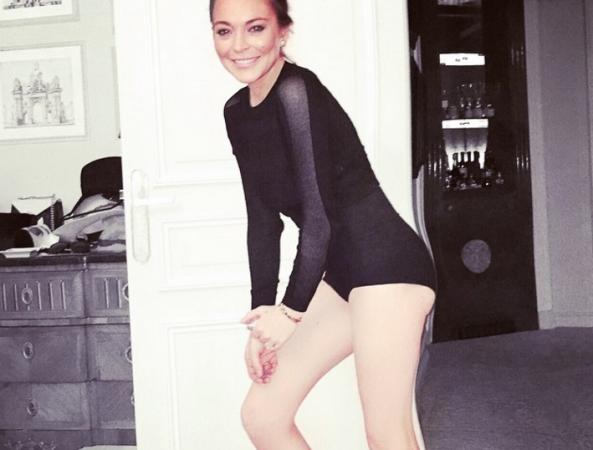
Фон может рассказать многое о том, проводились какие-то манипуляции с фотографией или нет, так как иногда он просто-напросто не вписывается в общий образ картины. При появлении сомнений в истинности фотографии, ее проверку следует начинать с изучения фона. Если, например, фон искажен или имеет изогнутые поверхности, то, несомненно, такую фтографию редактировали. При обработке изображений невозможно сохранить объекты восприятия идеальными. Ниже дается пример изображения.
При детальном изучении фотографии можно заметить, что та часть плоскости фона, которая должна быть прямой, искажена и изогнута. Таким образом, можно заключить, что фотография подвергалась обработке. Также обратите внимание на статью 10 знаменитостей «до» и «после» применения Фотошопа.
2. Изучение освещения и теней
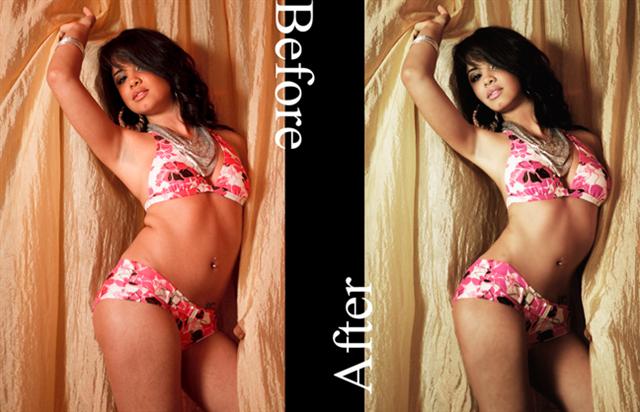
Зачастую, удаляя или добавляя объекты в оригиналы фотографий, подобного рода махинаторы уделяют недостаточное внимание падению света и образованию теней. Направление тени, отражения или наиболее яркие участки изображения выдают фальсификацию изображения. Если тени или отражения отсутствуют, или отредактированы в соответствии с падением света или других вещей, то, однозначно, такая фотография является фальсификатом.
Изображение выше наглядный пример нелепой ошибки работы в Phototshop. Как можно заметить, девушка на фотографии не отбрасывает тень, что является не естественным. К тому же, можно увидеть явное не соответствие освещенности девушки и фона самого изображения. Фотография девушки ярче, чем остальное изображение, что выделяет ее на этом фоне. Кажется, что девушка летит, а не идет.
3. Некоторые незначительные ошибки
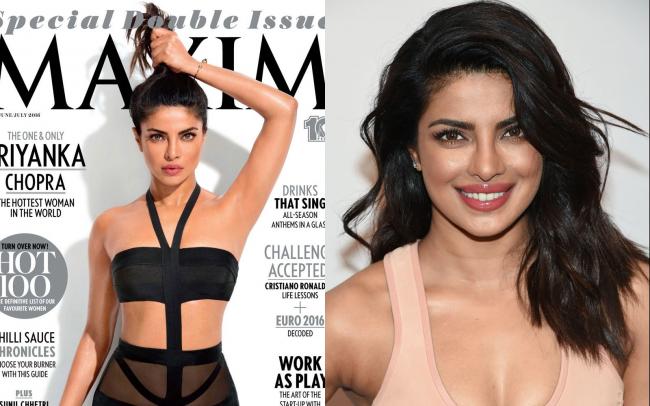
Как уже говорилось ранее, фотохудожники часто допускают ошибки, по которым остальные легко могут определить наличие обработки фотографии. В особенности это касается обложек журналов и рекламы, где недочеты видны явным образом. Как-то на одном фото мне довелось увидеть одну лишнюю ногу, а на другом фото форма рук была не естественной.
Также не естественная гладкость картинки явно свидетельствует о том, что фотография была обработана в Photoshop, так как мы все люди и никто не обладает такой идеальной гладкостью. Можно взять в пример фотографии Приянки Чопра на обложке журнала Maxim, которые приобрели популярность по нескольким причинам, как хорошим, так и плохим. Стоит только взглянуть на картинку, хотя она и выглядит чертовски великолепно, можно увидеть не естественную гладкость ее подмышек.
4. Проверка файла и его метаданных
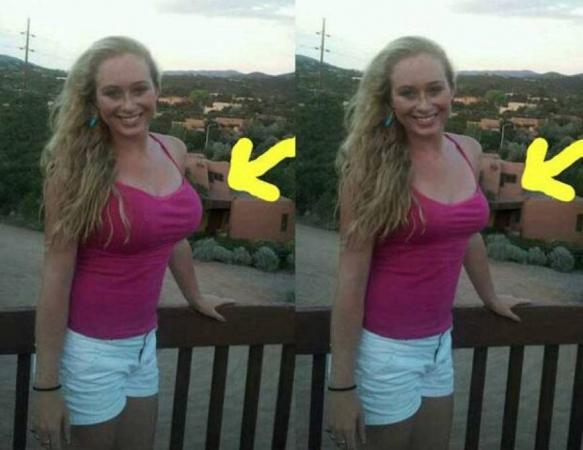
Другим эффективным способом проверки оригинальности фотографий является изучение его метаданных. Каждая фотография содержит характерные метаданные о файле. Одной из таких информаций является данные стандарта EXIF, которые способны рассказать о последнем программном обеспечении или расширении файла, в котором он был сохранен, какой камерой был сделан и так далее.
Такое программное обеспечение, способное считывать данные стандарта EXIF, можно найти в интернете. Но следует помнить одну вещь, что не все данные стандарта EXIF одинаковы, так как они зависят от настроек камеры, соответственно, сохраняется только эта информация. К тому же, существует множество способов удалить данные EXIF из файла.
Приложения для проверки подлинности фотографий
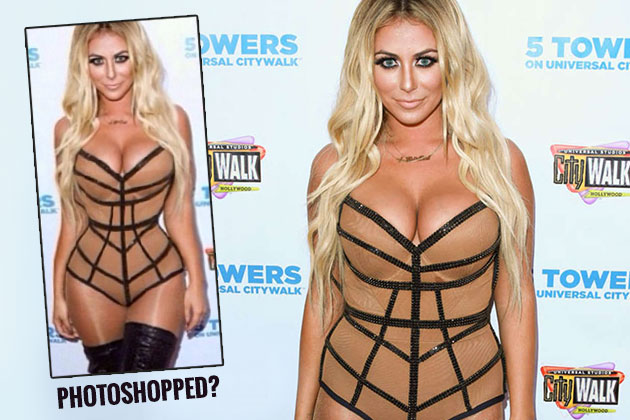
Таким образом, выше мы рассмотрели способы выявления фальсификации фотографий. Но что делать, если визуально не получается определить фальсификацию, а сомнения в подлинности есть, здесь на помощь приходит специализированное программное обеспечение. С его помощью можно определить, было изображение обработано или нет. Речь пойдет о самом лучшем.
1. Программа FotoForensics
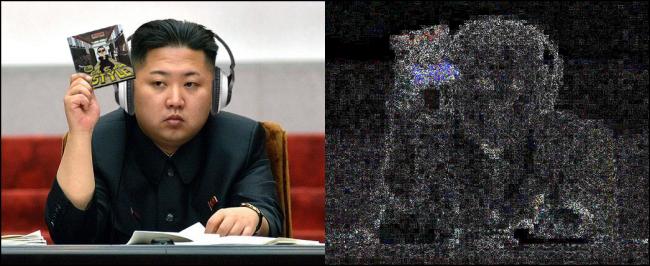
Fotoforensics является одним из самых лучших приложений, которое способно выявить наличие редактирования. На обработку уходит не так много времени. Что самое интересное, приложение не считывает метаданные файла, чтобы определить является ли фотография оригиналом. Приложению также не нужны изображения RAW для проверки самого фото.
Оценку фото программа выполняет, основываясь на других факторах, таких как яркость, если какая-то часть изображения ярче, то очевидно изображение обрабатывалось.
2. Программное обеспечение Izitru
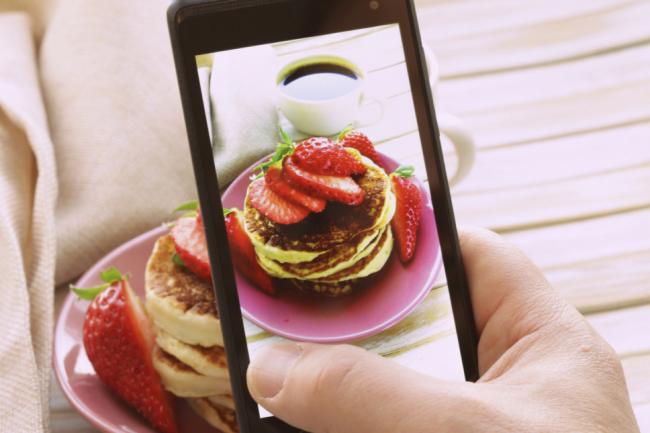
Izitru — другой уникальный инструмент определения подлинности фотографии. В своей работе программа использует метаданные и другие факторы. Этот инструмент может с легкостью определить подлинность изображения. Но он не показывает наличие расхождений на фото. Поэтому, тех, кто хочет знать, какой фрагмент был редактирован, ждет небольшое разочарование. После анализа он выдает сертификат подлинности.
3. Программное обеспечение Image Error level analysis (Анализ уровня искажения изображения)
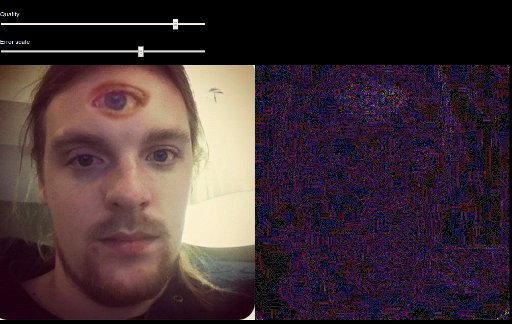
Для выявления подлинности фотографии можно также пользоваться таким инструментом. Инструмент Image Error level analysis выдает результаты на основе сжатия и количества пикселей в изображении. Не важно, когда изображение модифицировалось, инструмент каждый раз находит измененные участки и подсвечивает их, позволяя тем самым увидеть какая область была изменена.
В статье были представлены способы отличить оригинал фотографии от его редактированной копии. Прежде всего, это можно сделать с помощью визуального осмотра, но если нет явных признаков обработки, то в этом случае могут помочь специализированные программные средства.
Рекомендуем посмотреть:
Видимо, редакторы некоторых журналов не задумывались о том, что фотографии в их издании могут привлечь к себе повышенное внимание: итак, самые неправдоподобные фотографии знаменитостей, которых слишком сильно «зафотошопили» для обложки журнала.
Error Level Analysis is a forensic method to identify portions of an image with a different level of compression. The technique could be used to determine if a picture has been digitally modified. To better understand the techniques, it’s necessary to deepen the JPEG compression technique.
JPEG (Joint Photographic Experts Group) is a method of lossy compression for digital images. It’s a data encoding algorithm that compresses data by discarding (losing) some of it. The level of compression could be chosen as a reasonable compromise between picture size and image quality. A JPEG compression scale is usually 10:1.
The JPEG algorithm works on image grids, compressed independently, having a size of 8×8 pixels. The 8X8 dimension was chosen after numerous experiments with other sizes, any matrices of sizes greater than 8 X 8 are harder to be mathematically manipulated or not supported by hardware, meanwhile any matrices of sizes less than 8 X 8 don’t have enough information. They result in poor quality compressed images.
For images not digitally modified, all 8×8 grids should have a similar error level, resaving the picture. Each square should degrade at approximately the same rate, due to the introduction of an homogeneous amount of errors across the entire image. In a modified image, the altered grid should be at a higher error potential in respect to remaining part of the image.
Image manipulation and analysis
In August 2007, Dr. Neal Krawetz made an interesting presentation during the Black Hat conference titled “A Picture’s Worth.” It involved determing if a picture is real, or of a computer modification. Error Level Analysis (ELA) is one of the simpler methods presented by the researcher. In 2010, Pete Ringwood created the “errorlevelanalysis.com” website as a free service where people could submit photos and web pictures for analysis. The site was later closed. Hacker Factor has recreated the service “fotoforensics.com.” It’s free and allows any user to perform ELA analysis on their own photos.
The methods to analyze the images presented by Krawetz are:
- Observation
- Basic image enhancements
- Image format analysis
- Advanced image analysis
ELA Error Level Analysis is a very useful method to detect the manipulation of images belonging to an advanced image analysis. ELA works by re-saving the image at 95% compression, and evaluating the difference with the original. Modified areas are easily seen due their characteristic aspects in the ELA representation.
The main methods used for the picture analysis are based on the following clues:
- Shadows– Analyze the shadows related to different objects in the picture, evaluating them in relation to the direction of the light source.
- Eyes– Zoom in and compare against other eyes. (Dots/colors give light direction)
- EXIF– Evaluating of EXIF file dat,a including GPS position, time and RBG color profile changes.
- Reflections– Analyze that the reflection within the image is coherent.
Principal free tools are:
Image compression – the mapper
Every computer image is composed of pixels made of three colors: red, green, and blue (RGB). The color value of a pixel is represented with a byte (0-255). The mapper (aka decoder) modifies the RGB color space to YCbCr color space, Y is the luminescence, Cb and Cr are the chrominance-blue and chrominance-red color portions. In YCbCr color space, most of the image data is available in Y component, Cb and Cr have color information.

Figure – YCbCr representation
The mapper splits the images into a sub-image grid of 8X8, while JPEG always encodes luminance with an 8×8 grid. The chrominance may be encoded using 8×8, 8×16, 16×8, or 16×16. For display, the JPEG mapper converts the image from YCbCr to RGB.
The principle behind ELA
Error Level Analysis evaluates the quality level for grids squared within the images. They present an increased degree of error during successive resave operations. The phenomenon is obvious if images aren’t optimized for a specified camera quality level. Subsequent resaves reduce the error level potential, producing a darker ELA. After a number of resaves, the grid square reaches its minimum error level.
The image Error Level Analyzer
The Image Error Level Analyzer in an online tool that implements an ELA algorithm. By using it, it’s possible to rapidly discover image manipulation. The web tool is based on the Python Image Library and the libjpeg library (v6.2.0-822.2). The verification process consists of successive resaves of the image at a predefined quality. The resulting picture is compared with the original one.
If an image hasn’t been manipulated, all its parts have been saved the same number of times, images are composed by a portion of other sources, or have been simply been manipulated, will show different level of errors visible in the ELA representation with different colors.
The authors of the website also developed a Firefox plugin that enables users to analyze an image by simply right-clicking on any image on the internet.
With the ELA method, it’s possible to discover image modification by establishing a chronological order of changes of various parts of the image. The lighter parts have been edited most recently, the most opaque have been saved several times.
Although it accepts images of limited sizes, it also allows the submission of images up to 1224 pixels per side.
The test
The first step is the generation of an ELA image. Upload an image on http://fotoforensics.com, or simply provide its URL.

Figure – ELA web tool
After pressing the “Process” button, users are redirected to a page containing the original image and the ELA. Let’s start with the original image:

Figure – Original Image
Then modify it by introducing a stack of coins and changing the aspect of the toad:

Figure – Altered image
At this point, let’s submit the picture to the online service to generate the following ELA representation.

Figure – ELA image
The sections that are black correspond to the parts that usually aren’t manipulated. Solid white blocks usually represent the same. Solid colors present a good level of compression with minimal error levels, displayed as darker areas in the image. ELA highlights the altered portions of the image that represent higher ELA values, and a bright white color. Note that in the outline of objects in high frequency areas, they usually have higher ELA values than the rest of the image. In the following image, the text of the books stands out because the contrast creates a high frequency edge.
“In general, you should compare edges with edges and surfaces with surfaces. If all surfaces except one have similar ELA values, then the outlier should be suspect.”
| Image | ELA |
|
|
|


Another interesting example is provided by the Hacker Factor Blog (http://www.hackerfactor.com), this time an an allegedly winning lottery ticket is under analysis.
ELA shows that the image has been modified, the digit “4” has been inserted in the “04” and “46”, and both “23” values were altered.
| Image | ELA |
|
|
 |

The tool could provide false-negative results when different portions of the image have been resaved the same number of times. In this case, all the areas present same degree of error.
There are some limitations to consider when conducting an ELA analysis. The technique operates on JPEG images based on a grid, changes to a portion of a grid to affect the entire grid square. That makes it impossible to identify the pixel modified. ELA can’t detect single pixel modification or minor color adjustment.
Scaling and recoloring the picture impacts the entire image, introducing a greater error level potential.
Another element of noise for ELA is represented by the presence of high contrast colors within the same grid, for example black and white colors, which generate high ELA values. This anomaly is attributable to the fact that JPEG uses the YUV color space representation.
Thanks to ELA analysis, it’s possible to discover if the image was the result of a conversion from another format. For example, if a non-JPEG image contains visible grid lines (1-pixel wide in 8×8 squares), it means the picture was originally a JPEG that was later converted to a non-JPEG format.
Another interesting case in ELA literature is that in an image converted from the PNG format to JPEG, ELA analysis produces very high levels of error in edges and textures. That appears as a prevalence of dark or black coloring. A conversion from JPEG to PNG is lossless, and will retain JPEG artifacts.
The rainbowing technique
Rainbowing indicates the visible separation between the luminance and chrominance channels, as blue,purple and red.
Rainbowing evaluation is possible because JPEG separates colors into luminance and chrominance channels. The luminance is the gray-scale intensity of the image, while the chrominance-red and chrominance-blue components identify the amount of coloring, independent of the full color’s intensity.
Photoshop, Adobe products, and other third party software companies like FilterGrade introduce a large amount of rainbowing when they adjust images. This is vastly different from other tools such as Microsoft Paint, that do not do this. Picture modification with commercial tools such as Photoshop or Gimp can introduce distinct rainbowing pattern surfaces that have near-uniform coloring. High-quality camera photos may also include a rainbowing effect along uniformly colored surfaces.
Beware that the presence of rainbowing may only mean that an Adobe product, like Photoshop or Lightroom, was used to save the image. It may not represent proof of intentional image alteration.
A controversial case
During the last World Photo Awards,World Press Photo said that Paul Hansen’s photo of mourners in Gaza was “retouched with respect to both global and local color and tone,” despite that there was no evidence of manipulation. Experts using ELA analysis were able to demonstrate a meaningful rainbowing effect (faint red and blue patches) and the presence of a higher ELA value on edges and textures were probably caused by Photoshop’s unintentional auto-sharpening.

Figure – Original image

Figure – ELA
The rainbowing effect is clearly visible in various portions of the image, such as the sky, walls, and people. Another source of information is the metadata. Analyzing that makes it possible to evaluate the congruence of the light of the image.
In this specific case, the photo was taken in the morning in November in the northern hemisphere, when the sun should be low on the horizon. The strong shadows on the left building allowed an expert to draw lines that intersect in the general direction of the sun. The sun wasn’t quite low, but maybe the reported time was wrong, and the lighting on the people doesn’t match the sun’s position.
“The people should have dark shadows on their right sides (the left side of the photo), but their facial lighting does not match the available lighting.”
According to the experts who analyzed the photo, it’s likely that the photographer took a series of photos and combined a few pictures, altering some aspects of the image.
Conclusion
Despite that proper application can allow experts to easily discover image modification (including scaling, cropping and resave operations), ELA analysis depends on the quality of the image. Working on a picture resulting from numerous resave operations isn’t effective.If an image is resaved numerous times, then it may have a minimum error level, where more resaves don’t alter the image. ELA will return a black image, and no modifications may be detected.
The technique is very effective at discovering alterations introduced with tools like Photoshop or Gimp. By just saving a picture with these applications, users introduce a higher error level potential in the image.
The downside is that these tools could be the cause of unintentional modification. Considered in the analysis of any picture that ELA is just an algorithm to analyze the images. Despite that it’s very efficient under specific conditions, it’s suggested to integrate it with other forensics tools to provide valid results.
Sources
Photographic Experts Group
Image compression how jpeg works
Hackerfactor blog
Hackerfactor papers
Paul hansens award-winning shot
Photo ela error level analysis
forensics ela
forensics
Error level analysis
Forensics Plugins