| title | description | ms.custom | ms.date | ms.topic | helpviewer_keywords | ms.assetid | author | ms.author | manager | ms.technology | ms.workload | ||||
|---|---|---|---|---|---|---|---|---|---|---|---|---|---|---|---|
|
Error List Window |
Learn about the Error List window and how to use it to perform tasks related to resolving the errors it displays. |
SEO-VS-2020 |
11/04/2016 |
reference |
|
b7f6d45a-733b-4ad8-bc2f-737a37509e56 |
TerryGLee |
tglee |
jmartens |
vs-ide-general |
multiple |
Error List Window
[!INCLUDE Visual Studio]
[!NOTE]
The Error List displays information about a specific error message. You can copy the error number or error string text from the Output window. To display the Output window, press Ctrl+Alt+O. See Output window.
The Error List window lets you perform the following tasks:
-
Display the errors, warnings, and messages produced while you write code.
-
Find syntax errors noted by IntelliSense.
-
Find deployment errors, certain Static Analysis errors, and errors detected while applying Enterprise Template policies.
-
Double-click any error message entry to open the file where the problem occurs, and move to the error location.
-
Filter which entries are displayed, and which columns of information appear for each entry.
-
Search for specific terms and scope the search to just the current project or document.
To display the Error List, choose View > Error List, or press Ctrl++E.
You can choose the Errors, Warnings, and Messages tabs to see different levels of information.
To sort the list, click any column header. To sort again by an additional column, hold down the Shift key and click another column header. To select which columns are displayed and which are hidden, choose Show Columns from the shortcut menu. To change the order in which columns are displayed, drag any column header to the left or right.
Error List Filters
There are two types of filter in two dropdown boxes, one on the right side of the toolbar and one to the left of the toolbar. The dropdown list on the left side of the toolbar specifies the set of code files to use (Entire Solution, Open Documents, Current Project, Current Document).
You can restrict the scope of the search to analyze and act on groups of errors. For example, you might want to focus on core errors that are preventing a project from compiling. The scoping options include:
-
Open Documents: Show errors, warnings, and messages for the open documents.
-
Current Project: Show errors, warnings, and messages from the project of the currently selected document in the Editor or the selected project in Solution Explorer.
[!NOTE]
The filtered list of errors, warnings, and messages will change if the project of the currently selected document is different from the project selected in Solution Explorer. -
Current Document: Show errors, warnings, and messages for the currently selected document in the Editor or Solution Explorer.
If a filter is currently applied to the search result, the name of the filter appears in the Error List title bar. The Errors, Warnings, and Messages buttons then display the number of filtered items being shown along with the total number of items. For example, the buttons show «x of y Errors». If no filter is applied, the title bar says only «Error List».
The list on the right side of the toolbar specifies whether to show errors from the build (errors resulting from a build operation) or from IntelliSense (errors detected before running a build), or from both.
Search
Use the Search Error List text box on the right side of the Error List toolbar to find specific errors in the error list. You can search on any visible column in the error list, and search results are always sorted based on the column that has sort priority instead of on the query or the filter applied. If you choose the Esc key while the focus is in the Error List, you can clear the search term and filtered search results. You can also click the X on the right side of the text box to clear it.
Save
You can copy the error list and save it to a file. Select the errors you want to copy and right-click the selection, then on the context menu select Copy. You can then paste the errors into a file. If you paste the errors to an Excel spreadsheet, the fields appear as different columns.
UI Element List
Severity
Displays the different types of Error List entry (Error, Message, Warning, Warning (active), Warning (inactive).
Code
Displays the error code.
Description
Displays the text of the entry.
Project
Displays the name of the current project.
File
Displays the file name.
Line
Displays the line where the problem occurs.
Содержание
- Error codes
- Macros provided for quick checking
- Remarks
- Ошибки и предупреждения режима сборки проекта (PRJxxxx)
- Error List Window
- Error List Filters
- Search
- UI Element List
- Коды ошибок
- Макросы, предоставляемые для быстрой проверки
- Комментарии
Error codes
Applies to: Visual Studio Visual Studio for Mac Visual Studio Code
When a Source Control Plug-in API function returns an error, it is expected to be one of the following error codes. All errors are negative, warnings or informational error codes are positive, and success is 0.
| Error Code | Value | Description |
|---|---|---|
| SCC_I_SHARESUBPROJOK | 7 | Plug-in supports adding files from source control in two steps. For more information, see SccSetOption. |
| SCC_I_FILEDIFFERS | 6 | The local file is different from the file in the source control database (for example, SccDiff may return this value). |
| SCC_I_RELOADFILE | 5 | Local file was changed during the source control operation; the IDE should reload the file if possible. |
| SCC_I_FILENOTAFFECTED | 4 | The file is not affected. |
| SCC_I_PROJECTCREATED | 3 | The Project was created during the source control operation (for example, during a call to SccOpenProject when SCC_OP_CREATEIFNEW flag is specified). |
| SCC_I_OPERATIONCANCELED | 2 | Operation was cancelled. |
| SCC_I_ADV_SUPPORT | 1 | Plug-in supports advanced options for the specified command. For more information, see SccGetCommandOptions. |
| SCC_OK | Success. | |
| SCC_E_INITIALIZEFAILED | -1 | Error: initialization failed. |
| SCC_E_UNKNOWNPROJECT | -2 | Error: project is unknown. |
| SCC_E_COULDNOTCREATEPROJECT | -3 | Error: project could not be created. |
| SCC_E_NOTCHECKEDOUT | -4 | Error: the file is not checked out. |
| SCC_E_ALREADYCHECKEDOUT | -5 | Error: the file is already checked out. |
| SCC_E_FILEISLOCKED | -6 | Error: the file is locked. |
| SCC_E_FILEOUTEXCLUSIVE | -7 | Error: the file is exclusively checked out. |
| SCC_E_ACCESSFAILURE | -8 | There was a problem accessing the source control system, probably due to network or contention issues. A retry is recommended. |
| SCC_E_CHECKINCONFLICT | -9 | Error: there was a conflict during check in. |
| SCC_E_FILEALREADYEXISTS | -10 | Error: the file already exists. |
| SCC_E_FILENOTCONTROLLED | -11 | Error: the file is not under source control. |
| SCC_E_FILEISCHECKEDOUT | -12 | Error: the file is checked out. |
| SCC_E_NOSPECIFIEDVERSION | -13 | Error: there is no specified version. |
| SCC_E_OPNOTSUPPORTED | -14 | Error: the operation is not supported. |
| SCC_E_NONSPECIFICERROR | -15 | Nonspecific error. |
| SCC_E_OPNOTPERFORMED | -16 | Error, the operation was not performed. |
| SCC_E_TYPENOTSUPPORTED | -17 | Error: the type of the file, for example, binary, is not supported by the source code control system. |
| SCC_E_VERIFYMERGE | -18 | File has been auto-merged but has not been checked because it is pending user verification. |
| SCC_E_FIXMERGE | -19 | File has been auto-merged but has not been checked in due to a merge conflict that must be manually resolved. |
| SCC_E_SHELLFAILURE | -20 | Error due to a shell failure. |
| SCC_E_INVALIDUSER | -21 | Error: the user is invalid. |
| SCC_E_PROJECTALREADYOPEN | -22 | Error: the project is already open. |
| SCC_E_PROJSYNTAXERR | -23 | Project syntax error. |
| SCC_E_INVALIDFILEPATH | -24 | Error: the file path is invalid. |
| SCC_E_PROJNOTOPEN | -25 | Error: the project is not open. |
| SCC_E_NOTAUTHORIZED | -26 | Error: the user is not authorized to perform this operation. |
| SCC_E_FILESYNTAXERR | -27 | File syntax error. |
| SCC_E_FILENOTEXIST | -28 | Error, the local file does not exist. |
| SCC_E_CONNECTIONFAILURE | -29 | Error: there was a connection failure. |
| SCC_E_UNKNOWNERROR | -30 | Unknown error. |
| SCC_E_BACKGROUNDGETINPROGRESS | -31 | Background get operation is currently in progress. |
Macros provided for quick checking
All Source Control Plug-in API functions (except the SccAdd, SccCheckin, and SccDiff) are expected to succeed when the local files that are passed as arguments do not exist in the working folder. For example, the IDE may issue a call to the SccCheckout or SccUncheckout on a file that does not exist in the working folder, but exists in the source control system. This call would succeed. Only when there is no file in the working folder or in the source control system is the function expected to fail.
Certain functions, such as SccAdd and SccCheckin , should specifically return SCC_E_FILENOTEXIST when the file in the working folder does not exist. Other functions are expected to succeed when the working file does not exist, if the functions operate on a valid file name in the source control system.
The source control plug-in should make no assumptions regarding privileges on a file in the working folder, even if the plug-in had marked the file read-only during some operation. A file in the working folder can be moved, deleted, and changed outside the plug-in’s control.
Источник
Ошибки и предупреждения режима сборки проекта (PRJxxxx)
Этот раздел содержит ссылку на ошибки, созданные средствами сборки Project. Ошибки и предупреждения сборки проекта имеют форму PRJxxxx, где xxxx — четырехзначное число.
Компиляторы и средства сборки Visual Studio могут сообщать о различных типах ошибок и предупреждений. После обнаружения ошибки или предупреждения средства сборки могут делать предположения о намерении кода и пытаться продолжить работу, чтобы можно было сообщать о дополнительных проблемах одновременно. Если средства делают неверное предположение, последующие ошибки или предупреждения не могут применяться к проекту. При устранении проблем в проекте всегда начинайте с первой зарегистрированной ошибки (или предупреждения) и выполняйте повторную сборку как можно чаще. Одно исправление может привести к возникновению многих последующих ошибок.
Чтобы получить справку о конкретном диагностическом сообщении в Visual Studio, выберите его в окне вывода и нажмите клавишу F1 . Visual Studio открывает страницу документации для этой ошибки, если она существует. Вы также можете использовать средство поиска в верхней части страницы, чтобы найти статьи о конкретных ошибках или предупреждениях. Кроме того, просмотрите список ошибок и предупреждений по инструменту и введите оглавление на этой странице.
Не все ошибки или предупреждения Visual Studio описаны. Во многих случаях диагностическое сообщение предоставляет все доступные сведения. Если вы приземлились на этой странице при использовании F1 и считаете, что сообщение об ошибке или предупреждении требует дополнительного объяснения, сообщите нам об этом. Кнопки обратной связи на этой странице можно использовать для создания проблемы с документацией на сайте GitHub. Если вы считаете, что ошибка или предупреждение неправы или обнаружена другая проблема с набором инструментов, сообщите о проблеме с продуктом на сайте Сообщество разработчиков. Вы также можете отправить отзыв и ввести ошибки в интегрированной среде разработки. В Visual Studio перейдите в строку меню и выберите «Отправить > отзыв справки>» или отправьте предложение с помощью отправки > отзывов > справки.
Вы можете найти дополнительную помощь по ошибкам и предупреждениям на форумах Microsoft Learn Q&A . Или найдите номер ошибки или предупреждения на сайте Сообщество разработчиков Visual Studio C++. Вы также можете выполнить поиск решений в Stack Overflow .
Ссылки на дополнительные справочные материалы и ресурсы сообщества см. в справке и сообществе Visual C++.
Источник
Error List Window
Applies to: Visual Studio Visual Studio for Mac Visual Studio Code
The Error List displays information about a specific error message. You can copy the error number or error string text from the Output window. To display the Output window, press Ctrl+Alt+O. See Output window.
The Error List window lets you perform the following tasks:
Display the errors, warnings, and messages produced while you write code.
Find syntax errors noted by IntelliSense.
Find deployment errors, certain Static Analysis errors, and errors detected while applying Enterprise Template policies.
Double-click any error message entry to open the file where the problem occurs, and move to the error location.
Filter which entries are displayed, and which columns of information appear for each entry.
Search for specific terms and scope the search to just the current project or document.
To display the Error List, choose View > Error List, or press Ctrl++E.
You can choose the Errors, Warnings, and Messages tabs to see different levels of information.
To sort the list, click any column header. To sort again by an additional column, hold down the Shift key and click another column header. To select which columns are displayed and which are hidden, choose Show Columns from the shortcut menu. To change the order in which columns are displayed, drag any column header to the left or right.
Error List Filters
There are two types of filter in two dropdown boxes, one on the right side of the toolbar and one to the left of the toolbar. The dropdown list on the left side of the toolbar specifies the set of code files to use (Entire Solution, Open Documents, Current Project, Current Document).
You can restrict the scope of the search to analyze and act on groups of errors. For example, you might want to focus on core errors that are preventing a project from compiling. The scoping options include:
Open Documents: Show errors, warnings, and messages for the open documents.
Current Project: Show errors, warnings, and messages from the project of the currently selected document in the Editor or the selected project in Solution Explorer.
The filtered list of errors, warnings, and messages will change if the project of the currently selected document is different from the project selected in Solution Explorer.
Current Document: Show errors, warnings, and messages for the currently selected document in the Editor or Solution Explorer.
If a filter is currently applied to the search result, the name of the filter appears in the Error List title bar. The Errors, Warnings, and Messages buttons then display the number of filtered items being shown along with the total number of items. For example, the buttons show «x of y Errors». If no filter is applied, the title bar says only «Error List».
The list on the right side of the toolbar specifies whether to show errors from the build (errors resulting from a build operation) or from IntelliSense (errors detected before running a build), or from both.
Search
Use the Search Error List text box on the right side of the Error List toolbar to find specific errors in the error list. You can search on any visible column in the error list, and search results are always sorted based on the column that has sort priority instead of on the query or the filter applied. If you choose the Esc key while the focus is in the Error List, you can clear the search term and filtered search results. You can also click the X on the right side of the text box to clear it.
You can copy the error list and save it to a file. Select the errors you want to copy and right-click the selection, then on the context menu select Copy. You can then paste the errors into a file. If you paste the errors to an Excel spreadsheet, the fields appear as different columns.
UI Element List
Displays the different types of Error List entry (Error, Message, Warning, Warning (active), Warning (inactive).
Displays the error code.
Displays the text of the entry.
Displays the name of the current project.
Displays the file name.
Displays the line where the problem occurs.
Источник
Коды ошибок
Применимо к: Visual Studio Visual Studio для Mac Visual Studio Code
Если функция API подключаемого модуля системы управления версиями возвращает ошибку, она должна быть одним из следующих кодов ошибок. Все ошибки являются отрицательными, предупреждениями или информационными кодами ошибок являются положительными, а успешно — 0.
| Код ошибки | Значение | Описание |
|---|---|---|
| SCC_I_SHARESUBPROJOK | 7 | Подключаемый модуль поддерживает добавление файлов из системы управления версиями на двух шагах. Дополнительные сведения см. в разделе SccSetOption. |
| SCC_I_FILEDIFFERS | 6 | Локальный файл отличается от файла в базе данных системы управления версиями (например, SccDiff может возвращать это значение). |
| SCC_I_RELOADFILE | 5 | Локальный файл был изменен во время операции управления версиями; Интегрированная среда разработки должна перезагрузить файл, если это возможно. |
| SCC_I_FILENOTAFFECTED | 4 | Файл не затрагивается. |
| SCC_I_PROJECTCREATED | 3 | Проект был создан во время операции управления версиями (например, во время вызова SccOpenProject при SCC_OP_CREATEIFNEW указании флага). |
| SCC_I_OPERATIONCANCELED | 2 | Операция отменена. |
| SCC_I_ADV_SUPPORT | 1 | Подключаемый модуль поддерживает дополнительные параметры для указанной команды. Дополнительные сведения см. в разделе SccGetCommandOptions. |
| SCC_OK | Успешно. | |
| SCC_E_INITIALIZEFAILED | -1 | Ошибка: сбой инициализации. |
| SCC_E_UNKNOWNPROJECT | -2 | Ошибка: проект неизвестен. |
| SCC_E_COULDNOTCREATEPROJECT | –3 | Ошибка: не удалось создать проект. |
| SCC_E_NOTCHECKEDOUT | –4 | Ошибка: файл не извлечен. |
| SCC_E_ALREADYCHECKEDOUT | -5 | Ошибка: файл уже извлечен. |
| SCC_E_FILEISLOCKED | –6 | Ошибка: файл заблокирован. |
| SCC_E_FILEOUTEXCLUSIVE | -7 | Ошибка: файл извлекается исключительно. |
| SCC_E_ACCESSFAILURE | –8 | Возникла проблема с доступом к системе управления версиями, вероятно, из-за проблем с сетью или состязанием. Рекомендуется повторить попытку. |
| SCC_E_CHECKINCONFLICT | –9 | Ошибка: во время возврата произошел конфликт. |
| SCC_E_FILEALREADYEXISTS | –10 | Ошибка: файл уже существует. |
| SCC_E_FILENOTCONTROLLED | -11 | Ошибка: файл не находится под управлением системы управления версиями. |
| SCC_E_FILEISCHECKEDOUT | -12 | Ошибка: извлекается файл. |
| SCC_E_NOSPECIFIEDVERSION | -13 | Ошибка: нет указанной версии. |
| SCC_E_OPNOTSUPPORTED | -14 | Ошибка: операция не поддерживается. |
| SCC_E_NONSPECIFICERROR | -15 | Неопределимая ошибка. |
| SCC_E_OPNOTPERFORMED | -16 | Ошибка, операция не выполнена. |
| SCC_E_TYPENOTSUPPORTED | -17 | Ошибка: тип файла, например binary, не поддерживается системой управления исходным кодом. |
| SCC_E_VERIFYMERGE | –18 | Файл был автоматически объединен, но не был проверен, так как он ожидает проверки пользователя. |
| SCC_E_FIXMERGE | -19 | Файл был автоматически объединен, но не был возвращен из-за конфликта слияния, который необходимо разрешить вручную. |
| SCC_E_SHELLFAILURE | –20 | Ошибка из-за сбоя оболочки. |
| SCC_E_INVALIDUSER | -21 | Ошибка: пользователь недопустим. |
| SCC_E_PROJECTALREADYOPEN | -22 | Ошибка: проект уже открыт. |
| SCC_E_PROJSYNTAXERR | -23 | Ошибка синтаксиса проекта. |
| SCC_E_INVALIDFILEPATH | -24 | Ошибка: недопустимый путь к файлу. |
| SCC_E_PROJNOTOPEN | -25 | Ошибка: проект не открыт. |
| SCC_E_NOTAUTHORIZED | -26 | Ошибка: пользователь не авторизован для выполнения этой операции. |
| SCC_E_FILESYNTAXERR | -27 | Ошибка синтаксиса файла. |
| SCC_E_FILENOTEXIST | -28 | Ошибка, локальный файл не существует. |
| SCC_E_CONNECTIONFAILURE | -29 | Ошибка: произошел сбой подключения. |
| SCC_E_UNKNOWNERROR | –30 | Неизвестная ошибка. |
| SCC_E_BACKGROUNDGETINPROGRESS | -31 | В настоящее время выполняется операция фонового получения. |
Макросы, предоставляемые для быстрой проверки
Комментарии
Все функции подключаемого модуля управления версиями (кроме SccAdd, SccCheckin и SccDiff) должны быть успешными, если локальные файлы, передаваемые в качестве аргументов, не существуют в рабочей папке. Например, интегрированная среда разработки может вызвать SccCheckout или SccUncheckout в файле, который не существует в рабочей папке, но существует в системе управления версиями. Этот вызов будет выполнен успешно. Только в том случае, если в рабочей папке или в системе управления версиями нет файла, ожидается, что функция завершится ошибкой.
Некоторые функции, такие как SccAdd и SccCheckin , в частности, должны возвращать данные SCC_E_FILENOTEXIST , если файл в рабочей папке не существует. Ожидается, что другие функции будут успешными, если рабочий файл не существует, если функции работают с допустимым именем файла в системе управления версиями.
Подключаемый модуль управления версиями не должен делать никаких предположений о привилегиях файла в рабочей папке, даже если подключаемый модуль помечает файл только для чтения во время некоторых операций. Файл в рабочей папке можно перемещать, удалять и изменять вне элемента управления подключаемым модулем.
Источник
The problem is that not all visual studio suggestions, warnings and/or errors are shown on solution build.
Let’s say that on solution build, a total of 22 warnings are shown. After solution build, upon opening .cs files within projects, more warnings are being shown.
Steps:
- Rebuild solution
- Error List shows 0 Errors, 22 Warnings, 0 Suggestions
- Open a .cs file from within a .csproj
- Error List shows 0 Errors, 22+ Warnings, 0+ Suggestions


Why aren’t these errors/warnings/suggestions shown on build, rather than being shown once a corresponding .cs file is opened?
Note — An .editorconfig file is used within the solution. This .editorconfig specifies a set of rules which define when to show Errors, Warnings, and Suggestions within .cs files.
asked Oct 31, 2019 at 13:01
![]()
1
I faced this issue and, for me, what worked was simply following the below steps:
- Analyze -> Run code Analysis -> On Solution

This will give all warnings on solution level.
![]()
Adrian Mole
48.1k140 gold badges49 silver badges78 bronze badges
answered Jun 17, 2021 at 12:49
![]()
In Visual Studio 2022 I missed many warnings too — via Tools > Options, tab Text Editor > C# > Advanced you find these settings:
Run background code analysis for:Show compiler errors and warnings for:
and for both you probably want the option Entire solution (instead of Open documents, Current document or None).

answered Dec 9, 2022 at 10:46
![]()
SymboLinkerSymboLinker
6455 silver badges14 bronze badges
You can enable Source code analysis for a single project through the Project Properties dialog. This will in fact install some NuGet packages into the project, which together will run an analysis on each build of the project.
This is not an exact replica of Intellisense analysis, if only because what it will do depends on the selected Rule Set. For the most part I expect this to be at least as thorough as the Intellisense analysis, and probably even more so.
Here is how to install it, and how to select a Rule Set:

For more info, see
- https://learn.microsoft.com/en-us/visualstudio/code-quality/roslyn-analyzers-overview
- https://azuredevopslabs.com/labs/devopsserver/codeanalysis/
answered Oct 31, 2019 at 15:16
![]()
Peter BPeter B
21.7k5 gold badges31 silver badges68 bronze badges
3
The Visual Studio’s Error List shows errors, warnings, and information messages that describe the issues in an application. If the application includes Reporting, the Error List also shows messages that help users create or enhance a report layout in the Visual Studio Report Designer.
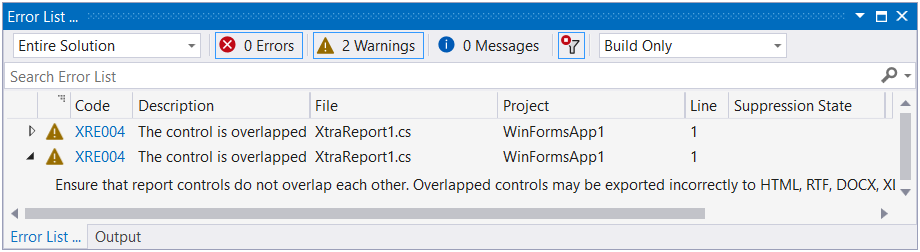
The Error List displays the following messages:
- Layout-related messages (for instance, in cases when report controls overlap each other or extend beyond the report’s printable area).
- Messages about report creation (for instance, notifications about invalid property values or unreachable sources of content).
- Messages that highlight issues in report scripts (for instance, errors in script syntax).
- Messages related to report export (for example, in cases when an error occurs while a report is exported to PDF, XLSX, and other formats).
Invoke the Error List
Do one of the following to invoke the Error List:
-
Select the View | Error List item from Visual Studio’s menu.

-
Press the CTRL+W, E keyboard shortcut.
-
Click the bell icon in the status bar.


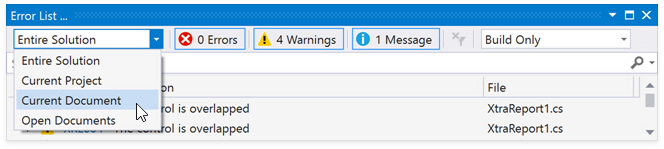
Filter Messages
Open a report in the Visual Studio Report Designer and select Current Document from the drop-down box on the left in the Error List to display only messages related to this report.
See the following topic for the list of messages that can appear in the Error List: Errors, Warnings, and Information Messages.
Introduction
Visual Studio has always been a great IDE for code debugging.It provides a numerous features for debugging and configuring the code.Being a developer we always spend a lot of time spend time in running and debugging the code, therefore improvements to debugging features can have a big impact on our productivity. This article covers the debugging improvements that Visual Studio 2015 has come up with. Following are the few of the major features that will be covered in this article
- Breakpoint configuration improvements
- New improved Error List
- Tool window support for LINQ and lambda expressions
- New PerfTips displaying execution time in the code editor
- New Diagnostic Tools window
Series
- Day #1: Code Assistance in Visual Studio 2015
- Day #2: Code Analyzers in Visual Studio 2015
- Day #3: Renaming Assistance in Visual Studio 2015
- Day #4: Code Refactoring in Visual Studio 2015
- Day #5: Debugging Improvements in Visual Studio 2015 (Breakpoint Configuration and New Error List)
- Day #6: Debugging Improvements in Visual Studio 2015 (Tool Window Support for LINQ and Lambda)
- Day #7: PerfTip in Visual Studio 2015
- Day #8: New Diagnostic Tool Window in Visual Studio 2015
Breakpoint configuration improvements
The earlier versions of Visual Studio already provided the feature of breakpoint configuration , so its not new to developer. The only thing new in Visual Studio 2015 is the user experience and ease of using the configurations. Breakpoint configuration is now more easier to use and reachable. Visual Studio 2015 introduces a new inline toolbar. With this toolbar you can easily open the Breakpoint Configuration Settings or enable/disable the breakpoint. Secondly, the Context menu for break point configuration in Visual Studio 2015 is simplified. The few options of the Context menu have been moved to the Breakpoint Configuration Settings window. The Settings window now comes in a peek window, so you can easily check and change the settings as there will be no modal window. The whole breakpoint configuration is now divided into two parts, Actions and Conditions. Let us understand the topic in detail with practical implementation.I am using Visual Studio 2015 enterprise edition for this article and have added a console application named VS2015ConsoleApplication in my Visual Studio.Let’s say we have a MyProduct class containing product as an entity specific basic operations like fetching the product, returning the list of products as shown below.
1: using System;
2: using System.Collections.Generic;
3: using System.Linq;
4: using System.Text;
5: using System.Threading.Tasks;
6:
7: namespace VS2015ConsoleApplication
8: {
9: public class MyProducts :IProducts
10: {
11: List<Product> _allProduct = new List<Product>();
12: public MyProducts()
13: {
14: _allProduct.Add(new Product {ProductCode="0001",ProductName="IPhone",ProductPrice="60000",ProductType="Phone",ProductDescription="Apple IPhone" } );
15: _allProduct.Add(new Product { ProductCode = "0002", ProductName = "Canvas", ProductPrice = "20000", ProductType = "Phone", ProductDescription = "Micromax phone" });
16: _allProduct.Add(new Product { ProductCode = "0003", ProductName = "IPad", ProductPrice = "30000", ProductType = "Tab", ProductDescription = "Apple IPad" });
17: _allProduct.Add(new Product { ProductCode = "0004", ProductName = "Nexus", ProductPrice = "30000", ProductType = "Phone", ProductDescription = "Google Phone" });
18: _allProduct.Add(new Product { ProductCode = "0005", ProductName = "S6", ProductPrice = "40000", ProductType = "Phone", ProductDescription = "Samsung phone" });
19:
20: }
21:
22: /// <summary>
23: /// FetchProduct having price greater that 3000
24: /// </summary>
25: /// <returns></returns>
26: public List<Product> FetchProduct() => (from p in _allProduct where Convert.ToInt32(p.ProductPrice) > 30000 select p).ToList();
27:
28: /// <summary>
29: /// FetchProduct
30: /// </summary>
31: /// <param name="pCode"></param>
32: /// <returns></returns>
33: public Product FetchProduct(string pCode)
34: {
35: return _allProduct.Find(p => p.ProductCode == pCode);
36: }
37:
38: /// <summary>
39: /// FetchProduct with productCode and productName
40: /// </summary>
41: /// <param name="productCode"></param>
42: /// <param name="productName"></param>
43: /// <returns></returns>
44: public Product FetchProduct(string productCode, string productName)
45: {
46: return _allProduct.Find(p => p.ProductCode == productCode && p.ProductName==productName);
47: }
48:
49: public List<Product> GetProductList()
50: {
51: return _allProduct;
52: }
53: }
54: }
where IProducts is a simple interface.
1: using System;
2: using System.Collections.Generic;
3: using System.Linq;
4: using System.Text;
5: using System.Threading.Tasks;
6:
7: namespace VS2015ConsoleApplication
8: {
9: interface IProducts
10: {
11: Product FetchProduct(string productCode);
12: Product FetchProduct(string productCode,string productName);
13: List<Product> GetProductList();
14: }
15: }
In the following Program class, we are just fetching all the products and creating a new list of products for a new entity named ProductCodeWithPrice, where we list only the product code and price of products.
1: using System;
2: using System.Collections.Generic;
3: using System.Linq;
4: using System.Text;
5: using System.Threading.Tasks;
6:
7: namespace VS2015ConsoleApplication
8: {
9: public class ProductCodeWithPrice
10: {
11: public string ProductCode { get; set; }
12: public string ProductPrice { get; set; }
13:
14: }
15: class Program
16: {
17: static void Main()
18: {
19: var myProducts = new MyProducts();
20: var products = new List<ProductCodeWithPrice>();
21: var allProducts = myProducts.GetProductList();
22: foreach (var product in allProducts )
23: {
24: ProductCodeWithPrice prod = new ProductCodeWithPrice();
25: prod.ProductCode = product.ProductCode;
26: prod.ProductPrice = product.ProductPrice;
27: products.Add(prod);
28: }
29: Console.ReadLine();
30: }
31: }
32: }
Now let us say we are debugging the code while a new product list is created and we want to place a breakpoint after a new ProductCodePrice instance is created in foreach loop.

When a breakpoint is put at line 27, notice the new inline toolbar. From here I can open the Settings or Enable and Disable the breakpoint. When we right click on the breakpoint to open the context menu, we see a new simplified context menu with most of the options that use to be present there now moved to settings option.

Let’s again check the inline toolbar. Let’s pick the Settings option. Notice that the settings now appear in a peek window instead of a modal dialog window. This helps a developer to easily modify the settings while debugging.

Conditions
Let’s try to explore how conditions work. When we place a breakpoint and open the settings window, it shows options for Conditions and Actions and also mentions the location of breakpoint with the details like file name, line number and character position. Clicking on conditions checkbox shows some other options on how a condition can be configured.

The default is Conditional Expression, but there are two other options as well i.e. Hit Count and Filter. Hit Count option is used when there is a need that an execution pause is required at a particular iteration in the loop.
The second drop down list is used to validate the condition. In this case we have placed a breakpoint after prod object is created in each iteration.

Notice that we could pick Is a multiple of, or greater than or equal to to validate the Hit Count.
Let’s suppose there is a scenario where we need to pause the execution and check the products list values after 3 iterations. So we choose Hit Count option as condition and Is equal to option in second dropdown and in the text box near to it, type 3. This means that when the loop will be running third time the execution is paused at line number 27 therefore hitting the breakpoint.Run the application and wait for the breakpoint to get hit.

Notice that the conditions information is live. It shows me the current Hit Count. The application stopped at debug point when the hit count was 3. At this point the count can also be changed, let’s change it to 4, or it could simply be reset, and data tooltips can still be used to view the variables. If we hover over the products list we can see it already has two products (prod) in it, so we must be in the third iteration of the loop because we’re breaking before we’re adding to the list.

One of the interesting feature w.r.t. Visual Studio 2015 break point configuration is that if a breakpoint is accidentally deleted , it could again be applied by using Ctrl+Z.
A breakpoint condition with the Hit Count can be used any time if we need to hit the breakpoint at specific hit count or at some particular interval of hits. This is normally useful while processing lists of items and in recursive methods. Even though the application is still running, another condition can also be selected to be added, let’s add it through the conditional expression. We’ll check this by adding a Conditional Expression here. Let’s say we want the breakpoint to be hit when the product code of prod instance is “0004” . So click on Add condition option while the application is stopped at the breakpoint and add a conditional expression.

You can add multiple conditions and configure your breakpoint for desired debugging to improve productivity.When Add condition option is clicked a new row is added with all available options as shown earlier while applying Hit Count breakpoint. Choose conditional expression option and validate it to be true when prod.ProductCode==”0004”. Notice that you can write any expression in the expression textbox. the expression could be simple or complex with multiple && and || conditions too.Moreover while typing, the intellisense also works and helps to create expressions.

If you want you can delete the prior condition of hit count , else the debug point will be hit multiple times.I am removing the prior condition here. Run the application and you’ll see that the break point is hit when the condition that was mentioned at breakpoint becomes true.

We see here the execution stops as soon as the condition of product code being “0004” is met.
Actions
Let us see how Actions work. By default, when the conditions are true, the debugger will pause at the particular breakpoint. This behavior can also be configured by checking the actions. One can select to log the message, enter the desired message in the Message field provided.

We can also enter desired plain text of our choice and customize the message for better readability and understanding. Dollar ($) can be used to display system values here,When you type dollar in the message field , you get the list of all the pseudo variables that can be used to log the message.

Curly braces {} are used to display the output or variables from the application or code base and you get the intellisense support as well in the message fields. You can log the message in output window. let’s give it a try and try to log something at this breakpoint condition. You also have the option to Continue execution. This option refrains the debugger from pausing each time a breakpoint is hit.This option could be selected if you want to log the message without stopping at the breakpoint.

In actions message field, I am trying to log a message when the condition of prod having product code == “0004” is true. I have configured the message field to log $Function , $TID, $TNAME along with {prod} i.e. product instance and prod.ProductCode. notice that I have also used plain text like “Method : ”, “Product Instance”, “Product Code” to make my message more readable. I have chosen to continue the execution without stopping at breakpoint. Let’s run the application and see what happens.

All the information that we defined in Message field is logged into output window as desired. All the details along with the plain text that I used is logged in the same sequence as defined. You can use the Log a message action anytime when you want to display information each time the breakpoint is hit.
New improved Error List
The new Error List in Visual Studio 2015 is now much more improved where you can get your live list of compiler and code analysis errors and warnings. The major improvements in the Error List include display of the error code, linked to a document on that issue. You can click that link to view the document online. Filtering has been expanded much more. One can still filter on current project or document, but now filtering can also be done on error severity, the error code, a set of projects or on a set of files.

The maximum error limit in Visual Studio 2015 has also been removed. Earlier there was no way to really tell how many errors we had in one go when the error number was too high. Each time we fix certain numbers of errors, we were shown more errors on compilation Now, all of your errors and warnings will appear in the Error List in one go.Let’s practically try to see the error list improvements. I have intentionally made few changes in the Main method of program.cs class to get some errors and warnings. I have removed var from products declaration, added an empty catch block with an empty finally block. Before compiling the code, I have also enabled the Enable Code Analysis on Build option. You can find this option by right clicking on your project, open properties and in properties window select Code Analysis option , normally appears at last as shown in the image.

Now when we compile that code we get few errors and warning as expected.

we see here that we get errors and warnings from the compiler and as well from the code analyzer. CS as a prefix to the error/warning code represents that it is through compiler and CC represents code analyzers here. We got all the expected warnings and errors. Notice that errors and warnings have their respective symbols. The tabs at the top shows 2 Errors, 5 Warnings and 1 Message. You can choose these options to filter and see what you need. Let’s say you don’t want to see Warnings and Messages, then you can click on the respective tabs above to see only Error list. Notice that every error code is in the form of a link when you click on any error code, it redirects you to its documentation page.Let’s click on CS 0103 i.e. the first error saying “The name ‘products’ does not exist in the current context”.

We see that the ink has redirected to MSDN link having detailed document of that error.
Filtering has been expanded more to filter on errors. warning and severity as well. To check that just click on top of the columns of error list where the error/warning symbol is displayed.

As soon as you click on the top as shown in the above image, the filter option will appear there itself and you can click that filter icon to see the types of more available filters.

You can choose to filter the list based on your selection by checking or un checking the check box. Filter option is widely available for code as well as for Projects. You can particularly select which code to include as shown below in the image,

Or which project or files to select as a filter.

So you can see that filtering option has been expanded to take care of multiple options there fore improving control, configurations and productivity of a developer.
Conclusion
In this article we covered the new improved debugging techniques that Visual Studio 2015 has come up with. We covered the break point configurations with several practical scenarios and sneak peeked in new improved Error list. These options can also be found in prior versions of Visual Studio, but VS 2015 has an improved and more discoverable version of them.In the next article we’ll cover the remaining two debugging options that are PerfTips and new diagnostic tool window.