Apache – the technology that powers the web. I’m not sure if that is correct, but I think that we wouldn’t see the world wide web in its current shape without it. Launched in 1995 and since April 1996, it has been the most popular web server around the world.
Because of handling your users’ requests, Apache serves as the front application. It is crucial to understand what your server is doing, what file users are accessing, from where they came, and much, much more.
The visibility that Apache logs give you is invaluable in understanding the traffic coming to your application, the errors that happen, and the performance of the user-facing elements. Today, we will look into what the Apache web server logs are, how to interpret them, and how to analyze them easily.
What Are Apache Logs?
Apache logs are text files that contain all the information on what the Apache server is doing. They provide insight into which resources were accessed, when they were accessed, who accessed them, and metrics related to that. They also include information about the errors that happened, resource mapping process, the final resolution of the connection, and many, many more.
In general, the whole Apache logging process comes in multiple phases. First, you need to store the logs somewhere for historical analytical purposes. Second, you need to analyze the logs and parse them to retrieve useful information and metrics. And finally, you may want to graph the data as the visual representation is easier to analyze and understand for a human person.
What Is the Apache Access Log?
The Apache access logs are text files that include information about all the requests processed by the Apache server. You can expect to find information like the time of the request, the requested resource, the response code, time it took to respond, and the IP address used to request the data.
Apache Access Logs Location
The location of the Apache server access log differs depending on the operating system that you are using.
- On Red Hat, CentOS, or Fedora Linux, the access logs can be found in the
/var/log/httpd/access_logby default. - On Debian and Ubuntu, you can expect to find the Apache logs in the
/var/log/apache2/access.logand - FreeBSD will have the Apache server access logs stored in
/var/log/httpd-access.logfile.
You can configure its location using the CustomLog directive, for example:
CustomLog "/var/log/httpd-access.log"
Apache Access Log Format Configuration
Before we learn about the different log formats, let’s discuss what the Apache HTTP can do when it comes to formatting. There are two most common access log types that you can use and that the Apache server will translate to meaningful information:
- Common Log Format
- Combined Log Format
The log formatting directives are used in combination with the LogFormat option:
LogFormat "%t %h %m "%r"" custom
The above line tells that the “%t %h %m ”%r”” format should be used and assigned to an alias called custom. After that, we can use the custom alias when defining Apache logging. For example:
CustomLog "logs/my_custom_log" custom
The above section will tell Apache to write logs in the logs/my_custom_log file with the format defined by the custom alias. The above configuration will result in logging:
- time of the request thanks to the %t directive,
- remote hostname thanks to the %h directive,
- HTTP method thanks to the %m directive,
- the first line of the request surrounded by double quotes thanks to the %r directive.
Of course, there are way more directives that can be used and the complete list can be found in the mod_log_config documentation of the Apache server.
Common Log Format
The Apache Common Log Format is one of the two most common log formats used by HTTP servers. You can expect it to see its definition to look similar to the following line:
LogFormat "%h %l %u %t "%r" %>s %b" common
Here’s how an access log from that log file looks like:
10.1.2.3 - rehg [10/Nov/2021:19:22:12 -0000] "GET /sematext.png HTTP/1.1" 200 3423
As you can see the following elements are present:
- %h, resolved into 10.1.2.3 – the IP address of the remote host that made the request.
- %l, remote log name provided by identd, in our case a hyphen is provided, which is a value that we can expect to be logged in a case when the information provided by the logging directive is not found or can’t be accessed.
- %u, resolved into rehg, the user identifier determined by the HTTP authentication.
- %t, the date and time of the request with the time zone, in the above case it is [10/Nov/2021:19:22:12 -0000]
- ”%r”, the first line of the request inside double quotes, in the above case it is: “GET /sematext.png HTTP/1.1”
- %>s, the status code reported to the client. This information is crucial because it determines whether the request was successful or not.
- %b, the size of the object sent to the client, in our case the object was the sematext.png file and its size was 3423 bytes.
Combined Log Format
The Apache Combined Log Format is another format often used with access logs. It’s very similar to the Common Log Format but includes two additional headers – the referrer and the user agent. Its definition looks as follows:
LogFormat "%h %l %u %t "%r" %>s %b "%{Referer}i" "%{User-agent}i"" combined
And the example log line produced by the above log line looks like this:
10.1.2.3 - grah [12/Nov/2021:14:25:32 -0000] "GET /sematext.png HTTP/1.1" 200 3423 "http://www.sematext.com/index.html" "Mozilla/5.0 (Windows NT 10.0; Win64; x64) AppleWebKit/537.36 (KHTML, like Gecko) Chrome/79.0.3945.74 Safari/537.36 Edg/79.0.309.43"
Custom Log Format
There is one more thing that we should discuss when it comes to Apache Server logging configuration – the CustomLog directive. We’ve already seen that configuration directive, but let’s discuss that in greater details.
Multiple Access Logs
It is possible to have multiple Apache access logs at the same time without any additional effort. We may want a limited set of information available in some files for quick scanning and the full log using the Combined Log Format if we need the complete information. For example, we could have three access log files – one that includes time, user agent, and the status code, the second that includes the time, IP address, and referrer used, and the third – the Common Log Format.
To do that we need to include multiple CustomLog sections in our configuration file:
LogFormat "%h %l %u %t "%r" %>s %b" common
CustomLog logs/agent_log "%t %{User-agent}i %>s"
CustomLog logs/referer_log "%t %h %{Referer}i"
CustomLog logs/access_log common
You can see that this time we didn’t use three separate LogFormat configuration options, but we’ve specified the apache log format in the CustomLog format line. This is also possible and very convenient when the formatting of the log lines is used only in that given file.
Conditional Logs
There are cases when you would like to write logs only when a certain condition is met. This is what Apache Server calls conditional logging. It is done by using the CustomLog directive and environment variables. For example, if you would like to log all requests accessing your PNG files in a separate file you can do that the following way:
SetEnvIf Request_URI .png$ png-image-log
CustomLog "png-access.log" common env=png-image-log
Logs Rotation and Piped Logs
Depending on the logging configuration and the traffic that your Apache servers are handling, logging can be extensive. All the logs that you keep on the machine take space and if you are not using a log centralization solution like Sematext Logs, you will have to deal with space and management of logs.
Let’s talk about log rotation first. Log rotation is a process of creating a new log file that the Apache HTTP server will start writing to and renaming the old log file, so it is no longer updated. The log rotation happens when you gracefully restart the server. That means that without any kind of client requests processing interruption a new log file is created. In production environments, you would like to restart the Apache servers though.
That’s why the Apache server supports piped logs. Instead of writing the log events to a file, you use the piped logs to send the log events to a different application that will handle the log processing – for example to rotatelogs:
CustomLog "|/usr/local/apache/bin/rotatelogs /var/log/access.log 86400" common
The rotatelogs application comes with Apache server and is capable of rotating logs without the need of restarting the server. The above example will result in rotating the /var/log/access.log file every 24 hours.
How to Read Apache Access Logs
Apache server access logs are just simple text files. They can be easily opened by any tool that can read such files. On Linux-based systems, this can be the cat command-line tool or tail if you want to monitor the log lines as they go.
There are two caveats, though. The first is access policies. You may not have access to the machines running Apache HTTP server and even if you do, you may not have read access to the appropriate log directories. The second is distribution. It is not uncommon to have multiple Apache servers distributed across multiple data centers. In such a case, it is way easier to use a dedicated observability tool such as Sematext Logs that will provide not only the option to look into the raw files but also aggregated information into the key metrics derived for them.
Understanding Apache Access Logs
Our Apache access logs files are easy to read and not hard to understand either. Just remember about the patterns that you’ve used in your configuration. We’ve already covered the common patterns that you can encounter in the Apache log files. Keep in mind that understanding the log files is even easier with log analysis tools that do the parsing for you and give you an aggregated view of the data which is easier to understand.
What Is the Apache Error Log?
So far, we’ve talked about the Apache access log that gives us information on the accessed resources. But it is not the only thing that we should be interested in. We should also care about everything related to errors. In fact, the error log is the most important log file for the Apache HTTP server.
The Apache error log is where all the errors that happened during the processing of the requests. The most important thing, though, is that the error log will contain information on what went wrong during the Apache server startup and it is very likely that it will also contain hints on how to fix the issue.
Apache Errors Logs Location
Where the Apache error log is stored differs depending on the operating system on which it is running.
- On Red Hat, CentOS, or Fedora Linux, the access logs can be found in the
/var/log/httpd/error_logby default. - On Debian and Ubuntu, you can expect to find the Apache logs in the
/var/log/apache2/error.log - FreeBSD will have the Apache server access logs in
/var/log/httpd-error.logfile.
You can configure its location using the ErrorLog directive, for example:
ErrorLog "/var/log/httpd-error.log"
Apache Error Log Format Configuration
Similar to the Apache access log, you can adjust the format of the error log. The Apache error log format is configured by using the ErrorLogFormat element, for example:
ErrorLogFormat “[%{u}t] [%-m:%l] [pid %P:tid %T] [client %a] %M”
The above configuration would produce an Apache error log entry similar to the following one:
[Wed Nov 10 10:21:23.811033 2021] [core:error] [pid 22308:tid 3212342123] [client 10.1.2.3] File does not exist: /usr/local/apache2/htdocs/favicon.ico
In the above example the following formatting options were used:
- %{u}t – the current time including microseconds,
- %-m – the module that produced the error,
- %l – the level of the log event,
- %P – process identifier,
- %T – thread identifier,
- %M – the actual log message.
The full description of the available formatting options is available in the official Apache Server documentation.
Log Levels
In addition to what we discussed so far there is one other thing worth mentioning – the level of log events. The LogLevel directive allows specifying the level of log messages on a per-module basis. For example, if we would like the main log level for all events to be set to the info level but have the error level only for the rewrite module, we could have a configuration directive as follows:
LogLevel info rewrite:error
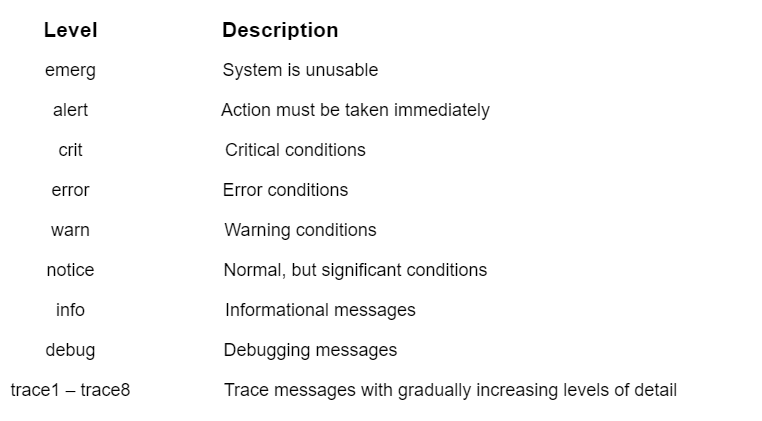
The following logging levels are described in Apache server documentation:
- emerg
- alert
- crit
- error
- warn
- notice
- info
- debug
- trace1 – trace8
The emerg one is the log event that says that the system is unstable and the trace levels are used for very low-level information logging that you can probably skip.
How to View Apache Error Logs
Viewing the Apache server error logs is just as simple as opening the text file. The error logs are not different from the access logs, so they are just simple text files. You can use whatever tools you want to look into them. But keep in mind that looking into logs from multiple Apache servers distributed across multiple data centers can be challenging. That’s why we strongly suggest using log aggregation tools, such as Sematext Logs, for that job.
Apache Log File Management and Analysis with Sematext
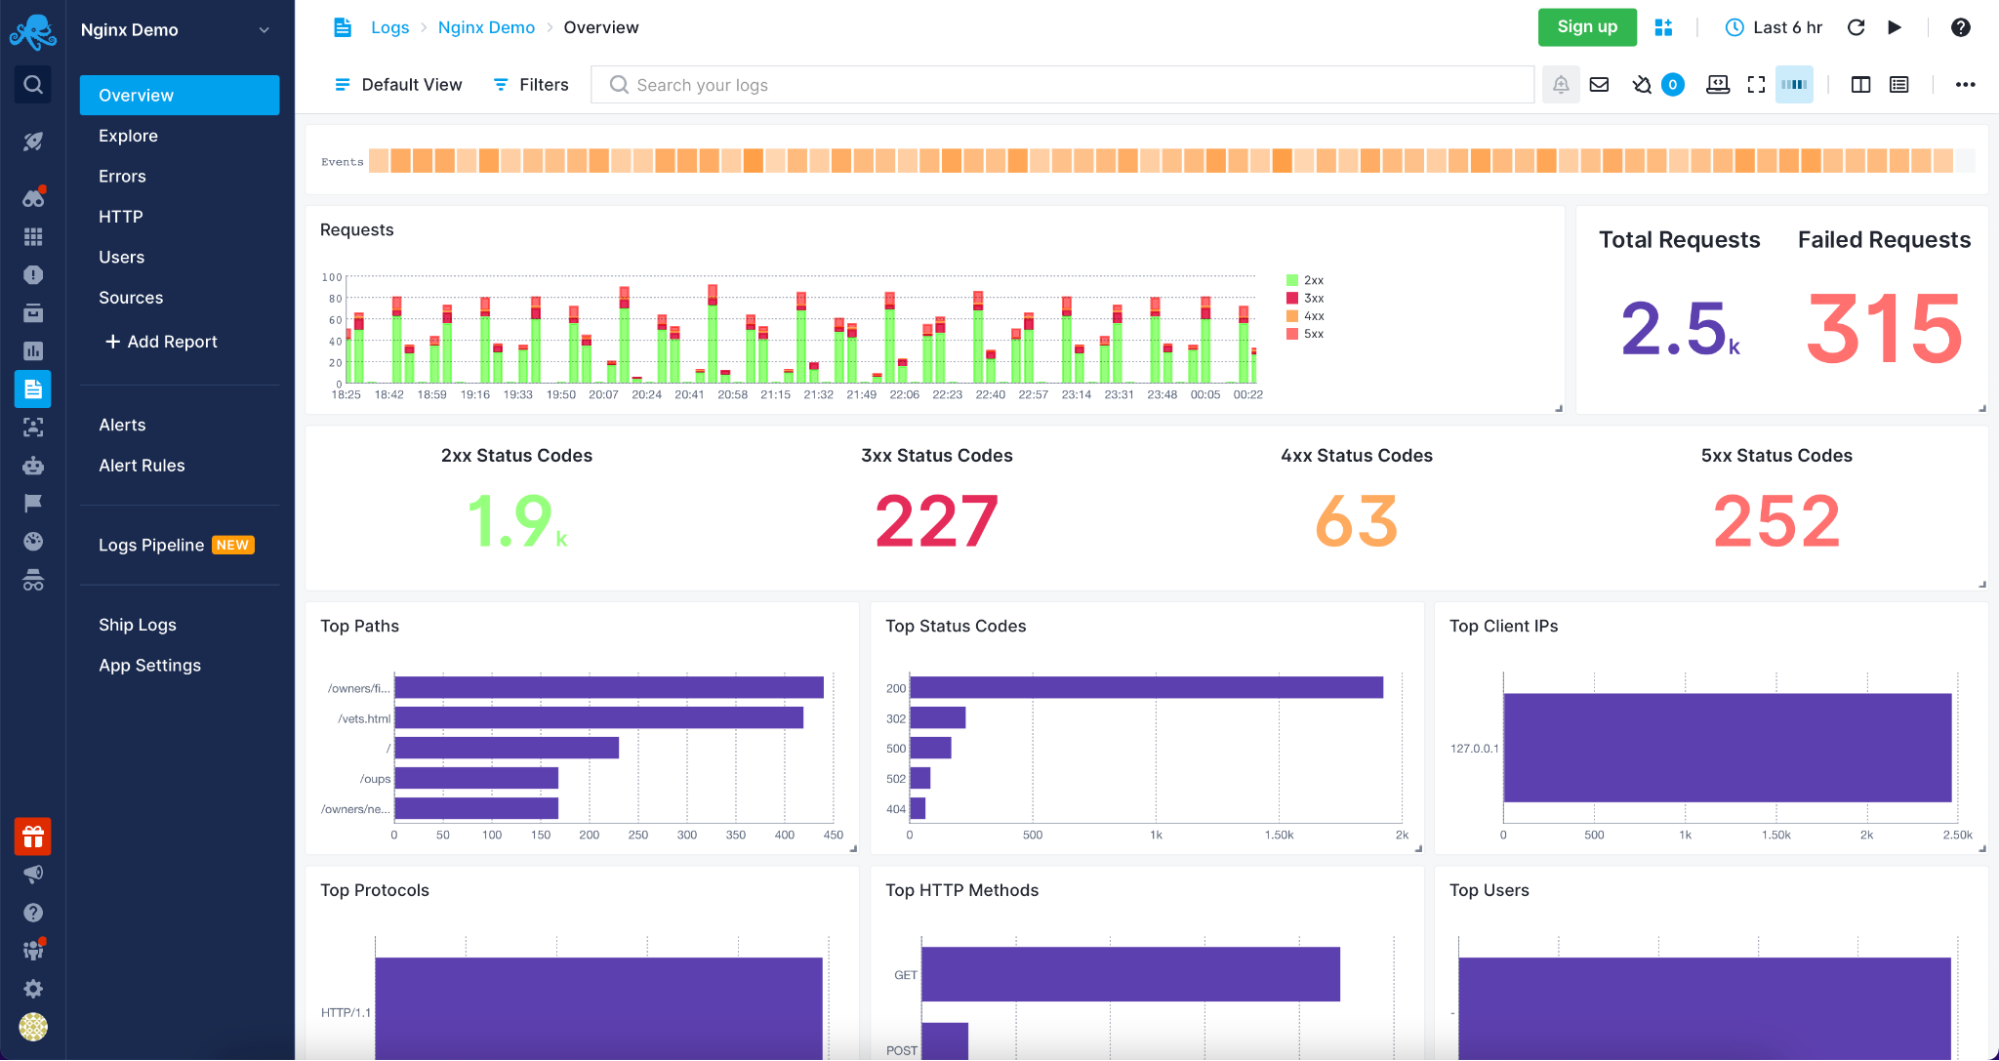
Sematext Cloud Logs – Apache Overview
Understanding and analyzing your Apache servers logs was never easier than with Sematext Logs. The only thing that you need to do is create an account with Sematext, create the Apache Logs App and install the Sematext Agent. You will be guided through the process of setting up the automatic Logs Discovery for your Logs. Your logs will be parsed and sent to the Sematext Logs giving you access to a variety of pre-built reports tailored for your Apache HTTP server.
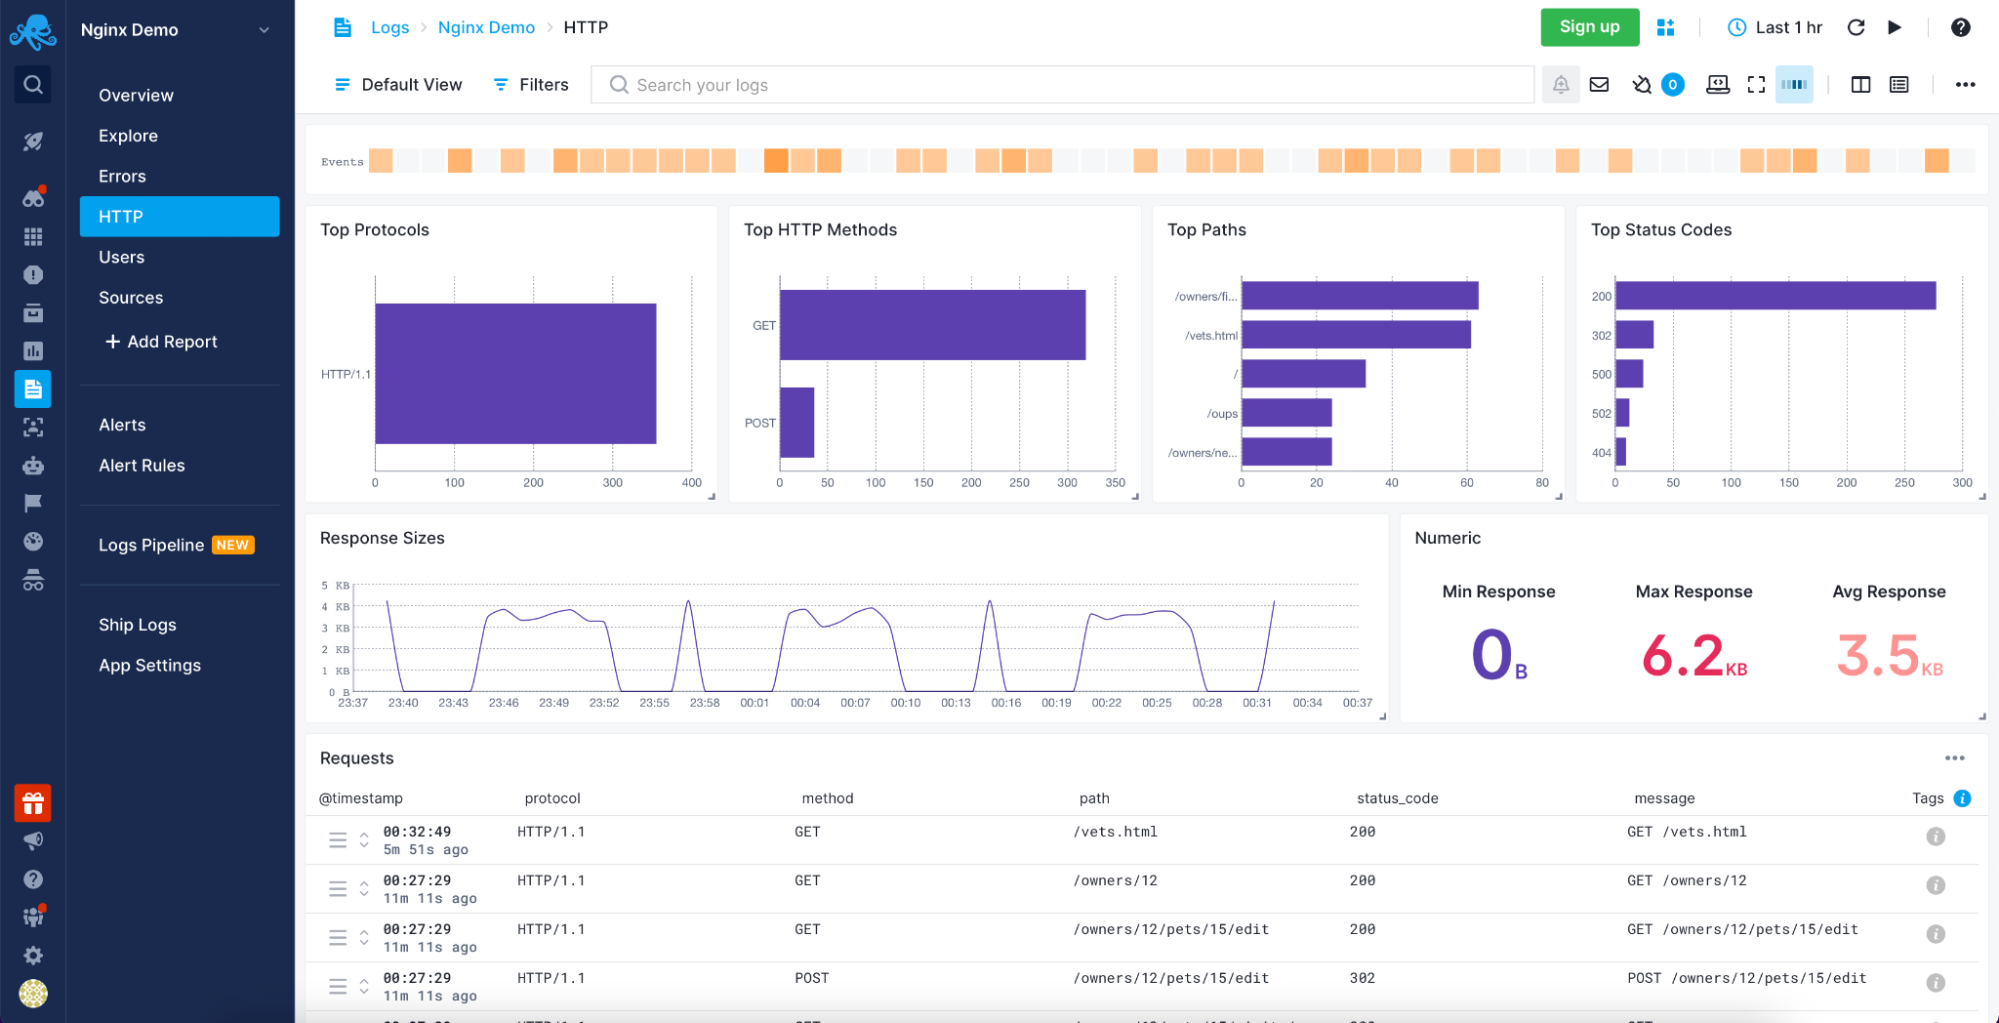
Sematext Logs – Apache HTTP Information
Sematext Logs is part of the Sematext Cloud full-stack monitoring solution providing you with all you need when it comes to observability. With Sematext Cloud, you get an overview of your Apache servers, errors report, HTTP report, including top HTTP methods and paths with an average response size visualization and requests table. You can see your users with the top User Agents used to access resources served by your Apache servers and, finally, the sources for the data. All within a single Apache Logs monitoring in Sematext Cloud.
Still not sure which open-source search engine to use? Check out this quick video comparing Apache Solr and Elasticsearch below:
Conclusion
Analyzing your Apache servers logs is invaluable in understanding the traffic coming to your application, the errors that happen, and the performance of the user-facing elements. A log management tool such as Sematext Logs does this job for you.
More than understanding server logs, knowing what resources were accessed, who accessed them, and how long it took to process the request is crucial to understanding your user’s behavior. You also need to be sure that you are aware of every error that happens so that you can react as soon as possible. Combining that with the need for distributed infrastructures to handle a large number of concurrent users and provide high availability, using an observability tool is a necessity.
Having Apache metrics and logs in the same place, being able to slice and dice them, being alerted when issues appear and having insight into every piece of your environment is no longer something good to have but need to have. All of that and more is provided by Sematext Cloud, an observability platform with dedicated Apache server logs and metrics support. Built with simplicity in mind and requiring no credit card, nothing stops you from giving it a try to see how it can improve your log management and log analysis processes.
At the time of writing, the Apache HTTP server is
used by 30.8% of all web
servers in operation. If you’re responsible for managing any system that
utilizes Apache, then you will surely interact with its logging infrastructure
on a regular basis. This tutorial will introduce you to logging in Apache and
how it can help you diagnose, troubleshoot, and quickly resolve any problem you
may encounter on your server.
You will learn where logs are stored, how to access them, and how to customize
the log output and location to fit your needs. You will also learn how to
centralize Apache logs in a log management system for easier tracing, searching,
and filtering of logs across your entire stack.
🔭 Want to centralize and monitor your Apache logs?
Head over to Logtail and start ingesting your logs in 5 minutes.
Prerequisites
To follow through with this tutorial, you should set up a Linux server that
includes a non-root user with sudo privileges. Additionally, you also need the
Apache HTTP server installed and enabled on the server, which can be done by
executing the relevant commands below.
On Debian-based distributions like Ubuntu:
sudo systemctl enable apache2
sudo systemctl start apache2
On RHEL, Fedora or CentOS:
sudo systemctl enable httpd
sudo systemctl start httpd
Please note that the rest of the commands, directory configurations, and
conventions used in this tutorial pertain to Debian-based distributions like
Ubuntu. Still, the concepts remain the same for other distributions.
Step 1 — Getting started with Apache logging
Apache logs are files that record everything the Apache web server is doing for
later analysis by the server administrator. The records of all Apache events are
placed in two different text files:
- Access Log: this file stores information about incoming requests. You’ll
find details about each request such as the requested resource, response
codes, time taken to generate the response, IP address of the client, and
more. - Error Log: this file contains diagnostic information about any errors were
encountered while processing requests.
Step 2 — Locating the Apache log files
The log files’ location depends on the operating system the Apache web server is
running. On Debian-based operating systems like Ubuntu, the access log file is
located in /var/log/apache2/access.log. On CentOS, RHEL, or Fedora, the access
log file is stored in /var/log/httpd/access_log.
A typical access log entry might look like this:
Output
::1 - - [13/Nov/2020:11:32:22 +0100] "GET / HTTP/1.1" 200 327 "-" "Mozilla/5.0 (Windows NT 10.0; Win64; x64) AppleWebKit/537.36 (KHTML, like Gecko) Chrome/86.0.4240.198 Safari/537.36"
Similarly, the error log file is located in /var/log/apache2/error.log on
Debian-based systems and /var/log/httpd/error_log on CentOS, RHEL, or Fedora.
A typical error log entry might look like this:
Output
[Thu May 06 12:03:28.470305 2021] [php7:error] [pid 731] [client ::1:51092] script '/var/www/html/missing.php' not found or unable to stat
In the next section, we’ll discuss how to view these log files from the command
line.
Step 3 — Viewing Apache Log files
One of the most common ways to view an Apache log file is through the tail
command which prints the last 10 lines from a file. When the -f option is
supplied, the command will watch the file and output its contents in real-time.
sudo tail -f /var/log/apache2/access.log
You should observe the following output on the screen:
Output
. . .

198.54.132.137 - - [04/Feb/2022:11:34:04 +0000] "GET / HTTP/1.1" 200 3477 "-" "Mozilla/5.0 (Windows NT 10.0; Win64; x64) AppleWebKit/537.36 (KHTML, like Gecko) Chrome/97.0.4692.99 Safari/537.36"
198.54.132.137 - - [04/Feb/2022:11:34:04 +0000] "GET / HTTP/1.1" 200 3477 "-" "Mozilla/5.0 (Windows NT 10.0; Win64; x64) AppleWebKit/537.36 (KHTML, like Gecko) Chrome/97.0.4692.99 Safari/537.36"
198.54.132.137 - - [04/Feb/2022:11:34:04 +0000] "GET / HTTP/1.1" 200 3477 "-" "Mozilla/5.0 (Windows NT 10.0; Win64; x64) AppleWebKit/537.36 (KHTML, like Gecko) Chrome/97.0.4692.99 Safari/537.36"
198.54.132.137 - - [04/Feb/2022:11:34:05 +0000] "GET / HTTP/1.1" 200 3476 "-" "Mozilla/5.0 (Windows NT 10.0; Win64; x64) AppleWebKit/537.36 (KHTML, like Gecko) Chrome/97.0.4692.99 Safari/537.36"
198.54.132.137 - - [04/Feb/2022:11:34:06 +0000] "GET / HTTP/1.1" 200 3476 "-" "Mozilla/5.0 (Windows NT 10.0; Win64; x64) AppleWebKit/537.36 (KHTML, like Gecko) Chrome/97.0.4692.99 Safari/537.36"
198.54.132.137 - - [04/Feb/2022:11:34:06 +0000] "GET / HTTP/1.1" 200 3476 "-" "Mozilla/5.0 (Windows NT 10.0; Win64; x64) AppleWebKit/537.36 (KHTML, like Gecko) Chrome/97.0.4692.99 Safari/537.36"
198.54.132.137 - - [04/Feb/2022:11:34:07 +0000] "GET / HTTP/1.1" 200 3476 "-" "Mozilla/5.0 (Windows NT 10.0; Win64; x64) AppleWebKit/537.36 (KHTML, like Gecko) Chrome/97.0.4692.99 Safari/537.36"
198.54.132.137 - - [04/Feb/2022:11:34:07 +0000] "GET / HTTP/1.1" 200 3476 "-" "Mozilla/5.0 (Windows NT 10.0; Win64; x64) AppleWebKit/537.36 (KHTML, like Gecko) Chrome/97.0.4692.99 Safari/537.36"
To view the entire contents of the file, you can use the cat command or open
the file in a text editor like nano or vim:
cat /var/log/apache2/access.log
You may also want to filter the log entries in the log file by a specific term.
In such cases, you should use the grep command. The first argument to grep
is the term you want to search for, while the second is the log file that will
be searched. In example below, we are filtering all the lines that contain the
word GET:
sudo grep GET /var/log/apache2/access.log
This should present the following output:
Output
. . .

198.54.132.137 - - [04/Feb/2022:11:34:04 +0000] "GET / HTTP/1.1" 200 3477 "-" "Mozilla/5.0 (Windows NT 10.0; Win64; x64) AppleWebKit/537.36 (KHTML, like Gecko) Chrome/97.0.4692.99 Safari/537.36"
198.54.132.137 - - [04/Feb/2022:11:34:04 +0000] "GET / HTTP/1.1" 200 3477 "-" "Mozilla/5.0 (Windows NT 10.0; Win64; x64) AppleWebKit/537.36 (KHTML, like Gecko) Chrome/97.0.4692.99 Safari/537.36"
198.54.132.137 - - [04/Feb/2022:11:34:05 +0000] "GET / HTTP/1.1" 200 3476 "-" "Mozilla/5.0 (Windows NT 10.0; Win64; x64) AppleWebKit/537.36 (KHTML, like Gecko) Chrome/97.0.4692.99 Safari/537.36"
198.54.132.137 - - [04/Feb/2022:11:34:06 +0000] "GET / HTTP/1.1" 200 3476 "-" "Mozilla/5.0 (Windows NT 10.0; Win64; x64) AppleWebKit/537.36 (KHTML, like Gecko) Chrome/97.0.4692.99 Safari/537.36"
198.54.132.137 - - [04/Feb/2022:11:34:06 +0000] "GET / HTTP/1.1" 200 3476 "-" "Mozilla/5.0 (Windows NT 10.0; Win64; x64) AppleWebKit/537.36 (KHTML, like Gecko) Chrome/97.0.4692.99 Safari/537.36"
198.54.132.137 - - [04/Feb/2022:11:34:07 +0000] "GET / HTTP/1.1" 200 3476 "-" "Mozilla/5.0 (Windows NT 10.0; Win64; x64) AppleWebKit/537.36 (KHTML, like Gecko) Chrome/97.0.4692.99 Safari/537.36"
198.54.132.137 - - [04/Feb/2022:11:34:07 +0000] "GET / HTTP/1.1" 200 3476 "-" "Mozilla/5.0 (Windows NT 10.0; Win64; x64) AppleWebKit/537.36 (KHTML, like Gecko) Chrome/97.0.4692.99 Safari/537.36"
Step 4 — Examining Apache access log formats
The access log records all requests that are processed by the server. You can
see what resources are being requested, the status of each request, and how long
it took to process their response. In this section, we’ll dive deeper into how
to customize the information that is displayed in this file.
Before you can derive value from reading a log file, you need to understand the
format that is being used for each of its entries. The CustomLog directive is
what controls the location and format of the Apache access log file. This
directive can be placed in the server configuration file
(/etc/apache2/apache2.conf) or in your virtual host entry. Note that defining
the same CustomLog directive in both files may cause problems.
Let’s look at the common formats used in Apache access logs and what they mean.
Common Log Format
The Common Log Format
is the standardized access log format format used by many web servers because it
is easy to read and understand. It is defined in the /etc/apache2/apache2.conf
configuration file through the LogFormat directive.
When you run the command below:
sudo grep common /etc/apache2/apache2.conf
You will observe the following output:
Output
LogFormat "%h %l %u %t "%r" %>s %O" common
The line above defines the nickname common and associates it with a particular
log format string. A log entry produced by this format will look like this:
Output
127.0.0.1 alice Alice [06/May/2021:11:26:42 +0200] "GET / HTTP/1.1" 200 3477
Here’s an explanation of the information contained in the log message above:
%h->127.0.0.1: the hostname or IP address of the client that made the
request.%l->alice: remote log name (name used to log in a user). A placeholder
value (-) will be used if it is not set.%u->Alice: remote username (username of logged-in user). A placeholder
value (-) will be used if it is not set.%t->[06/May/2021:11:26:42 +0200]: the day and time of the request."%r"->"GET / HTTP/1.1"— the request method, route, and protocol.%>s->200— the response code.%O->3477— the size of the response in bytes.
Combined Log Format
The Combined Log Format
is very similar to the Common log format but contains few extra pieces of
information.
It’s also defined in the /etc/apache2/apache2.conf configuration file:
sudo grep -w combined /etc/apache2/apache2.conf
You will observe the following output:
Output
LogFormat "%h %l %u %t "%r" %>s %O "%{Referer}i" "%{User-Agent}i"" combined
Notice that it is exactly the same as the Common Log Format, with the addition
of two extra fields. Entries produced in this format will look like this:
Output
127.0.0.1 alice Alice [06/May/2021:11:18:36 +0200] "GET / HTTP/1.1" 200 3477 "-" "Mozilla/5.0 (Windows NT 10.0; Win64; x64) AppleWebKit/537.36 (KHTML, like Gecko) Chrome/90.0.4430.93 Safari/537.36"
Here’s an explanation of the two additional fields that are not present in the
Common log format:
"%{Referer}i"->"-": the URL of the referrer (if available, otherwise
-is used)."%{User-Agent}i"->
"Mozilla/5.0 (Windows NT 10.0; Win64; x64) AppleWebKit/537.36 (KHTML, like Gecko) Chrome/90.0.4430.93 Safari/537.36":
detailed information about the user agent of the client that made the request.
Step 5 — Creating a custom log format
You can define a custom log format in the /etc/apache2/apache2.conf file by
using the LogFormat directive followed by the actual format of the output and
a nickname that will be used as an identifier for the format. After defining the
custom format, you’ll pass its nickname to the CustomLog directive and restart
the apache2 service.
In this example, we will create a log format named custom that looks like
this:
Output
LogFormat "%t %H %m %U %q %I %>s %O %{ms}T" custom
Open your /etc/apache2/apache2.conf file and place the line above below the
other LogFormat lines. It will produce access log entries with the following
details:
%t: date and time of the request.%H: the request protocol.%m: the request method.%U: the URL path requested.%q: query parameters (if any).%I: total bytes received including the request headers.%>s: final HTTP status code.%O: number of bytes sent in the response.%{ms}T: time taken to generate the response in milliseconds.
You can find all other formatting options and their description on
this page.
To enable the custom format for subsequent access log entries, you must change
the value of the CustomLog directive in your virtual hosts file and restart
the apache2 service with Systemctl.
Open up the default virtual hosts file using the command below:
sudo nano /etc/apache2/sites-available/000-default.conf
Find the following line:
Output
CustomLog ${APACHE_LOG_DIR}/access.log combined
And change it to:
Output
CustomLog ${APACHE_LOG_DIR}/access.log combined
Save the file by pressing Ctrl-O then Ctrl-X, then restart the apache2
service using the command below:
sudo systemctl restart apache2
Afterward, make the following request to your server using curl:
curl --head 'http://<your_server_ip>?name=john&age=30'
You should observe the following response:
Output
HTTP/1.1 200 OK
Date: Mon, 07 Feb 2022 14:21:45 GMT
Server: Apache/2.4.41 (Ubuntu)
Last-Modified: Mon, 07 Feb 2022 12:57:29 GMT
ETag: "2aa6-5d76d24a738bc"
Accept-Ranges: bytes
Content-Length: 10918
Vary: Accept-Encoding
Content-Type: text/html
Go ahead and view the last 10 messages in the access log file:
sudo tail /var/log/apache2/access.log
The log entry that describes the request will look like this:
Output
[07/Feb/2022:14:21:45 +0000] HTTP/1.1 HEAD /index.html ?name=john&age=30 96 200 255 0
It’s also possible to create multiple access log files by specifying the
CustomLog directive more than once. In the example below, the first line logs
into a custom.log file using the custom log format, while the second uses
the common format to write entries into access.log. Similarly, the
combined.log file contains messages formatted according to the combined log
format.
Output
CustomLog ${APACHE_LOG_DIR}/custom.log custom
CustomLog ${APACHE_LOG_DIR}/access.log common
CustomLog ${APACHE_LOG_DIR}/combined.log combined
Step 6 — Formatting your logs as JSON
Although many log management systems support the default Apache logging formats,
it might be best to log in a structured format like JSON since that’s the go-to
format for structured logging in the industry and it is universally supported.
Here’s a conversion of our custom log format into JSON:
Output
LogFormat "{ "timestamp":"%t", "protocol":"%H", "method":"%m", "request":"%U", "query":"%q", "request_size_in_bytes":"%I", "status_code":"%>s", "response_size_in_bytes":"%O", "time_taken_ms":"%{ms}T" }" json
This produces log entries with the following formatting:
Output
{
  "timestamp": "[07/Feb/2022:15:09:02 +0000]",
  "protocol": "HTTP/1.1",
  "method": "HEAD",
  "request": "/index.html",
  "query": "?name=john&age=30",
  "request_size_in_bytes": "96",
  "status_code": "200",
  "response_size_in_bytes": "255",
  "time_taken_ms": "0"
}
Step 7 — Configuring Apache error logs
The server error log contains information about any errors that the web server
encountered while processing incoming requests as well as other diagnostic
information. You can choose where the error messages will be transported to
using the ErrorLog directive in your virtual host configuration file. This
transport is usually a log file on the filesystem.
Here is an example from default virtual host configuration file
/etc/apache2/sites-available/000-default.conf:
Output
ErrorLog ${APACHE_LOG_DIR}/error.log
On Debian-based distributions, the default error log is in the
/var/log/apache2/error.log file, while in Fedora/CentOS/RHEL, it placed in the
/var/log/httpd/error_log file. If the path argument to ErrorLog is not
absolute, then it is assumed to be relative to the
ServerRoot.
A common practice is to monitor the error log continuously for any problems
during development or testing. This is easily achieved through the tail
command:
sudo tail -f /var/log/apache2/error.log
You will observe the following output:
Output
[Mon Feb 07 13:03:43.445444 2022] [core:notice] [pid 10469:tid 140561300880448] AH00094: Command line: '/usr/sbin/apache2'
[Mon Feb 07 13:07:31.528850 2022] [mpm_event:notice] [pid 10469:tid 140561300880448] AH00491: caught SIGTERM, shutting down
[Mon Feb 07 13:07:31.626878 2022] [mpm_event:notice] [pid 10864:tid 140224997284928] AH00489: Apache/2.4.41 (Ubuntu) configured -- resuming normal operations
[Mon Feb 07 13:07:31.626980 2022] [core:notice] [pid 10864:tid 140224997284928] AH00094: Command line: '/usr/sbin/apache2'
[Mon Feb 07 13:13:25.966501 2022] [mpm_event:notice] [pid 10864:tid 140224997284928] AH00491: caught SIGTERM, shutting down
[Mon Feb 07 13:13:26.049222 2022] [mpm_event:notice] [pid 11268:tid 139760377875520] AH00489: Apache/2.4.41 (Ubuntu) configured -- resuming normal operations
[Mon Feb 07 13:13:26.049318 2022] [core:notice] [pid 11268:tid 139760377875520] AH00094: Command line: '/usr/sbin/apache2'
[Mon Feb 07 15:08:50.856388 2022] [mpm_event:notice] [pid 11268:tid 139760377875520] AH00491: caught SIGTERM, shutting down
[Mon Feb 07 15:08:50.940561 2022] [mpm_event:notice] [pid 12096:tid 140473452194880] AH00489: Apache/2.4.41 (Ubuntu) configured -- resuming normal operations
[Mon Feb 07 15:08:50.940669 2022] [core:notice] [pid 12096:tid 140473452194880] AH00094: Command line: '/usr/sbin/apache2'
Aside from logging directly to a file, you can also forward your logs to a
Syslog. You can do this by
specifying syslog
instead of a file path as the argument to ErrorLog:
Step 8 — Customizing the error log format
Like the Apache access logs, the format of the error messages can be controlled
through the ErrorLogFormat directive, which should be placed in the main
config file or virtual host entry. It looks like this:
Output
ErrorLogFormat "[%{u}t] [%l] [pid %P:tid %T] [client %a] %M"
The above configuration produces a log entry in the following format:
Output
[Mon Feb 07 15:52:57.234792 2022] [error] [pid 24372:tid 24507] [client 20.113.27.135:34579] AH01276: Cannot serve directory /var/www/html/: No matching DirectoryIndex (index.html) found, and server-generated directory index forbidden by Options directive
Here’s an explanation of the formatting options used above:
%{u}t: the current time, including microseconds. %l: the log level of the
message. %P: the process identifier. %T: the thread identifier. %a: the
client IP address. %M: the actual log message.
Note that when the data for a formatting option is not available in a particular
event, it will be omitted from the log entirely as the Apache error log doesn’t
use placeholder values for missing parameters.
You can find a complete description of all the available error formatting
options in the
Apache docs.
Step 9 — Customizing the error log level
In the virtual host configuration file, you can also control the level of
messages that will be entered into the error log through the
LogLevel directive.
When you specify a particular value, messages from all other levels of higher
severity will be logged as well. For example, when LogLevel error is
specified, messages with a severity of crit, alert, and emerg will also be
logged.
These are the levels available in increasing order of severity:
trace1—trace8: trace messages (lowest severity).debug: messages used for debugging.info: informational messages.notice: normal but significant conditions.warn: warnings.error: error conditions that doesn’t necessarily require immediate action.crit: critical conditions that requires prompt action.alert: errors that require immediate action.emerg: system is unusable.
If the LogLevel directive is not set, the server will set the log level to
warn by default.
Step 10 — Centralizing your Apache logs
Storing your Apache logs on the filesystem may suffice for development
environments or single-server deployments, but when multiple servers are
involved, it may be more convenient to centralize all your logs in a single
location so that you can automatically parse, filter, and search log data from
all sources in real-time.
In this section, we’ll demonstrate how you can centralize your Apache logs in a
log management service through Vector,
a high-performance tool for building observability pipelines. The following
instructions assume that you’ve signed up for a free
Logtail account and retrieved your source
token.
Go ahead and follow the relevant
installation instructions for Vector
for your operating system. On Ubuntu, you may run the following commands to
install the Vector CLI:
curl -1sLf 'https://repositories.timber.io/public/vector/cfg/setup/bash.deb.sh' | sudo -E bash
After Vector is installed, confirm that it is up and running through
systemctl:
You should observe that it is active and running:
Output
● vector.service - Vector
     Loaded: loaded (/lib/systemd/system/vector.service; enabled; vendor preset: enabled)
     Active: active (running) since Tue 2022-02-08 10:52:59 UTC; 48s ago
       Docs: https://vector.dev
    Process: 18586 ExecStartPre=/usr/bin/vector validate (code=exited, status=0/SUCCESS)
   Main PID: 18599 (vector)
      Tasks: 3 (limit: 2275)
     Memory: 6.8M
     CGroup: /system.slice/vector.service
             └─18599 /usr/bin/vector
Otherwise, go ahead and start it with the command below.
sudo systemctl start vector
Afterwards, change into a root shell and append your Logtail vector
configuration for Apache into the /etc/vector/vector.toml file using the
command below. Don’t forget to replace the <your_logtail_source_token>
placeholder below with your source token.
wget -O ->> /etc/vector/vector.toml
    https://logtail.com/vector-toml/apache2/<your_logtail_source_token>
Then restart the vector service:
sudo systemctl restart vector
You will observe that your Apache logs will start coming through in Logtail:
Conclusion
In this tutorial, you learned about the different types of logs that the Apache
web server stores, where you can find those logs, and how to view their
contents. We also discussed Apache access and error log formatting and how to
create your custom log formats, including a structured JSON format. Finally, we
considered how you can manage all your Apache logs in one place by using the
Vector CLI to stream each entry to a log management service.
Don’t forget to read the docs to
find out more about all the logging features that Apache has to offer. Thanks
for reading!
Centralize all your logs into one place.
Analyze, correlate and filter logs with SQL.
Create actionable
dashboards.
Share and comment with built-in collaboration.
Got an article suggestion?
Let us know
![]()
![]()
![]()
Next article
How to View and Configure NGINX Access & Error Logs
Learn how to view and configure nginx access and error logs
→
![]()
This work is licensed under a Creative Commons Attribution-NonCommercial-ShareAlike 4.0 International License.
Introduction
Apache is part of the LAMP stack of software for Linux (Linux, Apache, MySQL, PHP). Apache is responsible for serving web pages to people looking at your website.
The server grants access for visits to your website, and it keeps an access log. These records, or log files, can be a valuable source of information about your website, usage, and audience.
In this tutorial, you will learn how to view Apache access log files.

Prerequisites
- A Linux system running Apache web services
- A user account with root (sudo) access
- Terminal window (Ctrl-Alt-T in Ubuntu, Alt-F2 in CentOS)
Viewing Apache Access Logs
Use cPanel to Download Raw Access Files
If you’re logged in to a web server with cPanel, you can download the Apache access logs through a graphical interface.
1. Look for the section labeled Metrics.
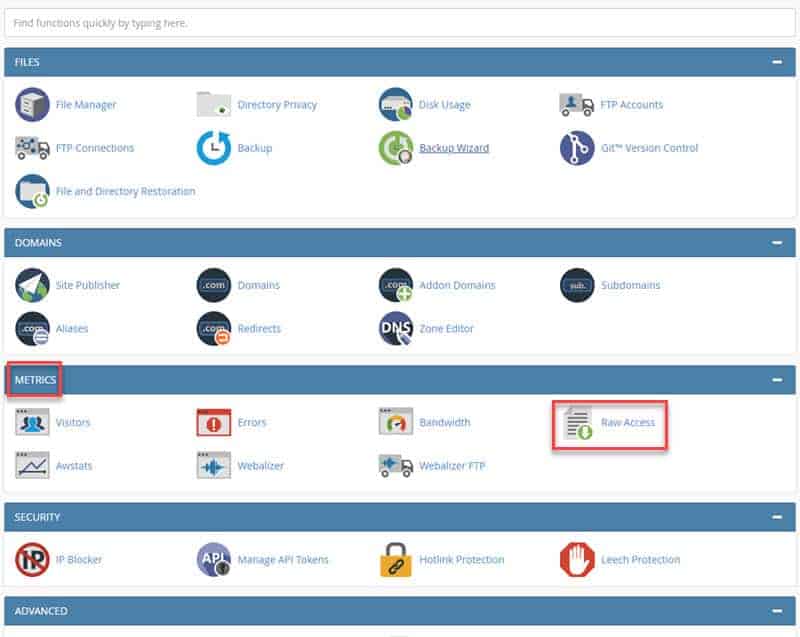
2. Click Raw Access. If archiving is enabled, raw Apache log files can be downloaded at the bottom of the page. They will look like standard hyperlinks, labeled for the website you’re managing.
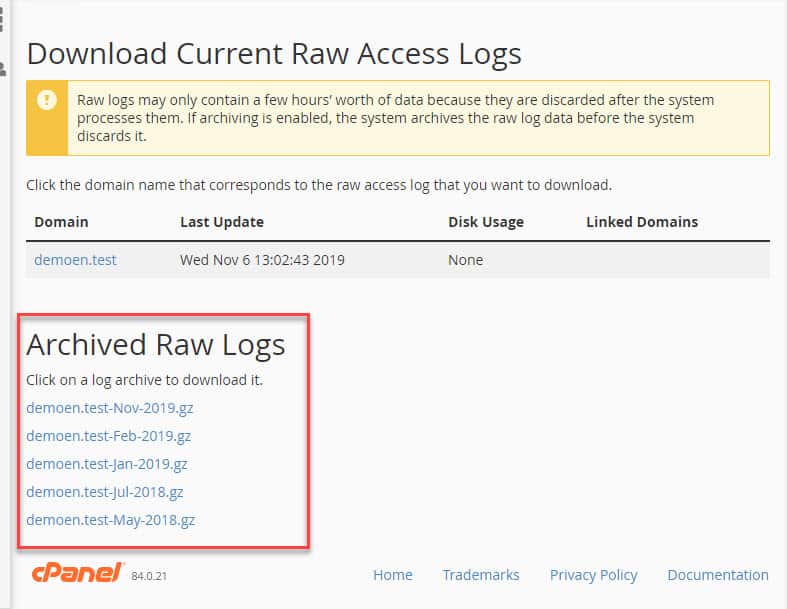
Clicking the hyperlink will prompt you to save or open the file. These log files are compressed using gzip, so if you’re not using a Linux system, you might need a decompression tool. Save the file to a location of your liking.
3. Locate the file in your OS, then right-click > extract. A new file should appear without the .gz extension.
4. Right-click > edit to open the file in your favorite text editor to view the contents.
Using Terminal Commands to Display Local Access Logs
If you’re working on the machine that hosts Apache, or if you’re logged into that machine remotely, you can use the terminal to display and filter the contents of the access logs.
By default, you can find the Apache access log file at the following path:
- /var/log/apache/access.log
- /var/log/apache2/access.log
- /etc/httpd/logs/access_log
Use the GUI or the terminal with the cd command to navigate your system to find where the logs are stored.
Step 1: Display the Last 100 Entries of the Access Log
In the terminal window, enter the following:
sudo tail -100 /var/log/apache2/access.logThe tail command tells the machine to read the last part of the file, and the -100 command directs it to display the previous 100 entries.
The final part, /var/log/apache2/access.log tells the machine where to look for the log file. If your log file is in a different place, make sure to substitute your machine’s path to the Apache log files.
Step 2: Display a Specific Term from Access Logs
Sometimes, you only want to display a specific type of entry in the log. You can use the grep command to filter your report by certain keywords.
For example, enter the following into a terminal:
sudo grep GET /var/log/apache2/access.logLike the previous command, this looks at the /var/log/apache2/access.log file to display the contents of the access log. The grep command tells the machine to only display entries with the GET request.
You can substitute other Apache commands as well. For example, if you’re looking to monitor access to .jpg images, you could substitute .jpg for GET. As before, use the actual path to your server’s log file.
In addition to the access log, you can use the previously mentioned terminal commands to view the error log.
Enter the following command in the terminal:
sudo tail -100 /var/log/apache2/error.logIf you found your access log file in another location, your error log file will be in the same location. Make sure you type the correct path.
Interpreting the Access Log in Apache
When you open your access log file for the first time, you may feel overwhelmed.
There’s a lot of information about HTTP requests, and some text editors (and the terminal) will wrap the text to the next line. This can make it confusing to read, but each piece of information is displayed in a specific order.
The conventional method for expressing the format of access log files is:
"%h %l %u %t "%r" %>s %b "%{Referer}i" "%{User-agent}i""This is a code for the most common things in each line of the log.
Each % sign corresponds to a piece of information in the log:
%h– The client’s IP address (the source of the access request).%l– This next entry may simply be a hyphen — that means no information was retrieved. This is the result of checkingidentdon the client.%u– Client’suserid, if the access request required http authentication.%t– Timestamp of the incoming request.%r– Request line that was used. This tells you the http method (GET, POST, HEAD, etc.), the path to what was requested, and the http protocol being used.%>s– Status code that was returned from the server to the client.%b– Size of the resource that was requested."%{Referer}i"– This tells you if the access came from clicking a link on another website, or other ways that the client was referred to your page."%{User-agent}i"– Tells you information about the entity making the request, such as web browser, operating system, website source (in the case of a robot), etc.
Just read across the line in your log file, and each entry can be decoded as above. If there is no information, the log will display a hyphen. If you’re working on a preconfigured server, your log file may have more or less information. You can also create a custom log format by using the custom log module.
For more information about decoding log formats, see this page.
How to Use Data in Apache Log Files
Apache log analysis gives you the opportunity to measure the ways that clients interact with your website.
For example, you might look at a timestamp to figure out how many access requests arrive per hour to measure traffic patterns. You could look at the user agent to find out if particular users are logging in to a website to access a database or create content. You could even track failed authentications to monitor various types of cybersecurity attacks against your system.
The apache error log can be used similarly. Often, it’s simply used to see how many 404 errors are being generated. A 404 error happens when a client requests a missing resource, and this can alert you on broken links or other errors within the page. However, it can also be used to find configuration glitches or even warnings about potential server problems.
Conclusion
This guide provided methods for extracting data to view Apache access log files.
The access.log file is an excellent resource for measuring the ways that clients are interacting with your server. The error.log file can help you troubleshoot issues with your website.
Apache has been around since 1995 and is the most important web technology. The majority of businesses nowadays run-on Apache servers. Different servers operate in different ways and have different features and functions. For simple debugging, several servers keep server logs. Understanding how the server works is essential.
All errors encountered by the server while receiving or processing requests are recorded in the Apache error logs. These logs are accessible to admin users, who can troubleshoot them for immediate solutions.
These logs will provide you with useful information about the traffic to your application, errors that occur, and performance. This article will cover Apache web server logs, including log levels, format, and formatting as JSON.
We will cover the following:
- What are Apache Logs?
- What is the Apache Error Log?
- Apache Error Log vs Apache Access Log
- Where Do You Find the Apache Error Log?
- How Do You Check the Apache Error Log?
- Configuring Apache Logs
- Apache Error Log Levels
- Apache Error Log Format
- Apache Request Tracking
- Managed Dedicated Servers
- Unmanaged Dedicated Servers
- Assigning Nicknames
- Formatting as JSON
- How Do You Clear the Apache Error Log?
What are Apache Logs?
The Apache server keeps a record of all server actions in a text file known as Apache logs. These logs provide useful information about what resources are used and released. Additionally, the logs contain information about who visited those resources and for how long and all related data.
Not only that, but you’ll get all of the details on all of the errors that occurred. The admins can use these logged errors to look into fixing the errors and determining the root cause to eliminate the possibility of the error occurring again.
There isn’t a single Apache logging process. It involves several steps, including saving the logs in a specified area for future reference, analyzing and parsing the logs to extract the relevant information, and producing the graph for a better visual representation. There isn’t a single log type that Apache keeps track of. However, we’ll be concentrating on Apache error logs.
Types of Apache Log
There are two types of logs produced by Apache: Access logs and Error logs.
- Access Log
The access log keeps track of the requests that come into the webserver. This data could include what pages visitors are looking at, the status of requests, and how long it took the server to respond. - Error Log
The error log records any errors encountered by the web server when processing requests, such as missing files. It also contains server-specific diagnostic information.
What is the Apache Error Log?
If you can’t figure out what’s wrong with your server and it keeps throwing errors, it will become unreliable. We must keep information about the errors affecting the server’s performance for easy and seamless server operation.
As a result, Apache keeps error logs in a specific location. For simple troubleshooting, the server administrator sets up these log files and other details such as file size, error time, type of error, error message, and so on.
The Apache log keeps track of events handled by the Apache web server, such as requests from other computers, Apache responses, and internal Apache server operations.
These logs will continue to be created and stored at that location, making them accessible in the future. You must understand where these errors are saved, how to access them, and how to use the information they provide.
Apache Error Log vs. Apache Access Log
The next thing that people appear to be confused about is the difference between the access log and the error log. Are these two different concepts? Or do they refer to the same thing under different names?

They’re two very different things. The access log is not the same as the error log.
The access log keeps an account of all requests made to the web server, as well as who made them. You can think of it as a geekier version of an event guest log. It keeps track of information like visitor IP addresses, URL requests, responses, and so on.
While the access log may contain information about difficulties that arise, the error log—the subject of our discussion today—is dedicated to logging errors and problems that occur during the server’s operation. You can search for general information about web requests in the access log, but errors should be found in the error log.
Where do you find the Apache Error Log?
Several factors have a role in this:
- Apache is a cross-platform web server that can run on nearly any operating system. It’ll be difficult enough to figure out which version to download, let alone locate any log files it generates.
- The majority of Apache installations take place on Unix and Linux systems, which are even more fragmented in terms of where you can find stuff.
- Apache is highly customizable. While this gives it a lot of flexibility and power, it also makes items more difficult to find because you can put them everywhere.
So, what does it all add up to?
When you Google «where is the Apache error log,» Google could simply pop up a message saying, «No one knows where yours is.» This would save you a lot of clicking and bounce.
However, everything is not lost.
You could look up your operating system’s log file location or the default Apache log file location using Google. Keep in mind that you’ll have to search for your operating system. The ‘/var/log‘ directory is a common destination for log files on *nix systems.
Instead, we did investigate the location of your Apache configuration files. Because these are configurable Apache settings, you can identify the location of the error log (and other logs) once you have that.
For instance, consider the following example of log location configuration:
Update the below log path and log levels in the default configuration file — /etc/apache2/apache2.conf.
ErrorLog "/var/log/apache2/error.log"By the way, you’re not obligated to name the file «error.log.» Instead, any legal name you provide would suffice. If the specified file already exists, additional log entries will be appended to it.
You can also use a Syslog server to send log messages. Use the Syslog directive instead of a filename.
ErrorLog syslogThere are numerous options for the logging facility and the application name in the Syslog option. Details can be found here.
Finally, you can use a Linux command to redirect logs.
ErrorLog "|/usr/local/bin/httpd_errors"The pipe character tells Apache that the messages should be piped to the specified command.
Access logs for apache can be found in the following directory on the cPanel server.
/usr/local/apache/logs/access_logHow do you check the Apache Error Log?
How do you go about really checking it once you’ve located it?
You must first understand what it is to understand how it is.

A text file contains the Apache error log. So you can use any text editor or a command-line application like Cat or Tail to open it. These will offer you a quick preview of the contents and allow you to navigate through to find what you need. The entries in the file will be in reverse chronological order.
Let’s say you wish to utilize the «tail» command. In practice, how would you go about doing that?
Easy. To begin, start a shell session.
After that, you type the command:
tail -f /path-to/logYou’ll see the file’s last few entries after running the command above. You’ll also see new entries as they become available.
Since your log file contains errors, it should now be small. However, it could be large—too large to search quickly. In that situation, you might wish to use grep and regex to scan the contents of the error log. Alternatively, you may use a log aggregator to parse and turn the contents into data that you can readily query.
Configuring Apache Logs
The logging framework in Apache is highly flexible, allowing you to change logging behavior globally or for each virtual host. To adjust logging behavior, you can use several directives. The log level and log format directives are two of the most popular directives.
Apache Error Log Levels
It’s no surprise that the Apache error log, like any other log file, uses logging levels.
If you’re unfamiliar with the concept of logging levels, we recommend reading our post on the log levels.
In short, logging levels are labels that can be applied to log entries. The messages transmitted to the log file can then be filtered, thereby changing the verbosity of each message.
The LogLevel directive can be used to specify the desired level, as shown in the following example:
LogLevel warnThe default level is «warn,» although there are a variety of alternative options.
The levels are described as follows in the Apache documentation:
If you want to understand more about each level in-depth, go to Apache’s documentation.
Let’s look at how the two logging levels compare. We’ll compare the levels of warning and debug logs.
- Warning: You will only receive warning logs if the system is functioning normally but something does not appear to be correct. If these warnings are not addressed promptly, they may result in serious problems over time.
- Debug log level, on the other hand, logs practically everything that happens on the server. It might be errors or any other essential notification that you as a website administrator could find useful.
The following command in the main configuration file can be used to enable debug log level.
LogLevel alert rewrite:trace6Apache Error Log Format
You can also modify the format of log messages. We have been using the default format thus far. The ErrorLogFormat setting controls the message composition.
Let’s try a different setting to see what happens. We are going to utilize this example from the Apache documentation.
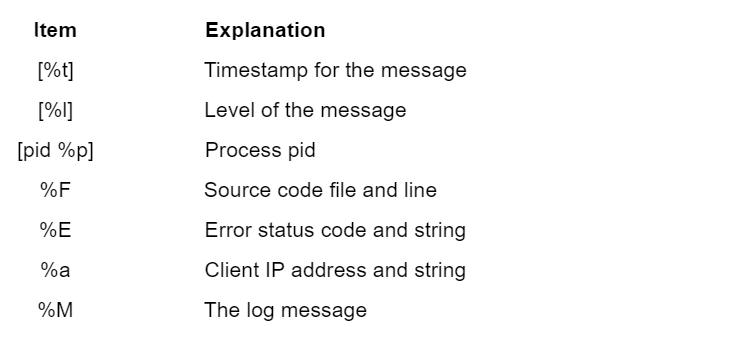
ErrorLogFormat "[%t] [%l] [pid %P] %F: %E: [client %a] %M"This is how a request appears right now:
[Thu Jun 09 11:46:18 2022] [fuga:error] [pid 6157:tid 4946] [client 144.110.67.126:20151] You can't copy the port without navigating the haptic SMTP card!
[Thu Jun 09 11:46:18 2022] [pariatur:info] [pid 5946:tid 7137] [client 35.8.11.82:2909] We need to transmit the primary SQL interface!
Let’s go over how to use this format. The format string contains parameters that correspond to fields in a logging event.
The fields we used above are as follows:
For new connections and requests, you can define alternative formats. When a new client connects to the server, it is called a connection. A request is a communication that asks for something, such as a page or an image.
Apache uses connection and request formats when a new client connects or makes a web request. It records a message indicating that a client has established a connection or made a new request.
Apache Request Tracking
You can go a step further with logging messages for new connections and requests. Every new request or connection will generate a unique identifier in the Apache error log. This parameter can be used to group log entries. For identifiers, use the %L field.
Assigning Nicknames
You can give LogFormat strings nicknames, which you can use with the CustomLog directive to write logs in the format you specify. This allows you to use the same log format across multiple log files without having to change it each time. This is especially beneficial when many virtual hosts are utilizing separate log files.
Let’s say you want to build an example format called «vhost_combined.» Then, using the vhost_combined format, we’ll create a CustomLog directive that writes logs to a file.
LogFormat "%v:%p %h %l %u %t "%r" %>s %O "%{Referer}i" "%{User-Agent}i"" vhost_combined
CustomLog /var/log/apache2/vhost.log vhost_combined
Formatting as JSON
If you save your logs as plain text, they’ll be easy to scan if you ever need to read them. This makes it difficult to understand your logs with tools like log management solutions, which require knowledge of how your logs are formatted. The default Apache log format is supported by most log management solutions, but if it isn’t, you should consider adopting a structured format like JSON.
JSON is a lightweight data storage format. JSON holds practically any data type and structure as a set of nestable name/value pairs. JSON is also self-documenting because the key name describes the data it contains. Strings, numbers, booleans, arrays, and null values are among the basic data types supported by JSON.
A LogFormat that saves logs in JSON format looks like this:
LogFormat "{ "time":"%t", "remoteIP":"%a", "host":"%V", "request":"%U", "query":"%q", "method":"%m", "status":"%>s", "userAgent":"%{User-agent}i", "referer":"%{Referer}i" }"Read must-know tips for JSON logging.
How Do You Clear the Apache Error Log?
Simply put, the log file will get quite large throughout a long period. You won’t need error messages from two years ago at some point. So you’d like to get rid of it to free up some disk space, either by truncating it or backing it up somewhere else.
When it comes to deleting the logs, there’s an interesting problem to solve. The server keeps a handle on the file for writing as long as it is operating. You can’t just open it and start editing it, or back it up and delete it.
Having root access and doing something like this—overwriting the file contents with nothing—might be the simplest method. However, we would recommend making a backup of the file first.
Alternatively, you can follow the instructions for log rotation and piped logs on Apache’s website. These solutions are more complicated, but they are more «proper» and less hacky.
However, regardless of how you approach deleting the logs or logging in general, our advice is to always err on the side of keeping as much information as possible.
Conclusion
The Apache error logs may appear to be simple. More than grepping log files or other ad hoc approaches are required to achieve uptime SLA. You should create a system for storing and analyzing Apache error logs. Tracking and analyzing HTTP error codes, finding outlier IP addresses, listing pages with slow response times, and other metrics that might improve uptime and MTTR.
Atatus
Logs Monitoring and Management
Atatus offers a
Logs Monitoring
solution which is delivered as a fully managed cloud service with minimal setup at any scale that requires no maintenance. It monitors logs from all of your systems and applications into a centralized and easy-to-navigate user interface, allowing you to troubleshoot faster.

We give a cost-effective, scalable method to centralized logging, so you can obtain total insight across your complex architecture. To cut through the noise and focus on the key events that matter, you can search the logs by hostname, service, source, messages, and more. When you can correlate log events with
APM
slow traces and errors, troubleshooting becomes easy.
Try your 14-day free trial of Atatus.
Для эффективного управления веб-сервером необходимо получить обратную связь об активности и производительности сервера, а также о всех проблемах, которые могли случиться. Apache HTTP Server обеспечивает очень полную и гибкую возможность ведения журнала. В этой статье мы разберём, как настроить логи Apache и как понимать, что они содержат.
HTTP-сервер Apache предоставляет множество различных механизмов для регистрации всего, что происходит на вашем сервере, от первоначального запроса до процесса сопоставления URL-адресов, до окончательного разрешения соединения, включая любые ошибки, которые могли возникнуть в процессе. В дополнение к этому сторонние модули могут предоставлять возможности ведения журналов или вставлять записи в существующие файлы журналов, а приложения, такие как программы CGI, сценарии PHP или другие обработчики, могут отправлять сообщения в журнал ошибок сервера.
В этой статье мы рассмотрим модули журналирования, которые являются стандартной частью http сервера.
Логи Apache в Windows
В Windows имеются особенности настройки имени файла журнала — точнее говоря, пути до файла журнала. Если имена файлов указываются с начальной буквы диска, например «C:/«, то сервер будет использовать явно указанный путь. Если имена файлов НЕ начинаются с буквы диска, то к указанному значению добавляется значение ServerRoot — то есть «logs/access.log» с ServerRoot установленной на «c:/Server/bin/Apache24″, будет интерпретироваться как «c:/Server/bin/Apache24/logs/access.log«, в то время как «c:/logs/access.log» будет интерпретироваться как «c:/logs/access.log«.
Также особенностью указания пути до логов в Windows является то, что нужно использовать слэши, а не обратные слэши, то есть «c:/apache» вместо «c:apache«. Если пропущена буква диска, то по умолчанию будет использоваться диск, на котором размещён httpd.exe. Рекомендуется явно указывать букву диска при абсолютных путях, чтобы избежать недоразумений.
Apache error: ошибки сервера и сайтов
Путь до файла журнала с ошибками указывается с помощью ErrorLog, например, для сохранения ошибок в папке «logs/error.log» относительно корневой папки веб-сервера:
ErrorLog "logs/error.log"
Если не указать директиву ErrorLog внутри контейнера <VirtualHost>, сообщения об ошибках, относящиеся к этому виртуальному хосту, будут записаны в этот общий файл. Если в контейнере <VirtualHost> вы указали путь до файла журнала с ошибками, то сообщения об ошибках этого хоста будут записываться там, а не в этот файл.
С помощью директивы LogLevel можно установить уровень важности сообщений, которые должны попадать в журнал ошибок. Доступные варианты:
- debug
- info
- notice
- warn
- error
- crit
- alert
- emerg
Журнал ошибок сервера, имя и местоположение которого задаётся директивой ErrorLog, является наиболее важным файлом журнала. Это место, куда Apache httpd будет отправлять диагностическую информацию и записывать любые ошибки, с которыми он сталкивается при обработке запросов. Это первое место, где нужно посмотреть, когда возникает проблема с запуском сервера или работой сервера, поскольку он часто содержит подробности о том, что пошло не так и как это исправить.
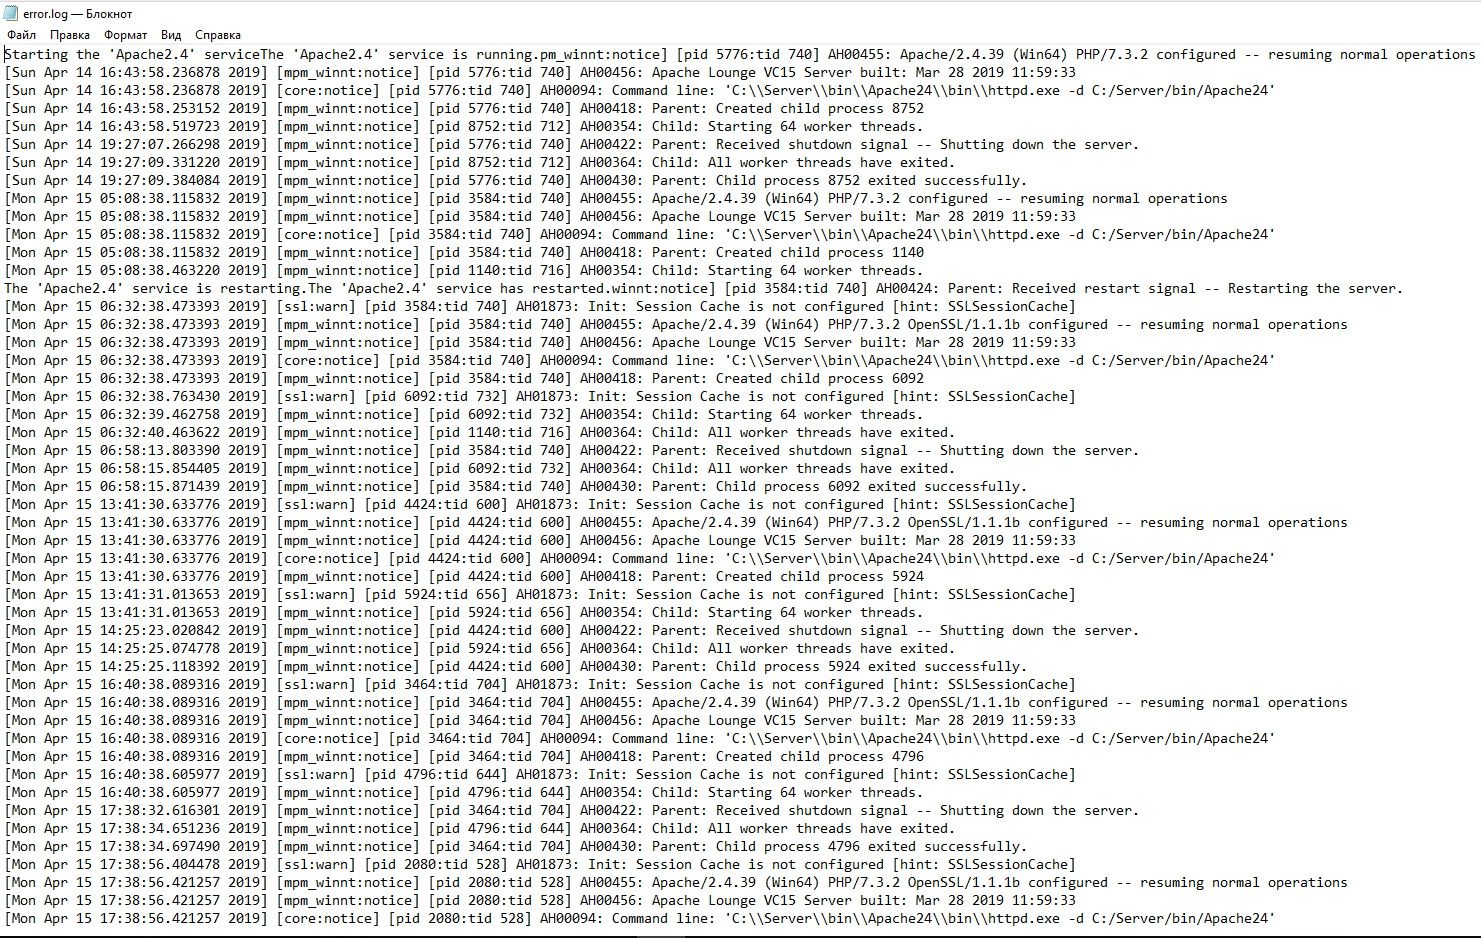
Журнал ошибок обычно записывается в файл (обычно это error_log в системах Unix и error.log в Windows и OS/2). В системах Unix также возможно, чтобы сервер отправлял ошибки в системный журнал или передавал их программе.
Формат журнала ошибок определяется директивой ErrorLogFormat, с помощью которой вы можете настроить, какие значения записываются в журнал. По умолчанию задан формат, если вы его не указали. Типичное сообщение журнала следующее:
[Fri Sep 09 10:42:29.902022 2011] [core:error] [pid 35708:tid 4328636416] [client 72.15.99.187] File does not exist: /usr/local/apache2/htdocs/favicon.ico
Первый элемент в записи журнала — это дата и время сообщения. Следующим является модуль, создающий сообщение (в данном случае ядро) и уровень серьёзности этого сообщения. За этим следует идентификатор процесса и, если необходимо, идентификатор потока процесса, в котором возникло условие. Далее у нас есть адрес клиента, который сделал запрос. И, наконец, подробное сообщение об ошибке, которое в этом случае указывает на запрос о несуществующем файле.
В журнале ошибок может появиться очень большое количество различных сообщений. Большинство выглядит похожим на пример выше. Журнал ошибок также будет содержать отладочную информацию из сценариев CGI. Любая информация, записанная в stderr (стандартный вывод ошибок) сценарием CGI, будет скопирована непосредственно в журнал ошибок.
Если поместить токен %L в журнал ошибок и журнал доступа, будет создан идентификатор записи журнала, с которым вы можете сопоставить запись в журнале ошибок с записью в журнале доступа. Если загружен mod_unique_id, его уникальный идентификатор запроса также будет использоваться в качестве идентификатора записи журнала.
Во время тестирования часто бывает полезно постоянно отслеживать журнал ошибок на наличие проблем. В системах Unix вы можете сделать это, используя:
tail -f error_log
Apache access: логи доступа к серверу
Журнал доступа к серверу записывает все запросы, обработанные сервером. Расположение и содержимое журнала доступа контролируются директивой CustomLog. Директива LogFormat может быть использована для упрощения выбора содержимого журналов. В этом разделе описывается, как настроить сервер для записи информации в журнал доступа.
Различные версии Apache httpd использовали разные модули и директивы для управления журналом доступа, включая mod_log_referer, mod_log_agent и директиву TransferLog. Директива CustomLog теперь включает в себя функциональность всех старых директив.
Формат журнала доступа легко настраивается. Формат указывается с использованием строки формата, которая очень похожа на строку формата printf в стиле C. Некоторые примеры представлены в следующих разделах. Полный список возможного содержимого строки формата смотрите здесь: https://httpd.apache.org/docs/current/mod/mod_log_config.html
Общий формат журнала (Common Log)
Типичная конфигурация для журнала доступа может выглядеть следующим образом.
LogFormat "%h %l %u %t "%r" %>s %b" common
CustomLog logs/access_log common
В первой строке задано имя (псевдоним) common, которому присвоено в качестве значения строка «%h %l %u %t «%r» %>s %b«.
Строка формата состоит из директив, начинающихся с символа процента, каждая из которых указывает серверу регистрировать определённый фрагмент информации. Литеральные (буквальные) символы также могут быть помещены в строку формата и будут скопированы непосредственно в вывод журнала. Символ кавычки («) должен быть экранирован путём размещения обратной косой черты перед ним, чтобы он не интерпретировался как конец строки формата. Строка формата также может содержать специальные управляющие символы «n«для новой строки и «t» для обозначения таба (табуляции).
В данной строке значение директив следующее:
- %h — имя удалённого хоста. Будет записан IP адрес, если HostnameLookups установлен на Off, что является значением по умолчанию.
- %l — длинное имя удалённого хоста (от identd, если предоставит). Это вернёт прочерк если не присутствует mod_ident и IdentityCheck не установлен на On.
- %u — удалённый пользователь, если запрос был сделан аутентифицированным пользователем. Может быть фальшивым, если возвращён статус (%s) 401 (unauthorized).
- %t — время получения запроса в формате [18/Sep/2011:19:18:28 -0400]. Последнее показывает сдвиг временной зоны от GMT
- «%r» — первая строка запроса, помещённая в буквальные кавычки
- %>s — финальный статус. Если бы было обозначение %s, то означало бы просто статус — для запросов, которые были внутренне перенаправлены это обозначало бы исходный статус.
- %b — размер ответа в байтах, исключая HTTP заголовки. В формате CLF, то есть ‘—‘ вместо 0, когда байты не отправлены.
Директива CustomLog устанавливает новый файл журнала, используя определённый псевдоним. Имя файла для журнала доступа относительно ServerRoot, если оно не начинается с косой черты (буквы диска).
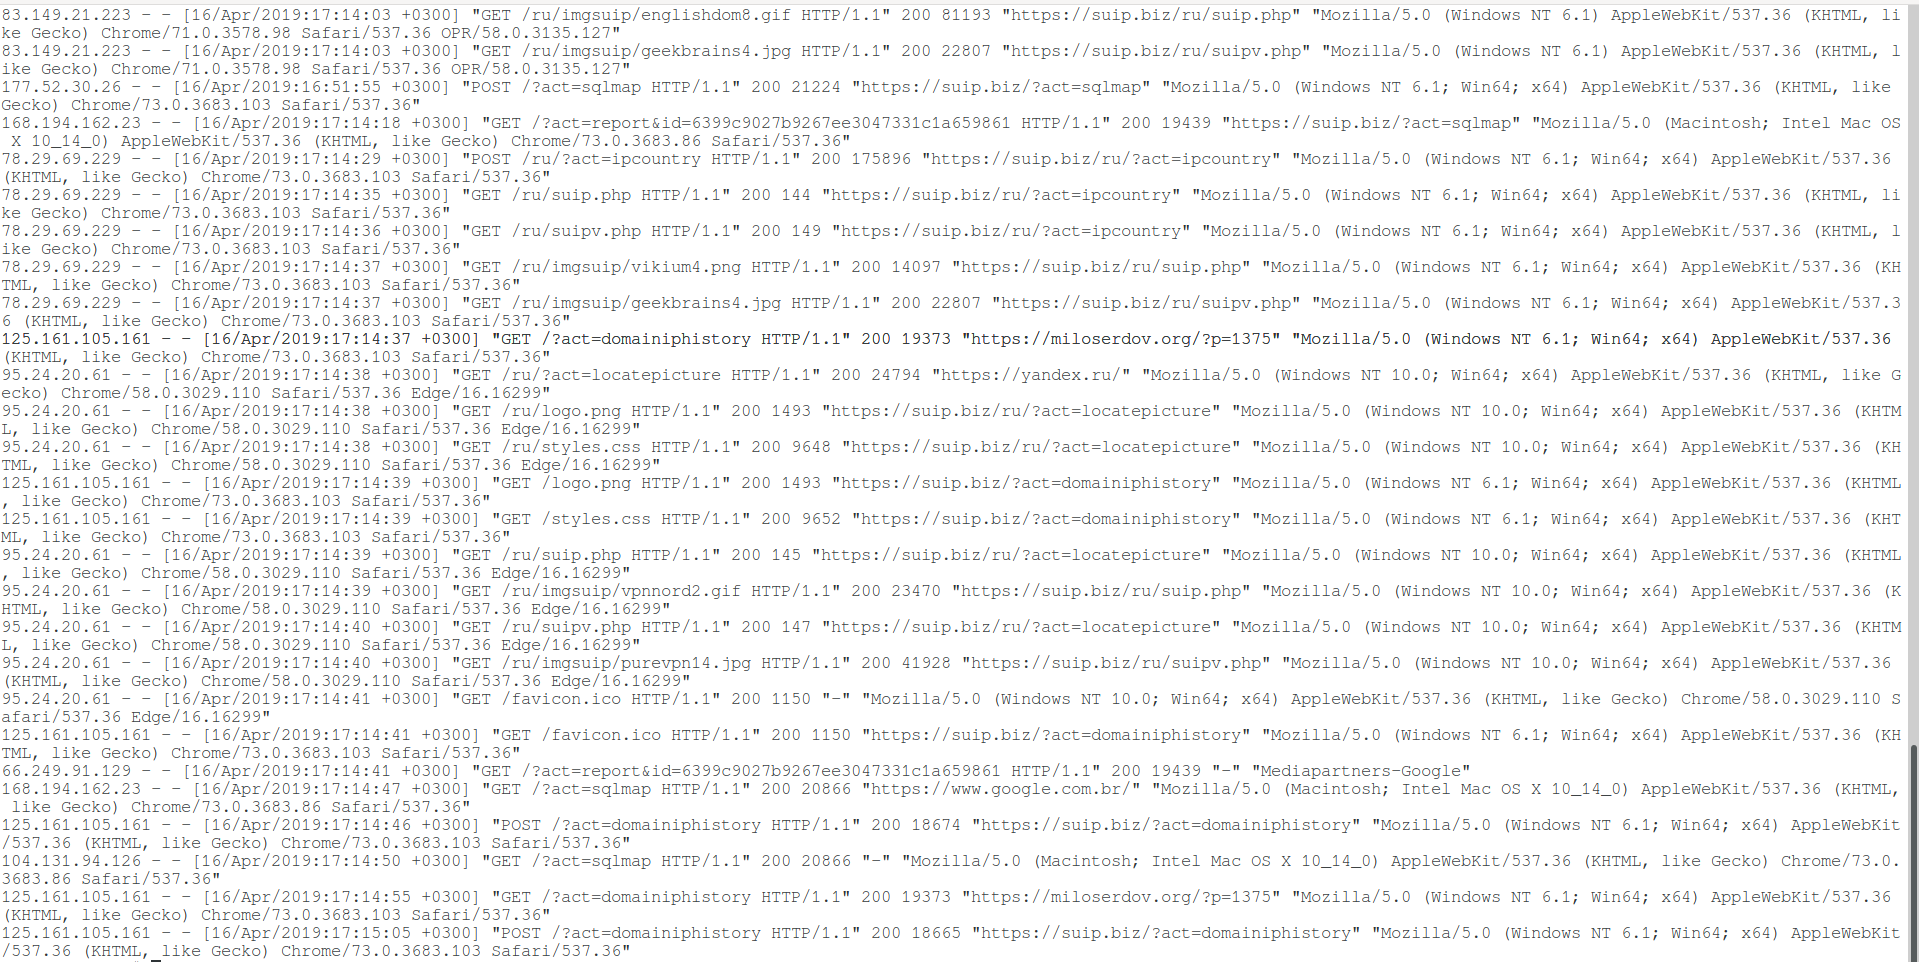
Приведённая выше конфигурация будет сохранять записи журнала в формате, известном как Common Log Format (CLF). Этот стандартный формат может создаваться многими различными веб-серверами и считываться многими программами анализа журналов. Записи файла журнала, созданные в CLF, будут выглядеть примерно так:
127.0.0.1 - frank [10/Oct/2000:13:55:36 -0700] "GET /apache_pb.gif HTTP/1.0" 200 2326
Каждая часть этой записи журнала описана ниже.
127.0.0.1 (%h)
Это IP-адрес клиента (удалённого хоста), который сделал запрос к серверу. Если для HostnameLookups установлено значение On, сервер попытается определить имя хоста и зарегистрировать его вместо IP-адреса. Однако такая конфигурация не рекомендуется, поскольку она может значительно замедлить работу сервера. Вместо этого лучше всего использовать постпроцессор журнала, такой как logresolve, для определения имён хостов. Указанный здесь IP-адрес не обязательно является адресом машины, на которой сидит пользователь. Если между пользователем и сервером существует прокси-сервер, этот адрес будет адресом прокси, а не исходной машины.
— (%l)
«Дефис» в выходных данных указывает на то, что запрошенная часть информации недоступна. В этом случае информация, которая недоступна, является идентификационной информацией клиента RFC 1413, определённой с помощью id на клиентском компьютере. Эта информация крайне ненадёжна и почти никогда не должна использоваться, кроме как в жёстко контролируемых внутренних сетях. Apache httpd даже не будет пытаться определить эту информацию, если для IdentityCheck не установлено значение On.
frank (%u)
Это идентификатор пользователя, запрашивающего документ, как определено HTTP-аутентификацией. Такое же значение обычно предоставляется сценариям CGI в переменной среды REMOTE_USER. Если код состояния для запроса равен 401, то этому значению не следует доверять, поскольку пользователь ещё не аутентифицирован. Если документ не защищён паролем, эта часть будет «—«, как и предыдущая.
[10/Oct/2000:13:55:36 -0700] (%t)
Время получения запроса. Формат такой:
[день/месяц/год:час:минута:секунда зона]
день = 2*цифры
месяц = 3*цифры
год = 4*цифры
час = 2*цифры
минута = 2*цифры
секунда = 2*цифры
зона = (`+’ | `-‘) 4*цифры
Можно отобразить время в другом формате, указав %{format}t в строке формата журнала, где формат такой же, как в strftime(3) из стандартной библиотеки C, или один из поддерживаемых специальных токенов. Подробности смотрите в строках формате строки mod_log_config.
«GET /apache_pb.gif HTTP/1.0» («%r»)
Строка запроса от клиента указана в двойных кавычках. Строка запроса содержит много полезной информации. Во-первых, клиент использует метод GET. Во-вторых, клиент запросил ресурс /apache_pb.gif, и в-третьих, клиент использовал протокол HTTP/1.0. Также возможно зарегистрировать одну или несколько частей строки запроса независимо. Например, строка формата «%m %U%q %H» будет регистрировать метод, путь, строку запроса и протокол, что приведёт к тому же результату, что и «%r«.
200 (%>s)
Это код состояния, который сервер отправляет обратно клиенту. Эта информация очень ценна, потому что она показывает, привёл ли запрос к успешному ответу (коды начинаются с 2), к перенаправлению (коды начинаются с 3), к ошибке, вызванной клиентом (коды начинаются с 4), или к ошибкам в сервер (коды начинаются с 5). Полный список возможных кодов состояния можно найти в спецификации HTTP (RFC2616 раздел 10).
2326 (%b)
Последняя часть указывает размер объекта, возвращаемого клиенту, не включая заголовки ответа. Если контент не был возвращён клиенту, это значение будет «—«. Чтобы записать «0» без содержимого, вместо %b используйте %B.
Логи комбинированного формата (Combined Log)
Другая часто используемая строка формата называется Combined Log Format. Может использоваться следующим образом.
LogFormat "%h %l %u %t "%r" %>s %b "%{Referer}i" "%{User-agent}i"" combined
CustomLog log/access_log combined
Этот формат точно такой же, как Common Log Format, с добавлением ещё двух полей. Каждое из дополнительных полей использует директиву начинающуюся с символа процента %{заголовок}i, где заголовок может быть любым заголовком HTTP-запроса. Журнал доступа в этом формате будет выглядеть так:
127.0.0.1 - frank [10/Oct/2000:13:55:36 -0700] "GET /apache_pb.gif HTTP/1.0" 200 2326 "http://www.example.com/start.html" "Mozilla/4.08 [en] (Win98; I ;Nav)"
Дополнительными полями являются:
«http://www.example.com/start.html» («%{Referer}i»)
Referer — это часть заголовок HTTP-запроса, которая называется также Referer. В этой строке содержится информация о странице, с которой клиент был прислан на данный сайт. (Это должна быть страница, которая ссылается или включает /apache_pb.gif).
«Mozilla/4.08 [en] (Win98; I ;Nav)» («%{User-agent}i»)
Заголовок HTTP-запроса User-Agent. Это идентифицирующая информация, которую клиентский браузер сообщает о себе.
По умолчанию в главном конфигурационном файле Apache прописаны следующие настройки логов:
<IfModule log_config_module>
    LogFormat "%h %l %u %t "%r" %>s %b "%{Referer}i" "%{User-Agent}i"" combined
    LogFormat "%h %l %u %t "%r" %>s %b" common

    <IfModule logio_module>
      LogFormat "%h %l %u %t "%r" %>s %b "%{Referer}i" "%{User-Agent}i" %I %O" combinedio
    </IfModule>

    CustomLog "logs/access.log" common
</IfModule>
Как можно увидеть, установлены три псевдонима: combined, common и combinedio. При этом по умолчанию используется common. При желании вы без труда сможете переключиться на combined или настроить формат строки лога под свой вкус.
Например, если вы предпочитаете, чтобы в файле лога доступа также присутствовала информация о пользовательском агенте и реферере, то есть Combined Logfile Format, то вы можете использовать следующую директиву:
CustomLog "logs/access.log" combined
Связанные статьи:
- Почему в логах ошибок Apache не сохраняются записи об ошибке 404 (100%)
- Как в Apache под Windows настроить автоматическую ротацию и очистку логов (100%)
- Удалённый просмотр и поиск по логам Apache в Windows (модуль mod_view) (100%)
- Apache для Windows (54.6%)
- Как запустить Apache на Windows (54.6%)
- Установка Apache, PHP, MySQL и phpMyAdmin на Windows XP (RANDOM — 54.6%)
Today features another post about the nuts and bolts of logging. This time, I’ll be talking about the Apache error log in some detail.
Originally, I had a different plan and outline for this post. But then I started googling for good reference material.
And what I found were way more questions than answers about the topic, many on various Stack Exchange sites. It seems that information about the Apache error log is so scarce that people can’t agree on where to ask questions, let alone get answers to them.
So let’s change that. I’m going to phrase this as a Q&A-based outline, hopefully answering all of the questions you might have come looking for—if you googled the term—while also providing a broad narrative for regular readers.

First of All, What Is the Apache Error Log?
First things first. What exactly is this thing we’re talking about here? To understand that, you first need to understand what Apache is. Apache is a web server, in the software sense of the term. As briefly as possible, this means that it’s the application in which you put your website’s files, and it manages inbound HTTP requests.
Now as you might imagine, something that manages the websites you build is a fairly involved and fairly important piece of software. And, as such, it produces a lot of log data.
Apache’s error log is part of that log data that it produces. It’s a standalone file that specifically contains information about errors produced as the Apache web server starts up and runs.
According to Apache’s section on the subject, it is “the most important log file.”
Is the Apache Error Log a Different Thing from the Apache Access Log?
So there you have it. The Apache error log is a log file (and the most important log file) of Apache’s runtime errors.
The next thing people seem to wonder about a lot has to do with differentiating between the access log and the error log. Are these two different things? Or is it just kind of two names for the same thing?
They’re two different, distinct things. The error log is not the same thing as the access log.

For those who follow the blog, you may recall that I’ve posted in detail about the Apache access log. The access log keeps track of all of the requests that come into the web server and who has sent them. You can think of it as the really geeky equivalent of an event guest log. It keeps track of things like IP addresses of visitors, the URL requested, the response, etc.
Now, while the access log may have information related to problems that happen, the error log—the subject of our focus today—is specifically dedicated to logging errors and problems that occur with the running of the server. You can mine the access log for general information about web requests but look in the error log for, well, errors.
Where Do You Find the Apache Error Log?
The question about where you find the error log seems to cause absolutely the most confusion. The reason there’s so much confusion? Well, there are actually several contributing factors:
- Apache is a cross-platform web server that will run on just about any OS you might use. Just figuring out which version to download will confuse you, let alone finding some log file it produces.
- Most Apache installations occur on Unix and Linux system, which have even further fragmentation as to where you might find things.
- Apache is extremely configurable. And while that makes it extremely flexible and powerful, it also makes things even harder to find, since you can put them anywhere.
What does all of this add up to? Well, when you type “where is the Apache error log” into Google, Google could save you a lot of clicking and bouncing by just popping up a message saying, “No one actually knows where yours is.”
All is not lost, though.
You could google your operating system to see where it tends to keep log files or where default Apache log files generally go. Understand that you’ll have to search by your specific operating system. On *nix systems, a typical location for the log files would be under the ‘/var/log’ directory.

But what I’d do instead is actually figure out where your Apache config files are. Once you’ve got that, you can find the location of the error log (and other logs) because they’re configurable Apache settings.
For instance, this is a typical example of the log’s location configuration:
ErrorLog "/var/log/apache2/error.log"
By the way, you’re not forced to use “error.log” as the file name. Instead, any valid name you inform will do. If the name informed refers to an existent file, new log entries will be appended to it.
How Do You Check the Apache Error Log?
Once you’ve found it, how do you go about actually checking it? Well, to understand that, understand what it is.
The Apache error log is a text file. So you can open it with any text editor or with a command line utility like tail or cat. Those will give you a quick peek at the contents and let you scroll through to find what you’re looking for. The file’s entries will be in chronological order.
Suppose you want to use the “tail” utility. How would you go about that in practice? Easy. First, you open a shell session. You then type the following command:
tail ?f /path-to/log
After running the command above you’ll see the file’s last few entries. You’ll also continue seeing new entries, as they occur.
Now, hopefully, your log file is small since it contains errors. But it might be big—too big to search easily. In that case, you might want to search the error log’s contents using grep and regex. Or you might consider employing a log aggregator to parse and turn the contents into data that you can query easily.
What Are the Apache Error Log Levels?
Since the Apache error log is a log file, not that different in concept from any other log file, it doesn’t come as a surprise that it also makes use of logging levels.
If you aren’t familiar with the concept of logging levels, we invite you to read the post we’ve published about it.
In a nutshell, logging levels are labels that can be applied to log entries. Then can then be used to filter the messages sent to the log file, effectively adjusting the verbosity in each message.
You can specify the desired level using the LogLevel directive, like in the following example:
LogLevel warn
The default level is indeed “warn”, but there are many other levels available:
Level, emerg , alert , crit , error , warn , notice, info , debug , trace1, trace2, trace3, trace4, trace5, trace6, trace7, trace8
You can head to Apache’s documentation if you want to learn about each level in detail.
Let’s talk try to compare the two logging levels here. We will compare warning and debug log levels. Warning, you only receive warning logs when the system is working as expected but something doesn’t seem right. If these warnings are not attended to on time, they might bring some real errors as time go on. On the other hand, debug log level logs almost everything that is happening on the server. It can be errors and just any other important message that can be helpful to you as a website administrator.
You can enable debug log level writing the flowing command in the main configuration file.
LogLevel alert rewrite:trace6
How to Use Grep to Get Information from the Apache Error Log?
As we’ve just mentioned, it’s possible to use the grep command to search the contents of your Apache error log file. So, let’s see some quick examples of how that can be done.
Suppose you want to filter your log entries with the warn level. This is the command you should run, based on the example location for an Apache error log mentioned a few sections back:
grep warn /var/log/apache2/error.log
Similarly, if you wanted to retrieve log entries marked with the notice level, you’d just have to replace warn with notice in the command above. Easy peasy.
Keep in mind, though, that Apache logs—the error log included—tend to be extremely long. Let’s say you only wanted to output the last 15 lines of your log. You can use the command tail to accomplish that.
Tail is a command that outputs the tail—that is, the end—of a file. By default, it outputs the last 10 lines. You can specify the number of lines using the -n option:
tail -n 5 /var/log/apache2/error.log
You can use tail along with grep in order to get a subset of log entries, then filter them. That’s what we do in the following example: we get five lines from the log file, then feed them to the grep command, which filters for entries containing “warn.’
tail -n 5 /var/log/apache2/error.log | grep warn

Now, suppose you want to do negative filtering. You want to see all log entries except those with the warn level. Can you do it using the grep command? You bet you can! You’d only have to add the -v option to the grep command:
grep -v warn /var/log/apache2/error.log
How You Should View the Apache Error Log—The ErrorLogFormat Directive
That covers how you can get at the file’s contents in the broadest sense. But how do you actually view and interpret the thing, semantically? What does each entry actually mean?
Well, let’s consider an example, taken from this page. This is representative of what an error log file entry could look like:
#Simple example
ErrorLogFormat "[%t] [%l] [pid %P] %F: %E: [client %a] %M"

#And the output:
[Fri Dec 16 01:46:23 2005] [error] [client 1.2.3.4] Directory index forbidden by rule: /home/test/
[Fri Dec 16 01:54:34 2005] [error] [client 1.2.3.4] Directory index forbidden by rule: /apache/web-data/test2
[Fri Dec 16 02:25:55 2005] [error] [client 1.2.3.4] Client sent malformed Host header
[Mon Dec 19 23:02:01 2005] [error] [client 1.2.3.4] user test: authentication failure for "/~dcid/test1": Password Mismatch
You can probably infer the format here of each entry: timestamp, log level, remote host, error message.

Unlike the access log that I mentioned earlier, you don’t have endless customization options here. The format of this particular file is actually fixed. But entries in this file will also correspond to entries in the access log, which you can configure.
You can also create custom log files of your choosing.
Managed Dedicated Servers
If you are using a managed dedicated server, there are a number of directories where you can find the Apache error logs. On cPanel server, you can find the apache access_logs in the following directory.
/usr/local/apache/logs/access_log
Now the access_log is where all the http requests are logged to.
Apache errors can be found in this directory /usr/local/apache/logs/error_log. All the Apache errors are logged in the error_log.
Another important folder you can look for is the demolog folder. Demologs are logs of domains, they are generated from the requests made to the domain. The directory can look like the following
/usr/local/apache/domlogs
Unmanaged Dedicated Servers
Like the name suggests, this is a type of server that is not managed by the hosting company and having that said, you have full control of this server and can decide where the Apache server can be writing the logs. The directories and folders will be up to your tech team.
How Do You Clear the Apache Error Log?
I’ll bookend this post by answering a question that seems logical to wrap up. We’ve looked at what the error log is, where you find it, how you view it, and how you interpret it. How do you clear it? And why would you want to?
Well, let’s answer that second question first.
Simply put, over the course of a lot of time, that log file is going to get pretty unwieldy. And at some point, you’re not going to need error messages from two years ago anymore. So you want to clear it out to clean up some disk space, either truncating it outright or backing up a copy somewhere else.
As for clearing the logs themselves, there’s an interesting issue to contend with there. As long as the server is running, it holds a handle to the file for writing. So you can’t just open it and start editing it, and you can’t just back it up and delete it.

Perhaps the simplest technique is to have root access and do something like this—overwriting the file contents with nothing. I’d suggest making a copy of the file first, though.
Alternatively, you can follow the instructions here, on Apache’s site, related to log rotation and piped logs. These are more involved but more “proper” and less hack-y solutions.
But however you approach clearing the logs or logging in general, my recommendation would be always to err on the side of preserving as much information as you possibly can.
Apache Error Log: No Longer a Stranger
Today’s post was another installment of our series that covers different aspects of logging. Thematically, this post doesn’t differ dramatically from the previous ones. After all, it covers the Apache error log, which is a special kind of log file. Structurally, though, this post was a novelty, since we’ve adopted a Q&A format for it.
Throughout the post, we’ve walked you through a list of common questions about the Apache error log. You’ve learned, among other things:
- what the Apache error log is
- where can you find it
- how to check the log
- the best way to visualize the log’s content
By now, you should have a solid grasp of the Apache error log fundamentals.
Hopefully, you can apply the knowledge you’ve obtained from this post to troubleshoot issues quickly, accessing the precious data contained on your apache log files and turning them into valuable insights for your organization.
Learn more about Scalyr by checking out a demo here.