What the manual doesn’t state is that log_errors_max_len refers only to the «body» of the error message. This means that a single line of error will still be greater than the length you set here.
To demonstrate, run this code using log_errors_max_len=0 (0 means unlimited) and log_errors=1:
<?php
// Set your server to these settings:
// error_reporting=-1
// date.timezone=utc ;to suppress the error message "It is not safe to rely on the system's timezone settings."...
echo$msg1; echo$msg2;
The bytes sent to error_log will be:
[15-Jul-2015 01:23:45 utc] PHP Notice: Undefined variable: msg1 in C:index.php on line 5
[15-Jul-2015 01:23:45 utc] PHP Notice: Undefined variable: msg2 in C:index.php on line 5
Next, test the same code with log_errors_max_len=4 and log_errors=1. (Remember to restart the server.) error_log will now be:
[15-Jul-2015 01:23:45 utc] PHP Notice: Unde in C:index.php on line 5
[15-Jul-2015 01:23:45 utc] PHP Notice: Unde in C:index.php on line 5
(Notice that your error message is prepended with «[15-Jul-2015 01:23:45 utc] PHP Notice:» and appended with «in C:index.php on line 1«, resulting in a line longer than what is set by log_errors_max_len.)
This issue occurs not just with error_log, but also with the server output sent to the client. To demonstrate, run the same code above using log_errors_max_len=4, display_errors=1, html_errors=0, error_prepend_string="PPPP", and error_append_string="AAAA". The output sent to the client is:
PPPP
Notice: Unde in C:index.php on line 5
AAAAPPPP
Notice: Unde in C:index.php on line 5
AAAA
Now run the same code using log_errors_max_len=4, display_errors=1, html_errors=1, error_prepend_string="PPPP", and error_append_string="AAAA". (error_prepend_string and error_append_string apply only to displayed errors, not logged errors.) The output sent to the client is:
PPPP<br />
<b>Notice</b>:  Unde in <b>C:index.php</b> on line <b>5</b><br />
AAAAPPPP<br />
<b>Notice</b>:  Unde in <b>C:index.php</b> on line <b>5</b><br />
AAAA
Also note that the above tests would return the same results even if you use ignore_repeated_errors=0. This shows that «repeated errors» are considered before the error messages are cropped.
(Your results may differ depending on the SAPI used. Above tests are done using php-5.6.7-Win32-VC11-x86 CLI on win 8.1.)
The SQL Server error log is a great source of information for DBAs for monitoring errors and the operation of the server. Greg Larsen explains the details and how to configure the SQL Server error log.
Most applications have a log of some sort that tracks activity. SQL Server is no different. It has a log file known as the error log for tracking what’s happening on an instance of SQL Server. Server. Each instance of SQL Server has its own set of error log files. In this article, I will discuss what the error log is, how SQL Server manages it, and where you can find it. I’ll also show you how to configure the SQL Server error log.
What is the error log?
The error log is a file that tracks what kind of activity is happening on an instance. The log is just a journal of events that have occurred on a SQL Server instance, in chronological order. The log doesn’t track everything, but it does track significant events and errors that occur while SQL Server is running. These errors could be informational only, warnings, as well as actual instance and application errors. You can find things like start up and shut down information, backup and restore commands, as well as custom application messages in the error log file. A DBA can also configure SQL Server to write additional logging, for example, logins and logouts. The error log is a great place to look for problems or potential problems associated with an instance of SQL Server.
The error log is not a single file but a series of files. Each time SQL Server starts up, a new error log file is created. A running instance of SQL Server writes to current log (the one created at startup) and by default has six archived error log files. If you need to keep more than six archived files, you can override the default to keep as many as you need (more on this later).
If an instance of SQL Server crashes or will not start for some reason, the error log is the place to go for troubleshooting these problems. As a DBA, you should periodically review the error log to look for potential problems. By reviewing the log, you might find some unusual things going on that might otherwise go unnoticed, like a backup job has failed or someone trying to hack the SA password.
Where can the error log files be found?
By default, the error log files are stored in the following location: Program FilesMicrosoft SQL ServerMSSQL<n>.<instance name>MSSQLLOGERRORLOG, where <n> is an archived version number, and <instance name> is the name of the instance. This is only the default location. Some instances might be set up to write their error log files to a different location. If the error log files are not in the default location, then there are a number of different ways to find them. I will show you two of those methods.
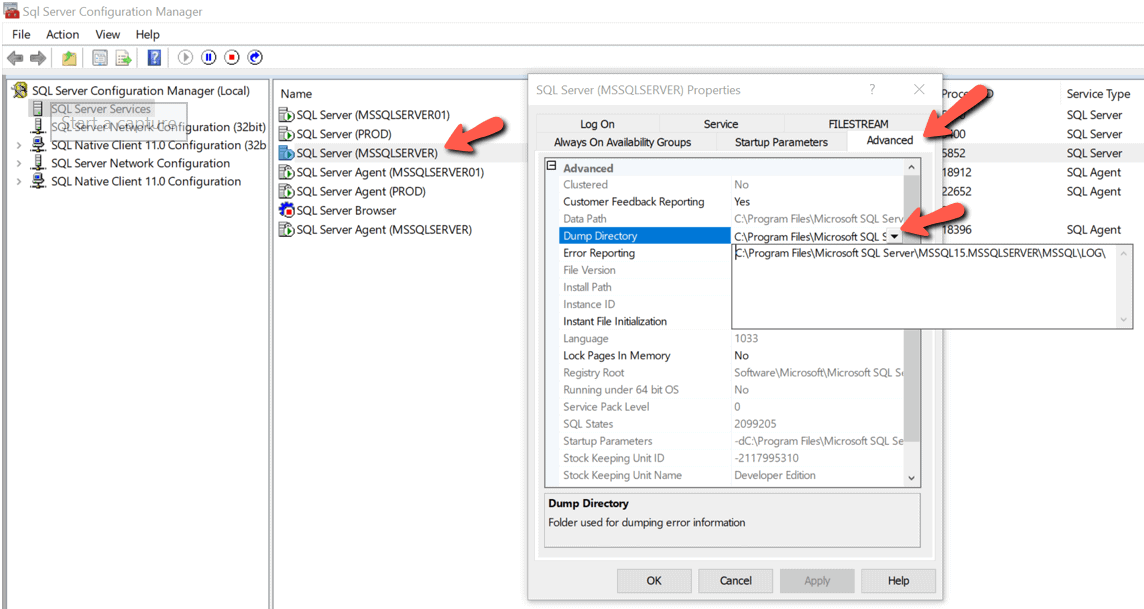
The first method is to use SQL Server Configuration Manager. To find the location of the log using this method, first, open up SQL Server Configuration Manager. Next double click on the instance of SQL Server that you want to locate the error log file location. Then click on the Advanced tab. The location of the error log file directory is identified in the Dump Directory item. To see the full name of the error log file directory, click on the little down error to the right of the Dump Directory item, as shown below in Figure 1.
Figure 1: Location of error log file directory in Configuration Manager
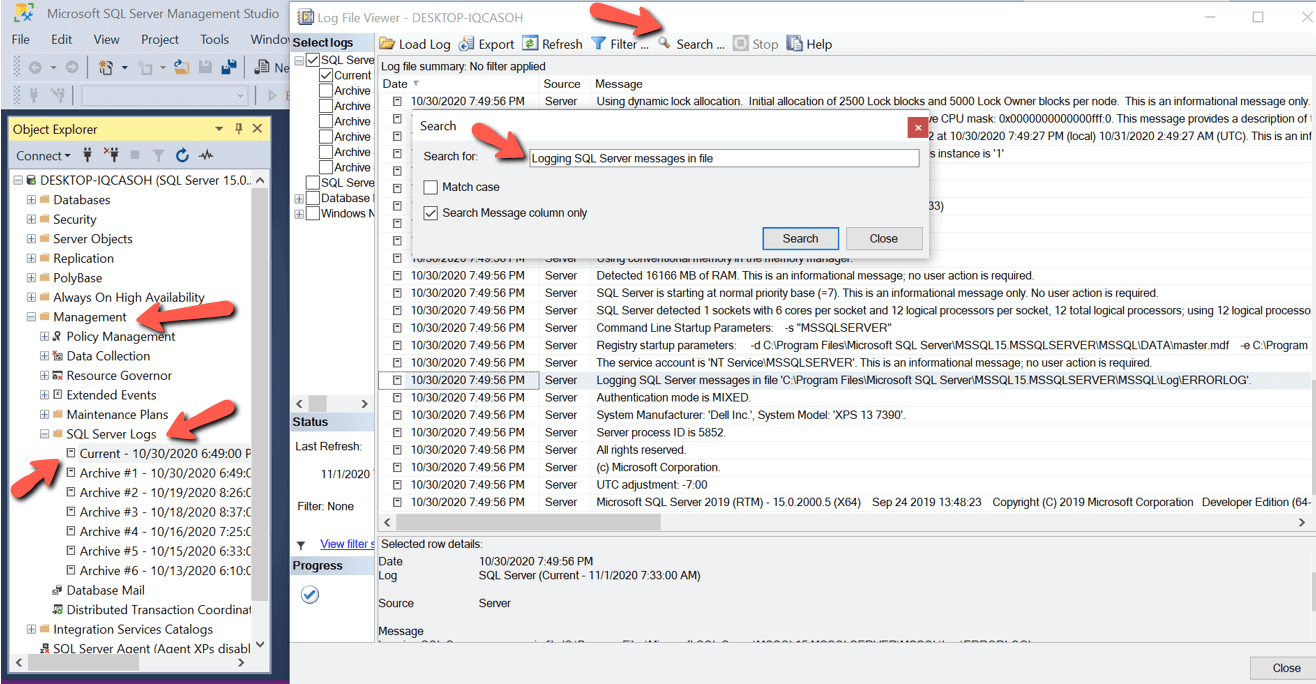
A second method to find the location of the error log files is to use SSMS to browse one of the error log files. To do this, you must connect to the instance of SQL Server in which you want to find the error log location with SSMS. Expand the Management item and the SQL Server Logs item. Then double-click on the Current error log file. When you do this, the Log File Viewer will be displayed. To find the error log file location you can either browse thru the log file until you find it or use the Search… option to find it. When using the search option, use the string Logging SQL Server messages in file as the search criteria. The image in Figure 2 shows these steps. The log location can be found in the line that is highlighted in the log.
Figure 2: Using SSMS to find the location of error log files
Types of error log files and their naming conventions
Each SQL Server instance has two different types of error log files. There is an error log file for the currently running instance and then a number of archived error log files.
All error log files names start with ERRORLOG. The error log for the running instance is called just ERRORLOG, whereas all other error log files names start with ERRORLOG but have a number for the file extension. The archived error log files are ERRORLOG.1, ERRORLOG.2, ERROLOG.3, … up to the number to the configured number of archived error log files. Where ERRORLOG.1 is most recently archived error log file, ERRORLOG.2 is the second most recently archived error log file, ERRORLOG.3 is the third most recently archived error log file, etc. If an instance is configured with the default number of error log files, then the last archived error log file is named ERRORLOG.6.
When an instance is restarted, the oldest archived error log file (ERRORLOG.6 if the default number is used) is deleted, then each of the remaining error log files is renamed. ERRORLOG.5 is renamed to ERRORLOG.6, ERROLOG.4 is renamed to ERRORLOG.5, etc. until ERRORLOG.1 is renamed to ERRORLOG.2. The last current error log file (ERRORLOG) is renamed to ERRORLOG.1, and the error log file for the newly started instance is created with the name ERRORLOG.
Changing the number and size of the error log
By default, an instance of SQL Server retains six archived error log files, and the size of each log file is unlimited. An unlimited size means it will grow as big as it needs to be, or until it runs out of disk space. You may find that these default setting are fine, but they can also be overridden.
How many archived error log files do you need and what is an appropriate maximum size? Like most SQL Server questions, the answer is “it depends.” Here, I will demonstrate how the number and size of the error logs might help or hinder your use of the error log files and share my personal opinion of how many log files I like to have.
First, let me explore the number of archived log files. I like to retain at least two months’ worth of error log files. By having multiple months of error log information, I can track trends from one month to the next. Keep in mind that depending on what is logged and the activity of an instance, two months’ worth of error log files might take up a lot of disk space.
There is no easy way to keep exactly two months’ worth of error log files since a new error log is created and the oldest archived one is deleted every time an instance is restarted. The number of months of error log files depends on how often SQL Server is restarted and the number of archived error log files that are kept. Suppose an instance is recycled frequently over a short period of time due to some maintenance activity. Error log information will be cycled off based on the configured value for the number of archived error log files that should be retained.
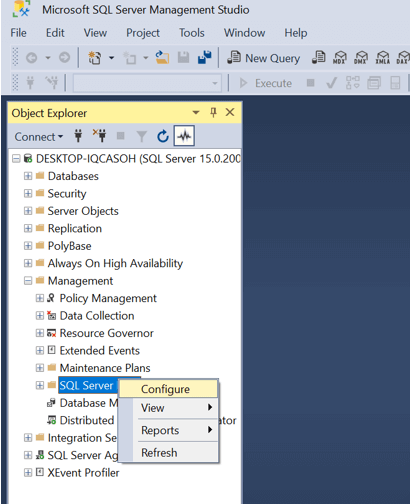
There a few different methods to change the error log file configuration, I’ll mention two of them. The first method is to use SSMS. To use this method, first connect to the instance, expand the Management folder, right click on the SQL Server Log folder and then select the Configure item from the menu displayed, as shown in Figure 3.
Figure 3: Bringing up the error log configuration screen
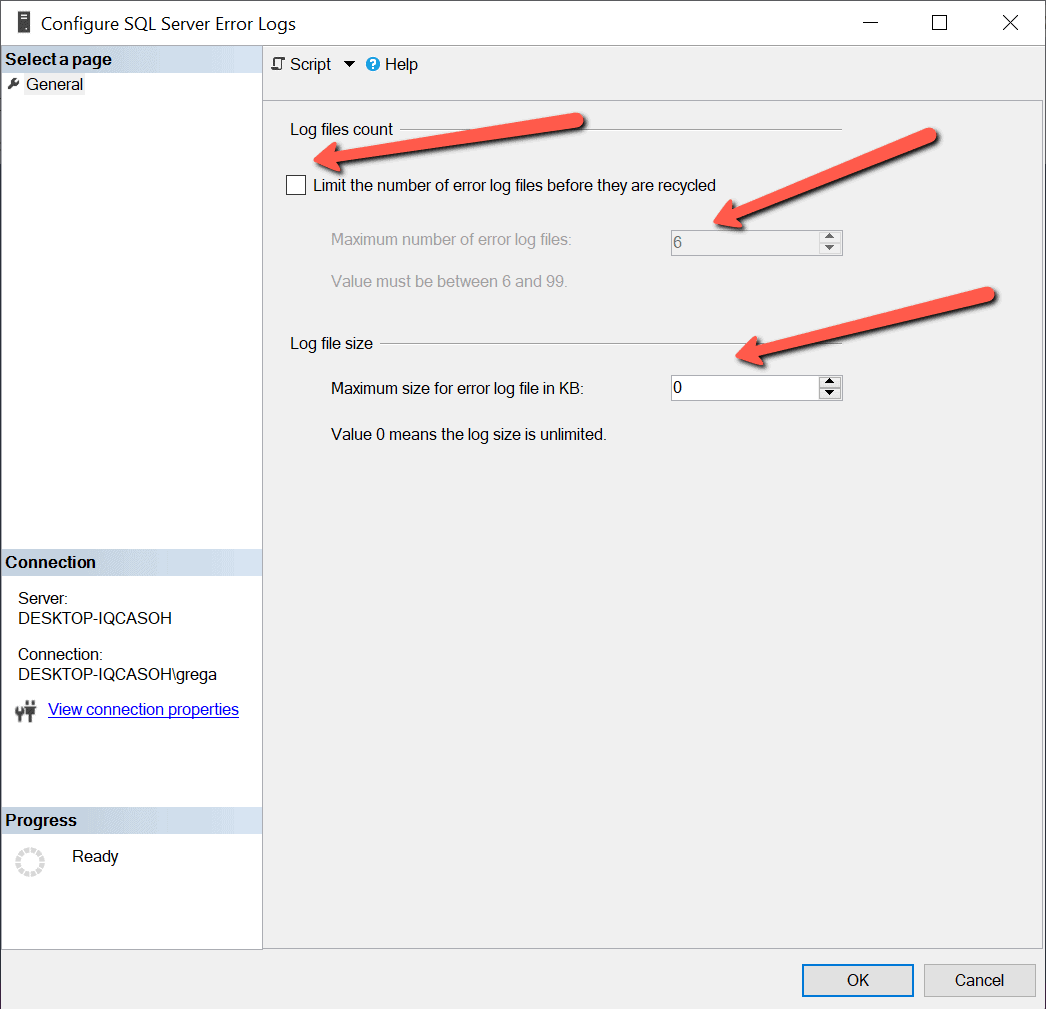
When clicking on Configure, the window shown in Figure 4 is displayed.
Figure 4; Configuration Options for the Error Log
By reviewing Figure 4, you can see that my instance is currently configured to retain 6 archived error log files and the maximum size of the error log file is set to be 0, which means unlimited.
To change the number of archived error log files to retrain, first click on the checkbox labeled Limit the number of error log files before they are recycled. Doing this will enable the Maximum number of error log files option, so the number of error logs to retain can be changed. Note the number of error log files to retrain needs to be between 6 and 99.
To set a maximum limit of each error log file, enter the desired size into the Maximum size of the error log file in KB. When the error log configuration is set to limit the size of the error log file, a new error log file will be created automatically after the current log file reaches the maximum size. I personally don’t like to limit the size of the log file, but keep in mind, having an unlimited size setting means each log file will be different sizes, whereas limiting the size would make every error log file the same size.
Issues with multiple restarts
When SQL Server is restarted, the oldest archived error log file is deleted, and a new one is created. This cycling of the error log every time SQL Server restarts normally isn’t a problem, unless it deletes an archived error log file automatically that contains information that is needed for troubleshooting or trend reporting.
Since the log file contains messages and errors related to an instance, it is crucial not to lose this information until you no longer need it. The problem with having the default number of archived error log files is you might lose valuable troubleshooting information if an instance is restarted more than six times over a short period of time. This can happen for a number of different reasons. I have seen nighttime operations staff and DBAs restart an instance multiple times in an attempt to get an instance that has crashed back up and running. Suppose an instance of SQL Server is restarted multiple times without review of the error log files. The restarts might inadvertently cycle off the one critical error log file containing the error messages related to the crash. For this reason, it is important to configure SQL Server to retain enough archived error log files so they are not automatically deleted until they are no longer needed.
Keep in mind that cycling off a critical error log file is a rare situation. However, if an error log file that has valuable information about a crash is cycled off, it does hamper your troubleshooting options. Therefore, it is wise to have someone review the error log, or at least copy the error log file to a backup location after a crash to make sure you have all the log files to help with troubleshooting. At least by copying off the error log file after a crash, you can guarantee it will not be cycled off if lots of restarts are performed.
Cycling the ERRORLOG
A new error log is created every time SQL Server is restarted. Sometimes SQL Server stays up for weeks or even months before an instance is restarted. When an instance has been running for a long time, the error log will be quite large. It’s hard to review and find errors in large log files, especially when they contain error messages that could cover long periods of time.
To help keep the error log files from spanning months’ worth of messages without recycling, you can cycle the error log with a command. Cycling the error log will close the current log and create a new one. The code in Listing 1 uses the system stored procedure sp_cycle_errorlog to cycle the error log file.
Listing 1: Cycling the errorlog.
To execute the sp_cycle_errorlog system stored procedure, you need to be a member of the sysadmin fixed server role. Stored procedure sp_cycle_errorlog takes no parameters and returns a 0 if the error log is successfully recycled and a 1 if the cycling of the log has failed.
Error log file
The error log file contains messages and errors associated with a SQL Server instance. It is a valuable tool for troubleshooting problems with SQL Server as well as auditing what goes on within an instance of SQL Server. A DBA can configure SQL Server to store the error logs wherever they’d like and adjust the configuration to keep as many archived error log files as needed. As a DBA you should review this log every time SQL Server crashes and as part of your daily and weekly system checks. This review will ensure that SQL Server is functioning normally, with no unexpected errors showing up in the log.
Sql Server Error Log files contain informational messages, warnings, critical server events, auditing information etc. And this information in the log file is very critical for analyzing any Sql Server issues.
If proper steps towards the maintenance of the Sql Server Error Logs is not take then the error log file size may grow very large making it time consuming and difficult to analyze the issues. And also if proper maintenance is not taken care we lose the history of the error logs. This article explains the various maintenance strategies for the Error Logs.
In Sql Server by default there will be one current error log file i.e. ERRORLOG and six archived log files ERRORLOG.1 (i.e. Archive #1), ERRORLOG.2 (i.e. Archive #2), …. & ERRORLOG.6 (Archive #6). Each time the Sql Server restarts, the last Archive #6 (i.e. ERRORLOG.6) is deleted, Archive #5 is moved as Archive #6 (i.e. ERRORLOG.5 -> ERRORLOG.6), Archive #4 is moved as Archive #5 (i.e. ERRORLOG.4 -> ERRORLOG.5) and So on. Current Error Log (i.e. ERRORLOG) is moved as Archive #1 (i.e. ERRORLOG -> ERRORLOG.1). And a new current error log file (i.e. ERRORLOG) is created.
1. Recycling or Re-Initializing the Error Log file.
In Sql Server by default the Error Log files are recycled only when the Sql Server Service is restarted. Otherwise, it will keep appending the errors, warnings, information etc to the same current error log file i.e. ERRORLOG. If Sql Server service restart is a rare event then the current log file will be of very huge size.
Sql Server provides a mechanism where we don’t need to restart the service to recycle the error logs, instead we can execute the system stored procedure SP_CYCLE_ERRORLOG to reinitialize the error logs.
EXECUTE SP_CYCLE_ERRORLOG
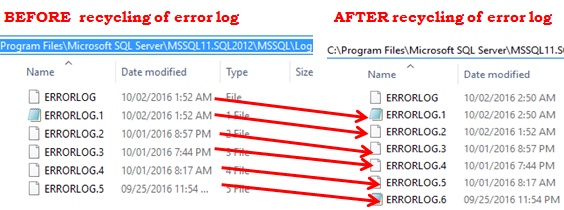
Below image shows the Sql Server Error Logs folder view with the Error log files before and after recycling the error logs by executing the stored procedure SP_CYCLE_ERRORLOG
Below image shows the SSMS Sql Server Logs view before and after recycling the error logs by executing the stored procedure SP_CYCLE_ERRORLOG
So, it is a good strategy to create a Schedule Job which executes daily or at some frequency to recycle the error logs by executing the system stored procedure SP_CYCLE_ERRORLOG.
2. Increasing the number of Sql Server Error Logs files
By default as explained above Sql Server will have one Current Sql Server Log file and 6 Archived error log files. If we are recycling the error logs daily, then at any given point in time we will have the history of the error logs of the last 6 days excluding the current day.
Sql Server provides a mechanism where we can increase the number of archived error log files from the default 6 to any number between 6 to 99.
Follow the following steps to change the number of archived error log files.
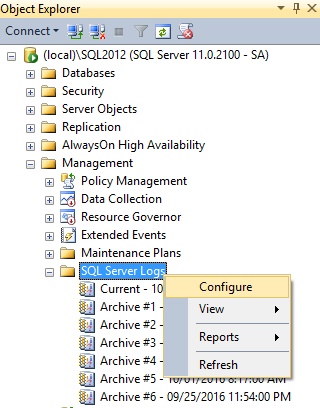
Step 1: In the SSMS object explorer expand the Management folder and then right click on the Sql Server Logs folder and from the context menu click on the Configure option.
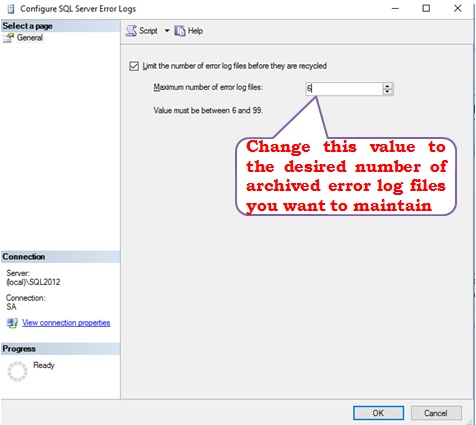
Step 2: In the Sql Server Error Logs configuration window as shown in the below image change the Maximum number of error log files from the default 6 to the desired number of error log files that you want to maintain.
You can as-well change the number of Sql Server Error Logs files by executing the following statement. I have tested it in Sql Server 2012 and it worked for me.
EXECUTE SYS.XP_INSTANCE_REGWRITE
	N'HKEY_LOCAL_MACHINE' ,
	N'SoftwareMicrosoftMSSQLServerMSSQLServer' ,
	N'NumErrorLogs' ,
	REG_DWORD ,
	99
3. Limiting the Size of the Sql Server Error Logs file
In Sql Server 2012 on wards we can set the maximum size of the each Sql Server Error Log file. For example we can execute the following script in Sql Server 2012, to set the maximum size of each error log file as 10 MB. Setting this value to 10 MB makes sure that the error logs are recycled each time the current log file reaches the 10 MB size.
EXEC SYS.XP_INSTANCE_REGWRITE
	N'HKEY_LOCAL_MACHINE',
	N'SoftwareMicrosoftMSSQLServerMSSQLServer',
	N'ErrorLogSizeInKb',
	REG_DWORD,
	10240
4. Changing the Sql Server Error Logs folder location
By default Sql Server ErrorLog files are located in the same drive/path which is used/selected during Sql Server Installation. You may like to store Sql Server Error log files in a drive or path which is other than the one used for Sql Server installation, to avoid filling up of that particular drive. To change the Sql Server ErrorLog files location you may like to read the article: How to change Sql Server ErrorLog files location
В журналах событий Windows хранится полезная информация, которая нужна при анализе состояния служб и приложений в Windows, отладки ошибок и аварийный ситуаций, аудите различных событий безопасности. По умолчанию для журналов Event Viewer в Windows заданы максимальные размеры, при достижении которых новые события начинают перезаписывать более старые. Если на вход Event Viewer попадает слишком большое количество событий, может случится, что в журнал помещаются события лишь за последние несколько часов, что может быть не достаточно.
Чтобы предотвратить перезапись старых событий и всегда иметь под рукой события за достаточно большой промежуток времени, вы можете увеличить максимальный размер журналов Event Viewer.
Содержание:
- Получить информацию о журналах событий Windows с помощью PowerShell
- Изменить размер журнала событий из консоли Event Viewer
- Увеличить размер журнала событий Windows через GPO
Получить информацию о журналах событий Windows с помощью PowerShell
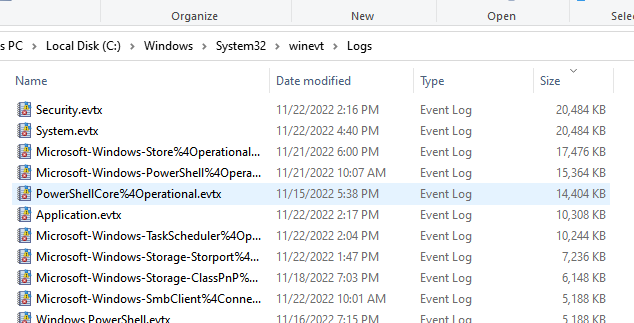
Файлы журналы событий Windows хранятся в каталог
%SystemRoot%System32WinevtLogs
в виде файлов с расширением .EVTX. Обратите внимание, что для каждого журнала используется собственный файл. Соответственно, вы можете управлять размерами только того лога Windows, который вам нужен и оставить остальные значения по-умолчанию.
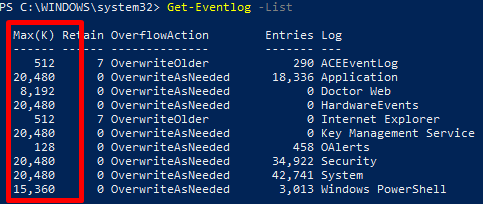
Текущие лимиты на все включенные журналы событий в Windows можно вывести с помощью PowerShell:
Get-Eventlog -List
Вы можно вывести размер определенного лога с помощью командлета Get-WinEvent. Например, получим текущий и максимальный размер журнала Security:
Get-WinEvent -ListLog Security| Select MaximumSizeInBytes, FileSize, IsLogFull, OldestRecordNumber, IsEnabled, LogMode
Суммарный размер паки с файлами журналов событий можно получить с помощью PowerShell:
«{0:N2} MB» -f ((gci c:windowsSystem32WinevtLogs| measure Length -s).sum / 1Mb)
Чтобы увеличить максимальный размер лога, можно использовать утилиту wevtutul (новый размер задается в Кб):
wevtutil sl "Application" /ms:200000
Или с помощью PowerShell:
Limit-Eventlog -Logname Application -MaximumSize 200MB -OverflowAction OverwriteOlder
Изменить размер журнала событий из консоли Event Viewer
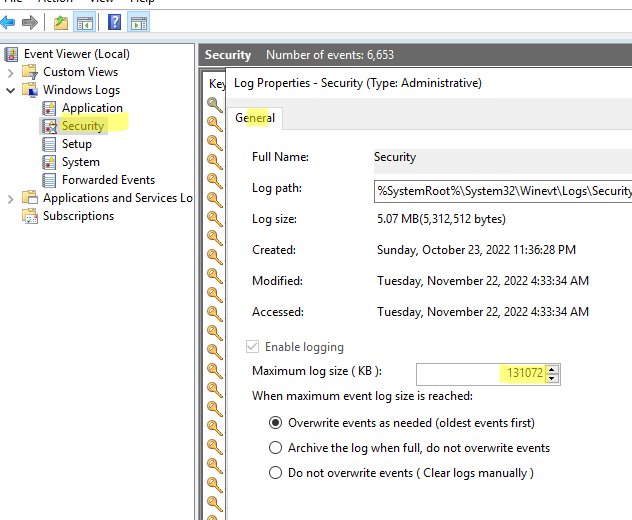
Проще всего увеличить максимальный размер журнала прямо из консоли Event Viewer.
- Откройте
eventvwr.msc
; - Найдите в консоли свойства нужного журнала и откройте его свойства (например, Security);
- Задайте ограничение в разделе Maximum log size (KB) и сохраните изменения;
- Здесь же можно изменить поведение при достижение максимального размера:
Owerwrite events as needed (oldest events first) – этот режим исопльзуется по умолчанию. Новые события просто перезаписывают более старые.
Archive the log when full, do not owerwrite events – текущий журнал событий при заполнении архивируется в папке System32WinevtLogs и новые события записываются в новый evtx файл. Архивные файлы событий можно открыть через меню Open Saved Log в Event Viewer.
Do not owerwrite events (Clear log manually) – события никогда не перезатираются. Для записи новых событий нужно очистить журнал.
Увеличить размер журнала событий Windows через GPO
Чтобы централизованно управлять размерами журналов событий на компьютерах или серверах в домене Active Directory, можно использовать групповые политики.
- Запустите консоль Group Policy Management (
gpmc.msc
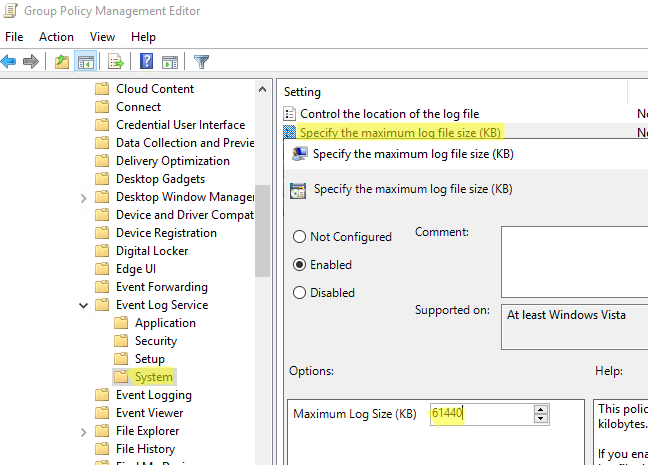
), создайте новую GPO и назначьте на OU с компьютерами или серверами, для которых вы хотите изменить настройки Event Viewer (или назначьте GPO на корень домена); - Перейдите в раздел GPO Computer Configuration -> Policies -> Administrative Templates -> Windows Components -> Event Log Service. Как вы видите, в этом ветке есть подразделы для управления базовыми журналами Windows:
Application
Security
Setup
System
- Чтобы увеличить максимальный размер любого из журналов, откройте параметр Specify the maximum log file size (KB), включите его и задайте нужный вам размер;
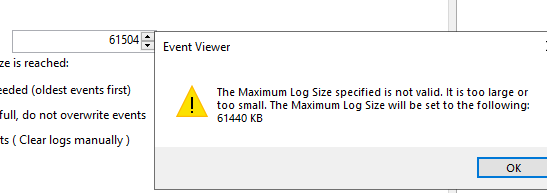
- Обновите настройки политики на клиентах и проверьте, что в свойствах журнала теперь указан новый размер, который вы не можете изменить. При попытке задать другой размер появится ошибка:
Event Viewer
The Maximum Log Size specified is not valid. It is too large or too small. The Maximum Log Size will be set to the following: 61440 KB
Обратите внимание, что в описанном выше разделе GPO отсутствуют настройки для других журналов из раздела Applications and Services Logs -> Microsoft.Если вам нужно увеличить размер любого другого журнала событий (кроме стандартного), это можно сделать через реестр. Настройки журналов событий Windows хранятся в разделе реестра HKEY_LOCAL_MACHINESYSTEMCurrentControlSetServicesEventLog<log_name>. Размер журнала задается с помощью параметра MaxSize (тип REG_DWORD). Вы можете распространить нужное вам значение параметра реестра MaxSize на компьютеры домена с помощью Group Policy Preferences.
Подробнее о настройке ключей и параметров реестра через GPO здесь.
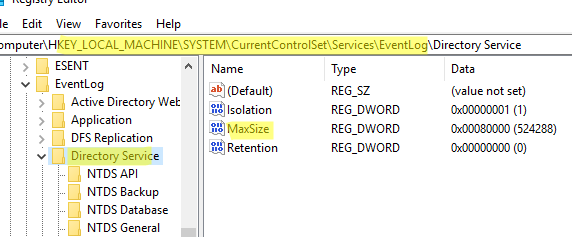
В этом примере мы увеличим размер журнала Directory Service на контроллерах домена. Настройки этого лога хранятся в ветке HKLMSYSTEMCurrentControlSetServicesEventLogDirectory Service.
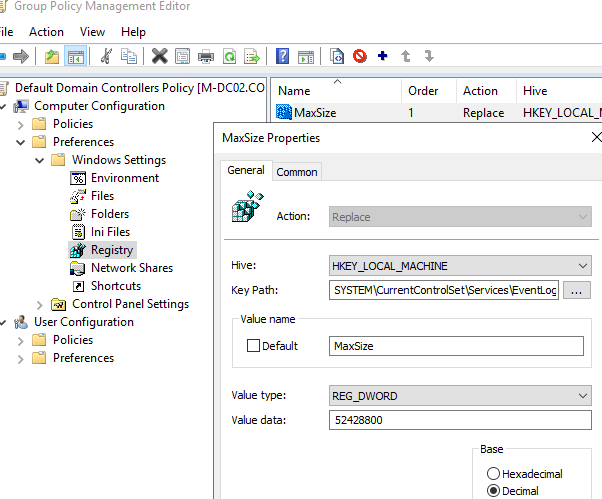
- Откройте GPO и перейдите в раздел Computer Configuration -> Preferences -> Windows Settings -> Registry;
- Выберите New -> Registry Item;
- Создайте новый параметр со следующими настройками:
Hive: HKEY_LOCAL_MACHINE
Key path: SYSTEMCurrentControlSetServicesEventLogDirectory Service
Value name: MaxSize
Value type: REG_DWORD
Value data: 52428800 (значение задается в байтах. В нашем примере это 50 Мб)
- Проверьте, что после обновления GPO на DC увеличится максимальный размер журнала.
Например, если вам нужно хранить историю RDP подключений к RDS хосту за продолжительное время, нужно увеличить размер лога Terminal-Services-RemoteConnectionManager.
За счет увеличения размеров журналов событий Windows вы можете получить различную информацию за более длительный промежуток времени. Например, из журналов событий можно получить историю перезагрузок Windows, понять кто удалил файл в сетевой папке или кто изменил NTFS права доступа.
MySQL Server generates several logs that can help you monitor the activities of the server. However, once these logs are enabled, they can grow in size and start taking up too much disk space. This is why it’s important to have an automated way of archiving and preserving MySQL log files for a certain duration, as well as deleting the old ones. In this blog post, we describe some best practices for setting up and managing MySQL error logs, general logs and slow query logs for your MySQL deployments.
Setting Up MySQL Server Logging
Let’s look at how to setup the following 3 types of logs:
Error Log
Logs all the problems encountered during starting, running, or stopping mysqld. This log can be enabled by having the following option in /etc/my.cnf file:
- log_error=/var/log/mysql/mysqld.log
General Query Log
Logs established client connections and statements received from clients. This log can be enabled by having the following option in /etc/my.cnf file:
- general_log=ON
- general_log_file=/var/log/mysql/general.log
Slow Query Log
Logs queries that took more than long_query_time seconds to execute. This log can be enabled by the following option in /etc/my.cnf file:
- slow_query_log=ON
- slow_query_log_file=/var/log/mysql/mysql-slowquery.log
Setting Up Criteria For Log Rotation
As an example, let’s have some criteria for managing general MySQL query logs. We can come up with a suitable set of criteria for log management by asking the following questions:
Q: What is the maximum size that the log file can grow?
A: Let’s say it can grow up to 300 MB after which it needs to be rotated and compressed.
Q: What is the frequency that you want the log file to be rotated?
A: We can say that we want logs to be rotated on a daily basis.
Q: How many old log files you want to retain?
A: We would like to retain the last 30 log files.
Based on the above criteria, the overall disk space required for general query log management is about 1.2 GB. Assuming a 90% compression ratio – we will have 30 compressed log files of size 30 MB each and a live log file of about 300 MB.
Managing MySQL Server Logs: Rotate, Compress, Retain & DeleteClick To Tweet
Managing The Logs Using Linux logrotate Utility
logrotate is a Linux utility that helps with the efficient administration of log files and provides options for automatic rotation, compression, and removal of log files. The criteria established above can be configured for logrotate utility by creating a configuration file in the /etc/logrotate.d folder.
Let’s call this configuration file mysqlgeneral and the contents of the file will be:
/var/log/mysql/general.log{
        compress
        dateext
        maxsize 300M
        copytruncate
        maxage 365
        dateformat -%Y%m%d%s
        daily
        rotate 30
        notifempty
}
With the above options for logrotate, the general query logs get rotated either on a daily basis or when the log file size exceeds 300 MB. The old logs are compressed and 30 such files will be preserved. Log rotation will be skipped if the log file is empty due to the setting ‘notifempty’.
The ‘copytruncate’ option is to ensure that current log file is never deleted during rotation and only its contents get truncated. This is important since some applications expect that the log file is always available and it’s not possible to delete the log without stopping the application first.
Now that the log rotation configuration is set for the general query log, the logrotate utility has to be run so that the above configuration is executed. This is typically done through a cron job. We can set this to be running every hour by placing the logrotate script in /etc/cron.hourly directory:
#!/bin/sh

/usr/sbin/logrotate /etc/logrotate.conf
EXITVALUE=$?
if [ $EXITVALUE != 0 ]; then
    /usr/bin/logger -t logrotate "ALERT exited abnormally with [$EXITVALUE]"
fi
exit 0
So, with a few simple steps, we have set up log rotation for MySQL general logs based on our criteria. The same approach can be followed for MySQL error logs and slow query logs as well. Check out these other posts to learn more about optimizing your MySQL deployments:
- Calculating InnoDB Buffer Pool Size for your MySQL Server
- MySQL Tutorial – Configuring and Managing SSL On Your MySQL Server
- MySQL High Availability Framework Explained – Part I: Introduction



 Event Viewer