Основная функциональность
Пример конфигурации
user www www;
worker_processes 2;

error_log /var/log/nginx-error.log info;

events {
    use kqueue;
    worker_connections 2048;
}

...
Директивы
| Синтаксис: |
accept_mutex
|
|---|---|
| Умолчание: |
accept_mutex off; |
| Контекст: |
events
|
Если accept_mutex включён,
рабочие процессы будут принимать новые соединения по очереди.
В противном случае о новых соединениях будет сообщаться сразу всем рабочим
процессам, и при низкой интенсивности поступления новых соединений
часть рабочих процессов может работать вхолостую.
Нет необходимости включать
accept_mutex
на системах, поддерживающих
флаг EPOLLEXCLUSIVE (1.11.3), или
при использовании reuseport.
До версии 1.11.3 по умолчанию использовалось значение
on.
| Синтаксис: |
accept_mutex_delay
|
|---|---|
| Умолчание: |
accept_mutex_delay 500ms; |
| Контекст: |
events
|
При включённом accept_mutex задаёт максимальное время,
в течение которого рабочий процесс вновь попытается начать принимать
новые соединения, если в настоящий момент новые соединения принимает
другой рабочий процесс.
| Синтаксис: |
daemon
|
|---|---|
| Умолчание: |
daemon on; |
| Контекст: |
main
|
Определяет, будет ли nginx запускаться в режиме демона.
Используется в основном для разработки.
| Синтаксис: |
debug_connection
|
|---|---|
| Умолчание: |
— |
| Контекст: |
events
|
Включает отладочный лог для отдельных клиентских соединений.
Для остальных соединений используется уровень лога, заданный директивой
error_log.
Отлаживаемые соединения задаются IPv4 или IPv6 (1.3.0, 1.2.1)
адресом или сетью.
Соединение может быть также задано при помощи имени хоста.
Отладочный лог для соединений через UNIX-сокеты (1.3.0, 1.2.1)
включается параметром “unix:”.
events {
    debug_connection 127.0.0.1;
    debug_connection localhost;
    debug_connection 192.0.2.0/24;
    debug_connection ::1;
    debug_connection 2001:0db8::/32;
    debug_connection unix:;
    ...
}
Для работы директивы необходимо сконфигурировать nginx с параметром
--with-debug,
см. “Отладочный лог”.
| Синтаксис: |
debug_points
|
|---|---|
| Умолчание: |
— |
| Контекст: |
main
|
Эта директива используется для отладки.
В случае обнаружения внутренней ошибки, например, утечки сокетов в момент
перезапуска рабочих процессов, включение debug_points
приводит к созданию core-файла (abort)
или остановке процесса (stop) с целью последующей
диагностики с помощью системного отладчика.
| Синтаксис: |
env
|
|---|---|
| Умолчание: |
env TZ; |
| Контекст: |
main
|
По умолчанию nginx удаляет все переменные окружения, унаследованные
от своего родительского процесса, кроме переменной TZ.
Эта директива позволяет сохранить часть унаследованных переменных,
поменять им значения или же создать новые переменные окружения.
Эти переменные затем:
-
наследуются во время
обновления исполняемого файла на лету; -
используются модулем
ngx_http_perl_module; -
используются рабочими процессами.
Следует иметь в виду, что управление поведением системных библиотек
подобным образом возможно не всегда, поскольку зачастую библиотеки используют
переменные только во время инициализации, то есть ещё до того, как их
можно задать с помощью данной директивы.
Исключением из этого является упомянутое выше
обновление исполняемого файла на лету.
Если переменная TZ не описана явно, то она всегда наследуется
и всегда доступна модулю
ngx_http_perl_module.
Пример использования:
env MALLOC_OPTIONS;
env PERL5LIB=/data/site/modules;
env OPENSSL_ALLOW_PROXY_CERTS=1;
Переменная окружения NGINX используется для внутренних целей nginx
и не должна устанавливаться непосредственно самим пользователем.
| Синтаксис: |
error_log
|
|---|---|
| Умолчание: |
error_log logs/error.log error; |
| Контекст: |
main, http, mail, stream, server, location
|
Конфигурирует запись в лог.
На одном уровне конфигурации может использоваться несколько логов (1.5.2).
Если на уровне конфигурации main запись лога в файл
явно не задана, то используется файл по умолчанию.
Первый параметр задаёт файл, который будет хранить лог.
Специальное значение stderr выбирает стандартный файл ошибок.
Запись в syslog настраивается указанием префикса
“syslog:”.
Запись в
кольцевой буфер в памяти
настраивается указанием префикса “memory:” и
размера буфера и как правило используется для отладки (1.7.11).
Второй параметр определяет уровень лога
и может принимать одно из следующих значений:
debug, info, notice,
warn, error, crit,
alert или emerg.
Уровни лога, указанные выше, перечислены в порядке возрастания важности.
При установке определённого уровня в лог попадают все сообщения
указанного уровня и уровней большей важности.
Например, при стандартном уровне error в лог попадают
сообщения уровней error, crit,
alert и emerg.
Если этот параметр не задан, используется error.
Для работы уровня лога
debugнеобходимо сконфигурировать
nginx с--with-debug,
см. “Отладочный лог”.
Директива может быть указана на
уровнеstream
начиная с версии 1.7.11
и на уровне
начиная с версии 1.9.0.
| Синтаксис: |
events { ... }
|
|---|---|
| Умолчание: |
— |
| Контекст: |
main
|
Предоставляет контекст конфигурационного файла, в котором указываются
директивы, влияющие на обработку соединений.
| Синтаксис: |
include
|
|---|---|
| Умолчание: |
— |
| Контекст: |
любой
|
Включает в конфигурацию другой файл или файлы,
подходящие под заданную маску.
Включаемые файлы должны содержать синтаксически верные директивы и блоки.
Пример использования:
include mime.types;
include vhosts/*.conf;
| Синтаксис: |
load_module
|
|---|---|
| Умолчание: |
— |
| Контекст: |
main
|
Эта директива появилась в версии 1.9.11.
Загружает динамический модуль.
Пример:
load_module modules/ngx_mail_module.so;
| Синтаксис: |
lock_file
|
|---|---|
| Умолчание: |
lock_file logs/nginx.lock; |
| Контекст: |
main
|
Для реализации accept_mutex и сериализации доступа к
разделяемой памяти nginx использует механизм блокировок.
На большинстве систем блокировки реализованы с помощью атомарных
операций, и эта директива игнорируется.
Для остальных систем применяется механизм файлов блокировок.
Эта директива задаёт префикс имён файлов блокировок.
| Синтаксис: |
master_process
|
|---|---|
| Умолчание: |
master_process on; |
| Контекст: |
main
|
Определяет, будут ли запускаться рабочие процессы.
Эта директива предназначена для разработчиков nginx.
| Синтаксис: |
multi_accept
|
|---|---|
| Умолчание: |
multi_accept off; |
| Контекст: |
events
|
Если multi_accept выключен, рабочий процесс
за один раз будет принимать только одно новое соединение.
В противном случае рабочий процесс
за один раз будет принимать сразу все новые соединения.
Директива игнорируется в случае использования метода обработки соединений
kqueue, т.к. данный метод сам сообщает
число новых соединений, ожидающих приёма.
| Синтаксис: |
pcre_jit
|
|---|---|
| Умолчание: |
pcre_jit off; |
| Контекст: |
main
|
Эта директива появилась в версии 1.1.12.
Разрешает или запрещает использование JIT-компиляции (PCRE JIT)
для регулярных выражений, известных на момент парсинга конфигурации.
Использование PCRE JIT способно существенно ускорить обработку
регулярных выражений.
Для работы JIT необходима библиотека PCRE версии 8.20 или выше,
собранная с параметром конфигурации--enable-jit.
При сборке библиотеки PCRE вместе с nginx (--with-pcre=),
для включения поддержки JIT необходимо использовать параметр
конфигурации--with-pcre-jit.
| Синтаксис: |
pid
|
|---|---|
| Умолчание: |
pid logs/nginx.pid; |
| Контекст: |
main
|
Задаёт файл, в котором будет храниться номер (PID) главного процесса.
| Синтаксис: |
ssl_engine
|
|---|---|
| Умолчание: |
— |
| Контекст: |
main
|
Задаёт название аппаратного SSL-акселератора.
| Синтаксис: |
thread_pool
|
|---|---|
| Умолчание: |
thread_pool default threads=32 max_queue=65536; |
| Контекст: |
main
|
Эта директива появилась в версии 1.7.11.
Задаёт имя и параметры пула потоков,
используемого для многопоточной обработки операций чтения и отправки файлов
без блокирования
рабочего процесса.
Параметр threads
задаёт число потоков в пуле.
Если все потоки из пула заняты выполнением заданий,
новое задание будет ожидать своего выполнения в очереди.
Параметр max_queue ограничивает число заданий,
ожидающих своего выполнения в очереди.
По умолчанию в очереди может находиться до 65536 заданий.
При переполнении очереди задание завершается с ошибкой.
| Синтаксис: |
timer_resolution
|
|---|---|
| Умолчание: |
— |
| Контекст: |
main
|
Уменьшает разрешение таймеров времени в рабочих процессах, за счёт
чего уменьшается число системных вызовов gettimeofday().
По умолчанию gettimeofday() вызывается после каждой
операции получения событий из ядра.
При уменьшении разрешения gettimeofday() вызывается только
один раз за указанный интервал.
Пример использования:
timer_resolution 100ms;
Внутренняя реализация интервала зависит от используемого метода:
-
фильтр
EVFILT_TIMERпри использованииkqueue; -
timer_create()при использованииeventport; -
и
setitimer()во всех остальных случаях.
| Синтаксис: |
use
|
|---|---|
| Умолчание: |
— |
| Контекст: |
events
|
Задаёт метод, используемый для
обработки соединений.
Обычно нет необходимости задавать его явно, поскольку по умолчанию
nginx сам выбирает наиболее эффективный метод.
| Синтаксис: |
user
|
|---|---|
| Умолчание: |
user nobody nobody; |
| Контекст: |
main
|
Задаёт пользователя и группу, с правами которого будут работать
рабочие процессы.
Если группа не задана, то используется группа, имя
которой совпадает с именем пользователя.
| Синтаксис: |
worker_aio_requests
|
|---|---|
| Умолчание: |
worker_aio_requests 32; |
| Контекст: |
events
|
Эта директива появилась в версиях 1.1.4 и 1.0.7.
При использовании aio
совместно с методом обработки соединений
epoll,
задаёт максимальное число ожидающих обработки операций
асинхронного ввода-вывода для одного рабочего процесса.
| Синтаксис: |
worker_connections
|
|---|---|
| Умолчание: |
worker_connections 512; |
| Контекст: |
events
|
Задаёт максимальное число соединений, которые одновременно
может открыть рабочий процесс.
Следует иметь в виду, что в это число входят все соединения
(в том числе, например, соединения с проксируемыми серверами),
а не только соединения с клиентами.
Стоит также учитывать, что фактическое число одновременных
соединений не может превышать действующего ограничения на
максимальное число открытых файлов,
которое можно изменить с помощью worker_rlimit_nofile.
| Синтаксис: |
worker_cpu_affinity worker_cpu_affinity
|
|---|---|
| Умолчание: |
— |
| Контекст: |
main
|
Привязывает рабочие процессы к группам процессоров.
Каждая группа процессоров задаётся битовой маской
разрешённых к использованию процессоров.
Для каждого рабочего процесса должна быть задана отдельная группа.
По умолчанию рабочие процессы не привязаны к конкретным процессорам.
Например,
worker_processes    4;
worker_cpu_affinity 0001 0010 0100 1000;
привязывает каждый рабочий процесс к отдельному процессору, тогда как
worker_processes    2;
worker_cpu_affinity 0101 1010;
привязывает первый рабочий процесс к CPU0/CPU2,
а второй — к CPU1/CPU3.
Второй пример пригоден для hyper-threading.
Специальное значение auto (1.9.10) позволяет
автоматически привязать рабочие процессы к доступным процессорам:
worker_processes auto;
worker_cpu_affinity auto;
С помощью необязательной маски можно ограничить процессоры,
доступные для автоматической привязки:
worker_cpu_affinity auto 01010101;
Директива доступна только на FreeBSD и Linux.
| Синтаксис: |
worker_priority
|
|---|---|
| Умолчание: |
worker_priority 0; |
| Контекст: |
main
|
Задаёт приоритет планирования рабочих процессов подобно тому,
как это делается командой nice: отрицательное
число
означает более высокий приоритет.
Диапазон возможных значений, как правило, варьируется от -20 до 20.
Пример использования:
worker_priority -10;
| Синтаксис: |
worker_processes
|
|---|---|
| Умолчание: |
worker_processes 1; |
| Контекст: |
main
|
Задаёт число рабочих процессов.
Оптимальное значение зависит от множества факторов, включая
(но не ограничиваясь ими) число процессорных ядер, число
жёстких дисков с данными и картину нагрузок.
Если затрудняетесь в выборе правильного значения, можно начать
с установки его равным числу процессорных ядер
(значение “auto” пытается определить его
автоматически).
Параметр
autoподдерживается только начиная
с версий 1.3.8 и 1.2.5.
| Синтаксис: |
worker_rlimit_core
|
|---|---|
| Умолчание: |
— |
| Контекст: |
main
|
Изменяет ограничение на наибольший размер core-файла
(RLIMIT_CORE) для рабочих процессов.
Используется для увеличения ограничения без перезапуска главного процесса.
| Синтаксис: |
worker_rlimit_nofile
|
|---|---|
| Умолчание: |
— |
| Контекст: |
main
|
Изменяет ограничение на максимальное число открытых файлов
(RLIMIT_NOFILE) для рабочих процессов.
Используется для увеличения ограничения без перезапуска главного процесса.
| Синтаксис: |
worker_shutdown_timeout
|
|---|---|
| Умолчание: |
— |
| Контекст: |
main
|
Эта директива появилась в версии 1.11.11.
Задаёт таймаут в секундах для плавного завершения рабочих процессов.
По истечении указанного времени
nginx попытается закрыть все открытые соединения
для ускорения завершения.
| Синтаксис: |
working_directory
|
|---|---|
| Умолчание: |
— |
| Контекст: |
main
|
Задаёт каталог, который будет текущим для рабочего процесса.
Основное применение — запись core-файла, в этом случае рабочий
процесс должен иметь права на запись в этот каталог.
In this tutorial, you will learn everything you need to know about logging in
NGINX and how it can help you troubleshoot and quickly resolve any problem you
may encounter on your web server. We will discuss where the logs are stored and
how to access them, how to customize their format, and how to centralize them in
one place with Syslog or a log management service.
Here’s an outline of what you will learn by following through with this tutorial:
- Where NGINX logs are stored and how to access them.
- How to customize the NGINX log format and storage location to fit your needs.
- How to utilize a structured format (such as JSON) for your NGINX logs.
- How to centralize NGINX logs through Syslog or a managed cloud-based service.
Prerequisites
To follow through with this tutorial, you need the following:
- A Linux server that includes a non-root user with
sudoprivileges. We tested
the commands shown in this guide on an Ubuntu 20.04 server. - The
NGINX web server installed
and enabled on your server.
🔭 Want to centralize and monitor your NGINX logs?
Head over to Logtail and start ingesting your logs in 5 minutes.
Step 1 — Locating the NGINX log files
NGINX writes logs of all its events in two different log files:
- Access log: this file contains information about incoming requests and
user visits. - Error log: this file contains information about errors encountered while
processing requests, or other diagnostic messages about the web server.
The location of both log files is dependent on the host operating system of the
NGINX web server and the mode of installation. On most Linux distributions, both
files will be found in the /var/log/nginx/ directory as access.log and
error.log, respectively.
A typical access log entry might look like the one shown below. It describes an
HTTP GET request to the server for a favicon.ico file.
Output
217.138.222.101 - - [11/Feb/2022:13:22:11 +0000] "GET /favicon.ico HTTP/1.1" 404 3650 "http://135.181.110.245/" "Mozilla/5.0 (Windows NT 10.0; Win64; x64) AppleWebKit/537.36 (KHTML, like Gecko) Chrome/98.0.4758.87 Safari/537.36" "-"
Similarly, an error log entry might look like the one below, which was generated
due to the inability of the server to locate the favicon.ico file that was
requested above.
Output
2022/02/11 13:12:24 [error] 37839#37839: *7 open() "/usr/share/nginx/html/favicon.ico" failed (2: No such file or directory), client: 113.31.102.176, server: _, request: "GET /favicon.ico HTTP/1.1", host: "192.168.110.245:80"
In the next section, you’ll see how to view both NGINX log files from the
command line.
Step 2 — Viewing the NGINX log files
Examining the NGINX logs can be done in a variety of ways. One of the most
common methods involves using the tail command to view logs entries in
real-time:
sudo tail -f /var/log/nginx/access.log
You will observe the following output:
Output
107.189.10.196 - - [14/Feb/2022:03:48:55 +0000] "POST /HNAP1/ HTTP/1.1" 404 134 "-" "Mozila/5.0"
35.162.122.225 - - [14/Feb/2022:04:11:57 +0000] "GET /.env HTTP/1.1" 404 162 "-" "Mozilla/5.0 (Windows NT 10.0; Win64; x64; rv:58.0) Gecko/20100101 Firefox/58.0"
45.61.172.7 - - [14/Feb/2022:04:16:54 +0000] "GET /.env HTTP/1.1" 404 197 "-" "Mozilla/5.0 (X11; Linux x86_64) AppleWebKit/537.36 (KHTML, like Gecko) Chrome/81.0.4044.129 Safari/537.36"
45.61.172.7 - - [14/Feb/2022:04:16:55 +0000] "POST / HTTP/1.1" 405 568 "-" "Mozilla/5.0 (X11; Linux x86_64) AppleWebKit/537.36 (KHTML, like Gecko) Chrome/81.0.4044.129 Safari/537.36"
45.137.21.134 - - [14/Feb/2022:04:18:57 +0000] "GET /dispatch.asp HTTP/1.1" 404 134 "-" "Mozilla/5.0 (iPad; CPU OS 7_1_2 like Mac OS X; en-US) AppleWebKit/531.5.2 (KHTML, like Gecko) Version/4.0.5 Mobile/8B116 Safari/6531.5.2"
23.95.100.141 - - [14/Feb/2022:04:42:23 +0000] "HEAD / HTTP/1.0" 200 0 "-" "-"
217.138.222.101 - - [14/Feb/2022:07:38:40 +0000] "GET /icons/ubuntu-logo.png HTTP/1.1" 404 197 "http://168.119.119.25/" "Mozilla/5.0 (Windows NT 10.0; Win64; x64) AppleWebKit/537.36 (KHTML, like Gecko) Chrome/98.0.4758.87 Safari/537.36"
217.138.222.101 - - [14/Feb/2022:07:38:42 +0000] "GET /favicon.ico HTTP/1.1" 404 197 "http://168.119.119.25/" "Mozilla/5.0 (Windows NT 10.0; Win64; x64) AppleWebKit/537.36 (KHTML, like Gecko) Chrome/98.0.4758.87 Safari/537.36"
217.138.222.101 - - [14/Feb/2022:07:44:02 +0000] "GET / HTTP/1.1" 304 0 "-" "Mozilla/5.0 (Windows NT 10.0; Win64; x64) AppleWebKit/537.36 (KHTML, like Gecko) Chrome/98.0.4758.87 Safari/537.36"
217.138.222.101 - - [14/Feb/2022:07:44:02 +0000] "GET /icons/ubuntu-logo.png HTTP/1.1" 404 197 "http://168.119.119.25/" "Mozilla/5.0 (Windows NT 10.0; Win64; x64) AppleWebKit/537.36 (KHTML, like Gecko) Chrome/98.0.4758.87 Safari/537.36"
The tail command prints the last 10 lines from the selected file. The -f
option causes it to continue displaying subsequent lines that are added to the
file in real-time.
To examine the entire contents of an NGINX log file, you can use the cat
command or open it in your text editor:
sudo cat /var/log/nginx/error.log
If you want to filter the lines that contain a specific term, you can use the
grep command as shown below:
sudo grep "GET /favicon.ico" /var/log/nginx/access.log
The command above will print all the lines that contain GET /favicon.ico so we
can see how many requests were made for that resource.
Step 3 — Configuring NGINX access logs
The NGINX access log stores data about incoming client requests to the server
which is beneficial when deciphering what users are doing in the application,
and what resources are being requested. In this section, you will learn how to
configure what data is stored in the access log.
One thing to keep in mind while following through with the instructions below is
that you’ll need to restart the nginx service after modifying the config file
so that the changes can take effect.
sudo systemctl restart nginx
Enabling the access log
The NGINX access Log should be enabled by default. However, if this is not the
case, you can enable it manually in the Nginx configuration file
(/etc/nginx/nginx.conf) using the access_log directive within the http
block.
Output
http {
  access_log /var/log/nginx/access.log;
}
This directive is also applicable in the server and location configuration
blocks for a specific website:
Output
server {
   access_log /var/log/nginx/app1.access.log;

  location /app2 {
    access_log /var/log/nginx/app2.access.log;
  }
}
Disabling the access log
In cases where you’d like to disable the NGINX access log, you can use the
special off value:
You can also disable the access log on a virtual server or specific URIs by
editing its server or location block configuration in the
/etc/nginx/sites-available/ directory:
Output
server {
  listen 80;

  access_log off;

  location ~* .(woff|jpg|jpeg|png|gif|ico|css|js)$ {
    access_log off;
  }
}
Logging to multiple access log files
If you’d like to duplicate the access log entries in separate files, you can do
so by repeating the access_log directive in the main config file or in a
server block as shown below:
Output
access_log /var/log/nginx/access.log;
access_log /var/log/nginx/combined.log;
Don’t forget to restart the nginx service afterward:
sudo systemctl restart nginx
Explanation of the default access log format
The access log entries produced using the default configuration will look like
this:
Output
127.0.0.1 alice Alice [07/May/2021:10:44:53 +0200] "GET / HTTP/1.1" 200 396 "-" "Mozilla/5.0 (Windows NT 10.0; Win64; x64) AppleWebKit/537.36 (KHTML, like Gecko) Chrome/90.0.4531.93 Safari/537.36"
Here’s a breakdown of the log message above:
127.0.0.1: the IP address of the client that made the request.alice: remote log name (name used to log in a user).Alice: remote username (username of logged-in user).[07/May/2021:10:44:53 +0200]: date and time of the request."GET / HTTP/1.1": request method, path and protocol.200: the HTTP response code.396: the size of the response in bytes."-": the IP address of the referrer (-is used when the it is not
available)."Mozilla/5.0 (Windows NT 10.0; Win64; x64) AppleWebKit/537.36 (KHTML, like Gecko) Chrome/90.0.4531.93 Safari/537.36"—
detailed user agent information.
Step 4 — Creating a custom log format
Customizing the format of the entries in the access log can be done using the
log_format directive, and it can be placed in the http, server or
location blocks as needed. Here’s an example of what it could look like:
Output
log_format custom '$remote_addr - $remote_user [$time_local] ' '"$request" $status $body_bytes_sent ' '"$http_referer" "$http_user_agent"';
This yields a log entry in the following format:
Output
217.138.222.109 - - [14/Feb/2022:10:38:35 +0000] "GET /favicon.ico HTTP/1.1" 404 197 "http://192.168.100.1/" "Mozilla/5.0 (Windows NT 10.0; Win64; x64) AppleWebKit/537.36 (KHTML, like Gecko) Chrome/98.0.4758.87 Safari/537.36"
The syntax for configuring an access log format is shown below. First, you need
to specify a nickname for the format that will be used as its identifier, and
then the log format string that represents the details and formatting for each
log message.
Output
log_format <nickname> '<formatting_variables>';
Here’s an explanation of each variable used in the custom log format shown
above:
$remote_addr: the IP address of the client$remote_user: information about the user making the request$time_local: the server’s date and time.$request: actual request details like path, method, and protocol.$status: the response code.$body_bytes_sent: the size of the response in bytes.$http_referer: the IP address of the HTTP referrer.$http_user_agent: detailed user agent information.
You may also use the following variables in your custom log format
(see here for the complete list):
$upstream_connect_time: the time spent establishing a connection with an
upstream server.$upstream_header_time: the time between establishing a connection and
receiving the first byte of the response header from the upstream server.$upstream_response_time: the time between establishing a connection and
receiving the last byte of the response body from the upstream server.$request_time: the total time spent processing a request.$gzip_ratio: ration of gzip compression (if gzip is enabled).
After you create a custom log format, you can apply it to a log file by
providing a second parameter to the access_log directive:
Output
access_log /var/log/nginx/access.log custom;
You can use this feature to log different information in to separate log files.
Create the log formats first:
Output
log_format custom '$remote_addr - $remote_user [$time_local] ' '"$request" $status $body_bytes_sent ' '"$http_referer"';
log_format agent "$http_user_agent";
Then, apply them as shown below:
Output
access_log /var/log/nginx/access.log custom;
access_log /var/log/nginx/agent_access.log agent;
This configuration ensures that user agent information for all incoming requests
are logged into a separate access log file.
Step 5 — Formatting your access logs as JSON
A common way to customize NGINX access logs is to format them as JSON. This is
quite straightforward to achieve by combining the log_format directive with
the escape=json parameter introduced in Nginx 1.11.8 to escape characters that
are not valid in JSON:
Output
log_format custom_json escape=json
  '{'
    '"time_local":"$time_local",'
    '"remote_addr":"$remote_addr",'
    '"remote_user":"$remote_user",'
    '"request":"$request",'
    '"status": "$status",'
    '"body_bytes_sent":"$body_bytes_sent",'
    '"request_time":"$request_time",'
    '"http_referrer":"$http_referer",'
    '"http_user_agent":"$http_user_agent"'
  '}';
After applying the custom_json format to a log file and restarting the nginx
service, you will observe log entries in the following format:
{
  "time_local": "14/Feb/2022:11:25:44 +0000",
  "remote_addr": "217.138.222.109",
  "remote_user": "",
  "request": "GET /icons/ubuntu-logo.png HTTP/1.1",
  "status": "404",
  "body_bytes_sent": "197",
  "request_time": "0.000",
  "http_referrer": "http://192.168.100.1/",
  "http_user_agent": "Mozilla/5.0 (Windows NT 10.0; Win64; x64) AppleWebKit/537.36 (KHTML, like Gecko) Chrome/98.0.4758.87 Safari/537.36"
}
Step 6 — Configuring NGINX error logs
Whenever NGINX encounters an error, it stores the event data in the error log so
that it can be referred to later by a system administrator. This section will
describe how to enable and customize the error logs as you see fit.
Enabling the error log
The NGINX error log should be enabled by default. However, if this is not the
case, you can enable it manually in the relevant NGINX configuration file
(either at the http, server, or location levels) using the error_log
directive.
Output
error_log /var/log/nginx/error.log;
The error_log directive can take two parameters. The first one is the location
of the log file (as shown above), while the second one is optional and sets the
severity level of the log. Events with a lower severity level than set one will
not be logged.
Output
error_log /var/log/nginx/error.log info;
These are the possible levels of severity (from lowest to highest) and their
meaning:
debug: messages used for debugging.info: informational messages.notice: a notable event occurred.warn: something unexpected happened.error: something failed.crit: critical conditions.alert: errors that require immediate action.emerg: the system is unusable.
Disabling the error log
The NGINX error log can be disabled by setting the error_log directive to
off or by redirecting it to /dev/null:
Output
error_log off;
error_log /dev/null;
Logging errors into multiple files
As is the case with access logs, you can log errors into multiple files, and you
can use different severity levels too:
Output
error_log /var/log/nginx/error.log info;
error_log /var/log/nginx/emerg_error.log emerg;
This configuration will log every event except those at the debug level event
to the error.log file, while emergency events are placed in a separate
emerg_error.log file.
Step 7 — Sending NGINX logs to Syslog
Apart from logging to a file, it’s also possible to set up NGINX to transport
its logs to the syslog service especially if you’re already using it for other
system logs. Logging to syslog is done by specifying the syslog: prefix to
either the access_log or error_log directive:
Output
error_log  syslog:server=unix:/var/log/nginx.sock debug;
access_log syslog:server=[127.0.0.1]:1234,facility=local7,tag=nginx,severity=info;
Log messages are sent to a server which can be specified in terms of a domain
name, IPv4 or IPv6 address or a UNIX-domain socket path.
In the example above, error log messages are sent to a UNIX domain socket at the
debug logging level, while the access log is written to a syslog server with
an IPv4 address and port 1234. The facility= parameter specifies the type of
program that is logging the message, the tag= parameter applies a custom tag
to syslog messages, and the severity= parameter sets the severity level of
the syslog entry for access log messages.
For more information on using Syslog to manage your logs, you can check out our
tutorial on viewing and configuring system logs on
Linux.
Step 8 — Centralizing your NGINX logs
In this section, we’ll describe how you can centralize your NGINX logs in a log
management service through Vector, a
high-performance tool for building observability pipelines. This is a crucial
step when administrating multiple servers so that you can monitor all your logs
in one place (you can also centralize your logs with an Rsyslog
server).
The following instructions assume that you’ve signed up for a free
Logtail account and retrieved your source
token. Go ahead and follow the relevant
installation instructions for Vector
for your operating system. For example, on Ubuntu, you may run the following
commands to install the Vector CLI:
curl -1sLf  'https://repositories.timber.io/public/vector/cfg/setup/bash.deb.sh'  | sudo -E bash
$ sudo apt install vector
After Vector is installed, confirm that it is up and running through
systemctl:
You should observe that it is active and running:
Output
● vector.service - Vector
     Loaded: loaded (/lib/systemd/system/vector.service; enabled; vendor preset: enabled)
     Active: active (running) since Tue 2022-02-08 10:52:59 UTC; 48s ago
       Docs: https://vector.dev
    Process: 18586 ExecStartPre=/usr/bin/vector validate (code=exited, status=0/SUCCESS)
   Main PID: 18599 (vector)
      Tasks: 3 (limit: 2275)
     Memory: 6.8M
     CGroup: /system.slice/vector.service
             └─18599 /usr/bin/vector
Otherwise, go ahead and start it with the command below.
sudo systemctl start vector
Afterward, change into a root shell and append your Logtail vector configuration
for NGINX into the /etc/vector/vector.toml file using the command below. Don’t
forget to replace the <your_logtail_source_token> placeholder below with your
source token.
sudo -s
$ wget -O ->> /etc/vector/vector.toml
    https://logtail.com/vector-toml/nginx/<your_logtail_source_token>
Then restart the vector service:
sudo systemctl restart vector
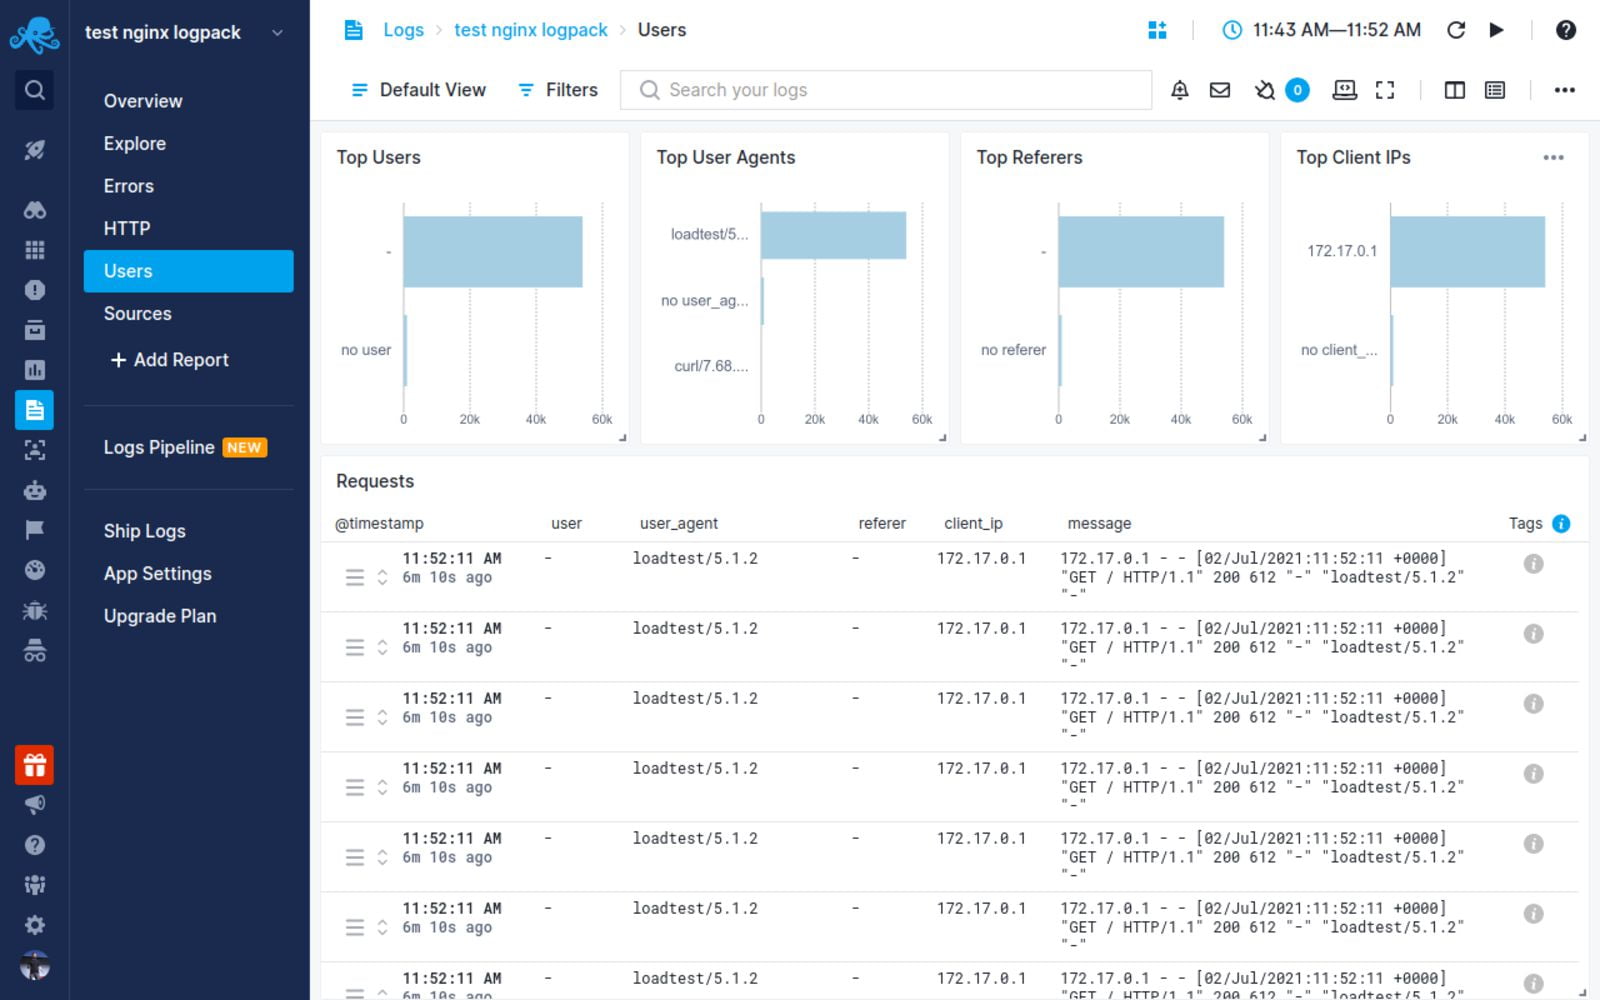
You will observe that your NGINX logs will start coming through in Logtail:
Conclusion
In this tutorial, you learned about the different types of logs that the NGINX
web server keeps, where you can find them, how to understand their formatting.
We also discussed how to create your own custom log formats (including a
structured JSON format), and how to log into multiple files at once. Finally, we
demonstrated the process of sending your logs to Syslog or a log management
service so that you can monitor them all in one place.
Thanks for reading, and happy logging!
Centralize all your logs into one place.
Analyze, correlate and filter logs with SQL.
Create actionable
dashboards.
Share and comment with built-in collaboration.
Got an article suggestion?
Let us know
![]()
![]()
![]()
Next article
How to Get Started with Logging in Node.js
Learn how to start logging with Node.js and go from basics to best practices in no time.
→
![]()
This work is licensed under a Creative Commons Attribution-NonCommercial-ShareAlike 4.0 International License.
NGINX is one of the most widely used reverse proxy servers, web servers, and load balancers. It has capabilities like TLS offloading, can do health checks for backends, and offers support for HTTP2, gRPC, WebSocket, and most TCP-based protocols.
When running a tool like NGINX, which generally sits in front of your applications, it’s important to understand how to debug issues. And because you need to see the logs, you have to understand the different NGINX logging mechanisms. In addition to the errors in your application or web server, you need to look into NGINX performance issues, as they can lead to SLA breaches, negative user experience, and more.
In this article, we’ll explore the types of logs that NGINX provides and how to properly configure them to make troubleshooting easier.
What Are NGINX Logs?
NGINX logs are the files that contain information related to the tasks performed by the NGINX server, such as who tried to access which resources and whether there were any errors or issues that occured.
NGINX provides two types of logs: access logs and error logs. Before we show you how to configure them, let’s look at the possible log types and different log levels.
Here is the most basic NGINX configuration:
http{
    server {
        listen       80;
        server_name  example.com www.example.com;
        access_log   /var/log/nginx/access.log  combined;
        root         /var/www/virtual/big.server.com/htdocs;
    }
}
For this server, we opened port 80. The server name is “example.com www.example.com.” You can see the access and error log configurations, as well as the root of the directive, which defines from where to serve the files.
What Are NGINX Access Logs?
NGINX access logs are files that have the information of all the resources that a client is accessing on the NGINX server, such as details about what is being accessed and how it responded to the requests, including client IP address, response status code, user agent, and more. All requests sent to NGINX are logged into NGINX logs just after the requests are processed.
Here are some important NGINX access log fields you should be aware of:
- remote_addr: The IP address of the client that requested the resource
- http_user_agent: The user agent in use that sent the request
- time_local: The local time zone of the server
- request: What resource was requested by the client (an API path or any file)
- status: The status code of the response
- body_bytes_sent: The size of the response in bytes
- request_time: The total time spent processing the request
- remote_user: Information about the user making the request
- http_referer: The IP address of the HTTP referer
- gzip_ratio: The compression ratio of gzip, if gzip is enabled
NGINX Access Log Location
You can find the access logs in the logs/access.log file and change their location by using the access_log directive in the NGINX configuration file.
access_log path [format [buffer=size] [gzip[=level]] [flush=time] [if=condition]];
access_log /var/log/nginx/access.log combined
By changing the path field in the access_log directive, you can also change where you want to save your access logs.
An NGINX access log configuration can be overridden by another configuration at a lower level. For example:
http {
  access_log  /var/log/nginx/access.log  main;
  server {
    listen 8000;
    location /health {
      access_log off; # <----- this WILL work
      proxy_pass http://app1server;
    }
  }
}
Here, any calls to /health will not be logged, as the access logs are disabled for this path. All the other calls will be logged to the access log. There is a global config, as well as different local configs. The same goes for the other configurations that are in the NGINX config files.
How to Enable NGINX Access Logs
Most of the time, NGINX access logs are enabled by default. To enable them manually, you can use the access_log directive as follows:
access_log /var/log/nginx/access.log combined
The first parameter is the location of the file, and the second is the log format. If you put the access_log directive in any of the server directories, it will start the access logging.
Setting Up NGINX Custom Log Format
To easily predefine the NGINX access log format and use it along with the access_log directive, use the log_format directive:
log_format upstream_time '$remote_addr - $remote_user [$time_local] '
    '"$request" $status $body_bytes_sent '
    '"$http_referer" "$http_user_agent"'
    'rt=$request_time uct="$upstream_connect_time" uht="$upstream_header_time" urt="$upstream_response_time"';
Most of the fields here are self explanatory, but if you want to learn more, look up NGINX configurations for logging. You can specify the log formats in an HTTP context in the /etc/nginx/nginx.conf file and then use them in a server context.
By default, NGINX access logs are written in a combined format, which looks something like this:
log_format combined '$remote_addr - $remote_user [$time_local] '
                    '"$request" $status $body_bytes_sent '
                    '"$http_referer" "$http_user_agent"';
Once you have defined the log formats, you can use them with the access_log directive, like in the following examples:
server {
    access_log /var/log/nginx/access.log combined
    access_log /var/log/nginx/access.log upstream_time #defined in the first format
    …
}
Formatting the Logs as JSON
Logging to JSON is useful when you want to ship the NGINX logs, as JSON makes log parsing very easy. Since you have key-value information, it will be simpler for the consumer to understand. Otherwise, the parse has to understand the format NGINX is logging.
NGINX 1.11.8 comes with an escape=json setting, which helps you define the NGINX JSON log format. For example:
log_format json_combined escape=json
  '{'
    '"time_local":"$time_local",'
    '"remote_addr":"$remote_addr",'
    '"remote_user":"$remote_user",'
    '"request":"$request",'
    '"status": "$status",'
    '"body_bytes_sent":"$body_bytes_sent",'
    '"http_referrer":"$http_referer",'
    '"http_user_agent":"$http_user_agent",'
    '"request_time":"$request_time"'
  '}';
You can now use this predefined log format in JSON with the access_log directive to get the logs in JSON.
You can also use an open-source NGINX module, like https://github.com/jiaz/nginx-http-json-log, to do the JSON logging.
Configuring NGINX Conditional Logging
Sometimes, you want to write logs only when a certain condition is met. NGINX calls this conditional logging. For example:
map $remote_addr $log_enable {
    "192.168.4.1" 0;
    "192.168.4.2" 0;
    "192.168.4.3" 0;
    "192.168.4.4" 0;
    default 1;
}
access_log /var/log/nginx/access.log combined if=$log_enable
This means that whenever the request comes from the IPs 192.168.4.1 to 192.168.4.4, the access logs will not be populated. For every other IP, the logs will be recorded.
You can use conditional logging with NGINX in multiple scenarios. For example, if you are under attack and can identify the IPs of the attacker, you can log the requests to a different file. This allows you to process the file and get relevant information about the attack later.
How to View NGINX Access Logs
Linux utilities, like LESS or TAIL, allow you to view NGINX logs easily. You can also see the NGINX access logs’ location from the configuration files. With newer systems that are running systemd, the journalctl feature can tail the logs. To see the logs, use this command:
journalctl -fu nginx.service
You can also tail the log locations, as shown here:
tail -f /var/log/nginx/access.log
It’s also possible to use journalctl, but this will show all the logs together, which can be a bit confusing.
How to Disable Access Logs
To disable an NGINX access log, pass the off argument to the access_log directive:
access_log off;
This can be useful when there are too many logs, which can overload the disk IO and, in rare cases, impact the performance of your NGINX server. However, disabling NGINX access logs is not usually recommended, as it can make troubleshooting difficult.
What Are NGINX Error Logs?
NGINX error logs are the files where all information about errors will be logged, including permission errors or any NGINX configuration-related access errors. While access logs are used to see the HTTP requests received by the server, error logs bring more value, as when there is an issue, they will show exactly what happened and provide detailed information about the issue.
Whenever there is an error with the requests, or when there are NGINX glitches, these issues will be recorded in the error log files configured in the NGINX configuration file.
Where Are the NGINX Error Logs Stored?
The location of NGINX error logs can be configured in the error_log directive in the NGINX configuration. By default, these logs are in the /var/log/nginx directory. You can configure the location separately for different server components that you can run in the NGINX configuration.
The default location is:
/var/log/nginx/error.log
NGINX Error Logs Configuration
NGINX error logs configuration is in the same place as access_log. You can use the error_log directive to enable and configure the log levels and the location of the log file. Here is the configuration line to enable the error_log:
error_log log_file_location log_level;
NGINX Error Log Levels
NGINX has eight log levels for different degrees of severity and verbosity:
- emerg: These are the emergency logs. They mean that the system is unusable.
- alert: An immediate action is required.
- crit: A critical condition occurred.
- error: An error or failure occurred while processing a request.
- warn: There was an unexpected event, or something needs to be fixed, but NGINX fulfilled the request as expected.
- notice: Something normal, but important, has happened, and it needs to be noted.
- info: These are messages that give you information about the process.
- debug: These are messages that help with debugging and troubleshooting. They are generally not enabled unless needed because they create a lot of noise.
Note that the log_level parameter is a threshold, as every log level includes the previous log levels as well. For example, if your log level is 6 (notice), your logs will contain entries from levels 1 through 6.
Enable Debug Logging and Other Levels
You can specify the log level with the error_log directive using the log_level argument. As the log level number increases, the logs will contain more information. If the application misbehaves, you can enable the debug logs to aid you in the troubleshooting process. With the extra information they provide, you will be able to pinpoint the issue more easily. You can read about this more in the NGINX documentation.
Keeping NGINX debug logs enabled continuously is not recommended, as it will make logs very noisy and large by printing information that is generally unnecessary. If you see an issue, you can change the log level on the fly, solve the problem, then revert it back to a stricter severity.
Logging to Multiple Files
You can forward NGINX error logs to separate files based on the different log levels. In the configuration below, you send logs to all the specified log directives based on the log severity level.
error_log /var/log/nginx/error.info info;
error_log /var/log/nginx/error.crit crit;
This configuration can be very useful when looking at the different log levels separately or if you want your logging agent to label these logs based on filenames. You can selectively discard the error logs based on their severity.
How to Check NGINX Error Logs
You can view NGINX error logs the same way as access logs: for example, by using TAIL, LESS, or other utilities. Below is an example of how to do it with TAIL using the location of the error_logs that you have set. These logs are also present in journalctl logs, but there, they will be a combination of access_log and error_logs.
tail -f /var/log/nginx/error.log
How to Disable Error Logs
Disabling NGINX error logs can be tricky, as there is no off option in error_log. Similar to access_log in the lower configuration levels, you can use error_log false at the higher level configurations.
error_log off;
For the lower levels, you can forward the logs to /dev/null:
error_log /dev/null;
How to Send NGINX Logs to Syslog
NGINX can also ship your logs to log aggregators using syslog. This can be useful when you are logging other system/service logs in syslog or using syslog to export the logs. You can implement this with the syslog: prefix, which can be used with both access_log and error_logs. You can also use this prefix instead of the file path in the access_log and error_log directives.
Syslog can help you concentrate your NGINX logs in one place by forwarding them to a centralized logging solution:
error_log syslog:unix/var/log/nginx.sock debug
You can also send the logs to different syslog servers by defining the syslog server parameter to point to the IP or hostname and port of the syslog server.
error_log syslog:server=192.168.100.1 debug
access_log syslog:server=[127.0.0.1]:9992, facility=local1,tag=nginx,severity=debug;
In the above configuration for access_log, the logs are forwarded to the local syslog server, with the service name as local1, since syslog doesn’t have an option for NGINX.
Syslog has various options for keeping the forwarded logs segregated:
- Facility: Identifies who is logging to syslog.
- Severity: Specifies the log levels.
- Tag: Identifies the message sender or any other information that you want to send; default is NGINX.
NGINX Logging in Kubernetes Environments
In Kubernetes, NGINX Ingress runs as a pod. All the logs for the NGINX Ingress pods are sent to standard output and error logs. However, if you want to see the logs, you have to log in to the pod or use the kubectl commands, which is not a very practical solution.
You also have to find a way to ship the logs from the containers. You can do this with any logging agent that is running in the Kubernetes environment. These agents run as pods and mount the file system that NGINX runs on, reading the logs from there.
How to See the NGINX Ingress Logs
Use the kubectl logs command to see the NGINX logs as streams:
$ kubectl logs -f nginx-ingress-pod-name -n namespace.
It’s important to understand that pods can come and go, so the approach to debugging issues in the Kubernetes environment is a bit different than in VM or baremetal-based environments. In Kubernetes, the logging agent should be able to discover the NGINX Ingress pods, then scrape the logs from there. Also, the log aggregator should show the logs of the pods that were killed and discover any new pod that comes online.
NGINX Logging and Analysis with Sematext
NGINX log integration with Sematext
Sematext Logs is a log aggregation and management tool with great support for NGINX logs. Its auto-discovery feature is helpful, particularly when you have multiple machines. Simply create an account with Sematext, create the NGINX Logs App and install the Sematext Agent. Once you’re set up, you get pre-built, out-of-the-box dashboards and the option to build your own custom dashboards.
Sematext Logs is part of Sematext Cloud, a full-stack monitoring solution that gives you all you need when it comes to observability. By correlating NGINX logs and metrics, you’ll get a more holistic view of your infrastructure, which helps you identify and solve issues quickly.
Using anomaly-detection algorithms, Sematext Cloud informs you in advance of any potential issues. These insights into your infrastructure help you prevent issues and troubleshoot more efficiently. With Sematext Cloud, you can also collect logs and metrics from a wide variety of tools, including HAProxy, Apache Tomcat, JVM, and Kubernetes. By integrating with other components of your infrastructure, this tool is a one-stop solution for all your logging and monitoring needs.
If you’d like to learn more about Sematext Logs, and how they can help you manage your NGINX logs, then check out this short video below:
If you’re interested in how Sematext compares to other log management tools, read our review of the top NGINX log analyzers.
Conclusion
Managing, troubleshooting, and debugging large-scale NGINX infrastructures can be challenging, especially if you don’t have a proper way of looking into logs and metrics. It’s important to understand NGINX access and error logs, but if you have hundreds of machines, this will take a substantial amount of time. You need to be able to see the logs aggregated in one place.
Performance issues are also more common than you think. For example, you may not see anything in the error logs, but your APIs continue to degrade. To look into this properly, you need effective dashboarding around NGINX performance metrics, like response code and response time.
Sematext Logs can help you tackle these problems so you can troubleshoot more quickly. Sign up for our free trial today.
Author Bio

Gaurav Yadav
Gaurav has been involved with systems and infrastructure for almost 6 years now. He has expertise in designing underlying infrastructure and observability for large-scale software. He has worked on Docker, Kubernetes, Prometheus, Mesos, Marathon, Redis, Chef, and many more infrastructure tools. He is currently working on Kubernetes operators for running and monitoring stateful services on Kubernetes. He also likes to write about and guide people in DevOps and SRE space through his initiatives Learnsteps and Letusdevops.
(britespanbuildings)
NGINX logging is often overlooked as a critical part of the web service and is commonly referenced only when an error occurs. But it’s important to understand from the beginning how to configure NGINX logs and what information is considered most important.
Within NGINX there are two types of logs available, the error log and the access log. How then would you configure the error and access logs and in what format should be used? Read on to learn all about how NGINX logging works!
Prerequisites
To follow along with this tutorial, it is necessary to have a recent working NGINX installation, ideally version 1.21.1 or higher. In this tutorial, Ubuntu is used to host the NGINX installation. To view formatted JSON log file output in the terminal you may want to install the jq utility
Learning the NGINX Logging System
The NGINX logging system has quite a few moving parts. Logging is made up of log formats (how logs are stored) and an NGNIX configuration file (nginx.conf) to enable and tune how logs are generated.
First, let’s cover the NGINX configuration file. An NGNIX configuration file defines a hierarchy of sections that are referred to as contexts within the NGINX documentation. These contexts are made up of a combination of the following, although not all available contexts are listed below.
- The “main” context is the root of the nginx.conf file
- The
httpcontext - Multiple
servercontexts - Multiple
locationcontexts
Inside one or more of these contexts is where you can define access_log and error_log configuration items, or directives. A logging directive defines how NGINX is supposed to record logs under each context.
NGINX Logs Logging Directive Structure
Logging directives are defined under each context with the log name, the location to store the log, and the level of log data to store.
<log name> <log location> <logging level>;- Log Location – You can store logs in three different areas; a file e.g.
/var/log/nginx/error.log, syslog e.g.syslog:server=unix:/var/log/nginx.sockor cyclic memory buffer e.g.memory:32m. - Logging Levels – The available levels are
debug,info,notice,warn,error,crit,alert, oremergwith the default beingerror. Thedebuglevel may not be available unless NGINX was compiled with the--with-debugflag.
Allowed Logging Directive Contexts
Both the error_log and access_log directives are allowed in only certain contexts. error_log is allowed in the main, http, mail, stream, server, and location contexts. While the access_log directive is allowed in http, server, location, if in location, and limit_exept contexts.
Logging directives override higher-up directives. For example, the
error_logdirective specified in alocationcontext will override the same directive specified in thehttpcontext.
You can see an example configuration below that contains various defined directives below.
# Log to a file on disk with all errors of the level warn and higher
error_log /var/log/nginx/error.log warn;

http {
  access_log /var/log/nginx/access.log combined;

  server {
		access_log /var/log/nginx/domain1.access.log combined;

		location {
			# Log to a local syslog server as a local7 facility, tagged as nginx, and with the level of notice and higher
		error_log syslog:server=unix:/var/log/nginx.sock,facility=local7,tag=nginx notice;
		}
  }

  server {
		access_log /var/log/nginx/domain2.access.log combined;

		location {
			# Log all info and higher error messages directly into memory, but max out at 32 Mb
			error_log memory:32m info;
		}
  }
}
Log Formats and the Access Log Directive
Beyond just NGINX error logs, each access request to NGINX is logged. An access request could be anything from requesting a web page to a specific image. As you might surmise, there is a lot of data that can be included in the logged requests.
To record general NGINX request activity, NGNIX relies on access logs using the access_log directive. Unlike the error_log directive which has a standard format, you can configure NGINX access logs to store in a particular format.
The Default access_log Log Format
NGNIX can record access log data in many different ways through log formats. By default, that log format is called combined. When you don’t specify a log format in the NGINX configuration file, NGNIX will log all requested according to the following schema.
'$remote_addr - $remote_user [$time_local] '
'"$request" $status $body_bytes_sent '
'"$http_referer" "$http_user_agent"'
Below, you can see an example of the combined format in practice.
127.0.0.1 - - [10/Oct/2020:15:10:20 -0600] "HEAD / HTTP/1.1" 200 0 "<https://example.com>" "Mozilla/5.0..."Defining Custom access_log Formats via log_format Directive
The default combined NGINX log format may work perfectly well for your needs, but what if you would like to add additional data, such as upstream service information, or use this in JSON format instead? You’ll need to define a custom log format using the log_format directive.
The log_format directive allows you to define multiple different access_log formats to be used across the various contexts in the configuration file.
An example of defining a log format is below which specifies many different fields and variables. This example defines a JSON logging format, you may choose to display various fields.
Check out all available variables via the NGINX documentation.
The json text displayed after the log_format directive is merely the name that is referenced by any access_log directive that wishes to use this format. By using log_format, multiple logging output formats may be defined and used by any combination of access_log directives throughout the NGINX configuration file.
log_format json escape=json '{ "time": "$time_iso8601", '
	'"remote_addr": "$remote_addr", '
	'"remote_user": "$remote_user", '
	'"ssl_protocol_cipher": "$ssl_protocol/$ssl_cipher", '
	'"body_bytes_sent": "$body_bytes_sent", '
	'"request_time": "$request_time", '
	'"status": "$status", '
	'"request": "$request", '
	'"request_method": "$request_method", '
	'"http_referrer": "$http_referer", '
	'"http_x_forwarded_for": "$http_x_forwarded_for", '
	'"http_cf_ray": "$http_cf_ray", '
	'"host": "$host", '
	'"server_name": "$server_name", '
	'"upstream_address": "$upstream_addr", '
	'"upstream_status": "$upstream_status", '
	'"upstream_response_time": "$upstream_response_time", '
	'"upstream_response_length": "$upstream_response_length", '
	'"upstream_cache_status": "$upstream_cache_status", '
	'"http_user_agent": "$http_user_agent" }';
The
log_formatmay only be used in thehttpcontext, but referenced by anyaccess_logdirective regardless of location.
Escaping Log Output
When you define log format via JSON, for example, you’ll sometimes need to escape variables defined in JSON to be treated as literal elements in the NGNIX configuration file. To do that, you can use various escape formats such as default, json, and none. If the escape command is omitted, the default format is used.
default– Double-quotes, “”, and all characters with ISO values less than 32 and greater than 126 will be escaped as “x##”. If no variable value is found, then a hyphen (-) will be logged.json– All disallowed characters in the JSON string format will be escaped.none– All escaping of values is disabled.
You’ll see a great example of NGNIX escaping all JSON variables in the example above using the json escape format (escape=json).
Configuring access_log Directives
For NGNIX to become recording access activity using the fancy log format you defined earlier, you must enable it using the access_log directive
Once you’ve defined the log format, you must enable the log inside of the NGINX configuration file much like the error_log directive.
An example of a typical access_log directive is shown below where it sends access logs in the json log_format, as previously defined, and to a file (/var/log/nginx/access.log). Then the special off parameter disables access logging in a specific context where the directive is included.
access_log /var/log/nginx/domain.access.log json;
access_log off;
Perhaps you have defined an access_log for a domain. How would you go about seeing the output from the below directive?
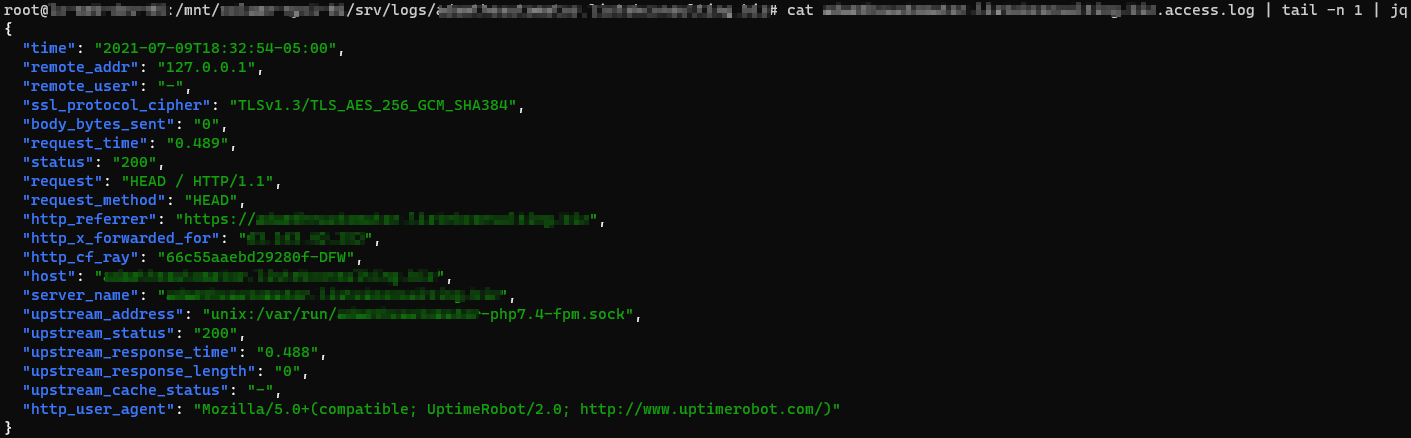
access_log /var/log/nginx/domain.access.log json;To demonstrate NGINX sending log output as defined by the access_log directive, first run the Linux cat command to grab the file contents and pipe the output to the tail command to show only a single line. Then finally, pass the single line to the jq utility to nicely format the JSON output.
cat /var/log/nginx/domain.access.log | tail -n 1 | jqLike the
error_log, both thememoryandsyslogformats work in addition to the standard file output.
Configuring NGINX to Buffer Disk Writes
Since there is typically far more information output from access logging than error logging, additional abilities for compression and buffering of the log data to disk writes are included, but enabled by default. To avoid constant disk writes and potential request blocking of the webserver while waiting for disk IO, tell NGINX to buffer disk writes.
An example of an access_log directive defining the gzip, buffer, and flush parameters is shown below.
access_log /var/log/nginx/domain.access.log gzip=7 buffer=64k flush=3m;buffer– A buffer temporarily stores data, before sending it elsewhere. The default buffer size is64kwhich you can redefine by specifying a size along with the directive, i.e.buffer=32kinstead of justbuffer.gzip– Defines a level of GZIP compression to use from1to9, with 9 being the slowest but highest level of compression. For example,gzipdefaults to1but you will set (gzip=9) the compression to the highest.
If you use
gzipbut notbuffer, you’ll buffer the writes by default. Since the nature of GZIP compression means log entries cannot be streamed to disk, disk buffering is required.
flush– To avoid holding on to in-memory logs indefinitely for infrequently accessed sites, you’ll specify aflushtime to write any logging data to disk after that time threshold is met. For example, withflush=5myou force all logged data to be written to disk, even if the buffer has not filled.
Logging Access Entries Conditionally
There are times when you will only want to log a particular access request. For example, instead of logging all requests including HTTP/200 (successful requests), perhaps you’d like to only log HTTP/404 (file not found requests). If so, you can define a logging condition in the access_log directive using the if parameter.
The if= parameter of the access_log directive looks for values passed in by the associated variable that are not “0” or an empty string to continue with logging.
As an example, perhaps you’d like to force NGNIX to only log only HTTP access requests starting with a 4 for the HTTP code.
In the NGINX configuration file:
Define a map directive to assign a variable with the value of either 0 or 1 depending n the evaluated condition. The first regular expression looks for all HTTP statuses that do not start with 4. The default condition is the fallback for all values that do not meet that requirement.
map $status $logged {
    ~^[1235] 0;
    default  1;
}
The
mapdirective must be defined at thehttpcontext level. You may use themapdirective output variable, shown below as$logged, further in the configuration file and not confined to thehttpcontext level.
Once you have defined the map directive which will assign a value of 0 or 1 to the $logged variable, you can then use this variable in conditions as shown below. Here, using the if parameter, you’re telling NGINX to only log activity to the access_404.log file if it sees a request starting with 4.
access_log /var/log/nginx/access_404.log json if=$logged;Conclusion
Now that you know how to log errors and access requests in a variety of ways, you can start monitoring your NGINX installation for issues and also for user-facing problems.
What’s next? Try taking the results of the logs and ingesting those into a SIEM application for analysis!
Nginx — это высокопроизводительный HTTP- сервер с открытым исходным кодом и обратный прокси-сервер, отвечающий за обработку нагрузки некоторых из крупнейших сайтов в Интернете. При управлении веб-серверами NGINX одной из наиболее частых задач, которые вы будете выполнять, является проверка файлов журналов.
Знание того, как настраивать и читать журналы, очень полезно при устранении неполадок сервера или приложений, поскольку они предоставляют подробную информацию об отладке.
Nginx записывает свои события в журналы двух типов: журналы доступа и журналы ошибок. Журналы доступа записывают информацию о клиентских запросах, а журналы ошибок записывают информацию о проблемах сервера и приложений.
В этой статье рассказывается, как настроить и прочитать журналы доступа и ошибок Nginx.
Настройка журнала доступа
Каждый раз, когда клиентский запрос обрабатывается, Nginx генерирует новое событие в журнале доступа. Каждая запись события содержит отметку времени и включает различную информацию о клиенте и запрошенном ресурсе. Журналы доступа могут показать вам местоположение посетителей, страницу, которую они посещают, сколько времени они проводят на странице и многое другое.
Директива log_format позволяет вам определять формат регистрируемых сообщений. Директива access_log включает и устанавливает расположение файла журнала и используемый формат.
Самый простой синтаксис директивы access_log следующий:
access_log log_file log_format;
Где log_file — это полный путь к файлу журнала, а log_format — формат, используемый файлом журнала.
Журнал доступа можно включить в блоке http , server или location .
По умолчанию журнал доступа глобально включен в директиве http в основном файле конфигурации Nginx.
/etc/nginx/nginx.conf
http {
  ...
  access_log  /var/log/nginx/access.log;
  ...
}
Для удобства чтения рекомендуется создавать отдельный файл журнала доступа для каждого серверного блока. Директива access_log установленная в директиве server access_log директиву, установленную в директиве http (более высокого уровня).
/etc/nginx/conf.d/domain.com.conf
http {
  ...
  access_log  /var/log/nginx/access.log;
  ...

  server {
    server_name domain.com
    access_log  /var/log/nginx/domain.access.log;
    ...
  }
}
Если формат журнала не указан, Nginx использует предопределенный комбинированный формат, который выглядит следующим образом:
log_format combined '$remote_addr - $remote_user [$time_local] '
                    '"$request" $status $body_bytes_sent '
                    '"$http_referer" "$http_user_agent"';
Чтобы изменить формат ведения журнала, отмените настройку по умолчанию или определите новую. Например, чтобы определить новый формат ведения журнала с именем custom, который расширит комбинированный формат значением, показывающим заголовок X-Forwarded-For добавьте следующее определение в директиву http или server :
log_format  custom  '$remote_addr - $remote_user [$time_local] "$request" '
                    '$status $body_bytes_sent "$http_referer" '
                    '"$http_user_agent" "$http_x_forwarded_for"';
Чтобы использовать новый формат, укажите его имя после файла журнала, как показано ниже:
access_log /var/log/nginx/access.log custom;
Хотя журнал доступа предоставляет очень полезную информацию, он занимает дисковое пространство и может повлиять на производительность сервера. Если на вашем сервере мало ресурсов и у вас загруженный веб-сайт, вы можете отключить журнал доступа. Чтобы сделать это, установите значение access_log директиву off :
Настройка журнала ошибок
Nginx записывает сообщения об ошибках приложения и общих ошибках сервера в файл журнала ошибок. Если вы испытываете ошибки в своем веб-приложении, журнал ошибок — это первое место, с которого можно начать поиск и устранение неисправностей.
Директива error_log включает и устанавливает расположение и уровень серьезности журнала ошибок. Он имеет следующую форму и может быть установлен в блоке http , server или location :
error_log log_file log_level
Параметр log_level устанавливает уровень ведения журнала. Ниже перечислены уровни в порядке их серьезности (от низкого до высокого):
debug—debugсообщения.-
info— Информационные сообщения. -
notice— Уведомления. -
warn— Предупреждения. -
error— Ошибки при обработке запроса. -
crit— Критические проблемы. Требуется быстрое действие. -
alert— Оповещения. Действия должны быть предприняты немедленно. -
emerg— Чрезвычайная ситуация. Система находится в непригодном для использования состоянии.
Каждый уровень журнала включает в себя более высокие уровни. Например, если вы установите уровень журнала , чтобы warn , Nginx будет также регистрировать error , crit , alert и emerg сообщения.
Если параметр log_level не указан, по умолчанию используется error .
По умолчанию директива error_log определена в директиве http внутри основного файла nginx.conf:
/etc/nginx/nginx.conf
http {
  ...
  error_log  /var/log/nginx/error.log;
  ...
}
Как и в случае с журналами доступа, рекомендуется создать отдельный файл журнала ошибок для каждого блока сервера, который переопределяет настройку, унаследованную от более высоких уровней.
Например, чтобы настроить журнал ошибок domain.com на warn вы должны использовать:
http {
  ...
  error_log  /var/log/nginx/error.log;
  ...

  server {
    server_name domain.com
    error_log  /var/log/nginx/domain.error.log warn;
    ...
  }
}
Каждый раз, когда вы изменяете файл конфигурации, вам необходимо перезапустить службу Nginx, чтобы изменения вступили в силу.
Расположение файлов журнала
По умолчанию в большинстве дистрибутивов Linux, таких как Ubuntu , CentOS и Debian , журналы доступа и ошибок расположены в каталоге /var/log/nginx .
Чтение и понимание файлов журнала Nginx
Вы можете открывать и анализировать файлы журнала, используя стандартные команды, такие как cat , less , grep , cut , awk и т. Д.
Вот пример записи из файла журнала доступа, в котором используется стандартный формат журнала Nginx для объединения:
192.168.33.1 - - [15/Oct/2019:19:41:46 +0000] "GET / HTTP/1.1" 200 396 "-" "Mozilla/5.0 (X11; Linux x86_64) AppleWebKit/537.36 (KHTML, like Gecko) Chrome/77.0.3865.120 Safari/537.36"
Давайте разберемся, что означает каждое поле записи:
$remote_addr—192.168.33.1— IP-адрес клиента, выполняющего запрос.-
$remote_user—-— Пользователь,$remote_userаутентификацию по HTTP. Если имя пользователя не задано, в этом поле отображается-. -
[$time_local]—[15/Oct/2019:19:41:46 +0000]— Время на локальном сервере. -
"$request"—"GET / HTTP/1.1"— тип запроса, путь и протокол. -
$status—200— Код ответа сервера. -
$body_bytes_sent—396— Размер ответа сервера в байтах. -
"$http_referer"—"-"— URL перехода. -
"$http_user_agent"—Mozilla/5.0 ...— Пользовательский агент клиента (веб-браузер).
Используйте команду tail для просмотра файла журнала в режиме реального времени:
tail -f access.log Выводы
Файлы журналов содержат полезную информацию о проблемах с сервером и о том, как посетители взаимодействуют с вашим сайтом.
Nginx позволяет настроить журналы доступа и ошибок в соответствии с вашими потребностями.
Если у вас есть какие-либо вопросы или отзывы, не стесняйтесь оставлять комментарии.
Nginx HTTP server has a phenomenal logging facility which is highly customizable. In this article, we will explain how to configure you own formats for access and error logs for Nginx in Linux.
The aim of this guide is to help you understand how logs are generated, so as to configure custom log formats for purposes of debugging, troubleshooting or analysis of what unfolds within your web server as well as web applications (such as tracing requests).
Read Also: 4 Good Open Source Log Monitoring and Management Tools for Linux
This article is made of three sections which will enlighten you about configuring access/error logs and how to enable conditional logging in Nginx.
Configuring Access Logs in Nginx
Under Nginx, all client requests to the server are recored in the access log in a specified format using the ngx_http_log_module module.
The default log file is log/access.log (usually /var/log/nginx/access_log on Linux systems) and the default format for logging is normally the combined or main format (this can vary from one distro to another).
The access_log directive (applicable in the http, server, location, if in location and limit except context) is used to set the log file and the log_format directive (applicable under the http context only) is used to set the log format. The log format is described by common variables, and variables that generated only at the time when a log is written.
The syntax for configuring a log format is:
log_format format_name 'set_of_variables_to_define_format';
and the syntax for configuring access log is:
access_log /path/to/log_file format_name;		#simplest form
OR
access_log /path/to/log_file [format [buffer=size] [gzip[=level]] [flush=time] [if=condition]];
The following is a excerpt from the default Nginx configuration file /etc/nginx/nginx.conf on CentOS 7.
/etc/nginx/nginx.conf
http {
	#main log format
	log_format  main  '$remote_addr - $remote_user [$time_local] "$request" '
                               '$status $body_bytes_sent "$http_referer" '
                               '"$http_user_agent" "$http_x_forwarded_for"';

	access_log /var/log/nginx/access.log;
}
This log format yields the following log entry.
127.0.0.1 - dbmanager [20/Nov/2017:18:52:17 +0000] "GET / HTTP/1.1" 401 188 "-" "Mozilla/5.0 (X11; Ubuntu; Linux x86_64; rv:47.0) Gecko/20100101 Firefox/47.0"
The following is another useful logging format which we use for tracing requests to our web applications using the some of the default variables, it most importantly has the request ID and logs client location details (country, country code, region and city).
/etc/nginx/nginx.conf
log_format  custom '$remote_addr - $remote_user [$time_local] '
                         	     '"$request" $status $body_bytes_sent '
                      		     '"$http_referer" "$http_user_agent" '
                     		     '"$http_x_forwarded_for" $request_id '
                   		     '$geoip_country_name $geoip_country_code '
                  		     '$geoip_region_name $geoip_city ';
You can use it like this:
access_log /var/log/nginx/access.log custom;
This will produce a log entry which appears like this.
153.78.107.192 - - [21/Nov/2017:08:45:45 +0000] "POST /ngx_pagespeed_beacon?url=https%3A%2F%2Fwww.example.com%2Fads%2Ffresh-oranges-1509260795 HTTP/2.0" 204 0 "https://www.suasell.com/ads/fresh-oranges-1509260795" "Mozilla/5.0 (X11; Ubuntu; Linux x86_64; rv:47.0) Gecko/20100101 Firefox/47.0" "-" a02b2dea9cf06344a25611c1d7ad72db Uganda UG Kampala Kampala
You can specify several logs using the access_log directives on the same level, here we are using more than one log file in the http context.
/etc/nginx/nginx.conf
http{
	##default log format
	log_format  main  '$remote_addr - $remote_user [$time_local] "$request" '
                                	      '$status $body_bytes_sent "$http_referer" '
                                         '"$http_user_agent" "$http_x_forwarded_for"';

	##request tracing using custom format
	log_format custom '$remote_addr - $remote_user [$time_local] '
                                           '"$request" $status $body_bytes_sent '
                                           '"$http_referer" "$http_user_agent" '
                                           '"$http_x_forwarded_for" $request_id '
                                           '$geoip_country_name $geoip_country_code '
                                          '$geoip_region_name $geoip_city ';

	##this uses the default log format
	access_log /var/log/nginx/access.log;

	##this uses the our custom log format
	access_log /var/log/nginx/custom_log custom;
}
The following are more advanced logging configurations examples, which are useful for log formats that contain compression-related variables and for creating compressed log files:
access_log /var/log/nginx/custom_log custom buffer 32k;
access_log /path/to/log.gz compression  gzip  flush=5m;
Configuring Error Logs in Nginx
In case Nginx experiences any glitches, it records information concerning them in the error log. These issues fall under different severity levels: debug, info, notice, warn, error (this is the default level and works globally), crit, alert, or emerg.
The default log file is log/error.log, but it is normally located in /var/log/nginx/ on Linux distributions. The error_log directive is used to specify the log file, and it can be used in the main, http, mail, stream, server, location context (in that order).
You should also note that:
- Configurations in the main context are always inherited by lower levels in the order above.
- and configurations in the lower levels override the configurations inherited from the higher levels.
You can configure error logging using the following syntax:
error_log /path/to/log_file log_level;
For example:
error_log /var/log/nginx/error_log warn;
This will instruct Nginx to log all messages of type warn and more severe log level crit, alert, and emerg messages.
In the next example, messages of crit, alert, and emerg levels will be logged.
error_log /var/www/example1.com/log/error_log crit;
Consider the configuration below, here, we have defined error logging on different levels (in the http and server context). In case of an error, the message is written to only one error log, the one closest to the level where the error has appeared.
/etc/nginx/nginx.conf
http {
	log_format compression '$remote_addr - $remote_user [$time_local] '
                           '"$request" $status $body_bytes_sent '
                           '"$http_referer" "$http_user_agent" "$gzip_ratio"';

	error_log  /var/log/nginx/error_log  crit;

    	server {
		listen 80;
		server_name example1.com;

		#this logs errors messages for example1.com only
      		error_log  /var/log/nginx/example1.error_log  warn;
            	…...
	}

     	server {
		listen 80;
		server_name  example2.com;

		#this logs errors messages for example2.com only
        		error_log  /var/log/nginx/example1.error_log;
        		…….
    	}
}
If you use more than one error_log directives as in the configuration below (same level), the messages are written to all specified logs.
/etc/nginx/nginx.conf
server {
		listen 80;
		server_name example1.com;

      		error_log  /var/www/example1.com/log/error_log  warn;
		error_log  /var/log/nginx/example1.error_log  crit;
            	…...
	}
Configuring Conditional Logging in Nginx
In some cases, we may want Nginx to perform conditional logging of messages. Not every message has to be logged by Nginx, therefore we can ignore insignificant or less important log entries from our access logs for particular instances.
We can use the ngx_http_map_module module which creates variables whose values depend on values of other variables. The parameters inside a map block (which should exist in the http content only) specify a mapping between source and resulting values.
For this kind of setting, a request will not be logged if the condition evaluates to “0” or an empty string. This example excludes requests with HTTP status codes 2xx and 3xx.
/etc/nginx/nginx.conf
http{
	map $status $condition {
		~^[23] 0;
    		default 1;
	}
	server{
		access_log  /path/to/access.log  custom if=$condition;
	}
}
Here is another useful example for debugging a web application in a development phase. This will ignore all messages and only log debug information.
/etc/nginx/nginx.conf
http{
	map $info  $debuggable {
    		default     0;
    		debug       1;
	}
	server{
		……..
		access_log /var/log/nginx/testapp_debug_access_log  debug if=$debuggable;
		#logs other requests
		access_log  /var/log/nginx/testapp_access.log  main;
		…….
	}
}
You can find out more information, including logging to syslog here.
That’s all for now! In this guide, we explained how to configure custom logging format for access and error logs in Nginx. Use the feedback form below to ask questions or share you thoughts about this article.