![]()
ENV:
kubernetes: v1.13.2
docker: 18.06.1-ce
system: ubuntu 18.04
architecture: arm-64
metrics-server: v0.3.1
Before I apply the 1.8+/ development, I try the command
kubectl top nodes
Then I got the error:
Error from server (NotFound): the server could not find the requested resource (get services http:heapster:)
After that I download the heapster from https://github.com/kubernetes-retired/heapster and apply the deploy.
The I run the
kubectl apply -f 1.8+/
and check the pods by
kubectl get pods —all-namespaces
The result are as follows:
NAMESPACE NAME READY STATUS RESTARTS AGE
default back-flask-86cbc75cd9-jdgwr 1/1 Running 0 3h53m
default demo-flask-756f45c879-68fvk 1/1 Running 0 3h53m
kube-system coredns-86c58d9df4-c4bv4 1/1 Running 0 4h16m
kube-system coredns-86c58d9df4-cbdvq 1/1 Running 0 4h16m
kube-system etcd-robbon-vivobook 1/1 Running 0 4h15m
kube-system heapster-f64999bc-2klfs 1/1 Running 0 91s
kube-system kube-apiserver-robbon-vivobook 1/1 Running 0 4h15m
kube-system kube-controller-manager-robbon-vivobook 1/1 Running 0 4h15m
kube-system kube-flannel-ds-amd64-8fxvb 1/1 Running 0 4h13m
kube-system kube-flannel-ds-amd64-xjsk6 1/1 Running 0 4h14m
kube-system kube-proxy-4smxt 1/1 Running 0 4h13m
kube-system kube-proxy-vv5xh 1/1 Running 0 4h16m
kube-system kube-scheduler-robbon-vivobook 1/1 Running 0 4h15m
kube-system kubernetes-dashboard-697f86d999-jk4b7 1/1 Running 0 3h33m
kube-system metrics-server-7d8db6b444-tzgbk 1/1 Running 0 19s
kube-system monitoring-grafana-57cbc5c659-zj6fq 1/1 Running 0 91s
kube-system monitoring-influxdb-7f897d5cc8-c2fsh 1/1 Running 0 91s
But when I run kubectl top nodes to check, I get another error:
error: metrics not available yet
So, what’s wrong with this?
![]()
![]()
Does your apiserver open the aggregation layer?
--requestheader-client-ca-file=/etc/kubernetes/certs/proxy-ca.crt --requestheader-allowed-names=aggregator --requestheader-extra-headers-prefix=X-Remote-Extra- --requestheader-group-headers=X-Remote-Group --requestheader-username-headers=X-Remote-User --proxy-client-cert-file=/etc/kubernetes/certs/proxy.crt --proxy-client-key-file=/etc/kubernetes/certs/proxy.key
and how about your rolebinding?
![]()
its probably the self signed cert on your cluster.
Try enabling --kubelet-insecure-tls
As in
apiVersion: extensions/v1beta1
kind: Deployment
metadata:
  name: metrics-server
      containers:
      - name: metrics-server
        image: k8s.gcr.io/metrics-server-amd64:v0.3.3
        imagePullPolicy: Always
        args: [ "--kubelet-insecure-tls" ]
        volumeMounts:
        - name: tmp-dir
          mountPath: /tmp
patrickscottbest and bencatic reacted with hooray emoji
![]()
I had the «error: metrics not available yet» message. @latchmihay pointer fixed it. Thank you.
![]()
I have similar problem. It says metrics not available for node or pod. It still reports
kubectl top nodes
error: metrics not available yet
Here is my configuration.
apiVersion: extensions/v1beta1
kind: Deployment
metadata:
  name: metrics-server
  namespace: kube-system
  labels:
    k8s-app: metrics-server
spec:
  selector:
    matchLabels:
      k8s-app: metrics-server
  template:
    metadata:
      name: metrics-server
      labels:
        k8s-app: metrics-server
    spec:
      serviceAccountName: metrics-server
      volumes:
      # mount in tmp so we can safely use from-scratch images and/or read-only containers
      - name: tmp-dir
        emptyDir: {}
      containers:
      - name: metrics-server
        image: k8s.gcr.io/metrics-server-amd64:v0.3.3
        args: [ "--kubelet-insecure-tls" ]
        imagePullPolicy: Always
        volumeMounts:
        - name: tmp-dir
          mountPath: /tmp
![]()
![]()
@sreedharbukya I have the same error and try all the method above mentioned but still not work, may u post ur solution?
![]()
@regardfs, Please follow below instructions.
If you are using kops for creating the cluster.
kops edit cluster --name {cluster_name}
edit following part
    kubelet:
    anonymousAuth: false
    authenticationTokenWebhook: true
    authorizationMode: Webhook
you have run following commands
kops update cluster --yes
kops rolling-update cluster--yes
Watch out your logs.
This should resolve the issue.
Next is update your metrics-server deployments to following.
kind: Deployment
metadata:
  annotations:
    deployment.kubernetes.io/revision: ""
    kubectl.kubernetes.io/last-applied-configuration: |
      {"apiVersion":"extensions/v1beta1","kind":"Deployment","metadata":{"annotations":{},"labels":{"k8s-app":"metrics-server"},"name":"metrics-server","namespace":"kube-system"},"spec":{"selector":{"matchLabels":{"k8s-app":"metrics-server"}},"template":{"metadata":{"labels":{"k8s-app":"metrics-server"},"name":"metrics-server"},"spec":{"containers":[{"image":"k8s.gcr.io/metrics-server-amd64:v0.3.3","imagePullPolicy":"Always","name":"metrics-server","volumeMounts":[{"mountPath":"/tmp","name":"tmp-dir"}]}],"serviceAccountName":"metrics-server","volumes":[{"emptyDir":{},"name":"tmp-dir"}]}}}}
  creationTimestamp: "2019-07-19T10:31:07Z"
  generation: 2
  labels:
    k8s-app: metrics-server
  name: metrics-server
  namespace: kube-system
  resourceVersion: "8715"
  selfLink: /apis/extensions/v1beta1/namespaces/kube-system/deployments/metrics-server
  uid: 5145dcbb-aa10-11e9-bd85-06b142917002
spec:
  progressDeadlineSeconds: 2147483647
  replicas: 1
  revisionHistoryLimit: 10
  selector:
    matchLabels:
      k8s-app: metrics-server
  strategy:
    rollingUpdate:
      maxSurge: 1
      maxUnavailable: 1
    type: RollingUpdate
  template:
    metadata:
      creationTimestamp: null
      labels:
        k8s-app: metrics-server
      name: metrics-server
    spec:
      containers:
      - command:
        - /metrics-server
        - --v=2
        - --kubelet-preferred-address-types=InternalIP
        - --kubelet-insecure-tls=true
        image: k8s.gcr.io/metrics-server-amd64:v0.3.3
        imagePullPolicy: Always
        name: metrics-server
        resources: {}
        terminationMessagePath: /dev/termination-log
        terminationMessagePolicy: File
        volumeMounts:
        - mountPath: /tmp
          name: tmp-dir
      dnsPolicy: ClusterFirst
      restartPolicy: Always
      schedulerName: default-scheduler
      securityContext: {}
      serviceAccount: metrics-server
      serviceAccountName: metrics-server
      terminationGracePeriodSeconds: 30
      volumes:
      - emptyDir: {}
        name: tmp-dir
status:
  availableReplicas: 1
  conditions:
  - lastTransitionTime: "2019-07-19T10:31:07Z"
    lastUpdateTime: "2019-07-19T10:31:07Z"
    message: Deployment has minimum availability.
    reason: MinimumReplicasAvailable
    status: "True"
    type: Available
  observedGeneration: 2
  readyReplicas: 1
  replicas: 1
  updatedReplicas: 1```
![]()
@sreedharbukya Thank you!
I have an AWS EKS Cluster and default installation of metrics server from Helm.
These two parameters solved the problem:
--kubelet-preferred-address-types=InternalIP
--kubelet-insecure-tls=true
![]()
As pointed in the documentation, using --kubelet-insecure-tls=true is not recommended for production environments.
That said, how do we deploy metrics-server securely using tls?
![]()
I have the same error here «metrics not available yet» .. The pod logs is showing this message:
I0925 20:15:33.886593 1 serving.go:312] Generated self-signed cert (apiserver.local.config/certificates/apiserver.crt, apiserver.local.config/certificates/apiserver.key)
I0925 20:15:34.430030 1 secure_serving.go:116] Serving securely on [::]:443
E0925 20:15:46.541160 1 reststorage.go:135] unable to fetch node metrics for node «k8s-worker-1»: no metrics known for node
![]()
I’m facing the same problem for nodes, but not for pods. Kubelet Insecure TLS is set : no change.
$ kubectl top pod -n default
NAME                                        CPU(cores)   MEMORY(bytes)
resource-consumer-5766d495c6-bm47z          15m           5Mi
resource-consumer-5766d495c6-rtkzk           6m           5Mi
unprivileged-hello-world-658f6f7f49-dq6js    0m           6Mi
$ kubectl top node
error: metrics not available yet
$ kubectl get deploy metrics-server -o yaml | grep -B6 insecure
      - command:
        - /metrics-server
        - --logtostderr
        - --cert-dir=/tmp
        - --secure-port=8443
        - --kubelet-preferred-address-types=InternalIP
        - --kubelet-insecure-tls
![]()
no metrics known for node itself doesn’t point to a problem. More details here: #349 for details.
@ledroide Could you provide metrics-server logs
![]()
@serathius : Here are logs from metrics-server, filtered for matching «node» : https://gist.github.com/ledroide/0cbc6750cab7d6ae0371b88c97aee44e
Exemple of what I’m seeing in these logs :
E1105 13:30:06.940698       1 manager.go:111] unable to fully collect metrics: unable to fully scrape metrics from source kubelet_summary:kube-poc-compute3: unable to get CPU for container "sentinel" in pod webs/webs-sentinel-redis-slave-0 on node "10.150.233.53", discarding data: missing cpu usage metric
E1105 13:44:06.541969       1 manager.go:111] unable to fully collect metrics: [unable to fully scrape metrics from source kubelet_summary:kube-poc-compute4: unable to get CPU for container "sentinel" in pod webs/webs-sentinel-redis-slave-0 on node "10.150.233.54", discarding data: missing cpu usage metric, unable to fully scrape metrics from source kubelet_summary:kube-poc-compute3: unable to get CPU for container "metrics" in pod webs/webs-sentinel-redis-master-0 on node "10.150.233.53", discarding data: missing cpu usage metric]
![]()
Can you verify that kubelet is exposing cpu metrics?
kubectl get --raw /api/v1/nodes/kube-poc-compute3/proxy/stats/summary | jq '.node'
You can skip using | jq '.node', it just filters node data
![]()
I have copied the output of the command kubectl get --raw /api/v1/nodes/kube-poc-compute3/proxy/stats/summary | jq '.node' at the end of the same gist.
Output looks good to me.
![]()
Looks like node exposes UsageNanoCores correctly and I don’t see log that mentions broken node metrics (unable to get CPU for node) .
Can you verify that kubectl top node still fails?
![]()
Of course, still failing :
$ kubectl top node
error: metrics not available yet
![]()
Last check before I would need to deepdive into code. Need to eliminate if the problem is with kubectl top and not the api.
Please run
kubectl get --raw /apis/metrics.k8s.io/v1beta1/nodes/kube-poc-compute3
kubectl version
Are you running heapster in cluster?
![]()
I think we reach the problem here : the nodes list is empty
$ kubectl get --raw /apis/metrics.k8s.io/v1beta1/nodes/
{"kind":"NodeMetricsList","apiVersion":"metrics.k8s.io/v1beta1","metadata":{"selfLink":"/apis/metrics.k8s.io/v1beta1/nodes/"},"items":[]}
$ kubectl get --raw /apis/metrics.k8s.io/v1beta1/nodes/kube-poc-compute3
Error from server (NotFound): nodemetrics.metrics.k8s.io "kube-poc-compute3" not found
By the way, I use kubernetes 1.16.2, and no heapster
$ kubectl version
Client Version: version.Info{Major:"1", Minor:"16", GitVersion:"v1.16.2", GitCommit:"c97fe5036ef3df2967d086711e6c0c405941e14b", GitTreeState:"clean", BuildDate:"2019-10-17T17:16:09Z", GoVersion:"go1.12.10", Compiler:"gc", Platform:"linux/amd64"}
Server Version: version.Info{Major:"1", Minor:"16", GitVersion:"v1.16.2", GitCommit:"c97fe5036ef3df2967d086711e6c0c405941e14b", GitTreeState:"clean", BuildDate:"2019-10-15T19:09:08Z", GoVersion:"go1.12.10", Compiler:"gc", Platform:"linux/amd64"}

$ kubectl api-versions | grep metrics
metrics.k8s.io/v1beta1

$ kubectl api-resources -o wide | egrep '^NAME|metrics'
NAME                              SHORTNAMES   APIGROUP                        NAMESPACED   KIND                             VERBS
nodes                                          metrics.k8s.io                  false        NodeMetrics                      [get list]
pods                                           metrics.k8s.io                  true         PodMetrics                       [get list]
![]()
Solved.
I removed metrics-server and reinstalled it (using Kubespray).
It is ugly, but smoother or cleaner methods did not work at all.
Now it works properly. Thank you very much @serathius for you precious help :
$ kubectl get --raw /apis/metrics.k8s.io/v1beta1/nodes/kube-poc-compute3
{"kind":"NodeMetrics","apiVersion":"metrics.k8s.io/v1beta1","metadata":{"name":"kube-poc-compute3","selfLink":"/apis/metrics.k8s.io/v1beta1/nodes/kube-poc-compute3","creationTimestamp":"2019-11-12T09:42:21Z"},"timestamp":"2019-11-12T09:41:57Z","window":"30s","usage":{"cpu":"849755531n","memory":"8506004Ki"}}
![]()
Solved by following steps :
- Clone https://github.com/kubernetes-sigs/metrics-server
- Disable the metrics-server addon for minikube in case it was enabled
minikube addons disable metrics-server - Deploy the latest metric-server
kubectl create -f deploy/1.8+/ - Edit metric-server deployment to add the flags
# args:
# - --kubelet-insecure-tls
# - --kubelet-preferred-address-types=InternalIP,ExternalIP,Hostname
$ kubectl edit deploy -n kube-system metrics-server
- Wait for 1 minute and boom metrics are available.

![]()
Hello, I have the same problem…
I have deleted the metrics-server then re-installed it with the args mentioned by @neerajjain92 but I’m afraid nothing is happening.
1 desired | 1 updated | 1 total | 0 available | 1 unavailable
![]()
I had the same problem with Kubernetes 1.16 installed by kops on AWS. I found that a heapster is still installed on the server. When I removed the heapster (it was installed using helm), the command kubectl top nodes started to work.
![]()
![]()
The problem happened to me and none of the suggestion above worked because the problem wasn’t metrics. The problem was because the 443 and 80 was busy. I had apache server running. If yo have any application running on those ports try to kill them before anything.
![]()
@regardfs, Please follow below instructions.
If you are using kops for creating the cluster.
kops edit cluster --name {cluster_name}edit following part
    kubelet:
    anonymousAuth: false
    authenticationTokenWebhook: true
    authorizationMode: Webhook
you have run following commands
kops update cluster --yes
kops rolling-update cluster--yesWatch out your logs.
This should resolve the issue.
Next is update your metrics-server deployments to following.
kind: Deployment
metadata:
  annotations:
    deployment.kubernetes.io/revision: ""
    kubectl.kubernetes.io/last-applied-configuration: |
      {"apiVersion":"extensions/v1beta1","kind":"Deployment","metadata":{"annotations":{},"labels":{"k8s-app":"metrics-server"},"name":"metrics-server","namespace":"kube-system"},"spec":{"selector":{"matchLabels":{"k8s-app":"metrics-server"}},"template":{"metadata":{"labels":{"k8s-app":"metrics-server"},"name":"metrics-server"},"spec":{"containers":[{"image":"k8s.gcr.io/metrics-server-amd64:v0.3.3","imagePullPolicy":"Always","name":"metrics-server","volumeMounts":[{"mountPath":"/tmp","name":"tmp-dir"}]}],"serviceAccountName":"metrics-server","volumes":[{"emptyDir":{},"name":"tmp-dir"}]}}}}
  creationTimestamp: "2019-07-19T10:31:07Z"
  generation: 2
  labels:
    k8s-app: metrics-server
  name: metrics-server
  namespace: kube-system
  resourceVersion: "8715"
  selfLink: /apis/extensions/v1beta1/namespaces/kube-system/deployments/metrics-server
  uid: 5145dcbb-aa10-11e9-bd85-06b142917002
spec:
  progressDeadlineSeconds: 2147483647
  replicas: 1
  revisionHistoryLimit: 10
  selector:
    matchLabels:
      k8s-app: metrics-server
  strategy:
    rollingUpdate:
      maxSurge: 1
      maxUnavailable: 1
    type: RollingUpdate
  template:
    metadata:
      creationTimestamp: null
      labels:
        k8s-app: metrics-server
      name: metrics-server
    spec:
      containers:
      - command:
        - /metrics-server
        - --v=2
        - --kubelet-preferred-address-types=InternalIP
        - --kubelet-insecure-tls=true
        image: k8s.gcr.io/metrics-server-amd64:v0.3.3
        imagePullPolicy: Always
        name: metrics-server
        resources: {}
        terminationMessagePath: /dev/termination-log
        terminationMessagePolicy: File
        volumeMounts:
        - mountPath: /tmp
          name: tmp-dir
      dnsPolicy: ClusterFirst
      restartPolicy: Always
      schedulerName: default-scheduler
      securityContext: {}
      serviceAccount: metrics-server
      serviceAccountName: metrics-server
      terminationGracePeriodSeconds: 30
      volumes:
      - emptyDir: {}
        name: tmp-dir
status:
  availableReplicas: 1
  conditions:
  - lastTransitionTime: "2019-07-19T10:31:07Z"
    lastUpdateTime: "2019-07-19T10:31:07Z"
    message: Deployment has minimum availability.
    reason: MinimumReplicasAvailable
    status: "True"
    type: Available
  observedGeneration: 2
  readyReplicas: 1
  replicas: 1
  updatedReplicas: 1```
didn’t had to update the deployment tough. —insecure tls and kops update cluster did the trick for me thank you
![]()
I’m facing the same problem for nodes, but not for pods. Kubelet Insecure TLS is set : no change.
$ kubectl top pod -n default
NAME                                        CPU(cores)   MEMORY(bytes)
resource-consumer-5766d495c6-bm47z          15m           5Mi
resource-consumer-5766d495c6-rtkzk           6m           5Mi
unprivileged-hello-world-658f6f7f49-dq6js    0m           6Mi
$ kubectl top node error: metrics not available yet$ kubectl get deploy metrics-server -o yaml | grep -B6 insecure- command: - /metrics-server - --logtostderr - --cert-dir=/tmp - --secure-port=8443 - --kubelet-preferred-address-types=InternalIP - --kubelet-insecure-tls
This setup worked for me, except I left the secure-port at 4443, which was how it was installed via the deployment script. Now I can get top on both node and pods.
![]()
its probably the self signed cert on your cluster.
Try enabling--kubelet-insecure-tlsAs in
apiVersion: extensions/v1beta1 kind: Deployment metadata: name: metrics-servercontainers: - name: metrics-server image: k8s.gcr.io/metrics-server-amd64:v0.3.3 imagePullPolicy: Always args: [ "--kubelet-insecure-tls" ] volumeMounts: - name: tmp-dir mountPath: /tmp
I had the same problem, and I had fix it by add args as you, thankyou
![]()
![]()
Of course, still failing :
$ kubectl top node
error: metrics not available yet
do u have solve it?
![]()
@kevinsingapore
I recommend to create separate issue, as in this issue we didn’t even manage to fix original problem that reporter had.
error: metrics not available yet
Signifies that there is a problem with metrics-server, but says nothing about what’s the problem. Meaning that this issue isn’t really helpful for others (e.g. @ledroide just recreated MS).
Could try some suggestions from this issue, still it would be better to tackle each setup separately.
![]()
I had a similiar problem on minikube running on windows 10 home. Your tutorial helped me.
Thank you, @neerajjain92 !
![]()
Solved by following steps :
- Clone https://github.com/kubernetes-sigs/metrics-server
- Disable the metrics-server addon for minikube in case it was enabled
minikube addons disable metrics-server- Deploy the latest metric-server
kubectl create -f deploy/1.8+/- Edit metric-server deployment to add the flags
# args: # - --kubelet-insecure-tls # - --kubelet-preferred-address-types=InternalIP,ExternalIP,Hostname $ kubectl edit deploy -n kube-system metrics-server
- Wait for 1 minute and boom metrics are available.

It worked, Thx.
![]()
I had the same problem,this is my config:
[root@k8s-master data]# kubectl get pods —all-namespaces
NAMESPACE NAME READY STATUS RESTARTS AGE
default whoami-7c8d684c55-vmc9x 1/1 Running 1 20h
kube-system coredns-6d56c8448f-g98fb 1/1 Running 3 2d
kube-system coredns-6d56c8448f-nhmk7 1/1 Running 3 2d
kube-system etcd-k8s-master 1/1 Running 5 2d
kube-system heapster-7fcb4d8889-nm2ln 1/1 Running 0 15h
kube-system kube-apiserver-k8s-master 1/1 Running 5 2d
kube-system kube-controller-manager-k8s-master 1/1 Running 8 47h
kube-system kube-flannel-ds-662nb 1/1 Running 1 21h
kube-system kube-flannel-ds-8njs6 1/1 Running 0 21h
kube-system kube-flannel-ds-d2z4w 1/1 Running 3 21h
kube-system kube-proxy-2blhp 1/1 Running 3 46h
kube-system kube-proxy-6hjpl 1/1 Running 1 47h
kube-system kube-proxy-zsvrh 1/1 Running 4 2d
kube-system kube-scheduler-k8s-master 1/1 Running 8 47h
kube-system monitoring-grafana-6d69444f6-fr9bp 1/1 Running 2 41h
kube-system monitoring-influxdb-64596c7b6d-jzskg 1/1 Running 1 41h
kubernetes-dashboard dashboard-metrics-scraper-7b59f7d4df-4mkbb 1/1 Running 0 16h
kubernetes-dashboard kubernetes-dashboard-665f4c5ff-9v8kf 1/1 Running 0 16h
[root@k8s-master k8s]# kubectl version
Client Version: version.Info{Major:»1″, Minor:»19″, GitVersion:»v1.19.2″, GitCommit:»f5743093fd1c663cb0cbc89748f730662345d44d», GitTreeState:»clean», BuildDate:»2020-09-16T13:41:02Z», GoVersion:»go1.15″, Compiler:»gc», Platform:»linux/amd64″}
Server Version: version.Info{Major:»1″, Minor:»19″, GitVersion:»v1.19.2″, GitCommit:»f5743093fd1c663cb0cbc89748f730662345d44d», GitTreeState:»clean», BuildDate:»2020-09-16T13:32:58Z», GoVersion:»go1.15″, Compiler:»gc», Platform:»linux/amd64″}
[root@k8s-master k8s]# kubectl top po
error: Metrics API not available
heapster logs:
W0924 01:44:25.002300 1 manager.go:152] Failed to get all responses in time (got 0/3)
E0924 01:45:05.001192 1 manager.go:101] Error in scraping containers from kubelet:192.168.28.143:10250: failed to get all container stats from Kubelet URL «https://192.168.28.143:10250/stats/container/»: «https://192.168.28.143:10250/stats/container/» not found
E0924 01:45:05.007179 1 manager.go:101] Error in scraping containers from kubelet:192.168.28.141:10250: failed to get all container stats from Kubelet URL «https://192.168.28.141:10250/stats/container/»: «https://192.168.28.141:10250/stats/container/» not found
E0924 01:45:05.015769 1 manager.go:101] Error in scraping containers from kubelet:192.168.28.142:10250: failed to get all container stats from Kubelet URL «https://192.168.28.142:10250/stats/container/»:
[root@k8s-master data]# netstat -nultp
Active Internet connections (only servers)
Proto Recv-Q Send-Q Local Address Foreign Address State PID/Program name
tcp 0 0 0.0.0.0:31303 0.0.0.0:* LISTEN 126245/kube-proxy
tcp 0 0 127.0.0.1:10248 0.0.0.0:* LISTEN 1059/kubelet
tcp 0 0 127.0.0.1:10249 0.0.0.0:* LISTEN 126245/kube-proxy
tcp 0 0 192.168.28.141:2379 0.0.0.0:* LISTEN 126075/etcd
tcp 0 0 127.0.0.1:2379 0.0.0.0:* LISTEN 126075/etcd
tcp 0 0 192.168.28.141:2380 0.0.0.0:* LISTEN 126075/etcd
tcp 0 0 127.0.0.1:2381 0.0.0.0:* LISTEN 126075/etcd
tcp 0 0 127.0.0.1:10257 0.0.0.0:* LISTEN 15888/kube-controll
tcp 0 0 127.0.0.1:10259 0.0.0.0:* LISTEN 15947/kube-schedule
tcp 0 0 0.0.0.0:30101 0.0.0.0:* LISTEN 126245/kube-proxy
tcp 0 0 0.0.0.0:22 0.0.0.0:* LISTEN 1056/sshd
tcp 0 0 127.0.0.1:41111 0.0.0.0:* LISTEN 1059/kubelet
tcp 0 0 0.0.0.0:31001 0.0.0.0:* LISTEN 126245/kube-proxy
tcp 0 0 127.0.0.1:25 0.0.0.0:* LISTEN 1206/master
tcp 0 0 0.0.0.0:30108 0.0.0.0:* LISTEN 126245/kube-proxy
tcp6 0 0 :::10250 :::* LISTEN 1059/kubelet
tcp6 0 0 :::10251 :::* LISTEN 15947/kube-schedule
tcp6 0 0 :::6443 :::* LISTEN 125805/kube-apiserv
tcp6 0 0 :::10252 :::* LISTEN 15888/kube-controll
tcp6 0 0 :::10256 :::* LISTEN 126245/kube-proxy
tcp6 0 0 :::22 :::* LISTEN 1056/sshd
tcp6 0 0 ::1:25 :::* LISTEN 1206/master
udp 0 0 10.244.0.1:123 0.0.0.0:* 838/ntpd
udp 0 0 10.244.0.0:123 0.0.0.0:* 838/ntpd
udp 0 0 172.17.0.1:123 0.0.0.0:* 838/ntpd
udp 0 0 192.168.28.141:123 0.0.0.0:* 838/ntpd
udp 0 0 127.0.0.1:123 0.0.0.0:* 838/ntpd
udp 0 0 0.0.0.0:123 0.0.0.0:* 838/ntpd
udp 0 0 0.0.0.0:8472 0.0.0.0:* —
udp6 0 0 fe80::98d8:4aff:fef:123 :::* 838/ntpd
udp6 0 0 fe80::888f:dfff:feb:123 :::* 838/ntpd
udp6 0 0 fe80::886a:32ff:fed:123 :::* 838/ntpd
udp6 0 0 fe80::c89e:ecff:fed:123 :::* 838/ntpd
udp6 0 0 fe80::20c:29ff:febc:123 :::* 838/ntpd
udp6 0 0 ::1:123 :::* 838/ntpd
udp6 0 0 :::123 :::* 838/ntpd
is namespace question?
![]()
if you use bitnami metrics-server, enable this even k8s > 1.18
apiService:
create: true
RiskyAdventure, shaikatz, miroslav-chandler, nickpetrovic, donovanmuller, onedr0p, kingdonb, ingram90, jacobscunn07, guspio, and 2 more reacted with hooray emoji
evg-rz reacted with rocket emoji
![]()
I only needed --kubelet-preferred-address-types=InternalIP to fix it. With the Terraform Helm Provider the value must be an array, which uses { and } and values are separated by ,.
resource "helm_release" "metrics-server" { create_namespace = true namespace = "platform" name = "metrics-server" repository = "https://charts.helm.sh/stable" chart = "metrics-server" set { name = "args" value = "{"--kubelet-preferred-address-types=InternalIP"}" } }
![]()
Edit: this report definitely does not belong here, sorry for contributing to the noise
I was able to resolve it by switching from the bitnami helm chart for metrics server, to kustomized deploy of metrics-server from this repo, with very similar to «test» kustomize manifests. Thank you for providing this.
I am on kubeadm v1.20.2 with a matching kubectl and I had to set apiService.create: true as @debu99 suggested.
This is in conflict with the docs in values.yaml which are maybe incorrect
## API service parameters
##
apiService:
## Specifies whether the v1beta1.metrics.k8s.io API service should be created
## This should not be necessary in k8s version >= 1.8, but depends on vendors and cloud providers.
##
create: false
Else I ran into error: Metrics API not available
While that’s not the subject of this issue report, this issue is one of the top results for «error: Metrics API not available» and it helped me, so I am highlighting it here.
I am not sure if this information belongs here, I’m using bitnami/metrics-server which has a repo of its own in https://github.com/bitnami/charts/ and so I guess the new issue report should go there, if there is a problem.
![]()
I also was getting the same problem, by running all the YAML files in metrics-server the problem has resolved:
- First clone this git repository into your system using
git clone https://github.com/Sonal0409/DevOps_ClassNotes.git - Then go to the KUBERNETES folder
- Inside that again go into ‘hpa’ folder
- Again go into ‘metric-server folder.
- And finally from this folder execute all the YAML files by giving this command » kubectl create -f .»
- In the fifth step there is a dot at the end of the command, don’t forget to include that while running your command.
- After 2 to 3 minutes you can get the metrics of the pods and nodes as well by using this command » kubectl top nodes» or «kubectl top pods»
![]()
I have the same issue but a different cause. I enabled cgroup v2 on the nodes, now kubectl top pods works well, but kubectl top nodes got error: metrics not available yet. After I added --v=2 to metrics-server command line args, I saw below messages in the metrics-server logs:
I0913 13:33:52.271928 1 scraper.go:136] "Scraping node" node="ub2004"
I0913 13:33:52.279175 1 decode.go:71] "Skipped node CPU metric" node="ub2004" err="Got UsageCoreNanoSeconds equal zero"
I0913 13:33:52.279275 1 decode.go:75] "Skipped node memory metric" node="ub2004" err="Got WorkingSetBytes equal zero"
I0913 13:33:52.279309 1 scraper.go:157] "Scrape finished" duration="9.497485ms" nodeCount=0 podCount=6
Is this a known issue?
![]()
Edit: this report definitely does not belong here, sorry for contributing to the noise
I was able to resolve it by switching from the bitnami helm chart for metrics server, to kustomized deploy of metrics-server from this repo, with very similar to «test» kustomize manifests. Thank you for providing this.
I am on kubeadm
v1.20.2with a matching kubectl and I had to setapiService.create: trueas @debu99 suggested.This is in conflict with the docs in
values.yamlwhich are maybe incorrect## API service parameters ## apiService: ## Specifies whether the v1beta1.metrics.k8s.io API service should be created ## This should not be necessary in k8s version >= 1.8, but depends on vendors and cloud providers. ## create: falseElse I ran into
error: Metrics API not availableWhile that’s not the subject of this issue report, this issue is one of the top results for «error: Metrics API not available» and it helped me, so I am highlighting it here.
I am not sure if this information belongs here, I’m using bitnami/metrics-server which has a repo of its own in https://github.com/bitnami/charts/ and so I guess the new issue report should go there, if there is a problem.
Thanks you, i’m using minikube 1.22 with kubernetes version 1.21.2 and this was the solution. I enabled creation of apiServer in values and it works fine!.
minikube version: v1.22.0
NAME STATUS ROLES AGE VERSION
minikube Ready control-plane,master 5d12h v1.21.2
![]()
If you are installing a bit higher version then update the deployment as,
apiVersion: apps/v1
kind: Deployment
metadata:
name: metrics-server
namespace: kube-system
labels:
k8s-app: metrics-server
spec:
selector:
matchLabels:
k8s-app: metrics-server
template:
metadata:
name: metrics-server
labels:
k8s-app: metrics-server
spec:
serviceAccountName: metrics-server
volumes:
# mount in tmp so we can safely use from-scratch images and/or read-only containers
- name: tmp-dir
emptyDir: {}
containers:
- name: metrics-server
image: k8s.gcr.io/metrics-server/metrics-server:v0.3.7
imagePullPolicy: IfNotPresent
args:
- --kubelet-insecure-tls
- --cert-dir=/tmp
- --secure-port=4443
ports:
- name: main-port
containerPort: 4443
protocol: TCP
securityContext:
readOnlyRootFilesystem: true
runAsNonRoot: true
runAsUser: 1000
volumeMounts:
- name: tmp-dir
mountPath: /tmp
nodeSelector:
kubernetes.io/os: linux
Kubernetes not able to find metric-server api.I am using Kubernetes with Docker on Mac. I was trying to do HPA from following example. However, when I execute command kubectl get hpa, My target still was unknown. Then I tried, kubectl describe hpa. Which gave me error like below:
Name: php-apache
Namespace: default
Labels: <none>
Annotations: <none>
CreationTimestamp: Sun, 07 Oct 2018 12:36:31 -0700
Reference: Deployment/php-apache
Metrics: ( current / target )
resource cpu on pods (as a percentage of request): <unknown> / 5%
Min replicas: 1
Max replicas: 10
Conditions:
Type Status Reason Message
---- ------ ------ -------
AbleToScale True SucceededGetScale the HPA controller was able to get the target's current scale
ScalingActive False FailedGetResourceMetric the HPA was unable to compute the replica count: unable to get metrics for resource cpu: no metrics returned from resource metrics API
Events:
Type Reason Age From Message
---- ------ ---- ---- -------
Warning FailedComputeMetricsReplicas 1h (x34 over 5h) horizontal-pod-autoscaler failed to get cpu utilization: unable to get metrics for resource cpu: no metrics returned from resource metrics API
Warning FailedGetResourceMetric 1m (x42 over 5h) horizontal-pod-autoscaler unable to get metrics for resource cpu: no metrics returned from resource metrics API
I am using metrics-server as suggested in Kubernetes documentation. I also tried doing same just using Minikube. But that also didn’t work.
Running kubectl get --raw /apis/metrics.k8s.io/v1beta1/nodes outputs :
{
"kind": "NodeMetricsList",
"apiVersion": "metrics.k8s.io/v1beta1",
"metadata": {
"selfLink": "/apis/metrics.k8s.io/v1beta1/nodes"
},
"items": []
}
![]()
Dominic P
2,2342 gold badges27 silver badges46 bronze badges
asked Oct 8, 2018 at 1:07
![]()
3
Use official metrics server — https://github.com/kubernetes-sigs/metrics-server
If you use one master node, run this command to create the metrics-server:
kubectl apply -f https://github.com/kubernetes-sigs/metrics-server/releases/latest/download/components.yaml
If you have HA (High availability) cluster, use this:
kubectl apply -f https://github.com/kubernetes-sigs/metrics-server/releases/latest/download/high-availability.yaml
Then use can use kubectl top nodes or kubectl top pods -A and get something like:
NAME CPU(cores) CPU% MEMORY(bytes) MEMORY%
![]()
TitanFighter
4,3371 gold badge42 silver badges71 bronze badges
answered Mar 19, 2021 at 18:19
![]()
Solution(if using Minikube):
Changed context of Kubernetes to Minikube.
Enabled metrics-server and Disabled heapster in minikube.
minikube addons disable heapster
minikube addons enable metrics-server
Deploy metrics-server in your cluster using the following steps:
git clone https://github.com/kubernetes-incubator/metrics-server.git
cd metrics-server
kubectl create -f deploy/1.7/ (if Kubernetes version 1.7)
OR
kubectl create -f deploy/1.8+/(if Kubernetes version 1.8+)
Start minikube dashboad and minikube service [your service].
Try kubectl top node.
I found this (https://kubernetes.io/docs/tasks/configure-pod-container/assign-memory-resource/) resource helpful.
answered Oct 8, 2018 at 20:28
![]()
VivekVivek
1,3152 gold badges14 silver badges24 bronze badges
Use the below command in your cluster to setup Metrics Server:
kubectl apply -f https://raw.githubusercontent.com/pythianarora/total-practice/master/sample-kubernetes-code/metrics-server.yaml
This should work just fine.
I turned off TLS in metrics-server and it started working after so I updated the YAML and reposted.
answered Nov 26, 2020 at 18:29
![]()
3
I know this is a late answer, but I have had some issues with Docker Kubernetes and Autoscaler myself without finding a good answer on the internet. After many days of debugging, I found out that there were some connectivity issues with the metrics-server (couldn’t connect to the pods).
I turned off TLS in metrics-server and it started working.. I answered my own post here if someone else is experiencing the same issue:
Docker Kubernetes (Mac) — Autoscaler unable to find metrics
answered Jan 16, 2019 at 21:06
![]()
Mr.TurtleMr.Turtle
2,8206 gold badges26 silver badges46 bronze badges
Make sure that you are using the latest metrics-server on your Kubernetes cluster. The below command helped me.
kubectl apply -f https://github.com/kubernetes-sigs/metrics-server/releases/latest/download/components.yaml
reference link: https://github.com/kubernetes-sigs/metrics-server
answered Jun 11, 2021 at 5:37
![]()
The problem is the certificate,
Update the yaml’s deployment section which you downloaded to install metrics-server as,
Add this part in the file at: --kubelet-insecure-tls
containers:
- name: metrics-server
image: k8s.gcr.io/metrics-server/metrics-server:v0.3.7
imagePullPolicy: IfNotPresent
args:
- --kubelet-insecure-tls
Complete Deployment will look like this now:
apiVersion: apps/v1
kind: Deployment
metadata:
name: metrics-server
namespace: kube-system
labels:
k8s-app: metrics-server
spec:
selector:
matchLabels:
k8s-app: metrics-server
template:
metadata:
name: metrics-server
labels:
k8s-app: metrics-server
spec:
serviceAccountName: metrics-server
volumes:
# mount in tmp so we can safely use from-scratch images and/or read-only containers
- name: tmp-dir
emptyDir: {}
containers:
- name: metrics-server
image: k8s.gcr.io/metrics-server/metrics-server:v0.3.7
imagePullPolicy: IfNotPresent
args:
- --kubelet-insecure-tls
- --cert-dir=/tmp
- --secure-port=4443
ports:
- name: main-port
containerPort: 4443
protocol: TCP
securityContext:
readOnlyRootFilesystem: true
runAsNonRoot: true
runAsUser: 1000
volumeMounts:
- name: tmp-dir
mountPath: /tmp
nodeSelector:
kubernetes.io/os: linux
answered Sep 18, 2022 at 16:29
![]()
When using minikube 1.4.0, there is no need to do anything else than minikube start: kubectl top node/pod should work out-of-the box.
answered Oct 13, 2019 at 13:00
![]()
Welcome to the Linux Foundation Forum!

I’m hands on with lab 13.3, at step 6 I’ve done everything with no issues (and I’ve already check twice every step); but in step 7 after 15 minutes waiting for a different output from the command «kubectl top pod» or «kubectl top nodes», I’m still getting the same:
error: Metrics API not available
Can anybody help me telling me if there is something missing in instructions?
Thank you in advance.
0
Comments
-

Hi @juanalmaraz,
From your
metrics-serverdeployment, can you provide the code snippet representing the containerargsand theimage, similar to the snippet shown in Lab 13.3 step 5 of the lab guide? Typically typos in this section can cause issues with themetrics-server.Regards,
-Chris0
-
@chrispokorni I’ve got the same problem. This is the kubectl -n kube-system describe deployment metrics-server :
Containers: metrics-server: Image: k8s.gcr.io/metrics-server/metrics-server:v0.3.7 Port: 4443/TCP Host Port: 0/TCP Args: --cert-dir=/tmp --secure-port=4443 --kubelet-insecure-tls --kubelet-preferred-address-types=InternalIP,ExternalIP,Hostname0
-
Hi @zmicier0k,
Since Kubernetes release v1.22 the metrics-server v0.3.x may no longer be compatible with latest releases. I would suggest installing the latest metrics-server release v0.6.x and at step 5 provide the following arguments when editing the metrics-server Deployment resource:
- --kubelet-insecure-tls - --kubelet-preferred-address-types=Hostname,InternalDNS,InternalIP,ExternalDNS,ExternalIP
Regards,
-Chris0


One of the most powerful features of Kubernetes is autoscaling, as it’s vital that we find the correct balance when scaling resources in our infrastructures. Scale up more than needed, and you will have unused resources which you must pay for. Scale down more than required and your application will not be performant.
Kubernetes brings three types of auto-scaling to the table:
- Cluster Autoscaler
- Horizontal Pod Scaler
- Vertical Pod Scaler
The Cluster Autoscaler scales the nodes up/down depending on the pod’s CPU and memory requests. If a pod cannot be scheduled due to the resource requests, then a node will be created to accommodate. On the other side, if nodes do not have any workloads running, they can be terminated.
The Horizontal Pod Autoscaler scales the number of pods of an application based on the resource metrics such as CPU or memory usage or custom metrics. It can affect replication controllers, deployment, replica sets, or stateful sets. Custom metrics and external metrics are supported, so they can be used by another autoscaler within the cluster as well.
The Vertical Pod Scaler is responsible for adjusting requests and limits on CPU and memory.
#Horizontal Pod Autoscaler API Versions
API version autoscaling/v1 is the stable and default version; this version of API only supports CPU utilization-based autoscaling.
autoscaling/v2beta2 version of the API brings usage of multiple metrics, custom and external metrics support.
You can verify which API versions are supported on your cluster by querying the api-versions.
$ kubectl api-versions | grep autoscaling
An output similar to the following will be displayed. It will list all supported versions; in this case, we see that all three versions are supported.
autoscaling/v1
autoscaling/v2beta1
autoscaling/v2beta2
#Requirements
Horizontal Pod Autoscaler (and also Vertical Pod Autoscaler) requires a Metrics Server installed in the Kubernetes cluster. Metric Server is a container resource metrics (such as memory and CPU usage) source that is scalable, can be configured for high availability, and is efficient on resource usage when operating. Metrics Server gather metrics -by default- every 15 seconds from Kubelets, this allows rapid autoscaling,
You can easily check if the metric server is installed or not by issuing the following command:
The following message will be shown if the metrics server is not installed.
error: Metrics API not available
On the other hand, if the Metric Server is installed, a similar output will be displayed for each pod in the namespace defined.
NAME CPU(cores) MEMORY(bytes)
metrics-server-7d9f89855d-l4rrz 7m 17Mi
#Installation of Metrics Server
If you have already installed Metrics Server, you can skip this section.
Metrics Server offers two easy installation mechanisms; one is using kubectl that includes all the manifests.
$ kubectl apply -f https://github.com/kubernetes-sigs/metrics-server/releases/latest/download/components.yaml
The second option is using the Helm chart, which is preferred. Helm values can be found here.
First, add the Metrics-Server Helm repository to your local repository list as follows.
helm repo add metrics-server https://kubernetes-sigs.github.io/metrics-server/
Now you can install the Metrics Server via Helm.
helm upgrade --install metrics-server metrics-server/metrics-server
If you have a self-signed certificate, you should add --set args={--kubelet-insecure-tls} to the command above.
You should see a similar output to the below:
Release "metrics-server" does not exist. Installing it now.
NAME: metrics-server
LAST DEPLOYED: Wed Sep 22 16:16:55 2021
NAMESPACE: default
STATUS: deployed
REVISION: 1
TEST SUITE: None
NOTES:
***********************************************************************
* Metrics Server *
***********************************************************************
Chart version: 3.5.0
App version: 0.5.0
Image tag: k8s.gcr.io/metrics-server/metrics-server:v0.5.0
#Verifying the Installation
As the installation is finished and we allow some time for the Metrics Server to get ready, let’s try the command again.
NAME CPU(cores) MEMORY(bytes)
metrics-server-7d9f89855d-l4rrz 7m 15Mi
Also, we can see the resources of the nodes with a similar command.
NAME CPU(cores) CPU% MEMORY(bytes) MEMORY%
docker-desktop 370m 4% 2188Mi 57%
You can also send queries directly to the Metric Server via kubectl.
$ kubectl get --raw /apis/metrics.k8s.io/v1beta1/nodes | jq
An output similar to below will be displayed.
{
"kind": "NodeMetricsList",
"apiVersion": "metrics.k8s.io/v1beta1",
"metadata": {},
"items": [
{
"metadata": {
"name": "docker-desktop",
"creationTimestamp": "2021-10-04T12:33:01Z",
"labels": {
"beta.kubernetes.io/arch": "amd64",
"beta.kubernetes.io/os": "linux",
"kubernetes.io/arch": "amd64",
"kubernetes.io/hostname": "docker-desktop",
"kubernetes.io/os": "linux",
"node-role.kubernetes.io/master": ""
}
},
"timestamp": "2021-10-04T12:32:07Z",
"window": "1m0s",
"usage": {
"cpu": "380139514n",
"memory": "2077184Ki"
}
}
]
}
We can also verify our pod’s metrics from the API.
$ kubectl get --raw /apis/metrics.k8s.io/v1beta1/namespaces/default/pods/web-servers-65c7fc644d-5h6mb | jq
{
"kind": "PodMetrics",
"apiVersion": "metrics.k8s.io/v1beta1",
"metadata": {
"name": "web-servers-65c7fc644d-5h6mb",
"namespace": "default",
"creationTimestamp": "2021-10-04T12:36:48Z",
"labels": {
"app": "web-servers",
"pod-template-hash": "65c7fc644d"
}
},
"timestamp": "2021-10-04T12:35:55Z",
"window": "54s",
"containers": [
{
"name": "nginx",
"usage": {
"cpu": "0",
"memory": "6860Ki"
}
}
]
}
You might come across a situation similar to the following, where metric-server cannot get the current CPU usage of the containers in the pod.
NAME REFERENCE TARGETS MINPODS MAXPODS REPLICAS AGE
web-servers Deployment/web-servers <unknown>/20% 1 10 1 8m6s
This is either the Metric Server control loop that hasn’t run yet, is not running correctly, or resource requests are not set on the target pod spec.
#Configuring Horizontal Pod AutoScaling
As we have two API versions of this object, it would be good to examine both; however, autoscaling/v2beta2 is the recommended version to use at the time of writing.
Let’s create a simple deployment first; we will be using the Nginx image.
apiVersion: apps/v1
kind: Deployment
metadata:
name: web-servers
labels:
app: web-servers
spec:
replicas: 1
selector:
matchLabels:
app: web-servers
template:
metadata:
labels:
app: web-servers
spec:
containers:
- name: nginx
image: nginx
ports:
- containerPort: 80
resources:
limits:
cpu: 100m
requests:
cpu: 50m
Let’s create a service.
apiVersion: v1
kind: Service
metadata:
labels:
app: web-servers
name: web-servers
namespace: default
spec:
ports:
- name: web-servers-port
port: 80
selector:
app: web-servers
sessionAffinity: None
type: NodePort
At this point, you need to choose which API version you would use; we will show examples for both.
#autoscaling/v1 API Version
Lastly, let’s configure our HorizontalPodAutoscaler matching web-servers deployment in autoscaling/v1 API version for those that choose.
apiVersion: autoscaling/v1
kind: HorizontalPodAutoscaler
metadata:
name: web-servers-v1
spec:
scaleTargetRef:
apiVersion: apps/v1
kind: Deployment
name: web-servers
minReplicas: 1
maxReplicas: 10
targetCPUUtilizationPercentage: 20
#autoscaling/v2beta2 API Version
Here we have the newer version of the API where we can use multiple metrics. In our example, we defined two metrics, one for CPU and the other is memory usage.
apiVersion: autoscaling/v2beta2
kind: HorizontalPodAutoscaler
metadata:
name: web-servers
spec:
scaleTargetRef:
apiVersion: apps/v1
kind: Deployment
name: web-servers
minReplicas: 1
maxReplicas: 10
metrics:
- type: Resource
resource:
name: cpu
target:
type: Utilization
averageUtilization: 20
- type: Resource
resource:
name: memory
target:
type: AverageValue
averageValue: 30Mi
Let’s check the HPA entries.
NAME REFERENCE TARGETS MINPODS MAXPODS REPLICAS AGE
web-servers Deployment/web-servers 6930432/30Mi, 0%/20% 1 10 1 10d
We can also use the describe subcommand to gather more information.
$ kubectl describe hpa web-servers
Name: web-servers
Namespace: default
Labels: <none>
Annotations: <none>
CreationTimestamp: Mon, 04 Oct 2021 15:39:00 +0300
Reference: Deployment/web-servers
Metrics: ( current / target )
resource memory on pods: 6930432 / 30Mi
resource cpu on pods (as a percentage of request): 0% (0) / 20%
Min replicas: 1
Max replicas: 10
Deployment pods: 1 current / 1 desired
Conditions:
Type Status Reason Message
---- ------ ------ -------
AbleToScale True ReadyForNewScale recommended size matches current size
ScalingActive True ValidMetricFound the HPA was able to successfully calculate a replica count from memory resource
ScalingLimited False DesiredWithinRange the desired count is within the acceptable range
Events: <none>
#Operation of Horizontal Pod AutoScaling
Let’s create a load of web traffic destined to our web-servers service and examine the effect. For load, we will use Hey, a tiny web load generator. You can use a bash script with curl/wget commands if you prefer.
First, let’s port-forward the service that we had created for web-servers pods.
$ kubectl port-forward svc/web-servers 8080:80
Run the hey command from your local shell with -n 2000, meaning it should send 10000 requests with five workers concurrently.
$ hey -n 10000 -c 5 http://localhost:8080/
To see the effects of the load, let’s check the HPA entry.
$ kubectl get hpa web-servers
At this point, we can see that CPU and memory usage has dramatically increased.
NAME REFERENCE TARGETS MINPODS MAXPODS REPLICAS AGE
web-servers Deployment/web-servers 20049920/30Mi, 48%/20% 1 10 1 14d
After a short delay, Horizontal Pod Autoscaler gets the new metrics for the pod and calculates the number of replicas it needs for upscale/downscale.
$ kubectl get hpa web-servers
Autoscaling is in effect; a total of 10 replicas were created.
NAME REFERENCE TARGETS MINPODS MAXPODS REPLICAS AGE
web-servers Deployment/web-servers 9233066666m/30Mi, 66%/20% 1 10 10 11d
We can take a more detailed look using the describe subcommand.
$ kubectl describe hpa web-servers
Conditions and events fields are crucial for troubleshooting and understanding the behavior of the HPA.
Name: web-servers
Namespace: default
Labels: <none>
Annotations: <none>
CreationTimestamp: Mon, 04 Oct 2021 15:39:00 +0300
Reference: Deployment/web-servers
Metrics: ( current / target )
resource memory on pods: 9233066666m / 30Mi
resource cpu on pods (as a percentage of request): 66% (33m) / 20%
Min replicas: 1
Max replicas: 10
Deployment pods: 10 current / 10 desired
Conditions:
Type Status Reason Message
---- ------ ------ -------
AbleToScale True ScaleDownStabilized recent recommendations were higher than current one, applying the highest recent recommendation
ScalingActive True ValidMetricFound the HPA was able to successfully calculate a replica count from cpu resource utilization (percentage of request)
ScalingLimited True TooManyReplicas the desired replica count is more than the maximum replica count
Events:
Type Reason Age From Message
---- ------ ---- ---- -------
Normal SuccessfulRescale 4m1s horizontal-pod-autoscaler New size: 3; reason: cpu resource utilization (percentage of request) above target
Normal SuccessfulRescale 3m1s horizontal-pod-autoscaler New size: 6; reason: cpu resource utilization (percentage of request) above target
Normal SuccessfulRescale 2m horizontal-pod-autoscaler New size: 10; reason: cpu resource utilization (percentage of request) above target
Also, we can check the deployment object to see events and several other fields related to autoscaling.
$ kubectl describe deployments web-servers
Name: web-servers
Namespace: default
CreationTimestamp: Mon, 04 Oct 2021 15:43:14 +0300
Labels: app=web-servers
Annotations: deployment.kubernetes.io/revision: 3
Selector: app=web-servers
Replicas: 10 desired | 10 updated | 10 total | 10 available | 0 unavailable
StrategyType: RollingUpdate
MinReadySeconds: 0
RollingUpdateStrategy: 25% max unavailable, 25% max surge
Pod Template:
Labels: app=web-servers
Containers:
nginx:
Image: nginx
Port: 80/TCP
Host Port: 0/TCP
Limits:
cpu: 100m
Requests:
cpu: 50m
Environment: <none>
Mounts: <none>
Volumes: <none>
Conditions:
Type Status Reason
---- ------ ------
Progressing True NewReplicaSetAvailable
Available True MinimumReplicasAvailable
OldReplicaSets: <none>
NewReplicaSet: web-servers-77cbb55d6 (10/10 replicas created)
Events:
Type Reason Age From Message
---- ------ ---- ---- -------
Normal ScalingReplicaSet 4m50s deployment-controller Scaled up replica set web-servers-77cbb55d6 to 3
Normal ScalingReplicaSet 3m50s deployment-controller Scaled up replica set web-servers-77cbb55d6 to 6
Normal ScalingReplicaSet 2m49s deployment-controller Scaled up replica set web-servers-77cbb55d6 to 10
Here are all the replicas created.
NAME READY STATUS RESTARTS AGE
metrics-server-7d9f89855d-l4rrz 1/1 Running 13 23d
web-servers-77cbb55d6-2vrn5 1/1 Running 0 3m30s
web-servers-77cbb55d6-7ps7k 1/1 Running 0 5m31s
web-servers-77cbb55d6-8brrm 1/1 Running 0 4m31s
web-servers-77cbb55d6-gsrk8 1/1 Running 0 4m31s
web-servers-77cbb55d6-jwshp 1/1 Running 0 11d
web-servers-77cbb55d6-qg9fz 1/1 Running 0 3m30s
web-servers-77cbb55d6-ttjz2 1/1 Running 0 3m30s
web-servers-77cbb55d6-wzbwt 1/1 Running 0 5m31s
web-servers-77cbb55d6-xxf7q 1/1 Running 0 3m30s
web-servers-77cbb55d6-zxglt 1/1 Running 0 4m31s
#Conclusion
We have seen how to configure HPA using the old and the new version. With the capability of using multiple metrics, we can develop more complex strategies. Using the custom metric option, we can port the application-specific instrumentation and use it for the scaling.
After the configuration, we had a quick demo of an HPA configuration and observed the commands to review the metrics and events.
Horizontal Pod Scaling allows us to scale our applications based on different metrics. By scaling to the correct number of pods dynamically, we can serve our application in a performant and cost-efficient manner.
#Further Reading
- Horizontal Pod Autoscaler Kubernetes Documentation
- Horizontal Pod Autoscaling Kubernetes Design Document
- Metrics Server
- Custom Metrics API
Photo by Rafael Leão on Unsplash

![]()
![]()
The steps below in this blog will help you setup Kubernetes Metrics Server on Docker Desktop which provides a standalone instance of Kubernetes running as a Docker container.
Kubernetes Metrics Server is a scalable, efficient source of container resource metrics for Kubernetes built-in autoscaling pipelines. Metrics Server collects resource metrics from Kubelets and exposes them in Kubernetes apiserver through Metrics API for use by Horizontal Pod Autoscaler and Vertical Pod Autoscaler.
Metrics Server offers:
- A single deployment that works on most clusters
- Scalable support up to 5,000 node clusters
- Resource efficiency: Metrics Server uses 1m core of CPU and 3 MB of memory per node
You can use Metrics Server for:
- CPU/Memory based horizontal autoscaling
- Automatically adjusting/suggesting resources needed by containers
Prerequisites
- Install Docker Desktop
- Enable Kubernetes on Docker Desktop
Once you have enabled the Kubernetes on Docker Desktop, and if you run the below commands you should see messages like:
kubectl top node
error: Metrics API not available
Enter fullscreen mode
Exit fullscreen mode
kubectl top pod -A
error: Metrics API not available
Enter fullscreen mode
Exit fullscreen mode
Metrics server isn’t included with Docker Desktop’s installation of Kubernetes and to install it we will have to download the latest components.yaml file from Metrics-Server releases page and open it in your text editor.
If you try to execute the command kubectl apply -f components.yaml you will see the pods get created but with some errors as highlighted below:
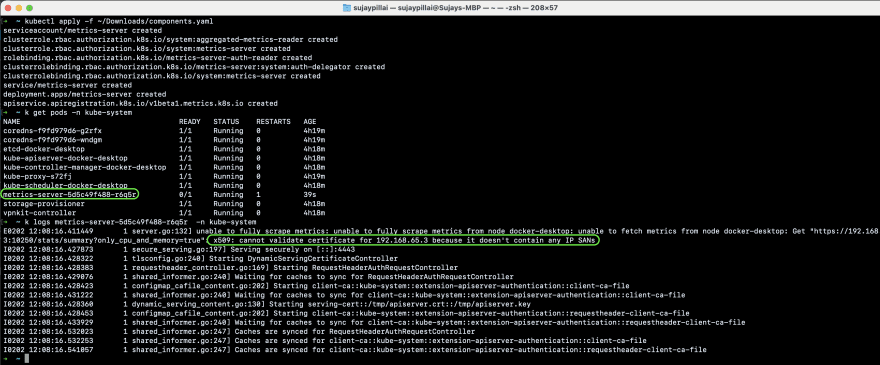
Add the line —kubelet-insecure-tls under the args section as shown below [L136] :
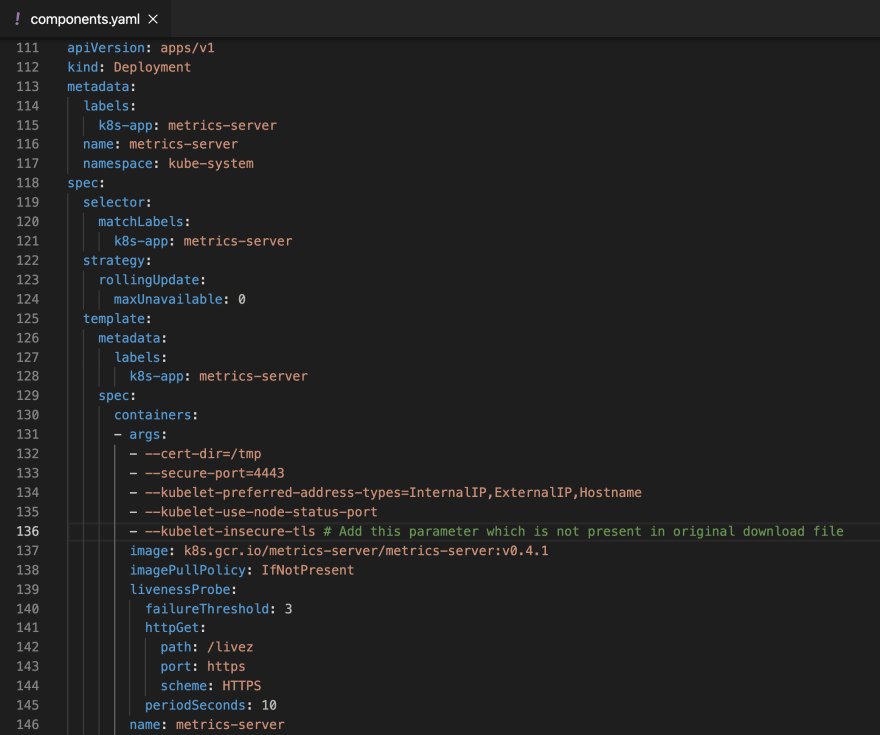
Execute the command kubectl apply -f components.yaml to apply the changes:
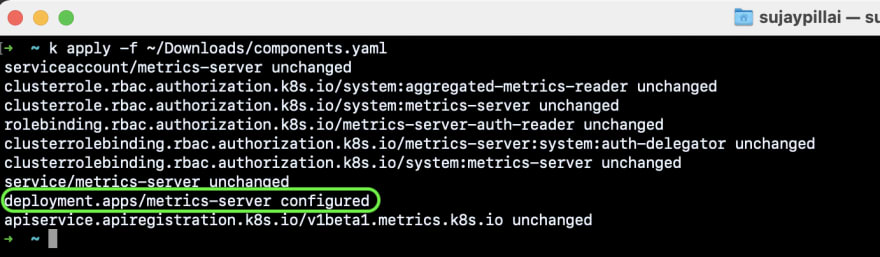
Now if you execute the kubectl top node & kubectl top pod -A commands you should see the output:
$ kubectl top node
NAME CPU(cores) CPU% MEMORY(bytes) MEMORY%
docker-desktop 1310m 32% 1351Mi 71%
Enter fullscreen mode
Exit fullscreen mode
$ kubectl top pod -A
NAMESPACE NAME CPU(cores) MEMORY(bytes)
cpu-example cpu-demo 1003m 1Mi
kube-system coredns-f9fd979d6-g2rfx 9m 9Mi
kube-system coredns-f9fd979d6-wndgm 6m 9Mi
kube-system etcd-docker-desktop 35m 36Mi
kube-system kube-apiserver-docker-desktop 55m 325Mi
kube-system kube-controller-manager-docker-desktop 41m 47Mi
kube-system kube-proxy-s72fj 1m 25Mi
kube-system kube-scheduler-docker-desktop 9m 17Mi
kube-system metrics-server-56c59cf9ff-jndxd 10m 14Mi
kube-system storage-provisioner 4m 5Mi
kube-system vpnkit-controller 1m 15Mi
Enter fullscreen mode
Exit fullscreen mode
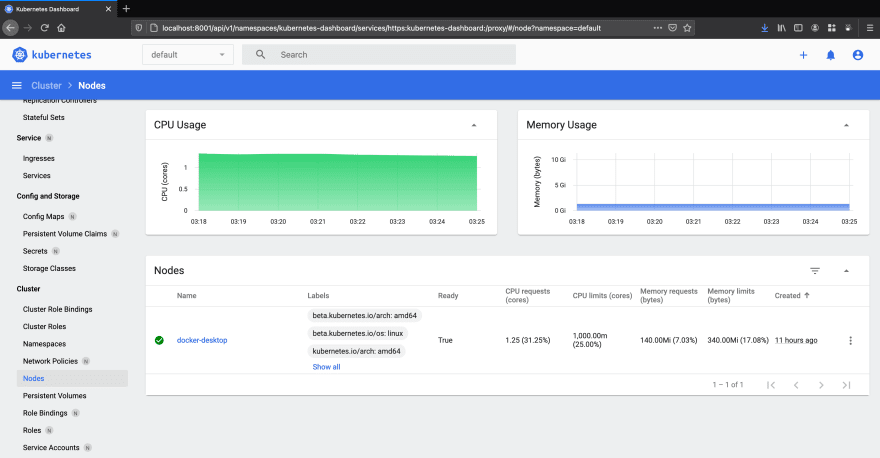
You can also use Kubernetes Dashboard to view the above data (and more information) in a web UI. It allows users to manage applications running in the cluster and troubleshoot them, as well as manage the cluster itself.
To deploy Dashboard, execute following command:
$ kubectl apply -f https://raw.githubusercontent.com/kubernetes/dashboard/v2.1.0/aio/deploy/recommended.yaml
Enter fullscreen mode
Exit fullscreen mode
To access Dashboard from your local workstation you must create a secure channel to your Kubernetes cluster. Run the following command:
$ kubectl proxy
Enter fullscreen mode
Exit fullscreen mode
Get the token for login to dashboard using the below command:
$ kubectl -n kubernetes-dashboard describe secret $(kubectl -n kubernetes-dashboard get secret |grep default-token | awk '{print $1}')
Enter fullscreen mode
Exit fullscreen mode
To access the HTTPS endpoint of dashboard go to:
http://localhost:8001/api/v1/namespaces/kubernetes-dashboard/services/https:kubernetes-dashboard:/proxy/
Enter fullscreen mode
Exit fullscreen mode
Login to the dashboard using the token from above step and you should see a dashboard as below:
This setting should only be used for the local Docker Desktop Kubernetes cluster, and not recommended for any hosted or production clusters.
In this blog post, I have covered the step-by-step guide to setup a kubernetes cluster using Kubeadm with one master and two worker nodes.
Kubeadm is an excellent tool to set up a working kubernetes cluster in less time. It does all the heavy lifting in terms of setting up all kubernetes cluster components. Also, It follows all the configuration best practices for a kubernetes cluster.
What is Kubeadm?
Kubeadm is a tool to set up a minimum viable Kubernetes cluster without much complex configuration. Also, Kubeadm makes the whole process easy by running a series of prechecks to ensure that the server has all the essential components and configs to run Kubernetes.
It is developed and maintained by the official Kubernetes community. There are other options like minikube, kind, etc., that are pretty easy to set up. You can check out my minikube tutorial. Those are good options with minimum hardware requirements if you are deploying and testing applications on Kubernetes.
But if you want to play around with the cluster components or test utilities that are part of cluster administration, Kubeadm is the best option. Also, you can create a production-like cluster locally on a workstation for development and testing purposes.
Kubeadm Setup Prerequisites
Following are the prerequisites for Kubeadm Kubernetes cluster setup.
- Minimum two Ubuntu nodes [One master and one worker node]. You can have more worker nodes as per your requirement.
- The master node should have a minimum of 2 vCPU and 2GB RAM.
- For the worker nodes, a minimum of 1vCPU and 2 GB RAM is recommended.
- 10.X.X.X/X network range with static IPs for master and worker nodes. We will be using the 192.x.x.x series as the pod network range that will be used by the Calico network plugin. Make sure the Node IP range and pod IP range don’t overlap.
Note: If you are setting up the cluster in the corporate network behind a proxy, ensure set the proxy variables and have access to gcr container registry and docker hub. or talk to your network administrator to whitelist k8s.gcr.io to pull the required images.
.
Kubeadm for Kubernetes Certification Exams
If you are preparing for Kubernetes certifications like CKA, CKAD, or CKS, you can use the local kubeadm clusters to practice for the certification exam. In fact, kubeadm itself is part of the CKA and CKS exam. For CKA you might be asked to bootstrap a cluster using Kubeadm. For CKS, you have to upgrade the cluster using kubeadm.
If you use Vagrant-based VMs on your workstation, you can start and stop the cluster whenever you need. By having the local Kubeadm clusters, you can play around with all the cluster configurations and learn to troubleshoot different components in the cluster.
Important Note: If you are planning for Kubernetes certification, make use of the CKA/CKAD/CKS coupon Codes before the price increases.
Kubeadm Port Requirements
Please refer to the following image and make sure all the ports are allowed for the control plane (master) and the worker nodes. If you are setting up the kubeadm cluster cloud servers, ensure you allow the ports in the firewall configuration.
If you are using vagrant-based Ubuntu VMs, the firewall would be disabled by default. So you don’t have to do any firewall configurations.
Vagrantfile, Kubeadm Scripts & Manifests
Also, all the commands used in this guide for master and worker nodes config are hosted in GitHub. You can clone the repository for reference.
git clone https://github.com/techiescamp/kubeadm-scriptsThis guide intends to make you understand each config required for the Kubeadm setup. If you don’t want to run the command one by one, you can run the script file directly.
If you are using Vagrant to set up the Kubernetes cluster, you can make use of my Vagrantfile. It launches 3 VMs. A self-explanatory basic Vagrantfile.
If you are new to Vagrant, check the Vagrant tutorial.
Following are the high-level steps involved in setting up a kubeadm-based Kubernetes cluster.
- Install container runtime on all nodes- We will be using cri-o.
- Install Kubeadm, Kubelet, and kubectl on all the nodes.
- Initiate Kubeadm control plane configuration on the master node.
- Save the node join command with the token.
- Install the Calico network plugin.
- Join the worker node to the master node (control plane) using the join command.
- Validate all cluster components and nodes.
- Install Kubernetes Metrics Server
- Deploy a sample app and validate the app
All the steps given in this guide are referred from the official Kubernetes documentation and related GitHub project pages.
If you want to understand every cluster component in detail, refer to the comprehensive Kubernetes Architecture.
Now let’s get started with the setup.
Enable iptables Bridged Traffic on all the Nodes
Execute the following commands on all the nodes for IPtables to see bridged traffic.
cat <<EOF | sudo tee /etc/modules-load.d/k8s.conf
overlay
br_netfilter
EOF
sudo modprobe overlay
sudo modprobe br_netfilter
# sysctl params required by setup, params persist across reboots
cat <<EOF | sudo tee /etc/sysctl.d/k8s.conf
net.bridge.bridge-nf-call-iptables = 1
net.bridge.bridge-nf-call-ip6tables = 1
net.ipv4.ip_forward = 1
EOF
# Apply sysctl params without reboot
sudo sysctl --systemDisable swap on all the Nodes
For kubeadm to work properly, you need to disable swap on all the nodes using the following command.
sudo swapoff -a
(crontab -l 2>/dev/null; echo "@reboot /sbin/swapoff -a") | crontab - || trueThe fstab entry will make sure the swap is off on system reboots.
You can also, control swap errors using the kubeadm parameter --ignore-preflight-errors Swap we will look at it in the latter part.
Install CRI-O Runtime On All The Nodes
The basic requirement for a Kubernetes cluster is a container runtime. You can have any one of the following container runtimes.
- CRI-O
- containerd
- Docker Engine (using cri-dockerd)
We will be using CRI-O instead of Docker for this setup as Kubernetes deprecated Docker engine
As a first step, we need to install cri-o on all the nodes. Execute the following commands on all the nodes.
Create the .conf file to load the modules at bootup
cat <<EOF | sudo tee /etc/modules-load.d/crio.conf
overlay
br_netfilter
EOF
# Set up required sysctl params, these persist across reboots.
cat <<EOF | sudo tee /etc/sysctl.d/99-kubernetes-cri.conf
net.bridge.bridge-nf-call-iptables = 1
net.ipv4.ip_forward = 1
net.bridge.bridge-nf-call-ip6tables = 1
EOF
Execute the following commands to enable overlayFS & VxLan pod communication.
sudo modprobe overlay
sudo modprobe br_netfilterSet up required sysctl params, these persist across reboots.
cat <<EOF | sudo tee /etc/sysctl.d/99-kubernetes-cri.conf
net.bridge.bridge-nf-call-iptables = 1
net.ipv4.ip_forward = 1
net.bridge.bridge-nf-call-ip6tables = 1
EOFReload the parameters.
sudo sysctl --systemEnable cri-o repositories for version 1.23
OS="xUbuntu_20.04"
VERSION="1.23"
cat <<EOF | sudo tee /etc/apt/sources.list.d/devel:kubic:libcontainers:stable.list
deb https://download.opensuse.org/repositories/devel:/kubic:/libcontainers:/stable/$OS/ /
EOF
cat <<EOF | sudo tee /etc/apt/sources.list.d/devel:kubic:libcontainers:stable:cri-o:$VERSION.list
deb http://download.opensuse.org/repositories/devel:/kubic:/libcontainers:/stable:/cri-o:/$VERSION/$OS/ /
EOF
Add the gpg keys.
curl -L https://download.opensuse.org/repositories/devel:kubic:libcontainers:stable:cri-o:$VERSION/$OS/Release.key | sudo apt-key --keyring /etc/apt/trusted.gpg.d/libcontainers.gpg add -
curl -L https://download.opensuse.org/repositories/devel:/kubic:/libcontainers:/stable/$OS/Release.key | sudo apt-key --keyring /etc/apt/trusted.gpg.d/libcontainers.gpg add -Update and install crio and crio-tools.
sudo apt-get update
sudo apt-get install cri-o cri-o-runc cri-tools -yReload the systemd configurations and enable cri-o.
sudo systemctl daemon-reload
sudo systemctl enable crio --nowThe cri-tools contain crictl, a CLI utility to interact with the containers created by the contianer runtime. When you use container runtimes other than Docker, you can use the crictl utility to debug containers on the nodes. Also, it is useful in CKS certification where you need to debug containers.
Install Kubeadm & Kubelet & Kubectl on all Nodes
Install the required dependencies.
sudo apt-get update
sudo apt-get install -y apt-transport-https ca-certificates curl
sudo curl -fsSLo /usr/share/keyrings/kubernetes-archive-keyring.gpg https://packages.cloud.google.com/apt/doc/apt-key.gpgAdd the GPG key and apt repository.
echo "deb [signed-by=/usr/share/keyrings/kubernetes-archive-keyring.gpg] https://apt.kubernetes.io/ kubernetes-xenial main" | sudo tee /etc/apt/sources.list.d/kubernetes.list
Update apt and install the latest version of kubelet, kubeadm, and kubectl.
sudo apt-get update -y
sudo apt-get install -y kubelet kubeadm kubectlNote: If you are preparing for Kubernetes certification, install the specific version of kubernetes. For example, the current Kubernetes version for CKA, CKAD and CKS exams is kubernetes version 1.26
You can use the following commands to find the latest versions.
sudo apt update
apt-cache madison kubeadm | tacSpecify the version as shown below.
sudo apt-get install -y kubelet=1.26.1-00 kubectl=1.26.1-00 kubeadm=1.26.1-00Add hold to the packages to prevent upgrades.
sudo apt-mark hold kubelet kubeadm kubectlNow we have all the required utilities and tools for configuring Kubernetes components using kubeadm.
Add the node IP to KUBELET_EXTRA_ARGS.
sudo apt-get install -y jq
local_ip="$(ip --json a s | jq -r '.[] | if .ifname == "eth1" then .addr_info[] | if .family == "inet" then .local else empty end else empty end')"
cat > /etc/default/kubelet << EOF
KUBELET_EXTRA_ARGS=--node-ip=$local_ip
EOFInitialize Kubeadm On Master Node To Setup Control Plane
Execute the commands in this section only on the master node.
First, set the following environment variables. Replace 10.0.0.10 with the IP of your master node.
IPADDR="10.0.0.10"
NODENAME=$(hostname -s)
POD_CIDR="192.168.0.0/16"Now, initialize the master node control plane configurations using the following kubeadm command.
sudo kubeadm init --apiserver-advertise-address=$IPADDR --apiserver-cert-extra-sans=$IPADDR --pod-network-cidr=$POD_CIDR --node-name $NODENAME --ignore-preflight-errors Swap
--ignore-preflight-errors Swap is actually not required as we disabled the swap initially.
Note: You can also pass the kubeadm configs as a file when initializing the cluster. See Kubeadm Init with config file
On a successful kubeadm initialization, you should get an output with kubeconfig file location and the join command with the token as shown below. Copy that and save it to the file. we will need it for joining the worker node to the master.
Use the following commands from the output to create the kubeconfig in master so that you can use kubectl to interact with cluster API.
mkdir -p $HOME/.kube
sudo cp -i /etc/kubernetes/admin.conf $HOME/.kube/config
sudo chown $(id -u):$(id -g) $HOME/.kube/configNow, verify the kubeconfig by executing the following kubectl command to list all the pods in the kube-system namespace.
kubectl get po -n kube-systemYou should see the following output. You will see the two Coredns pods in a pending state. It is the expected behavior. Once we install the network plugin, it will be in a running state
Note: You can copy the
admin.conffile from the master to your workstation in $HOME/.kube/config location if you want to executekubectlcommands from the workstation.
You verify all the cluster component health statuses using the following command.
kubectl get --raw='/readyz?verbose'You can get the cluster info using the following command.
kubectl cluster-info By default, apps won’t get scheduled on the master node. If you want to use the master node for scheduling apps, taint the master node.
kubectl taint nodes --all node-role.kubernetes.io/master-Install Calico Network Plugin for Pod Networking
Kubeadm does not configure any network plugin. You need to install a network plugin of your choice.
I am using the Calico network plugin for this setup.
Note: Make sure you execute the kubectl command from where you have configured the
kubeconfigfile. Either from the master of your workstation with the connectivity to the kubernetes API.
Execute the following command to install the calico network plugin on the cluster.
kubectl apply -f https://raw.githubusercontent.com/projectcalico/calico/v3.25.0/manifests/calico.yamlAfter a couple of minutes, if you check the pods in kube-system namespace, you will see calico pods and running CoreDNS pods.
Join Worker Nodes To Kubernetes Master Node
We have set up cri-o, kubelet, and kubeadm utilities on the worker nodes as well.
Now, let’s join the worker node to the master node using the Kubeadm join command you have got in the output while setting up the master node.
If you missed copying the join command, execute the following command in the master node to recreate the token with the join command.
kubeadm token create --print-join-commandHere is what the command looks like. Use sudo if you running as a normal user. This command performs the TLS bootstrapping for the nodes.
sudo kubeadm join 10.128.0.37:6443 --token j4eice.33vgvgyf5cxw4u8i
--discovery-token-ca-cert-hash sha256:37f94469b58bcc8f26a4aa44441fb17196a585b37288f85e22475b00c36f1c61On successful execution, you will see the output saying, “This node has joined the cluster”.
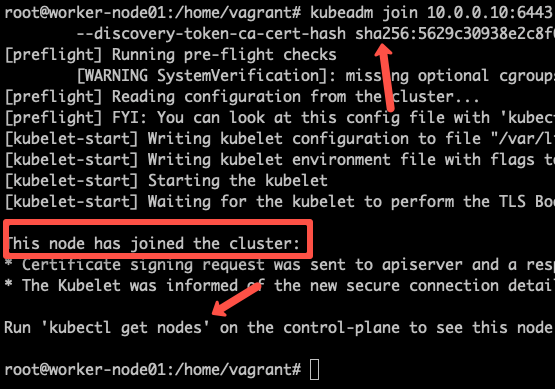
Now execute the kubectl command from the master node to check if the node is added to the master.
kubectl get nodesExample output,
[email protected]:/home/vagrant# kubectl get nodes
NAME STATUS ROLES AGE VERSION
master-node Ready control-plane 14m v1.24.6
worker-node01 Ready <none> 2m13s v1.24.6
worker-node02 Ready <none> 2m5s v1.24.6In the above command, the ROLE is <none> for the worker nodes. You can add a label to the worker node using the following command. Replace worker-node01 with the hostname of the worker node you want to label.
kubectl label node worker-node01 node-role.kubernetes.io/worker=workerYou can further add more nodes with the same join command.
Setup Kubernetes Metrics Server
Kubeadm doesn’t install metrics server component during its initialization. We have to install it separately.
To verify this, if you run the top command, you will see the Metrics API not available error.
[email protected]:~# kubectl top nodes
error: Metrics API not availableTo install the metrics server, execute the following metric server manifest file. It deploys metrics server version v0.6.2
kubectl apply -f https://raw.githubusercontent.com/techiescamp/kubeadm-scripts/main/manifests/metrics-server.yamlThis manifest is taken from the official metrics server repo. I have added the --kubelet-insecure-tls flag to the container to make it work in the local setup and hosted it separately. Or else, you will get the following error.
because it doesn't contain any IP SANs" node=""Once the metrics server objects are deployed, it takes a minute for you to see the node and pod metrics using the top command.
kubectl top nodesYou should be able to view the node metrics as shown below.
[email protected]:/home/vagrant# kubectl top nodes
NAME CPU(cores) CPU% MEMORY(bytes) MEMORY%
master-node 111m 5% 1695Mi 44%
worker-node01 28m 2% 1078Mi 57%
worker-node02 219m 21% 980Mi 52%You can also view the pod CPU and memory metrics using the following command.
kubectl top pod -n kube-systemDeploy A Sample Nginx Application
Now that we have all the components to make the cluster and applications work, let’s deploy a sample Nginx application and see if we can access it over a NodePort
Create an Nginx deployment. Execute the following directly on the command line. It deploys the pod in the default namespace.
cat <<EOF | kubectl apply -f -
apiVersion: apps/v1
kind: Deployment
metadata:
name: nginx-deployment
spec:
selector:
matchLabels:
app: nginx
replicas: 2
template:
metadata:
labels:
app: nginx
spec:
containers:
- name: nginx
image: nginx:latest
ports:
- containerPort: 80
EOFExpose the Nginx deployment on a NodePort 32000
cat <<EOF | kubectl apply -f -
apiVersion: v1
kind: Service
metadata:
name: nginx-service
spec:
selector:
app: nginx
type: NodePort
ports:
- port: 80
targetPort: 80
nodePort: 32000
EOFCheck the pod status using the following command.
kubectl get podsOnce the deployment is up, you should be able to access the Nginx home page on the allocated NodePort.
For example,
Possible Kubeadm Issues
Following are the possible issues you might encounter in the kubeadm setup.
- Pod Out of memory and CPU: The master node should have a minimum of 2vCPU and 2 GB memory.
- Nodes cannot connect to Master: Check the firewall between nodes and make sure all the nodes can talk to each other on the required kubernetes ports.
- Calico Pod Restarts: Sometimes, if you use the same IP range for the node and pod network, Calico pods may not work as expected. So make sure the node and pod IP ranges don’t overlap. Overlapping IP addresses could result in issues for other applications running on the cluster as well.
For other pod errors, check out the kubernetes pod troubleshooting guide.
Kubernetes Cluster Important Configurations
Following are the important cluster configurations you should know.
| Configuration | Location |
|---|---|
| Static Pods Location (etcd, api-server, controller manager and scheduler) | /etc/kubernetes/manifests |
| TLS Certificates location (kubernetes-ca, etcd-ca and kubernetes-front-proxy-ca) | /etc/kubernetes/pki |
| Admin Kubeconfig File | /etc/kubernetes/admin.conf |
| Kubelet configuration | /var/lib/kubelet/config.yaml |
Upgrading Kubeadm Cluster
Using kubeadm you can upgrade the kubernetes cluster for the same version patch or a new version.
Kubeadm upgrade doesn’t introduce any downtime if you upgrade one node at a time.
To do hands-on, please refer to my step-by-step guide on Kubeadm cluster upgrade
Kubeadm FAQs
How to use Custom CA Certificates With Kubeadm?
By default, kubeadm creates its own CA certificates. However, if you wish to use custom CA certificates, they should be placed in the /etc/kubernetes/pki folder. When kubeadm is run, it will make use of existing certificates if they are found, and will not overwrite them.
How to generate the Kubeadm Join command?
You can use kubeadm token create --print-join-command command to generate the join command.
Conclusion
As a DevOps engineer, it is good to have an understanding of the Kubernetes cluster components. With companies using managed Kubernetes services, we miss learning the basic building blocks of kubernetes.
This Kubeadm setup is good for learning and playing around with kubernetes.
Also, there are many other Kubeadm configs that I did not cover in this guide as it is out of the scope of this guide. Please refer to the official Kubeadm documentation. By having the whole cluster setup in VMs, you can learn all the cluster components configs and troubleshoot the cluster on component failures.
Also, with vagrant, you can create simple automation to bring up and tear down Kubernetes clusters on-demand in your local workstation. Check out my guide on automated kubernetes vagrant setup using kubeadm.
If you are learning kubernetes, check out the comprehensive Kubernetes tutorial for beginners.
[convertkit form=2269618]
This is a directory that doesn’t need to exist
- kubectl top node/po show `error: metrics not available yet`
- Version information
- Record of pits
- Yaml (my version, modified)
- Readme.md
- Summary or to write!
kubectl top node/po show error: metrics not available yet
Version information
kubernetes 1.12
metrics-server 0.3.3
Official website: https://github.com/kubernetes-incubator/metrics-server/
Record of pits
spec: containers: - command: - /metrics-server - --kubelet-preferred-address-types=InternalIP - --kubelet-insecure-tls vi /etc/systemd/system/kubelet.service.d/10-kubeadm.conf --authentication-token-webhook=true --authorization-mode=Webhook
Yaml (my version, modified)
aggregated-metrics-reader.yaml
kind: ClusterRole apiVersion: rbac.authorization.k8s.io/v1 metadata: name: system:aggregated-metrics-reader labels: rbac.authorization.k8s.io/aggregate-to-view: "true" rbac.authorization.k8s.io/aggregate-to-edit: "true" rbac.authorization.k8s.io/aggregate-to-admin: "true" rules: - apiGroups: ["metrics.k8s.io"] resources: ["pods"] verbs: ["get", "list", "watch"]
auth-delegator.yaml
apiVersion: rbac.authorization.k8s.io/v1beta1 kind: ClusterRoleBinding metadata: name: metrics-server:system:auth-delegator roleRef: apiGroup: rbac.authorization.k8s.io kind: ClusterRole name: system:auth-delegator subjects: - kind: ServiceAccount name: metrics-server namespace: kube-system
auth-reader.yaml
apiVersion: rbac.authorization.k8s.io/v1beta1 kind: RoleBinding metadata: name: metrics-server-auth-reader namespace: kube-system roleRef: apiGroup: rbac.authorization.k8s.io kind: Role name: extension-apiserver-authentication-reader subjects: - kind: ServiceAccount name: metrics-server namespace: kube-system
metrics-apiservice.yaml
apiVersion: apiregistration.k8s.io/v1beta1 kind: APIService metadata: name: v1beta1.metrics.k8s.io spec: service: name: metrics-server namespace: kube-system group: metrics.k8s.io version: v1beta1 insecureSkipTLSVerify: true groupPriorityMinimum: 100 versionPriority: 100
metrics-server-deployment.yaml
--- apiVersion: v1 kind: ServiceAccount metadata: name: metrics-server namespace: kube-system --- apiVersion: extensions/v1beta1 kind: Deployment metadata: name: metrics-server namespace: kube-system labels: k8s-app: metrics-server spec: selector: matchLabels: k8s-app: metrics-server template: metadata: name: metrics-server labels: k8s-app: metrics-server spec: serviceAccountName: metrics-server volumes: - name: tmp-dir emptyDir: {} containers: - command: - /metrics-server - --kubelet-insecure-tls - --kubelet-preferred-address-types=InternalIP name: metrics-server image: k8s.gcr.io/metrics-server-amd64:v0.3.3 imagePullPolicy: Always volumeMounts: - name: tmp-dir mountPath: /tmp
metrics-server-service.yaml
apiVersion: v1 kind: Service metadata: name: metrics-server namespace: kube-system labels: kubernetes.io/name: "Metrics-server" spec: selector: k8s-app: metrics-server ports: - port: 443 protocol: TCP targetPort: 443
resource-reader.yaml
apiVersion: rbac.authorization.k8s.io/v1 kind: ClusterRole metadata: name: system:metrics-server rules: - apiGroups: - "" resources: - pods - nodes - nodes/stats - namespaces verbs: - get - list - watch - apiGroups: - "extensions" resources: - deployments verbs: - get - list - watch --- apiVersion: rbac.authorization.k8s.io/v1 kind: ClusterRoleBinding metadata: name: system:metrics-server roleRef: apiGroup: rbac.authorization.k8s.io kind: ClusterRole name: system:metrics-server subjects: - kind: ServiceAccount name: metrics-server namespace: kube-system
Readme.md
The modification of Kubei API is made by each node.
I’ll see the other records
There are many kinds of args and commd parameters. If you modify them, you may not be able to solve the problem. It’s mainly the api settings.
I turned GitHub into a mess, and then I got it, and then I didn’t.
Summary or to write!
General conclusion: there are many immature places. Please leave a message or add me VX: youremysuperwomen45
Here’s the QR Code:

Table of Contents
1
Introduction
Kubernetes metrics are required to run top command. To know the resource utilization of pods and nodes this will help us. While trying to set up the metric we could come across a few issues. For future reference this has been documented, may be helpful for someone those who face similar issues.
I have used an old version of metric till now, It’s time for upgrade. Tried with latest version of metric server deployment.
If you are looking to Setup the Kubernetes Cluster using Ansible, have a look at this.
Installing Latest Metrics
Latest Kubernetes metrics manifests can be downloaded from here, as of when I’m started the upgrade the latest version os v0.4.1.
Thought, the issues would have fixed on the latest version and still they exist. I have used the latest and still face few of issue.
$ kubectl apply -f https://github.com/kubernetes-sigs/metrics-server/releases/download/v0.4.1/components.yamlOutput for reference
ansible@k8mas1:~$ kubectl apply -f https://github.com/kubernetes-sigs/metrics-server/releases/download/v0.4.1/components.yaml
serviceaccount/metrics-server created
clusterrole.rbac.authorization.k8s.io/system:aggregated-metrics-reader created
clusterrole.rbac.authorization.k8s.io/system:metrics-server created
rolebinding.rbac.authorization.k8s.io/metrics-server-auth-reader created
clusterrolebinding.rbac.authorization.k8s.io/metrics-server:system:auth-delegator created
clusterrolebinding.rbac.authorization.k8s.io/system:metrics-server created
service/metrics-server created
deployment.apps/metrics-server created
apiservice.apiregistration.k8s.io/v1beta1.metrics.k8s.io created
ansible@k8mas1:~$ Fixing Kubernetes Metrics for Pods
This guide will walk through small fix.
ansible@k8mas1:~$ kubectl top pods
Error from server (ServiceUnavailable): the server is currently unable to handle the request (get pods.metrics.k8s.io)
ansible@k8mas1:~$Even installed with latest metric and getting unformatted output or metric not available error.
ansible@k8mas1:~$ kubectl top pods
W1203 23:45:07.204217 20547 top_pod.go:265] Metrics not available for pod default/apacheweb-5c8fcdd556-hq8mz, age: 16m9.204210978s
error: Metrics not available for pod default/apacheweb-5c8fcdd556-hq8mz, age: 16m9.204210978s
ansible@k8mas1:~$ Edit the metric server deployment in kube-system namespace.
$ kubectl edit deployments.apps -n kube-system metrics-server Append with two options, from
spec:
containers:
- args:
- --cert-dir=/tmp
- --secure-port=4443
to this
spec:
containers:
- args:
- --cert-dir=/tmp
- --secure-port=4443
- --kubelet-insecure-tls=true
- --kubelet-preferred-address-types=InternalIP
Save and exit from deployment using wq!
ansible@k8mas1:~$ kubectl edit deployments.apps -n kube-system metrics-server
deployment.apps/metrics-server edited
ansible@k8mas1:~$Let’s describe the deployment now, we should get the appended arguments.
ansible@k8mas1:~$ kubectl describe deployments.apps -n kube-system metrics-server
Name: metrics-server
Namespace: kube-system
CreationTimestamp: Thu, 03 Dec 2020 23:26:08 +0400
Labels: k8s-app=metrics-server
Annotations: deployment.kubernetes.io/revision: 5
Selector: k8s-app=metrics-server
Replicas: 1 desired | 1 updated | 1 total | 1 available | 0 unavailable
StrategyType: RollingUpdate
MinReadySeconds: 0
RollingUpdateStrategy: 0 max unavailable, 25% max surge
Pod Template:
Labels: k8s-app=metrics-server
Service Account: metrics-server
Containers:
metrics-server:
Image: k8s.gcr.io/metrics-server/metrics-server:v0.4.1
Port: 4443/TCP
Host Port: 4443/TCP
Args:
--cert-dir=/tmp
--secure-port=4443
--kubelet-preferred-address-types=InternalIP,ExternalIP,Hostname
--kubelet-insecure-tls=true
--kubelet-use-node-status-port
Liveness: http-get https://:https/livez delay=0s timeout=1s period=10s #success=1 #failure=3
Readiness: http-get https://:https/readyz delay=0s timeout=1s period=10s #success=1 #failure=3
Environment: <none>
Mounts:
/tmp from tmp-dir (rw)
Volumes:
tmp-dir:
Type: EmptyDir (a temporary directory that shares a pod's lifetime)
Medium:
SizeLimit: <unset>
Priority Class Name: system-cluster-critical
Conditions:
Type Status Reason
---- ------ ------
Available True MinimumReplicasAvailable
Progressing True NewReplicaSetAvailable
OldReplicaSets: <none>
NewReplicaSet: metrics-server-798bd55c4d (1/1 replicas created)
Events: <none>
ansible@k8mas1:~$Now metric for pods should work fine.
ansible@k8mas1:~$ kubectl top pods
NAME CPU(cores) MEMORY(bytes)
apacheweb-5c8fcdd556-hq8mz 1m 6Mi
apacheweb-5c8fcdd556-mxmc2 1m 6Mi
apacheweb-5c8fcdd556-rlvhn 1m 6Mi
apacheweb-5c8fcdd556-x7vr7 1m 6Mi
apacheweb-5c8fcdd556-zsvkp 1m 6Mi
somepod 0m 2Mi
ansible@k8mas1:~$ Fixing Kubernetes Metrics for Worker Nodes
While trying to list the top command, getting unknown for worker nodes.
ansible@k8mas1:~$ kubectl top nodes
NAME CPU(cores) CPU% MEMORY(bytes) MEMORY%
k8nod1 163m 8% 742Mi 9%
k8mas1 <unknown> <unknown> <unknown> <unknown>
k8nod2 <unknown> <unknown> <unknown> <unknown>
ansible@k8mas1:~$ Once again edit the deployment of Kubernetes metrics under the kube-system namespace.
$ kubectl edit deployments.apps -n kube-system metrics-serverAdd this below dns policy or at the end of the container section above the restart Policy.
hostNetwork: true | Quick 2 fixes 1")
Run the top command, it should work now.
ansible@k8mas1:~$ kubectl top nodes
NAME CPU(cores) CPU% MEMORY(bytes) MEMORY%
k8mas1 113m 5% 1270Mi 16%
k8nod1 56m 2% 741Mi 9%
k8nod2 55m 2% 698Mi 8%
ansible@k8mas1:~$ That’s it, we have successfully fixed the metric issues for pods and nodes.
Conclusion
To conclude on fixing the Kubernetes Metrics issue in newly deployed Kubernetes cluster or an existing cluster is easier by editing the deployment yaml files. Will come up with a new fix on other guide, Subscribe to our newsletter and stay close for more upcoming how-to guides.
Ваш apiserver открывает уровень агрегации?
--requestheader-client-ca-file=/etc/kubernetes/certs/proxy-ca.crt --requestheader-allowed-names=aggregator --requestheader-extra-headers-prefix=X-Remote-Extra- --requestheader-group-headers=X-Remote-Group --requestheader-username-headers=X-Remote-User --proxy-client-cert-file=/etc/kubernetes/certs/proxy.crt --proxy-client-key-file=/etc/kubernetes/certs/proxy.key
а как насчет вашей роли?
это, вероятно, самозаверяющий сертификат в вашем кластере.
Попробуйте включить --kubelet-insecure-tls
Как в
apiVersion: extensions/v1beta1
kind: Deployment
metadata:
name: metrics-server
containers:
- name: metrics-server
image: k8s.gcr.io/metrics-server-amd64:v0.3.3
imagePullPolicy: Always
args: [ "--kubelet-insecure-tls" ]
volumeMounts:
- name: tmp-dir
mountPath: /tmp
У меня было сообщение «ошибка: метрики еще не доступны». Указатель @latchmihay исправил это. Спасибо.
У меня похожая проблема. В нем говорится, что метрики недоступны для узла или модуля. До сих пор сообщает
kubectl top nodes
error: metrics not available yet
Вот моя конфигурация.
apiVersion: extensions/v1beta1
kind: Deployment
metadata:
name: metrics-server
namespace: kube-system
labels:
k8s-app: metrics-server
spec:
selector:
matchLabels:
k8s-app: metrics-server
template:
metadata:
name: metrics-server
labels:
k8s-app: metrics-server
spec:
serviceAccountName: metrics-server
volumes:
# mount in tmp so we can safely use from-scratch images and/or read-only containers
- name: tmp-dir
emptyDir: {}
containers:
- name: metrics-server
image: k8s.gcr.io/metrics-server-amd64:v0.3.3
args: [ "--kubelet-insecure-tls" ]
imagePullPolicy: Always
volumeMounts:
- name: tmp-dir
mountPath: /tmp
@sreedharbukya У меня та же ошибка, и я попробовал все вышеперечисленные методы, но все равно не работает, можете ли вы опубликовать свое решение?
@regardfs , следуйте приведенным ниже инструкциям.
Если вы используете kops для создания кластера.
kops edit cluster --name {cluster_name}
редактировать следующую часть
kubelet:
anonymousAuth: false
authenticationTokenWebhook: true
authorizationMode: Webhook
вы выполнили следующие команды
kops update cluster --yes
kops rolling-update cluster--yes
Следите за своими журналами.
Это должно решить проблему.
Затем обновите развертывания сервера метрик следующим образом.
apiVersion: extensions/v1beta1
kind: Deployment
metadata:
annotations:
deployment.kubernetes.io/revision: ""
kubectl.kubernetes.io/last-applied-configuration: |
{"apiVersion":"extensions/v1beta1","kind":"Deployment","metadata":{"annotations":{},"labels":{"k8s-app":"metrics-server"},"name":"metrics-server","namespace":"kube-system"},"spec":{"selector":{"matchLabels":{"k8s-app":"metrics-server"}},"template":{"metadata":{"labels":{"k8s-app":"metrics-server"},"name":"metrics-server"},"spec":{"containers":[{"image":"k8s.gcr.io/metrics-server-amd64:v0.3.3","imagePullPolicy":"Always","name":"metrics-server","volumeMounts":[{"mountPath":"/tmp","name":"tmp-dir"}]}],"serviceAccountName":"metrics-server","volumes":[{"emptyDir":{},"name":"tmp-dir"}]}}}}
creationTimestamp: "2019-07-19T10:31:07Z"
generation: 2
labels:
k8s-app: metrics-server
name: metrics-server
namespace: kube-system
resourceVersion: "8715"
selfLink: /apis/extensions/v1beta1/namespaces/kube-system/deployments/metrics-server
uid: 5145dcbb-aa10-11e9-bd85-06b142917002
spec:
progressDeadlineSeconds: 2147483647
replicas: 1
revisionHistoryLimit: 10
selector:
matchLabels:
k8s-app: metrics-server
strategy:
rollingUpdate:
maxSurge: 1
maxUnavailable: 1
type: RollingUpdate
template:
metadata:
creationTimestamp: null
labels:
k8s-app: metrics-server
name: metrics-server
spec:
containers:
- command:
- /metrics-server
- --v=2
- --kubelet-preferred-address-types=InternalIP
- --kubelet-insecure-tls=true
image: k8s.gcr.io/metrics-server-amd64:v0.3.3
imagePullPolicy: Always
name: metrics-server
resources: {}
terminationMessagePath: /dev/termination-log
terminationMessagePolicy: File
volumeMounts:
- mountPath: /tmp
name: tmp-dir
dnsPolicy: ClusterFirst
restartPolicy: Always
schedulerName: default-scheduler
securityContext: {}
serviceAccount: metrics-server
serviceAccountName: metrics-server
terminationGracePeriodSeconds: 30
volumes:
- emptyDir: {}
name: tmp-dir
status:
availableReplicas: 1
conditions:
- lastTransitionTime: "2019-07-19T10:31:07Z"
lastUpdateTime: "2019-07-19T10:31:07Z"
message: Deployment has minimum availability.
reason: MinimumReplicasAvailable
status: "True"
type: Available
observedGeneration: 2
readyReplicas: 1
replicas: 1
updatedReplicas: 1
@sreedharbukya Спасибо!
У меня есть кластер AWS EKS и установленный по умолчанию сервер метрик от Helm.
Эти два параметра решили проблему:
--kubelet-preferred-address-types=InternalIP
--kubelet-insecure-tls=true
Как указано в документации, использование --kubelet-insecure-tls=true не рекомендуется для производственных сред.
Тем не менее, как мы можем безопасно развернуть сервер метрик, используя tls ?
У меня такая же ошибка: «метрики еще не доступны». В журналах модуля отображается это сообщение:
I0925 20:15:33.886593 1 serve.go:312] Сгенерированный самозаверяющий сертификат (apiserver.local.config/certificates/apiserver.crt, apiserver.local.config/certificates/apiserver.key)
I0925 20:15:34.430030 1 secure_serving.go:116] Безопасное обслуживание на [::]:443
E0925 20:15:46.541160 1 reststorage.go:135] невозможно получить метрики узла для узла «k8s-worker-1»: метрики для узла неизвестны
Я столкнулся с той же проблемой для узлов, но не для модулей. Kubelet Insecure TLS установлен: без изменений.
$ kubectl top pod -n default
NAME CPU(cores) MEMORY(bytes)
resource-consumer-5766d495c6-bm47z 15m 5Mi
resource-consumer-5766d495c6-rtkzk 6m 5Mi
unprivileged-hello-world-658f6f7f49-dq6js 0m 6Mi
$ kubectl top node
error: metrics not available yet
md5-13d231eb47f48dae2e991b244869f505
```yaml
      - command:
        - /metrics-server
        - --logtostderr
        - --cert-dir=/tmp
        - --secure-port=8443
        - --kubelet-preferred-address-types=InternalIP
        - --kubelet-insecure-tls
@serathius : вот журналы с сервера метрик, отфильтрованные на соответствие «узлу»: https://gist.github.com/ledroide/0cbc6750cab7d6ae0371b88c97aee44e
Пример того, что я вижу в этих журналах:
E1105 13:30:06.940698 1 manager.go:111] unable to fully collect metrics: unable to fully scrape metrics from source kubelet_summary:kube-poc-compute3: unable to get CPU for container "sentinel" in pod webs/webs-sentinel-redis-slave-0 on node "10.150.233.53", discarding data: missing cpu usage metric
E1105 13:44:06.541969 1 manager.go:111] unable to fully collect metrics: [unable to fully scrape metrics from source kubelet_summary:kube-poc-compute4: unable to get CPU for container "sentinel" in pod webs/webs-sentinel-redis-slave-0 on node "10.150.233.54", discarding data: missing cpu usage metric, unable to fully scrape metrics from source kubelet_summary:kube-poc-compute3: unable to get CPU for container "metrics" in pod webs/webs-sentinel-redis-master-0 on node "10.150.233.53", discarding data: missing cpu usage metric]
Можете ли вы убедиться, что kubelet предоставляет метрики процессора?
kubectl get --raw /api/v1/nodes/kube-poc-compute3/proxy/stats/summary | jq '.node'
Вы можете пропустить использование | jq '.node' , оно просто фильтрует данные узла
Я скопировал вывод команды kubectl get --raw /api/v1/nodes/kube-poc-compute3/proxy/stats/summary | jq '.node' в конце той же самой сути .
Выход выглядит хорошо для меня.
Похоже, узел правильно выставляет UsageNanoCores , и я не вижу журнала, в котором упоминаются неработающие метрики узла ( unable to get CPU for node ).
Можете ли вы убедиться, что kubectl top node по-прежнему не работает?
Конечно, все еще не удается:
$ kubectl top node
error: metrics not available yet
Последняя проверка перед тем, как мне нужно будет углубиться в код. Необходимо устранить, если проблема связана с kubectl top , а не с API.
Пожалуйста, бегите
kubectl get --raw /apis/metrics.k8s.io/v1beta1/nodes/kube-poc-compute3
kubectl version
Вы используете heapster в кластере?
Я думаю, что здесь мы достигаем проблемы: список узлов пуст.
$ kubectl get --raw /apis/metrics.k8s.io/v1beta1/nodes/
{"kind":"NodeMetricsList","apiVersion":"metrics.k8s.io/v1beta1","metadata":{"selfLink":"/apis/metrics.k8s.io/v1beta1/nodes/"},"items":[]}
$ kubectl get --raw /apis/metrics.k8s.io/v1beta1/nodes/kube-poc-compute3
Error from server (NotFound): nodemetrics.metrics.k8s.io "kube-poc-compute3" not found
md5-a74ec8613827977ce0bea1cac086477e
$ kubectl version
Client Version: version.Info{Major:"1", Minor:"16", GitVersion:"v1.16.2", GitCommit:"c97fe5036ef3df2967d086711e6c0c405941e14b", GitTreeState:"clean", BuildDate:"2019-10-17T17:16:09Z", GoVersion:"go1.12.10", Compiler:"gc", Platform:"linux/amd64"}
Server Version: version.Info{Major:"1", Minor:"16", GitVersion:"v1.16.2", GitCommit:"c97fe5036ef3df2967d086711e6c0c405941e14b", GitTreeState:"clean", BuildDate:"2019-10-15T19:09:08Z", GoVersion:"go1.12.10", Compiler:"gc", Platform:"linux/amd64"}
$ kubectl api-versions | grep metrics
metrics.k8s.io/v1beta1
$ kubectl api-resources -o wide | egrep '^NAME|metrics'
NAME SHORTNAMES APIGROUP NAMESPACED KIND VERBS
nodes metrics.k8s.io false NodeMetrics [get list]
pods metrics.k8s.io true PodMetrics [get list]
Решено.
Я удалил metrics-server и переустановил его (используя Kubespray).
Это некрасиво, но более гладкие или чистые методы вообще не работали.
Теперь он работает правильно. Большое спасибо @serathius за вашу ценную помощь:
$ kubectl get --raw /apis/metrics.k8s.io/v1beta1/nodes/kube-poc-compute3
{"kind":"NodeMetrics","apiVersion":"metrics.k8s.io/v1beta1","metadata":{"name":"kube-poc-compute3","selfLink":"/apis/metrics.k8s.io/v1beta1/nodes/kube-poc-compute3","creationTimestamp":"2019-11-12T09:42:21Z"},"timestamp":"2019-11-12T09:41:57Z","window":"30s","usage":{"cpu":"849755531n","memory":"8506004Ki"}}
Решается следующими шагами:
1) Клонировать https://github.com/kubernetes-sigs/metrics-server
2) Отключите надстройку сервера метрик для миникуба, если она была включена
minikube addons disable metrics-server
3) Разверните последний сервер метрик
kubectl create -f deploy/1.8+/
4) Отредактируйте развертывание метрического сервера, чтобы добавить флаги
# args:
# - --kubelet-insecure-tls
# - --kubelet-preferred-address-types=InternalIP,ExternalIP,Hostname
$ kubectl edit deploy -n kube-system metrics-server
6) Подождите 1 минуту и метрики штанги станут доступны.
Здравствуйте, у меня такая же проблема…
Я удалил сервер метрик, а затем переустановил его с аргументами, упомянутыми @neerajjain92, но боюсь, что ничего не происходит.
1 desired | 1 updated | 1 total | 0 available | 1 unavailable
У меня была такая же проблема с Kubernetes 1.16, установленным kops на AWS. Я обнаружил, что на сервере все еще установлен heapster. Когда я удалил хипстер (устанавливался с помощью helm), команда kubectl top nodes начала работать.
Спасибо @latchmihay, ваше решение работает для меня.
Проблема возникла со мной, и ни одно из приведенных выше предложений не сработало, потому что проблема была не в метриках. Проблема была в том, что 443 и 80 были заняты. У меня был запущен сервер Apache. Если у вас есть какое-либо приложение, работающее на этих портах, попробуйте убить их перед чем-либо.
@regardfs , следуйте приведенным ниже инструкциям.
Если вы используете kops для создания кластера.
kops edit cluster --name {cluster_name}редактировать следующую часть
kubelet: anonymousAuth: false authenticationTokenWebhook: true authorizationMode: Webhookвы выполнили следующие команды
kops update cluster --yes
kops rolling-update cluster--yesСледите за своими журналами.
Это должно решить проблему.
Затем обновите развертывания сервера метрик следующим образом.
kind: Deployment metadata: annotations: deployment.kubernetes.io/revision: "" kubectl.kubernetes.io/last-applied-configuration: | {"apiVersion":"extensions/v1beta1","kind":"Deployment","metadata":{"annotations":{},"labels":{"k8s-app":"metrics-server"},"name":"metrics-server","namespace":"kube-system"},"spec":{"selector":{"matchLabels":{"k8s-app":"metrics-server"}},"template":{"metadata":{"labels":{"k8s-app":"metrics-server"},"name":"metrics-server"},"spec":{"containers":[{"image":"k8s.gcr.io/metrics-server-amd64:v0.3.3","imagePullPolicy":"Always","name":"metrics-server","volumeMounts":[{"mountPath":"/tmp","name":"tmp-dir"}]}],"serviceAccountName":"metrics-server","volumes":[{"emptyDir":{},"name":"tmp-dir"}]}}}} creationTimestamp: "2019-07-19T10:31:07Z" generation: 2 labels: k8s-app: metrics-server name: metrics-server namespace: kube-system resourceVersion: "8715" selfLink: /apis/extensions/v1beta1/namespaces/kube-system/deployments/metrics-server uid: 5145dcbb-aa10-11e9-bd85-06b142917002 spec: progressDeadlineSeconds: 2147483647 replicas: 1 revisionHistoryLimit: 10 selector: matchLabels: k8s-app: metrics-server strategy: rollingUpdate: maxSurge: 1 maxUnavailable: 1 type: RollingUpdate template: metadata: creationTimestamp: null labels: k8s-app: metrics-server name: metrics-server spec: containers: - command: - /metrics-server - --v=2 - --kubelet-preferred-address-types=InternalIP - --kubelet-insecure-tls=true image: k8s.gcr.io/metrics-server-amd64:v0.3.3 imagePullPolicy: Always name: metrics-server resources: {} terminationMessagePath: /dev/termination-log terminationMessagePolicy: File volumeMounts: - mountPath: /tmp name: tmp-dir dnsPolicy: ClusterFirst restartPolicy: Always schedulerName: default-scheduler securityContext: {} serviceAccount: metrics-server serviceAccountName: metrics-server terminationGracePeriodSeconds: 30 volumes: - emptyDir: {} name: tmp-dir status: availableReplicas: 1 conditions: - lastTransitionTime: "2019-07-19T10:31:07Z" lastUpdateTime: "2019-07-19T10:31:07Z" message: Deployment has minimum availability. reason: MinimumReplicasAvailable status: "True" type: Available observedGeneration: 2 readyReplicas: 1 replicas: 1 updatedReplicas: 1```
не пришлось жестко обновлять развертывание. —insecure tls и кластер обновлений kops помогли мне, спасибо
Я столкнулся с той же проблемой для узлов, но не для модулей. Kubelet Insecure TLS установлен: без изменений.
$ kubectl top pod -n default NAME CPU(cores) MEMORY(bytes) resource-consumer-5766d495c6-bm47z 15m 5Mi resource-consumer-5766d495c6-rtkzk 6m 5Mi unprivileged-hello-world-658f6f7f49-dq6js 0m 6Mi$ kubectl top node error: metrics not available yet$ kubectl get deploy metrics-server -o yaml | grep -B6 insecure- command: - /metrics-server - --logtostderr - --cert-dir=/tmp - --secure-port=8443 - --kubelet-preferred-address-types=InternalIP - --kubelet-insecure-tls
Эта настройка работала для меня, за исключением того, что я оставил безопасный порт на 4443, как он был установлен с помощью сценария развертывания. Теперь я могу получить первое место как на узле, так и на модулях.
это, вероятно, самозаверяющий сертификат в вашем кластере.
Попробуйте включить--kubelet-insecure-tlsКак в
apiVersion: extensions/v1beta1 kind: Deployment metadata: name: metrics-servercontainers: - name: metrics-server image: k8s.gcr.io/metrics-server-amd64:v0.3.3 imagePullPolicy: Always args: [ "--kubelet-insecure-tls" ] volumeMounts: - name: tmp-dir mountPath: /tmpУ меня была та же проблема, и я исправил ее, добавив аргументы, как и вы, спасибо
@sreedharbukya большое спасибо!!!
Конечно, все еще не удается:
$ kubectl top node
error: metrics not available yet
у тебя есть решение?
@кевинсингапор
Рекомендую создать отдельный выпуск, так как в этом выпуске нам даже не удалось исправить первоначальную проблему, которая была у репортера.
ошибка: метрики пока недоступны
Означает, что есть проблема с metrics-сервером, но ничего не говорит о том, в чем проблема. Это означает, что эта проблема не очень полезна для других (например , @ledroide только что воссоздал MS).
Можно было бы попробовать некоторые предложения из этого выпуска, но все же было бы лучше заняться каждой настройкой отдельно.
У меня была аналогичная проблема с миникубом, работающим на Windows 10 Home. Ваш урок мне помог.
Спасибо, @neerajjain92 !
Решается следующими шагами:
- Клон https://github.com/kubernetes-sigs/metrics-server
- Отключите надстройку metrics-server для minikube, если она была включена.
minikube addons disable metrics-server- Разверните последний сервер метрик
kubectl create -f deploy/1.8+/- Отредактируйте развертывание сервера метрик, чтобы добавить флаги
# args:
# - --kubelet-insecure-tls
# - --kubelet-preferred-address-types=InternalIP,ExternalIP,Hostname
$ kubectl edit deploy -n kube-system metrics-server
- Подождите 1 минуту, и метрики штанги станут доступны.
Это сработало, спасибо.
У меня была такая же проблема, это мой конфиг:
[ [email protected] data]# kubectl get pods —all-namespaces
ПРОСТРАНСТВО ИМЕН ИМЯ ГОТОВ СТАТУС ПЕРЕЗАПУСКА ВОЗРАСТ
по умолчанию whoami-7c8d684c55-vmc9x 1/1 Работает 1 20 часов
kube-system coredns-6d56c8448f-g98fb 1/1 Работает 3 2d
kube-system coredns-6d56c8448f-nhmk7 1/1 Работает 3 2d
kube-system etcd-k8s-master 1/1 Работает 5 2d
kube-system heapster-7fcb4d8889-nm2ln 1/1 Работает 0 15ч
kube-system kube-apiserver-k8s-master 1/1 работает 5 2d
kube-system kube-controller-manager-k8s-master 1/1 Работает 8 47ч
kube-system kube-flannel-ds-662nb 1/1 Работает 1 21ч
kube-system kube-flannel-ds-8njs6 1/1 работает 0 21h
kube-system kube-flannel-ds-d2z4w 1/1 работает 3 21ч
kube-system kube-proxy-2blhp 1/1 Работает 3 46ч
kube-system kube-proxy-6hjpl 1/1 Работает 1 47ч
kube-system kube-proxy-zsvrh 1/1 Работает 4 2d
kube-system kube-scheduler-k8s-master 1/1 Работает 8 47ч
kube-system Monitoring-grafana-6d69444f6-fr9bp 1/1 Запуск 2 41ч
kube-system Monitoring-influxdb-64596c7b6d-jzskg 1/1 Работает 1 41ч
kubernetes-dashboard dashboard-metrics-scraper-7b59f7d4df-4mkbb 1/1 Работает 0 16h
kubernetes-dashboard kubernetes-dashboard-665f4c5ff-9v8kf 1/1 Работает 0 16h
[ [email protected] k8s] # версия kubectl
Версия клиента: version.Info{Major:»1″, Minor:»19″, GitVersion:»v1.19.2″, GitCommit:»f5743093fd1c663cb0cbc89748f730662345d44d», GitTreeState:»clean», BuildDate:»2020-09-16T13:41: 02Z», версия Go: «go1.15», компилятор: «gc», платформа: «linux/amd64»}
Версия сервера: version.Info{Major:»1″, Minor:»19″, GitVersion:»v1.19.2″, GitCommit:»f5743093fd1c663cb0cbc89748f730662345d44d», GitTreeState:»clean», BuildDate:»2020-09-16T13:32: 58Z», версия Go: «go1.15», компилятор: «gc», платформа: «linux/amd64»}
[ [email protected] k8s]# kubectl top po
ошибка: API метрик недоступен
логи хипстера:
W0924 01:44:25.002300 1 manager.go:152] Не удалось вовремя получить все ответы (получено 0/3)
E0924 01:45:05.001192 1 manager.go:101] Ошибка при извлечении контейнеров из kubelet:192.168.28.143 :10250: не удалось получить всю статистику контейнеров из Kubelet URL » https://192.168.28.143 :10250/stats/container/ «: » https://192.168.28.143 :10250/stats/container/» не найдено
E0924 01:45:05.007179 1 manager.go:101] Ошибка при извлечении контейнеров из kubelet:192.168.28.141 :10250: не удалось получить всю статистику контейнеров из Kubelet URL » https://192.168.28.141 :10250/stats/container/ «: » https://192.168.28.141 :10250/stats/container/» не найдено
E0924 01:45:05.015769 1 manager.go:101] Ошибка при извлечении контейнеров из kubelet:192.168.28.142 :10250: не удалось получить всю статистику контейнеров из Kubelet URL » https://192.168.28.142 :10250/stats/container/ «:
[ [email protected]основные данные] # netstat -nultp
Активные интернет-соединения (только серверы)
Proto Recv-Q Send-Q Локальный адрес Внешний адрес Состояние PID/имя программы
TCP 0 0 0.0.0.0:31303 0.0.0.0:* ПРОСЛУШИВАТЬ 126245/kube-proxy
TCP 0 0 127.0.0.1:10248 0.0.0.0:* ПРОСЛУШАТЬ 1059/кубелет
TCP 0 0 127.0.0.1:10249 0.0.0.0:* ПРОСЛУШИВАТЬ 126245/кубе-прокси
TCP 0 0 192.168.28.141:2379 0.0.0.0:* ПРОСЛУШИВАТЬ 126075/etcd
TCP 0 0 127.0.0.1:2379 0.0.0.0:* ПРОСЛУШАТЬ 126075/etcd
TCP 0 0 192.168.28.141:2380 0.0.0.0:* ПРОСЛУШИВАТЬ 126075/etcd
TCP 0 0 127.0.0.1:2381 0.0.0.0:* ПРОСЛУШАТЬ 126075/etcd
TCP 0 0 127.0.0.1:10257 0.0.0.0:* ПРОСЛУШАТЬ 15888/kube-controll
TCP 0 0 127.0.0.1:10259 0.0.0.0:* ПРОСЛУШАТЬ 15947/kube-расписание
TCP 0 0 0.0.0.0:30101 0.0.0.0:* ПРОСЛУШИВАТЬ 126245/kube-proxy
TCP 0 0 0.0.0.0:22 0.0.0.0:* ПРОСЛУШИВАТЬ 1056/sshd
TCP 0 0 127.0.0.1:41111 0.0.0.0:* ПРОСЛУШАТЬ 1059/кубелет
TCP 0 0 0.0.0.0:31001 0.0.0.0:* ПРОСЛУШИВАТЬ 126245/kube-proxy
TCP 0 0 127.0.0.1:25 0.0.0.0:* ПРОСЛУШИВАТЬ 1206/мастер
TCP 0 0 0.0.0.0:30108 0.0.0.0:* ПРОСЛУШИВАТЬ 126245/kube-proxy
tcp6 0 0 :::10250 :::* ПРОСЛУШАТЬ 1059/kubelet
tcp6 0 0 :::10251 :::* ПРОСЛУШИВАТЬ 15947/кубе-расписание
tcp6 0 0 :::6443 :::* ПРОСЛУШИВАТЬ 125805/kube-apiserv
tcp6 0 0 :::10252 :::* ПРОСЛУШИВАТЬ 15888/kube-controll
tcp6 0 0 :::10256 :::* ПРОСЛУШИВАТЬ 126245/kube-proxy
tcp6 0 0 :::22 :::* ПРОСЛУШИВАТЬ 1056/sshd
tcp6 0 0 ::1:25 :::* ПРОСЛУШИВАТЬ 1206/мастер
udp 0 0 10.244.0.1:123 0.0.0.0:* 838/ntpd
udp 0 0 10.244.0.0:123 0.0.0.0:* 838/ntpd
udp 0 0 172.17.0.1:123 0.0.0.0:* 838/ntpd
udp 0 0 192.168.28.141:123 0.0.0.0:* 838/ntpd
udp 0 0 127.0.0.1:123 0.0.0.0:* 838/ntpd
udp 0 0 0.0.0.0:123 0.0.0.0:* 838/ntpd
удп 0 0 0.0.0.0:8472 0.0.0.0:* —
udp6 0 0 fe80::98d8:4 aff:fef :123 :::* 838/ntpd
udp6 0 0 fe80::888f: dfff:feb :123 :::* 838/ntpd
udp6 0 0 fe80::886a:32ff: федерал :123 :::* 838/ntpd
udp6 0 0 fe80::c89e: ecff:fed :123 :::* 838/ntpd
udp6 0 0 fe80::20c:29ff: febc:123 :::* 838/ntpd
udp6 0 0 ::1:123 :::* 838/ntpd
udp6 0 0 :::123 :::* 838/ntpd
это вопрос пространства имен?
если вы используете bitnami metrics-server, включите это даже k8s > 1.18
аписервис:
создать: правда
Мне нужно было только --kubelet-preferred-address-types=InternalIP , чтобы исправить это. В Terraform Helm Provider значение должно быть массивом, в котором используются { и } , а значения разделены , .
resource "helm_release" "metrics-server" {
  create_namespace = true
  namespace        = "platform"
  name             = "metrics-server"
  repository       = "https://charts.helm.sh/stable"
  chart            = "metrics-server"

  set {
    name  = "args"
    value = "{"--kubelet-preferred-address-types=InternalIP"}"
  }
}
Редактировать: этот отчет определенно не принадлежит здесь, извините за шум
Я смог решить эту проблему, переключившись с диаграммы управления Bitnami для сервера метрик на настроенное развертывание сервера метрик из этого репозитория, с очень похожими на «тестовые» манифесты настраиваемых параметров. Спасибо, что предоставили это.
Я нахожусь на kubeadm v1.20.2 с соответствующим kubectl, и мне пришлось установить apiService.create: true , как предложил @debu99 .
Это противоречит документам в values.yaml , которые могут быть неверными.
## API service parameters
##
apiService:
  ## Specifies whether the v1beta1.metrics.k8s.io API service should be created
  ## This should not be necessary in k8s version >= 1.8, but depends on vendors and cloud providers.
  ##
  create: false
Иначе я столкнулся с error: Metrics API not available
Хотя это не является предметом данного отчета о проблеме, эта проблема является одним из самых популярных результатов для «ошибка: API метрик недоступен», и она помогла мне, поэтому я выделяю ее здесь.
~ Я не уверен, что эта информация относится сюда, я использую bitnami/metrics-server , у которого есть собственный репозиторий в https://github.com/bitnami/charts/ и так далее ~ Я думаю, что новый отчет о проблеме должен иди туда, если есть проблема.
Была ли эта страница полезной?
0 / 5 — 0 рейтинги