What did you do?
I started a node_exporter , and started a prometheus server on localhost
What did you expect to see?
What did you see instead? Under which circumstances?
WARN[0035] Error on ingesting out-of-order samples       numDropped=520 source=scrape.go:533
WARN[0035] Scrape health sample discarded                error=sample timestamp out of order sample=up{alias="node1", instance="node1", job="linux"} => 1 @[1495195178.231] source=scrape.go:586
WARN[0035] Scrape duration sample discarded              error=sample timestamp out of order sample=scrape_duration_seconds{alias="node1", instance="node1", job="linux"} => 0.048101537 @[1495195178.231] source=scrape.go:589
WARN[0035] Scrape sample count sample discarded          error=sample timestamp out of order sample=scrape_duration_seconds{alias="node1", instance="node1", job="linux"} => 0.048101537 @[1495195178.231] source=scrape.go:592
WARN[0035] Scrape sample count post-relabeling sample discarded  error=sample timestamp out of order sample=scrape_duration_seconds{alias="node1", instance="node1", job="linux"} => 0.048101537 @[1495195178.231] source=scrape.go:595
Environment
Centos6.5
- System information:
Linux 2.6.32-431.el6.x86_64 x86_64
- Prometheus version:
prometheus, version 1.6.2 (branch: master, revision: b38e977)
build user: root@c99d9d650cf4
build date: 20170511-12:59:13
go version: go1.8.1
- Prometheus configuration file:
insert configuration here
- Alertmanager configuration file:
# my global config
global:
  scrape_interval:     15s # Set the scrape interval to every 15 seconds. Default is every 1 minute.
  evaluation_interval: 15s # Evaluate rules every 15 seconds. The default is every 1 minute.
  # scrape_timeout is set to the global default (10s).

  # Attach these labels to any time series or alerts when communicating with
  # external systems (federation, remote storage, Alertmanager).
  external_labels:
      monitor: 'codelab-monitor'

# Load rules once and periodically evaluate them according to the global 'evaluation_interval'.
rule_files:
  # - "first.rules"
  # - "second.rules"

# A scrape configuration containing exactly one endpoint to scrape:
# Here it's Prometheus itself.
scrape_configs:
  # The job name is added as a label `job=<job_name>` to any timeseries scraped from this config.
#  - job_name: 'prometheus'

    # metrics_path defaults to '/metrics'
    # scheme defaults to 'http'.

#    static_configs:
#      - targets: ['localhost:9090']
  - job_name: 'linux'
    static_configs:
        - targets: ['192.168.130.1:9100']
          labels:
            instance: node1
            alias: node1
#  - job_name: 'mysql'
#    static_configs:
#        - targets: ['192.168.130.1:9100']
#          labels:
#            instance: node1```

* Logs:
WARN[0035] Error on ingesting out-of-order samples numDropped=520 source=scrape.go:533
WARN[0035] Scrape health sample discarded error=sample timestamp out of order sample=up{alias=»node1″, instance=»node1″, job=»linux»} => 1 @[1495195178.231] source=scrape.go:586
WARN[0035] Scrape duration sample discarded error=sample timestamp out of order sample=scrape_duration_seconds{alias=»node1″, instance=»node1″, job=»linux»} => 0.048101537 @[1495195178.231] source=scrape.go:589
WARN[0035] Scrape sample count sample discarded error=sample timestamp out of order sample=scrape_duration_seconds{alias=»node1″, instance=»node1″, job=»linux»} => 0.048101537 @[1495195178.231] source=scrape.go:592
WARN[0035] Scrape sample count post-relabeling sample discarded error=sample timestamp out of order sample=scrape_duration_seconds{alias=»node1″, instance=»node1″, job=»linux»} => 0.048101537 @[1495195178.231] source=scrape.go:595
How do you debug and resolve the «Error on ingesting out-of-order samples» warning from Prometheus?
The TSDB inside Prometheus is append only, once series has a sample for t=10 you can’t ingest a sample for any earlier time such as t=9. If a scrape attempts to do so you’ll get a warning like:
level=warn ts=2020-05-26T11:01:50.938Z caller=scrape.go:1203 component="scrape manager" scrape_pool=test target=:8000/metrics msg="Error on ingesting out-of-order samples" num_dropped=1
Here test is the job_name of a scrape config, and target is the URL that is being scraped. Only a count of how many samples were affected is provided, as it could be quite spammy otherwise. If you turn on debug logging with --log.level=debug you can get the names of the relevant series:
level=debug ts=2020-05-26T11:01:50.938Z caller=scrape.go:1245 component="scrape manager" scrape_pool=test target=:8000/metrics msg="Out of order sample" series="a{foo="bar"}"
So you’ve a little more information, how do you fix this? First you need to understand what can cause this. This simplest but least likely case is that a single target is exposing out of order timestamps either within a scrape (i.e. is exposing the same series multiple times, with timestamps going backwards), or across scrapes. This can be checked by refreshing the scrape endpoint a few times and seeing if things are going backwards or there’s duplicate series with descending timestamps. If this is the issue, it’ll need to be fixed in the code of that target. Keep in mind that targets should rarely expose timestamps.
Another possible but less likely cause is that you’ve manged to create two targets with identical target labels. This is not possible within one scrape config as the targets will be deduplicated, but can happen across scrape configs. This does not require that the targets expose timestamps, and if it’s happening you’ll notice that the generated metrics like up and scrape_duration_seconds are affected. How this then happens is the two scrape loops will independently scrape the target on their own schedule. The timestamp of ingested data is by default when the scrape stats. So say the first scrape starts at t=1, the second scrape starts at t=2, the second scrape finishes as t=3, and the first scrape finishes as t=4. When the second scrape completes up will be ingested with the timestamp t=2, so when the first scrape completes and subsequently tries to ingest up with t=1 that fails due to being out of order. This is a race condition, so may not show consistently and will often only produce logs from one of the two relevant targets. To check if this is the cause, check if any other targets in your Prometheus have the same target labels as the target referenced in the log message. To fix this ensure that all targets within a Prometheus have unique target labels, either by adding distinguishing labels or removing duplicate targets.
A related potential cause is if the system time goes backwards on the machine running Prometheus. This would show up as widespread out-of-order for all targets that existed both before the time change and afterwards, affecting both scraped series and generated series like up. To check if this is the cause, evaluate timestamp(up) for some target the Prometheus is scraping and see if it is in the future. To fix this you can either wait for the system time to catch back up, or delete the «future» data from Prometheus.
The final potential cause is the most complex one, where two distinct targets are producing the same time series. Given that by now you’ve ensured that you don’t have targets with duplicate target labels, this means that either honor_labels or metric_label_configs are involved. honor_labels means that you completely trust targets to override their target labels, while metric_label_configs allows for more sophisticated series label munging. It that can be quite tricky for you to debug — particularly if metric_label_configs is in use — as given the target and time series from the log message you need to reverse engineer which other targets might end up producing series with clashing labels. If the target is one where honor_labels and metric_label_configs is not configured, then you can limit your search to targets where they are configured. On the other hand if the target in the logs is one where these features are in use, then the clash could potentially be with any other target.
The most common cause of this is federation, where two Prometheus servers in a HA setup naturally contain all of the same series with different timestamps and honor_labels is in use but the time series aren’t getting distinguished. If this is the case the fix is simply to ensure that both of the Prometheus servers have distinct external_labels, which is what you should be doing in any case. This could also happen if you had two pushgateways which a given batch job was pushing to both of, in which case adding a distinguishing target label which doesn’t clash with any of the scraped labels should fix it. If it’s not a simpler case like this, you may have to spend quite a bit of time figuring out what exactly is causing the clash. Removing honor_labels and overly-broad metric_label_configs from any of your targets which don’t need them would also be wise.
The prometheus_target_scrapes_sample_out_of_order_total metric also tracks how often this is happening across a Prometheus. Your aim should be to ensure that this never happens, as it generally indicates a coding, architecture, or configuration flaw. All this only covers targets interacting with other targets, this problem can occur with recording and alerting rules for which you can apply similar debugging techniques.
Having problems with scrape errors? Contact us.
Published by Brian Brazil in Posts
Содержание
- Prometheus has many samples rejected
- Share this:
- Need personalized help?
- Error on ingesting samples with different value and the prometheus log does not show #2858
- Comments
- Error on ingesting samples with different value but same timestamp
Prometheus has many samples rejected
Got this alert today from Prometheus and had no idea what it meant:
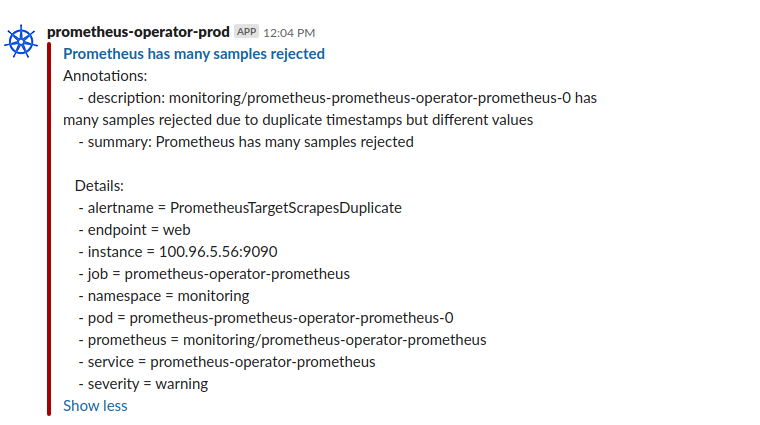
Looking at the Prometheus logs, it was full of similar lines like these:
I did have a clue to go off of — someone told me they just deployed out the same service but to another namespace.
This is our normal regular service name: managedkube/svcmon-managedkube-api
This is the newly added service for a demo : managedkube-demo/svcmon-managedkube-api
That seems to make sense if two of the same services were being scraped and added in without Prometheus changing the labels it would cause this. However, when Prometheus scrapes the endpoints, it would usually add in the namespace label into the metric which would make the metric unique.
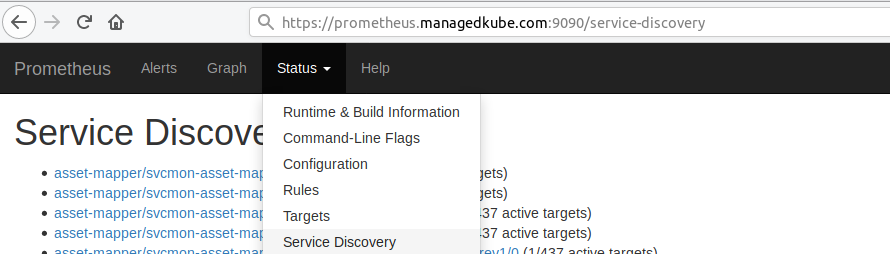
I started to poke around in the Prometheus web interface to see if something stands out. Going to the Service Discovery section:
Looking at the service for the duplicate service of the new demo service: managedkube-demo/svcmon-managedkube-api
I noticed that the namespace which should have been managedkube-api-demo it was still managedkube-api .
The problem here is that adding this additional Prometheus Service Monitor it was scraping the old and the new service. Now there are two of the Service Monitors since the deploy deploy this out as well. There were indeed duplicate metrics being put into Prometheus.
The next thing to figure out is why?
Looking at the service monitor definition:
The important part is:
This means that it will go through all of the namespace and pick up anything that matched the labels. This was causing the each service to be scraped twice.
The Service Monitor lives in the namespace of the service. The change and the fix was to make it only select from the namespace that it lived in:
This fixed the problem and the alarm cleared up.
Need personalized help?
ManagedKube provides DevOps consulting services that help you leverage the power of Docker/Kubernetes in building highly resilient, secure, and scalable fully automated CI/CD workflows.
Источник
Error on ingesting samples with different value and the prometheus log does not show #2858
Just like the issue on this page :
#2493
But I did not see the log that indicate the error metric?
I’ve noticed the log in prometheus should be like this? 
The text was updated successfully, but these errors were encountered:
This is the part of prometheus logs
time=»2017-06-16T08:47:51Z» level=info msg=»Indexing metrics in memory.» source=»crashrecovery.go:502″ time=»2017-06-16T08:47:51Z» level=info msg=»10000 metrics queued for indexing.» source=»crashrecovery.go:507″ time=»2017-06-16T08:47:51Z» level=info msg=»20000 metrics queued for indexing.» source=»crashrecovery.go:507″ time=»2017-06-16T08:47:51Z» level=info msg=»30000 metrics queued for indexing.» source=»crashrecovery.go:507″ time=»2017-06-16T08:47:51Z» level=info msg=»Indexing archived metrics.» source=»crashrecovery.go:510″ time=»2017-06-16T08:47:51Z» level=info msg=»40000 metrics queued for indexing.» source=»crashrecovery.go:523″ time=»2017-06-16T08:47:51Z» level=info msg=»50000 metrics queued for indexing.» source=»crashrecovery.go:523″ time=»2017-06-16T08:47:51Z» level=info msg=»60000 metrics queued for indexing.» source=»crashrecovery.go:523″ time=»2017-06-16T08:47:51Z» level=info msg=»70000 metrics queued for indexing.» source=»crashrecovery.go:523″ time=»2017-06-16T08:47:52Z» level=info msg=»80000 metrics queued for indexing.» source=»crashrecovery.go:523″ time=»2017-06-16T08:47:52Z» level=info msg=»90000 metrics queued for indexing.» source=»crashrecovery.go:523″ time=»2017-06-16T08:47:52Z» level=info msg=»100000 metrics queued for indexing.» source=»crashrecovery.go:523″ time=»2017-06-16T08:47:52Z» level=info msg=»110000 metrics queued for indexing.» source=»crashrecovery.go:523″ time=»2017-06-16T08:47:52Z» level=info msg=»120000 metrics queued for indexing.» source=»crashrecovery.go:523″ time=»2017-06-16T08:47:52Z» level=info msg=»All requests for rebuilding the label indexes queued. (Actual processing may lag behind.)» source=»crashrecovery.go:529″ time=»2017-06-16T08:47:52Z» level=info msg=»Checkpointing fingerprint mappings. » source=»persistence.go:1480″ time=»2017-06-16T08:47:52Z» level=info msg=»Done checkpointing fingerprint mappings in 1.537957ms.» source=»persistence.go:1503″ time=»2017-06-16T08:47:52Z» level=warning msg=»Crash recovery complete.» source=»crashrecovery.go:152″ time=»2017-06-16T08:47:52Z» level=info msg=»30673 series loaded.» source=»storage.go:378″ time=»2017-06-16T08:47:52Z» level=info msg=»Starting target manager. » source=»targetmanager.go:61″ time=»2017-06-16T08:47:52Z» level=info msg=»Listening on :9090″ source=»web.go:259″ time=»2017-06-16T08:47:53Z» level=warning msg=»Error on ingesting samples with different value but same timestamp» numDropped=8 source=»scrape.go:520″ time=»2017-06-16T08:47:53Z» level=warning msg=»Error on ingesting samples with different value but same timestamp» numDropped=7 source=»scrape.go:520″ time=»2017-06-16T08:47:55Z» level=warning msg=»Error on ingesting samples with different value but same timestamp» numDropped=6 source=»scrape.go:520″ time=»2017-06-16T08:48:05Z» level=warning msg=»Error on ingesting samples with different value but same timestamp» numDropped=7 source=»scrape.go:520″ time=»2017-06-16T08:48:06Z» level=warning msg=»Error on ingesting samples with different value but same timestamp» numDropped=8 source=»scrape.go:520″ time=»2017-06-16T08:48:07Z» level=warning msg=»Error on ingesting samples with different value but same timestamp» numDropped=8 source=»scrape.go:520″ time=»2017-06-16T08:48:08Z» level=warning msg=»Error on ingesting samples with different value but same timestamp» numDropped=8 source=»scrape.go:520″ time=»2017-06-16T08:48:08Z» level=warning msg=»Error on ingesting samples with different value but same timestamp» numDropped=7 source=»scrape.go:520″ time=»2017-06-16T08:48:10Z» level=warning msg=»Error on ingesting samples with different value but same timestamp» numDropped=6 source=»scrape.go:520″ time=»2017-06-16T08:48:20Z» level=warning msg=»Error on ingesting samples with different value but same timestamp» numDropped=7 source=»scrape.go:520″ time=»2017-06-16T08:48:21Z» level=warning msg=»Error on ingesting samples with different value but same timestamp» numDropped=8 source=»scrape.go:520″ time=»2017-06-16T08:48:22Z» level=warning msg=»Error on ingesting samples with different value but same timestamp» numDropped=8 source=»scrape.go:520″ time=»2017-06-16T08:48:23Z» level=warning msg=»Error on ingesting samples with different value but same timestamp» numDropped=8 source=»scrape.go:520″ time=»2017-06-16T08:48:23Z» level=warning msg=»Error on ingesting samples with different value but same timestamp» numDropped=7 source=»scrape.go:520″ time=»2017-06-16T08:48:25Z» level=warning msg=»Error on ingesting samples with different value but same timestamp» numDropped=6
It makes more sense to ask questions like this on the prometheus-users mailing list rather than in a GitHub issue. On the mailing list, more people are available to potentially respond to your question, and the whole community can benefit from the answers provided.
Источник
Error on ingesting samples with different value but same timestamp
December 15, 2022 by Julius Volz
Have you ever encountered any of the following errors in your Prometheus server logs?
- «Error on ingesting out-of-order samples»
- «Error on ingesting samples with different value but same timestamp»
- «duplicate sample for timestamp»
Then you likely have a misconfiguration in your setup that causes multiple series to collide and conflict with each other. In this post, we’re going to explain the background behind these errors, what may cause them, and how to you can debug and fix them.
Background: The TSDB is (normally) append-only
Prometheus is a live monitoring system that usually only needs to keep track of metrics in a steadily ongoing way over time. The Prometheus TSDB reflects this by (normally) only supporting appends to the end of any existing series. That means that it rejects incoming samples that have an earlier timestamp than the latest one within the same series. It also rejects samples with the same timestamp as the latest one in their series when they have a different sample value (otherwise, they are ignored).

However, it is possible to misconfigure Prometheus in such a way that you get duplicated or out-of-order sample timestamps that Prometheus tries and fails to append to the TSDB. This is usually due to an accidental label set collision between multiple time series that causes the series to look the same (same metric name and label set), but it can have other reasons as well. When that happens, appends to the TSDB for the offending samples will fail, and Prometheus will log corresponding errors.
Side note: Prometheus 2.39 introduced an experimental out_of_order_time_window configuration setting that allows ingesting out-of-order samples within a limited time period, but this feature is not enabled by default. It can be useful in certain situations where not all data can be gathered live.
Underlying causes of sample timestamp errors
Let’s have a look at the most common causes for these problems, along with the error messages they produce.
In a correctly configured Prometheus setup, every target has its own unique set of target labels. Prometheus attaches these labels to all series pulled from a target to help disambiguate otherwise identical metrics from different targets. But it’s possible to misconfigure Prometheus in such a way that multiple targets share the same label set, which can cause label set collisions between the resulting time series. The TSDB will then see the streams of multiple original series as a single series, but reject invalid appends when their samples conflict with each other with out-of-order or duplicate timestamps.
Here’s one way to easily provoke this duplication, by explicitly setting the job label of a target group to the same value as another job with an otherwise identical target in your prometheus.yml :
Another variant of the above could be achieved by adding target relabeling rules to the second scrape configuration and overriding the job label to «demo» that way.
When one of these duplicated targets starts scraping before the other one, but finishes the scrape last, you will get an «Error on ingesting out-of-order samples» error message, as the first target tries to insert its samples into the TSDB with a scrape timestamp before the second one that has already completed. As a full log line, that will look something like this:
When two duplicated targets start scraping at exactly the same millisecond (which can and does happen between targets from different scrape pools), they will try storing their resulting samples with the same scrape timestamp. But one of these appends will fail with an «Error on ingesting samples with different value but same timestamp» error message:
Usually the scrape_pool and target fields from the error message should be enough to point you at the right place in the configuration file to find and fix the conflicting targets. However, the duplication might not be visible in the configuration file itself, in case a remote service discovery mechanism produces duplicate targets, or there is an interaction between the service discovery source and target relabeling rules that leads to a loss of disambiguating labels. In that case, you may also want to take a look at the /targets page of your Prometheus server to spot identically labeled targets between multiple scrape pools or scrape configs (it’s not possible to have identical targets in the same scrape pool, as Prometheus automatically deduplicates them into a single one). The /service-discovery page also shows all discovered targets with their label sets before and after relabeling. To fix the ingestion errors, make sure that all targets are labeled uniquely.
Buggy client-side timestamps
Usually Prometheus /metrics endpoints will not include explicit timestamps for the samples they expose. Instead, Prometheus assigns its own scrape start timestamp to all pulled samples. However, it’s also possible to provide explicit client-side timestamps for samples in the Prometheus metrics exposition format. For example, if you wanted to expose a test_metric metric with a value of 42 and a milliseconds Unix timestamp of 1671021749332 , the exposition format would read:
Given the TSDB restrictions mentioned initially, there is a lot that can go wrong here if that feature is misused or incorrectly implemented: if a client-side timestamp moves backwards between scrapes, you will get an out-of-order error. If it stays the same, but the sample value changes, you will get a duplicate timestamp error.
The error messages in this case will look similar to the ones for duplicate targets, as they both originate in the scrape layer. However, the simple target information from the error logs may not be enough anymore to find the specific problematic metric within the broken target. Luckily, setting the —log.level=debug flag on the Prometheus server increases logging verbosity such that you can see each series (in the series log message field) that is causing trouble.
For duplicate timestamps, that will look like this:
And for out-of-order timestamps, like this:
In this case, you will have to fix the metrics exposition in the broken target to resolve the problem.
Duplicate series from rules
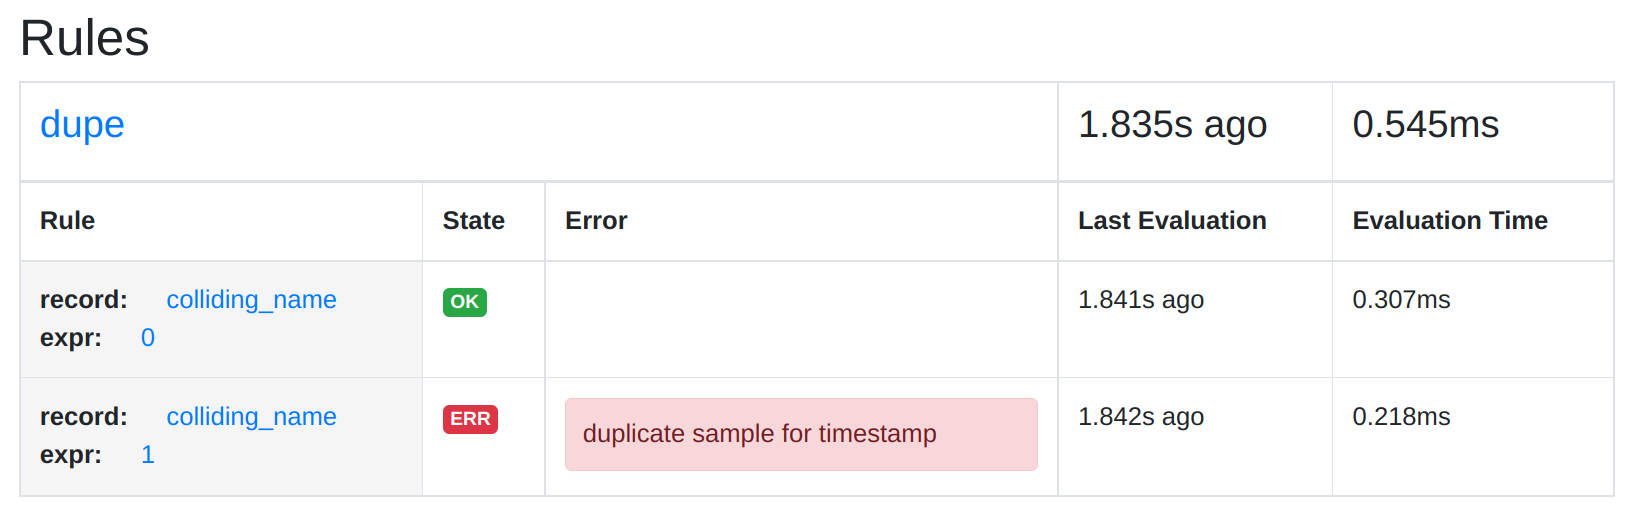
It is also possible to create colliding series between the outputs of multiple recording rules. Take this rule file example, which records the metric colliding_name from two rules in the same rule group, but with different sample values:
Although the evaluation of multiple rules from the same group happens sequentially, Prometheus will run them all with the same query evaluation timestamp. This causes the rule evaluation to fail with a «duplicate sample for timestamp» error:
This error also helpfully logs the rule group, the recorded metric name, as well as the offending label set of the sample. That way, you should be able to fix the problem in your rule files.
As a variation, it is also possible for such a collision to happen between series produced from a recording rule and a target scrape.
Remote write sending bad data
If you are using the Prometheus server’s own remote write receiver to push samples to Prometheus, you can also run into situations where one or multiple push sources can send conflicting metrics and timestamps. In that case, you may get an «Out of order sample from remote write» or «duplicate sample for timestamp» request error on the sending side:
And in the receiving Prometheus server, you will get a similar error message (once a fix for a bug that we discovered in the course of writing this article has been fixed):
This latter message tells you the exact offending series, so you can hopefully track down and fix its source.
Intentional ingestion of out-of-order data
Now, there are a few valid use cases when you might actually want to ingest out-of-order data or even data that is normally too old to be ingested into the TSDB at all. You may have some data sources that cannot produce metrics on an ongoing live basis, but only deliver batched or otherwise delayed results. For these cases, as mentioned above, you will want to turn on Prometheus’ new experimental out_of_order_time_window TSDB configuration setting that allows ingesting out-of-order samples within a limited time period to get rid of these error messages.
Caution: Not all collisions cause errors!
As we just learned above, there are multiple series collision conditions that Prometheus can notice and tell us about. But in some cases, Prometheus silently ignores series collisions or can’t detect them at all. So not seeing an error is not a guarantee that everything is working right.
Silent failure of collisions caused by metric relabeling
One such case is when accidentally using metric relabeling (which is applied to each pulled series during a scrape) to remove important disambiguating labels of series from a single target. For example, the following configuration removes the quantile label from all pulled metrics, but in the go_gc_duration_seconds metric, this label is required to tell 3 different series apart:
The current behavior of Prometheus is to store the first of the conflicting samples, but silently discard the subsequent ones without any warning. We filed an issue about possibly reviewing and/or fixing that behavior.
Two rules or targets writing into the same series without timing conflicts
It can easily happen that Prometheus either scrapes two duplicate targets or ingests samples from two rules writing to the same series, but the samples always arrive in perfect lockstep without creating an out-of-order condition or a duplicate timestamp. In that case, the samples from the two sources will be written to the same time series, with the same value altering back and forth between both input series.
For example, if you created a rule file like this, recording the metric colliding_name both with a sample value of 0 and 1 :
. then you will likely not see any logged errors (unless the two rule groups happen to run at the exact same duplicate timestamp). However, you will see the sample value of the series alternating between 0 and 1 :
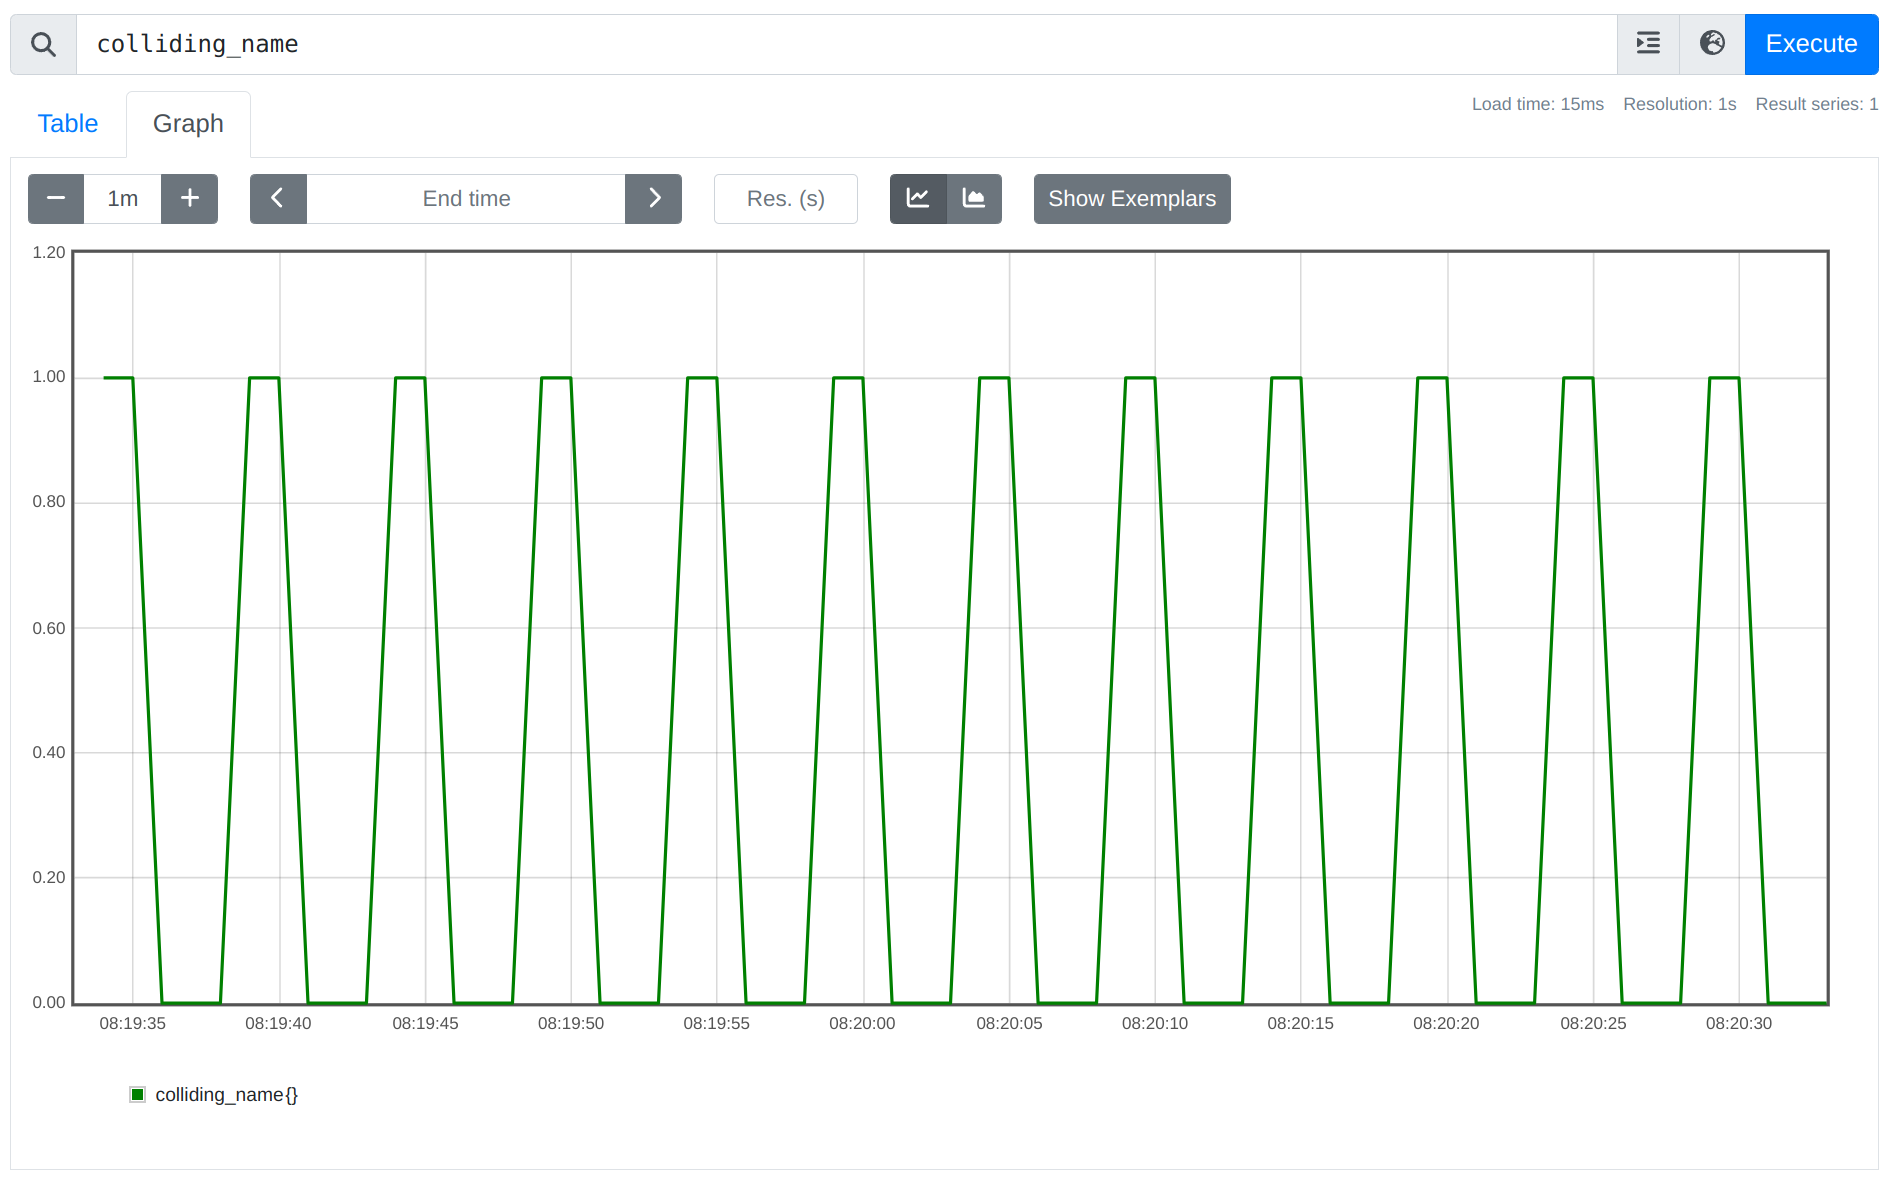
There’s usually no valid use case for this kind of behavior, but it’s currently not possible for Prometheus to detect this case automatically.
Detecting these issues using metrics
Besides reading logged error messages, you can also detect out of order and duplicate timestamps by monitoring the following metrics that Prometheus exposes about itself:
- prometheus_tsdb_out_of_order_samples_total : The total number of out of order samples ingestion failed attempts due to out-of-order support being disabled.
- prometheus_target_scrapes_sample_duplicate_timestamp_total : The total number scraped samples with duplicate timestamps.
- prometheus_target_scrapes_sample_out_of_order_total : The total number of scraped out-of-order samples.
- prometheus_http_requests_total : The total number of 400 status code requests received by the remote write receiver (in the receiving Prometheus server). This can include errors that result in a 400 as well.
- prometheus_remote_storage_samples_failed_total : The total number of samples that failed to be sent over remote write in the sending Prometheus server. This can also include other errors.
Series collision errors from rule evaluations unfortunately do not show up in a metric yet. There is a prometheus_rule_evaluation_failures_total metric, but that only counts total failures of a rule’s evaluation, not individual series that have been discarded during the evaluation. However, a rule with problematic output series will still be marked as unhealthy, and the /rules page will show you the corresponding error:
 .
.
Other storage errors
Besides out-of-order and duplicate sample timestamps, the Prometheus TSDB can also respond with a set of other errors when trying to append samples or even exemplar data. You can see all possible errors in the Prometheus storage code.
Hopefully these explanations were useful for understanding the background behind these out-of-order and duplicate sample ingestion errors and can be helpful in finding and fixing them the next time they occur in your Prometheus setup.
If you would like to learn Prometheus in a structured way and from the ground up, please also be sure to check out our self-paced training courses that cover the basics of Prometheus, as well as advanced use cases and integrations.
Источник
Table of Contents
Troubleshooting; Common cases #
Overlaps #
Block overlap: Set of blocks with exactly the same external labels in meta.json and for the same time or overlapping time period.
Thanos is designed to never end up with overlapped blocks. This means that (uncontrolled) block overlap should never happen in a healthy and well configured Thanos system. That’s why there is no automatic repair for this. Since it’s an unexpected incident:
- All reader components like Store Gateway will handle this gracefully (overlapped samples will be deduplicated).
- Thanos compactor will stop all activities and HALT or crash (with metric and will error log). This is because it cannot perform compactions and downsampling. In the overlap situation, we know something unexpected happened (e.g manual block upload, some malformed data etc), so it’s safer to stop or crash loop (it’s configurable).
Let’s take an example:
msg="critical error detected; halting" err="compaction failed: compaction: pre compaction overlap check: overlaps found while gathering blocks. [mint: 1555128000000, maxt: 1555135200000, range: 2h0m0s, blocks: 2]: <ulid: 01D94ZRM050JQK6NDYNVBNR6WQ, mint: 1555128000000, maxt: 1555135200000, range: 2h0m0s>, <ulid: 01D8AQXTF2X914S419TYTD4P5B, mint: 1555128000000, maxt: 1555135200000, range: 2h0m0s>
In this halted example, we can read that compactor detected 2 overlapped blocks. What’s interesting is that those two blocks look like they are “similar”. They are exactly for the same period of time. This might mean that potential reasons are:
- Duplicated upload with different ULID (non-persistent storage for Prometheus can cause this)
- 2 Prometheus instances are misconfigured and they are uploading the data with exactly the same external labels. This is wrong, they should be unique.
Checking producers log for such ULID, and checking meta.json (e.g if sample stats are the same or not) helps. Checksum the index and chunks files as well to reveal if data is exactly the same, thus ok to be removed manually. You may find scripts/thanos-block.jq script useful when inspecting meta.json files, as it translates timestamps to human-readable form.
Reasons #
- You are running Thanos (sidecar, ruler or receive) older than 0.13.0. During transient upload errors there is a possibility to have overlaps caused by the compactor not being aware of all blocks See: this
- Misconfiguraiton of sidecar/ruler: Same external labels or no external labels across many block producers.
- Running multiple compactors for single block “stream”, even for short duration.
- Manually uploading blocks to the bucket.
- Eventually consistent block storage until we fully implement RW for bucket
Solutions #
- Upgrade sidecar, ruler and receive to 0.13.0+
- Compactor can be blocked for some time, but if it is urgent. Mitigate by removing overlap or better: Backing up somewhere else (you can rename block ULID to non-ulid).
- Who uploaded the block? Search for logs with this ULID across all sidecars/rulers. Check access logs to object storage. Check debug/metas or meta.json of problematic block to see how blocks looks like and what is the
source. - Determine what you misconfigured.
- If all looks sane and you double-checked everything: Then post an issue on Github, Bugs can happen but we heavily test against such problems.
Sidecar #
Connection Refused #
Description #
level=warn ts=2020-04-18T03:07:00.512902927Z caller=intrumentation.go:54 msg="changing probe status" status=not-ready reason="request flags against http://localhost:9090/api/v1/status/config: Get "http://localhost:9090/api/v1/status/config": dial tcp 127.0.0.1:9090: connect: connection refused"
- This issue might happen when thanos is not configured properly.
Possible Solution #
- Make sure that prometheus is running while thanos is started. The
connection_refusedstates that there is no server running in thelocalhost:9090, which is the address for prometheus in this case.
Thanos not identifying Prometheus #
Description #
level=info ts=2020-04-18T03:16:32.158536285Z caller=grpc.go:137 service=gRPC/server component=sidecar msg="internal server shutdown" err="no external labels configured on Prometheus server, uniquely identifying external labels must be configured"
- This issue happens when thanos doesn’t recognise prometheus
Possible Solution #
- Thanos requires unique
external_labelsfor further processing. So make sure that theexternal_labelsare not empty and globally unique in the prometheus config file. A possible example —
global:
  external_labels:
    cluster: eu1
    replica: 0
Receiver #
Out-of-bound Error #
Description #
Thanos Receiver Log #
level=warn ts=2021-05-01T04:57:12.249429787Z caller=writer.go:100 component=receive component=receive-writer msg="Error on ingesting samples that are too old or are too far into the future" num_droppped=47
Root Cause #
- “Out-of-bound” error occurs when the timestamp of the to-be-written sample is lower than the minimum acceptable timestamp of the TSDB head.
Possible Cause #
- Thanos Receiver was stopped previously and is just resumed, remote Prometheus starts to write from the oldest sample, which is too old to be digested and hence rejected.
- Thanos Receiver does not have enough compute resources to ingest the remote write data (is too slow). The latest ingested sample is gradually falling behind the latest scraped samples.
Diagnostic and Possible Solution #
- Check the pod history of Thanos Receiver to see if it is case #1.
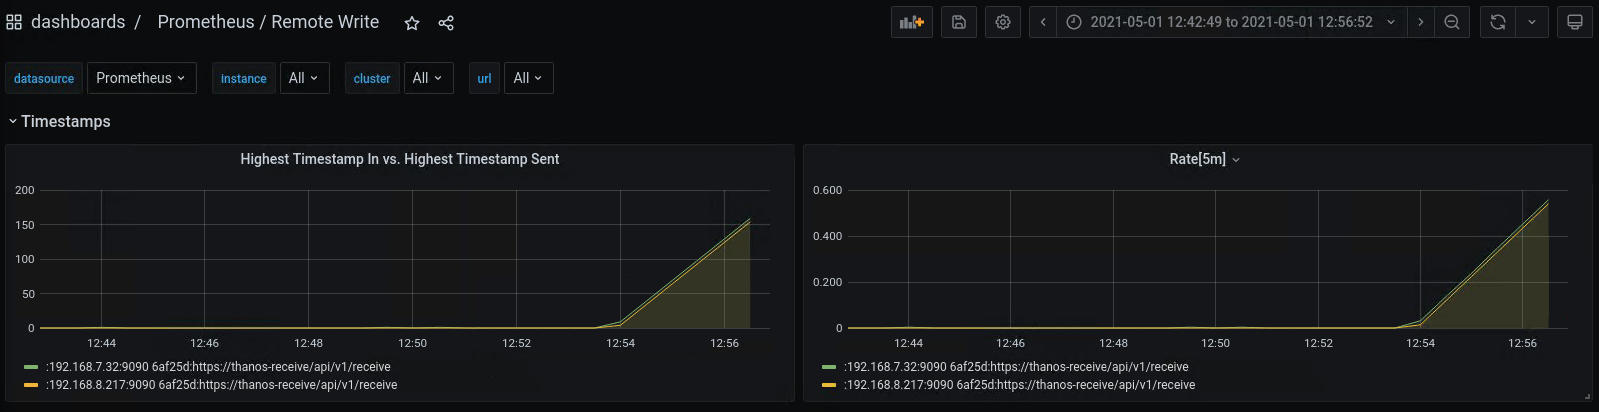
- For case #2, if you installed Prometheus using the kube-prometheus-stack helm chart from the Prometheus Community, you can check the “Prometheus / Remote Write dashboard”. If the Rate[5m] is above 0 for a long period, it is case #2 and you should consider adding replica count or resources to Thanos Receiver.
Out-of-order Samples Error #
Description #
Thanos Receiver Log #
level=warn ts=2021-05-01T05:02:23.596022921Z caller=writer.go:92 component=receive component=receive-writer msg="Error on ingesting out-of-order samples" num_dropped=14
Root Cause #
- TSDB expects to write samples in chronological order for each series.
- A sample with timestamp t1 is sent to the Thanos Receiver and accepted, any sample with timestamp t < t1 and identical label set being sent to the receiver after this will be determined as out-of-order sample.
Possible Cause #
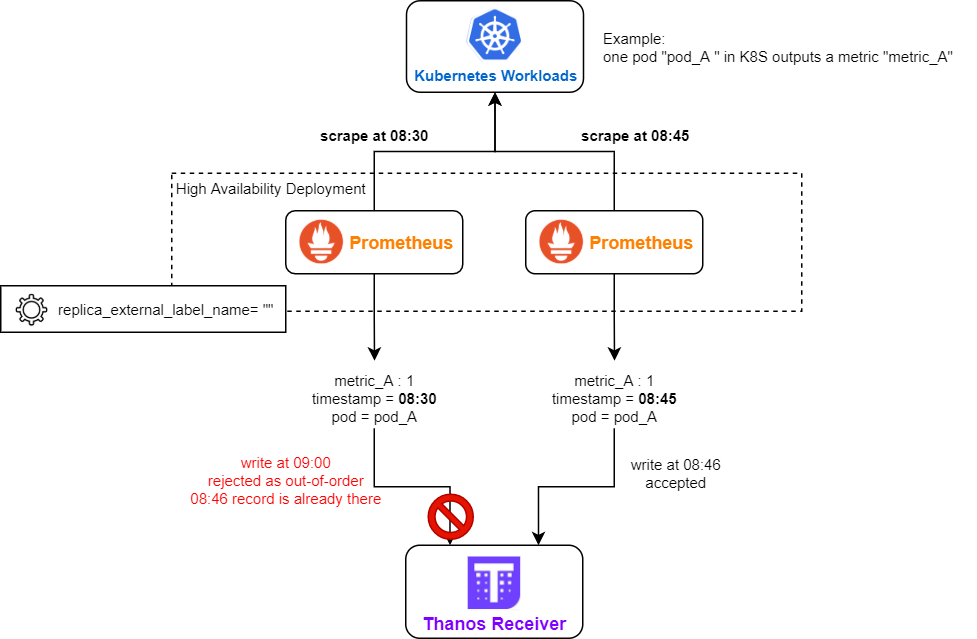
- Remote Prometheus is running in high availability mode (more than 1 replica are running). But the replica_external_label_name is not correctly configured (e.g. empty).
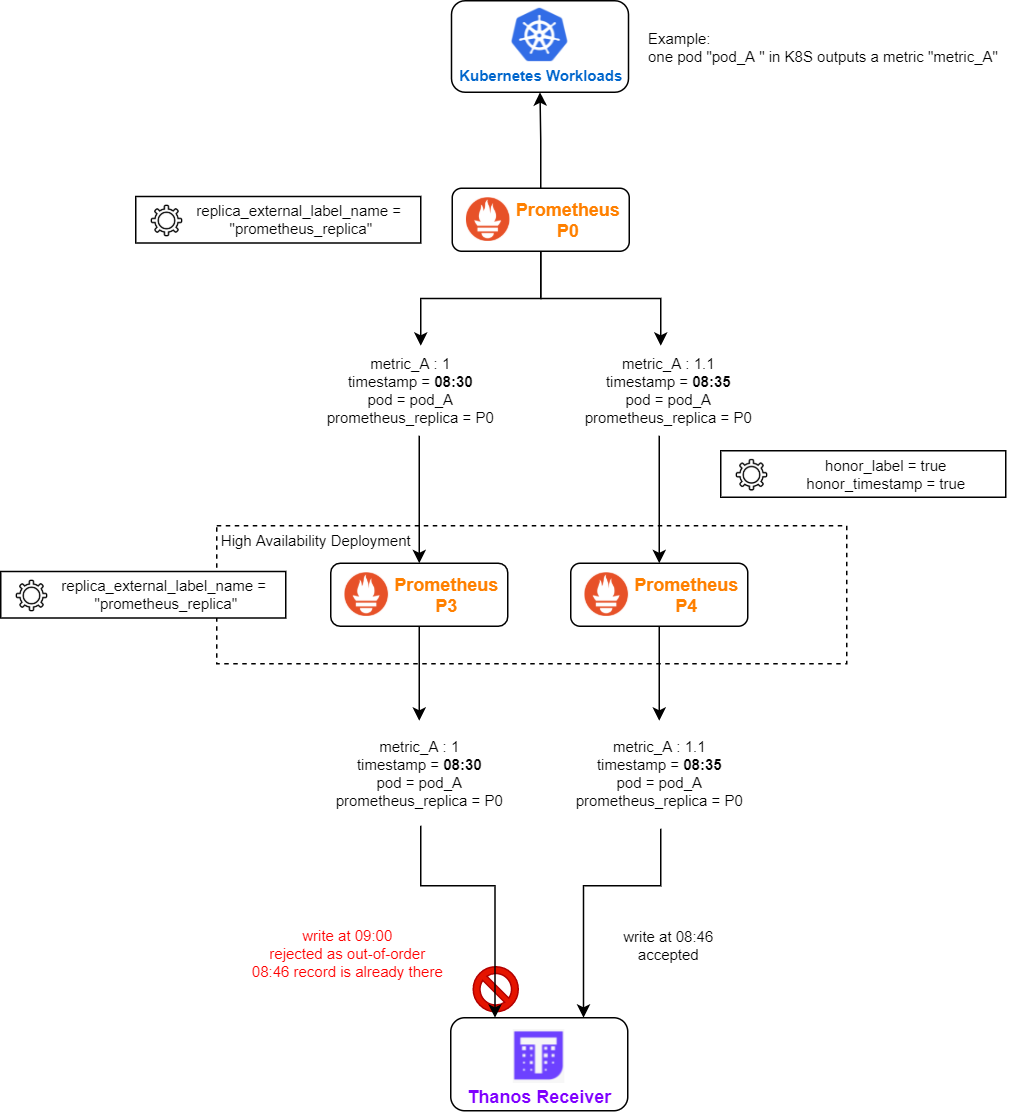
- Remote Prometheus is running in a federation
- the remote-writing Prometheus is running in HA
- federation has both honor_label = true and honor_timestamp = true
- all layers of Prometheus is using the same replica_external_label_name (e.g. the default “prometheus_replica”)
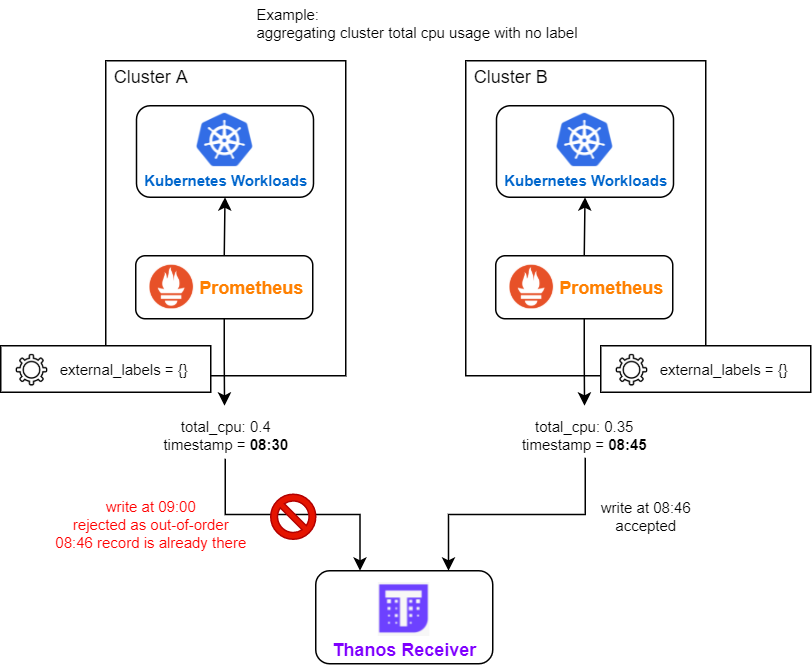
- There are multiple deployments of remote Prometheus, their external_labels are identical (e.g. all being empty), and they have metrics with no unique label (e.g. aggregated cluster CPU usage).
Diagnostic #
- Enable debug log on Thanos Receiver (you may need to update cli parameter or helm chart values, depending on how you deployed Thanos Receiver). You can inspect the label set of the out-of-order sample in the debug log of Thanos Receiver, it may provide you some insight.
- Inspect the topology and configuration of your Prometheus deployment, see if they match the above possible causes.
Possible Solution #
- Configure distinct sets of external_labels for each remote Prometheus deployments.
- Use different replica_external_label_name for each layer of Prometheus federation (e.g. layer 1: lesser_prometheus_replica, layer 2: main_prometheus_replica).
- Use static endpoint based federation in Prometheus if the lesser Prometheus is in HA (service monitor based federation will pull metrics from all lesser Prometheus instances).
Found a typo, inconsistency or missing information in our docs? Help us to improve Thanos documentation by proposing a fix on GitHub here ❤️
Hello,
I recently updated our prometheus setup from using the helm chart to using the prometheus-operator.
Summary of current setup:
Platform: Google Cloud
1. Google Project used for monitoring:
Prometheus Operator (prometheus,alertmanager,grafana, node-exporter, kube-state-metrics…ect.)
2. Then multiple other Google Projects that now run the Prometheus-Operator (node-exporter, kube-state-metrics…ect) but without Alertmanager/Grafana.
So the main google project (#1 above) has federate scrapes/jobs that connect to each of the other google projects prometheus (#2 above).
Since updating to the prometheus-operators I’m now running into these errors coming from the main prometheus logs:
msg=»Error on ingesting samples with different value but same timestamp»
and msg=»Error on ingesting out-of-order samples».
Below is an example of one of the federate jobs where the errors are coming from.
When I have the job «vms» and job «node-exporter» both enabled the errors occur. If I disable either of those jobs I no longer see the errors.
— job_name: ‘test-abc-123’
scrape_interval: 60s
scrape_timeout: 30s
honor_labels: true
metrics_path: ‘/federate’
scheme: ‘https’
basic_auth:
username: ‘###################’
password: ‘###################’
params:
‘match[]’:
— ‘{job=»vms»} ‘
— ‘{job=»node-exporter»} ‘
— ‘{job=»postgres»} ‘
— ‘{job=»barman»} ‘
— ‘{job=»apiserver»} ‘
— ‘{job=»kube-state-metrics»} ‘
static_configs:
— targets:
labels:
project: ‘test-abc-123’
Here is the node-exporter serviceMonitor from project test-abc-123:
kind: ServiceMonitor
metadata:
labels:
name: node-exporter
namespace: monitoring
spec:
endpoints:
interval: 15s
port: https
relabelings:
— action: replace
regex: (.*)
replacement: $1
sourceLabels:
— __meta_kubernetes_pod_node_name
targetLabel: instance
scheme: https
tlsConfig:
insecureSkipVerify: true
selector:
matchLabels:
Here is the «vms» job from project test-abc-123:
— job_name: ‘vms’
static_configs:
— targets: [‘db-prod-1:9100′,’db-prod-2:9100′,’util-1:9100’]
labels:
project: ‘client-vms’
I have tried updating labels but maybe not in the right way. Any suggestions or pointers would be appreciated.
Thank you
Recommend Projects
-

React
A declarative, efficient, and flexible JavaScript library for building user interfaces.
-
Vue.js
🖖 Vue.js is a progressive, incrementally-adoptable JavaScript framework for building UI on the web.
-
Typescript
TypeScript is a superset of JavaScript that compiles to clean JavaScript output.
-
TensorFlow
An Open Source Machine Learning Framework for Everyone
-
Django
The Web framework for perfectionists with deadlines.
-
Laravel
A PHP framework for web artisans
-
D3
Bring data to life with SVG, Canvas and HTML. 📊📈🎉
Recommend Topics
-
javascript
JavaScript (JS) is a lightweight interpreted programming language with first-class functions.
-
web
Some thing interesting about web. New door for the world.
-
server
A server is a program made to process requests and deliver data to clients.
-
Machine learning
Machine learning is a way of modeling and interpreting data that allows a piece of software to respond intelligently.
-
Visualization
Some thing interesting about visualization, use data art
-
Game
Some thing interesting about game, make everyone happy.
Recommend Org
-
Facebook
We are working to build community through open source technology. NB: members must have two-factor auth.
-
Microsoft
Open source projects and samples from Microsoft.
-
Google
Google ❤️ Open Source for everyone.
-
Alibaba
Alibaba Open Source for everyone
-
D3
Data-Driven Documents codes.
-
Tencent
China tencent open source team.

Привет! Меня зовут Григорий, я техлид в Cloud Infrastructure Team в Сравни. Моя команда отвечает за observability системы и облачную инфраструктуру. Не так давно мы полностью обновили наш стек мониторинга. Хочу рассказать, как у нас организовано хранение long-term метрик без использования Object Storage.
Мы в Сравни долгое время использовали связку Prometheus + Thanos для мониторинга и хранения данных. Для Thanos мы использовали схему с sidecar’ом. Эта схема работала довольно неплохо, но с ростом проекта — росло и потребление ресурсов. Со временем задачи по scrape samples уже потребляли значительные ресурсы. Когда только на Prometheus стало уходить больше 30 ядер vCPU и 100 гигабайт RAM, мы начали искать способы оптимизации потребления ресурсов.
Первым делом определили требования, которые необходимы для системы мониторинга:
-
должно поддерживаться развертывание в Kubernetes;
-
система должна быть способна переезжать из одного Kubernetes-кластера в другой без потери данных;
-
нужна поддержка downsampling;
-
возможность построить high availability систему;
-
в идеале, чтобы система требовала очень мало внимания на обслуживание


Мы поизучали варианты, и сперва показалось, что будет хорошей идеей взять стек VMAgent + Thanos receiver. Как несложно угадать из названия статьи, этого у нас не получилось. Недавно я увидел в одном профессиональном чате, что коллеги захотели использовать такой же стек и по тем же причинам, что и мы. Поэтому решил поделиться нашим опытом и рассказать, к чему мы в итоге пришли.
Причины выбора VMAgent + Thanos receiver
Начнем с агента, осуществляющего сбор samples. В Prometheus для каждого remote write создается in-memory очередь, в которую записываются samples из журнала (WAL). Данные в очереди хранятся в течение двух часов, и это поведение не изменить. Но есть issue на изменение такого поведения.
Забегая вперед, при выборе данного стека, каким-то образом мы упустили один, казалось бы, очевидный момент в схеме с Thanos Receiver. То есть по факту мы бы просто перешли бы из pull на push модель (о плюсах и минусах можно посмотреть здесь), получили возможность поддержки мультитенантности с global view, а также исключили ситуацию, когда sidecar может перестать заливать time series в object storage. И вряд ли бы получили бы экономию в ресурсах (как записывали изначально в своих целях).
Когда поняли это, мы приняли решение всё же продолжить тестирование данной схемы, но уже параллельно продумывая другое решение.
VMAgent умеет кешировать samples на диск в случае проблем в сети или с удаленным стораджем, и потом отправлять их, как только связь с удаленным стораджем восстановится — это очень удобно. Размер буфера ограничивается размером диска. Также есть опция -memory.allowedPercent – позволяет регулировать допустимый процент системной памяти, которую могут занимать кэши метрик (по умолчанию 60% от доступной памяти). И да, VictoriaMetrics умеет в автоматическое определение лимитов памяти и процессора под управлением cgroupv2.
Протестировав Prometheus и VMAgent на одинаковых количествах samples, мы увидели, что VMAgent потребляет меньше ресурсов, чем Prometheus (к сожалению, результаты тестов не дожили до написания данной статьи).
В связи с вышесказанным, для наших задач VMAgent подходил больше, поэтому мы остановились на нем, как на агенте, осуществляющем сбор samples и сохраняющем их в удаленный сторадж.
Thanos же выбрали по следующим причинам:
-
Community edition версия поддерживает downsampling (VMStorage поддерживает только в Enterprise-версии);
-
есть поддержка работы с Object Storage (изначально нам казалось, что это единственный способ не терять данные без downtime при переезде стораджа между кластерами).
Начало тестирования
Начали мы, конечно же, с поиска issue и чтения документации. Вооружившись этими сакральными знаниями и с помощью helm chart’ов, все необходимые компоненты развернули в Kubernetes, и схема довольно быстро заработала (подозрительно!).
Схема работы c Thanos Receiver мало чем отличается от Thanos с sidecar. Если вам интересно более подробно разобраться в компонентах Thanos и VictoriaMetrics, рекомендую прочитать две статьи Александра Валялкина — на хабре, и на medium. Я кратко пройдусь по компонентам, останавливаясь на тех частях, которых нет в статьях Александра.
VMAgent собирает samples из таргетов по pull-модели. После этого VMAgent отправляет samples в Thanos Receiver (на самом деле, отправляет на L7 балансировщик нагрузки, а тот – уже по round robin на Thanos Receiver). Thanos Receiver может состоять из одной или нескольких реплик (далее буду называть их эндпоинтами). Для балансировки нагрузки, репликации данных и service discovery используется файл hashring configuration. Выглядит он так – внутри перечислены эндпоинты, tenant ID и порты.
Thanos Receiver бывает soft tenancy и hard tenancy.
-
Soft tenancy – запросы, tenant ID которых явно не совпадает ни с одним другим эндпоинтом в конфигурационном файле, автоматически попадают в это хэш-кольцо soft tenancy; то есть по факту это тенант по умолчанию, если не найдется нужный эндпоинт. К слову, id данного тенанта задается через переменную receive.default-tenant-id. А еще данный тенант может выступать как балансировщик (в документации значится как Load distribution) к hard tenancy.
-
Hard tenancy – если просто, это те эндпоинты, у которых установлен tenant ID в каждом HTTP-запросе. Данный механизм нужен для мультитенантной архитектуры Thanos. В нашем случае не было таких задач, и мы везде использовали Soft tenancy Thanos Receiver.
На тестовым стенде Thanos Receiver состоял из четырех реплик (по две реплики в каждой из зон доступности) и хранил данные в течении трёх дней (-tsdbRetention=3d). Почему решили хранить данные на Thanos Receiver три дня? Наш анализ показал, что чаще всего используются метрики в течении трех дней (скажем так, горячие метрики) и чтобы ускорить их выдачу пользователям, было принято решение оставить метрики до трех дней на SSD-дисках.
Thanos Receiver, получив samples от VMAgent, отправляет данные time series на другие эндпоинты, которые указаны в hashring configuration файле. Если какой-либо time series в запросе на запись на эндпоинт Thanos Receiver не был успешно записан по крайней мере на (ReplicationFactor / 2) + 1, то Thanos Receiver отвечает ошибкой к VMAgent. Например, при replication-factor=3 Thanos Receiver убедится, что каждый time series успешно записан по крайней мере на двух Thanos receivers в эндпоинтах hashring файла ( 3/2 + 1 = 2,5 = 2).
Еще одно отличие от схемы с sidecar – в том, что Thanos Query делает запросы вместо sidecar в receiver (помимо Store Gateway), и агенту (Prometheus или VMAgent) необходимо отправить данные в Thanos Receiver (в схеме с sidecar, сам Thanos Sidecar сохранял данные в Object Storage).
Но есть нюанс…
В целом, вышеописанная схема сработала для нас. Но дьявол кроется в мелочах, и для нас они стали критичными.
Нюансы номер раз и два
Проблемы начались при удалении пода одного из эндпоинтов Thanos Receiver — тестировали случаи, когда под с Thanos Receiver находился на ноде, в которой произошел сбой. Например, инженер ошибся и удалил ноду из кластера, сработал дешедуллер, и нода удалилась, или по каким-то причинам нода с подом Thanos Receiver упала.
Мы стали периодически получать 409 ошибки в VMAgent, а в логах Thanos Receiver увидели: hashring has changed; server is not ready to receive web requests.
Затем мы решили проверить случай отказа кластера или большей его части – отключили три ноды, на которых были поды с Thanos Receiver и логи перестали писаться. Тут все логично.
Вернули все три ноды в работу, но логи не появились в VMAgent, и были видны 409 ошибки. В логах: Error on ingesting samples that are too old or are too far into the future. В документации есть описание данной проблемы и ее причины, но нет решения.
Обе проблемы помог решить thanos-receive-controller, который отслеживает количество running подов с лейблом controller.receive.thanos.io=thanos-receive-controller (можно поставить и свой, разумеется) и обновляет configMap c hashring configuration файлом, и с задержкой (по нашим тестам, примерно через 120 секунд) обновляется в контейнере. После этого Thanos Receiver перечитывает конфиг. Важно — не монтировать configMap как subPath, иначе не обновится файл в контейнере; подробнее о нюансах configMap можно почитать в блоге Фланта.
Учтите, что у данного подхода с контроллером есть и минусы.
Нюанс номер три
Отключили все ноды с подами Thanos Receiver больше, чем на 2 часа; помним, что Thanos Receiver – это реализация над Prometheus Remote Write API, со всеми вытекающими. Получили проблему с тем, что Thanos Receiver отбрасывает логи.
У этой проблемы пока что нет решения; это нужно учитывать при эксплуатации.
Нюанс номер четыре
Решили добавить реплик VMAgent (мы же все за высокую доступность всех компонентов, да ведь?).
Но для дедупликации Thanos Querier использует query.replica-label. И есть требование, чтобы для каждого агента должен отличаться extrnal_labels. Значит, на каждой реплике VMAgent он должен отличаться.
Решение нашлось довольно быстро: в конфиге VMAgent проставляем переменную окружения POD_NAME:
external_labels:
  replica: %{POD_NAME}
И в statefulSet VMagent пробросить имя пода в переменную окружения:
- name: POD_NAME
  valueFrom:
    fieldRef:
      fieldPath: metadata.name
Все заработало.
Нюанс номер пять
Для двух реплик VMAgent и сбоев в сети была ещё одна проблема – уезжали метрики. Иногда на час, иногда на два часа — с дельтой во времени.
Мы так и не смогли понять причину этого явления. Но при использовании одной реплики VMAgent такой проблемы не наблюдалось.
Если вы знаете возможную причину такого поведения, буду рад прочитать об этом в комментариях).
Суммируем нюансы
На основании результатов тестирования мы приняли решение не тащить связку VMAgent + Thanos receiver в прод.
Вышеописанные нюансы в Thanos проявляются из-за того, что данный вид стораджа не поддерживает backfilling – вставку данных, соответствующих временной метке в прошлом. Тут есть некоторые вещи, которые можно сделать, начиная с версии Prometheus v2.24.0. Если интересны объяснения на примерах, как это работает, можно посмотреть тут и тут.
А что с VictoriaMetrics stack?
Как я говорил выше, параллельно с тестированием Thanos Receiver, мы начали изучать другие варианты и решили сконцентрироваться на VictoriaMetrics.
Одной из фич VictoriaMetrics является поддержка Backfilling из коробки. Поэтому проблемы с out-of-order samples при использовании стека VictoriaMetrics нам не страшны. Это же позволяет использовать параллельные очереди для каждого remote write стораджа, если одной очереди недостаточно для отправки большого объема собранных данных в удаленное хранилище. При этом в Thanos мы всегда должны использовать только одну очередь, иначе получим out-of-order samples.
За время тестирования мы выяснили, что VictoriaMetrics больше подходит под наши задачи. Поэтому нам осталось только решить, как перенести данные из одного кластера k8s в другой.
Первый и очевидный вариант — использовать vmbackup. Но это подразумевает временный простой, когда будут переноситься данные из одного кластера в другой. А нам нужна была возможность переноса VMStorage между кластерами по очереди и с последующим переключением stateless-сущностей (vmagent, vmselect, vminsert).
Мы используем managed kubernetes в облаках, поэтому нам нужно было, чтобы решение поддерживалось обоими нашими облачными провайдерами (у нас это Яндекс.Облако и Azure). Изучив документацию наших облачных провайдеров, обнаружили, что оба вендора поддерживают возможность добавления static PersistentVolume (подробнее – для Azure тут, для ЯО тут). В итоге мы пришли к следующей архитектуре:
-
через terraform создаем диски в облаке;
-
создаем объект PersistentVolume в Kubernetes под каждый созданный диск.
Так как StatefulSet при создании пода имеет уникальный упорядоченный идентификатор, то при использовании volumeClaimTemplates мы можем описать, какое имя нашего тома будет использоваться с указанием claimName (оно тоже упорядоченное, и будет использоваться тот же идентификатор что в поде), и таким образом, не будет запускаться провижинер для создания новых томов PersistentVolume.
В этой схеме правильное наименование claimRef очень важно. Ниже — немного упрощенный конфиг, для понимания. В примере созданы две PersistentVolume с отличающимися claimRef и volumeHandle (индентификатор нашего диска) и один kind StatefulSet c volumeClaimTemplates.
---
apiVersion: v1
kind: PersistentVolume
metadata:
 name: prod-yc-vm-storage-0
spec:
 capacity:
   storage: 100Gi
 accessModes:
   - ReadWriteOnce
 persistentVolumeReclaimPolicy: Retain
 storageClassName: yc-network-ssd
 csi:
   driver: disk-csi-driver.mks.ycloud.io
   fsType: ext4
   # See it in terraform.
   volumeHandle: qwerty0
 claimRef:
   namespace: monitoring-system
   name: pvc-vm-vmstorage-0
---
apiVersion: v1
kind: PersistentVolume
metadata:
 name: prod-yc-vm-storage-1
spec:
 capacity:
   storage: 100Gi
 accessModes:
   - ReadWriteOnce
 persistentVolumeReclaimPolicy: Retain
 storageClassName: yc-network-ssd
 csi:
   driver: disk-csi-driver.mks.ycloud.io
   fsType: ext4
   # See it in terraform.
   volumeHandle: qwerty1
 claimRef:
   namespace: monitoring-system
   name: pvc-vm-vmstorage-1
---
apiVersion: apps/v1
kind: StatefulSet
metadata:
 name: vmstorage
 namespace: monitoring-system
spec:
 selector:
   matchLabels:
     app: vmstorage
 serviceName: "vmstorage"
 replicas: 2
 podManagementPolicy: OrderedReady
 template:
   metadata:
     labels:
       app: vmstorage
       app.kubernetes.io/name: vmstorage
       app.kubernetes.io/instance: vmstorage-b
       app.kubernetes.io/version: "v1.74.0"
   spec:
     containers:
     - name: vmstorage
       image: "victoriametrics/vmstorage:v1.74.0-cluster"
       volumeMounts:
       - name: pvc-vm
         mountPath: /storage
 volumeClaimTemplates:
 - metadata:
     name: pvc-vm
   spec:
     accessModes: [ "ReadWriteOnce" ]
     resources:
       requests:
         storage: 100Gi
     storageClassName: yc-network-ssd
Теперь мы можем переносить VMStorage из одного кластера Kubernetes в другой, поочередно уменьшая реплики StatefulSet в одном кластере с удалением PersistentVolume и добавляя PersistentVolume с увеличением реплик в другом, сопровождая это изменением конфигурации в VMSelect и VMInsert.
В этой схеме есть два нюанса:
-
Автоматизацию этого переключения мы пока не сделали, отложив эту задачу в бэклог — до времени, когда такая ситуация понадобится. Данное решение — скорее задел на будущее.
-
Чтобы схема заработала, необходимо между кластерами обеспечить pod-to-pod связанность без NAT (в наших облаках такая возможность есть), либо при переезде на каждый под прокинуть по сетевому балансировщику, создавая таким образом сетевую доступность между VMSelect/VMInsert и VMStorage в разных кластерах.
Взяв за основу статью Resizing StatefulSet Persistent Volumes with zero downtime, мы отработали схему с задачей по увеличению размера диска для VMStorage.
Ниже – упрощенный процесс без использования terraform в Яндекс Облаке:
-
удаляем kind StatefulSet VMStorage оставляя “сиротские” поды без управления контроллера StatefulSet.
k delete sts --cascade=orphan vmstorage
-
удаляем pod с самым высоким id (в нашем пример два пода, у одного имя vmstorage-0, у второго vmstorage-1). Удалять под приходится из-за того, что наше облако не дает возможность увеличить размер диска, если он примаунчен.
k delete pod vmstorage-1
-
увеличиваем размер диска в облаке до 110G.
yc compute disk update --size 110G --id qwerty1
-
патчим PVC, увеличивая сторадж до 110G.
k patch pvc pvc-vm-vmstorage-1 --patch '{"spec": {"resources": {"requests": {"storage": "110Gi"}}}}'
-
деплоим StatefulSet не изменяя размер storage в storageClassName.
cat <<EOF | kubectl apply -f -
---
apiVersion: apps/v1
kind: StatefulSet
metadata:
 name: vmstorage
 namespace: monitoring-system
spec:
 selector:
   matchLabels:
     app: vmstorage
 serviceName: "vmstorage"
 replicas: 2
 podManagementPolicy: OrderedReady
 template:
   metadata:
     labels:
       app: vmstorage
       app.kubernetes.io/name: vmstorage
       app.kubernetes.io/instance: vmstorage-b
       app.kubernetes.io/version: "v1.74.0"
   spec:
     containers:
     - name: vmstorage
       image: "victoriametrics/vmstorage:v1.74.0-cluster"
       volumeMounts:
       - name: pvc-vm
         mountPath: /storage
 volumeClaimTemplates:
 - metadata:
     name: pvc-vm
   spec:
     accessModes: [ "ReadWriteOnce" ]
     resources:
       requests:
         storage: 100Gi
     storageClassName: yc-network-ssd
EOF
-
повторяем пункты 1-4 д1я vmstorage-1.
-
После чего деплоим манифест с увеличенным storage в storageClassName.
cat <<EOF | kubectl apply -f -
---
apiVersion: apps/v1
kind: StatefulSet
metadata:
 name: vmstorage
 namespace: monitoring-system
spec:
 selector:
   matchLabels:
     app: vmstorage
 serviceName: "vmstorage"
 replicas: 2
 podManagementPolicy: OrderedReady
 template:
   metadata:
     labels:
       app: vmstorage
       app.kubernetes.io/name: vmstorage
       app.kubernetes.io/instance: vmstorage-b
       app.kubernetes.io/version: "v1.74.0"
   spec:
     containers:
     - name: vmstorage
       image: "victoriametrics/vmstorage:v1.74.0-cluster"
       volumeMounts:
       - name: pvc-vm
         mountPath: /storage
 volumeClaimTemplates:
 - metadata:
     name: pvc-vm
   spec:
     accessModes: [ "ReadWriteOnce" ]
     resources:
       requests:
         storage: 110Gi
     storageClassName: yc-network-ssd
EOF
Downsampling?
Как было сказано выше, downsampling в VictoriaMetrics используется в enterprise-версии.
Хотя разработчики оставили хак для этой фичи, мы придумали очередной костыль пошли своим путем: добавили отдельные группы VMAgent со scrape Interval в 5 минут (для графиков до 3х месяцев) и сохраняем в отдельную группу VMStorage c соответствующим dedup.minScrapeInterval (о причинах наличия отдельных VMStorage ниже).
Таким образом, мы делаем некое подобие downsampling. А с учетом того, что VictoriaMetrics довольно хорошо сжимает time series — это позволяет экономить на утилизации места на диске.
Вообще, по поводу downsampling и как оно работает — есть хорошее выступление у команды Thanos.
Нюансы VictoriaMetrics
-
Если в Thanos для дедупликации важно, чтобы у агентов был разный external label, то для VictoriaMetrics он должен быть идентичным.
-
При использовании двух VMAgent, которые скрейпят одни и те же данные, и пишут тот же набор VMStorage (точнее в VMInsert’ы, а те уже в VMStorage), стали замечать, что графики при обновлении странички начинают “скакать”. Это связано это с тем, что два VMAgent’а скрейпят одни и те же samples с дельтой по времени (т.е. не одновременно). Одно из решений — шардирование. Деплоя VMAgent как statefulset и указывания уникальное значение promscrape.cluster.memberNum=%{POD_NAME}. Второе решение — при использовании дедупликации в VMStorage и VMSelect dedup.minScrapeInterval желательно выставлять большее значение чем ScrapeInterval в VMAgent. Так же есть issue при работе VMAgent в разных AZ делающих scrape samples идентичных эндпоинтов (это кстати, наш случай). Данная issue решается с выставлением уникального значения promscrape.cluster.name с версии v1.78.0.
Более подробно про дедупликацию описано в документации.
-
Репликация:
-
В отличии от Thanos Receiver, VMStorage не находятся в одном кластере, и вообще ничего не знаю друг о друге. Репликация time series происходит на стороне VMInsert, который и сохраняет эти данные в VMStorage. Вычисляется репликация по формуле 2N-1, где N – это replicationFactor. То есть репликация на несколько хостов будет происходить, если replicationFactor будет больше единицы. Например: replicationFactor=1 (2*1-1=1) – сохраняем данные на один VMStorage, replicationFactor=2 (2*2-1=3) – сохраняем данные на три VMStorage.
-
VMInsert реплицирует данные синхронно на VMStorage (ожидает, пока данные запишутся во все VMStorage). Так что если не наберется необходимое количества нод на запись, запись не будет совершена.
-
VMSelect отправляет запросы на все VMStorage, которые указаны в параметре storageNode и ждет ответа от <количество VMStorage> — replicationFactor + 1. Такая настройка позволяет ускорить отдачу ответа, не дожидаясь ответа от VMStorage. Но replicationFactor в VMSelect работает хорошо, когда
все хорошона VMStorage нодах хранятся равное количество копий всех данных выставленных при replicationFactor. Но если, например, вы вывели на обслуживание ноды с VMStorage или добавили новые – вы можете получать пропуски данных на графиках. На это есть issue. Поэтому в таких случаях лучше убрать параметр replicationFactor из VMSelect, чтобы VMSelect дожидался ответа от всех VMStorage нод перед отправкой ответа на запрос. -
Чем больше replicationFactor, тем больше потребуется ресурсов CPU, RAM и места на диске.
-
-
VMInsert и VMStorage сжимают данные перед отправкой их, что естественно, сказывается на утилизации CPU. Если вы сильно ограничены в ресурсах CPU, отключить это поведение можно через аргумент -rpc.disableCompression.
-
Для деплоя в Kubernetes в компании используются как кастомные написанные helm-чарты, так и вендорные, в которых используется kind ServiceMonitor для service discovery в prometheus. VMAgent не умеет работать с данным типом CRD. Мы не стали переписывать наши кастомные чарты (и тем более вендорные), а просто задеплоили VMOpertor который умеет конвертировать CR ServiceMonitor в сущности VictoriaMetrics. Это не отменяет того факта, что CRD ServiceMonitor необходимо задеплоить в Kubernetes, так как данное CRD не идет в поставке с VictoriaMetrics). Данная функциональность облегчает переезд с Prometheus на VictoriaMetrics.
Профит от миграции
Изначально для переезда мы рассматривали стек VMAgent + Thanos Receiver, но он не подошел нам по ряду причин – тех самых нюансов, которые в нашем случае были важны. Критичным оказалось наличие механизма backfilling, который есть из коробки в VictoriaMetrics, куда мы в итоге и мигрировали. VictoriaMetrics подкупила еще более простой архитектурой.
В результате миграции мы снизили затраты на ресурсы по RAM примерно в два раза; по CPU — примерно в полтора раза; на сторадж — примерно в три раза. Это произошло по той причине, что в Object Storage взимается плата не только за хранение данных, но и за количество запросов. В нашем случае, переход на диски привел к экономии ресурсов.
Также бонусом мы получили отдачу метрик быстрее — примерно на секунды 2-3 (проверяли на графиках нашей инфраструктурной команды), в сравнении со схемой с Thanos Sidecar.
На данный момент экономия составила порядка 60 000 рублей в месяц. По времени исследование заняло около двух с половиной недель. Так что примерно через 3-4 месяца данное решение должно окупиться.
Возможно, в вашем случае результаты могут отличаться, потому что количество метрик, частота поиска, задачи, да и инфраструктура от проекта к проекту не идентичны. Надеюсь, наш опыт будет вам полезен.
msg="Error on ingesting out-of-order samples" num_dropped=2
Above warning message in Prometheus log when Host name(use by PMM dashboards) has — or .
Note: Here the HOSTNAME is HOST filed use in PMM dashboards and not the actual server hostname.

Example: if the host is `ps.57` or `ps-57` i see out of order msg in Prometheus log
after that remove these hosts from monitoring and add as `ps57`
you will not see those out of order msg in Prometheus log
Reproduciable Test:
docker create
 -v /opt/prometheus/data
 -v /opt/consul-data
 -v /var/lib/mysql
 -v /var/lib/grafana
 --name pmm-data
 percona/pmm-server:1.17.1 /bin/true
docker run -d
 -p 80:80
 --volumes-from pmm-data
 --name pmm-server
 --restart always
 percona/pmm-server:1.17.1


# pmm-admin add mysql ps.57 --user=msandbox --password=msandbox --socket=/tmp/mysql_sandbox5725.sock
# pmm-admin add mysql mysql-prod01 --user=msandbox --password=msandbox --socket=/tmp/mysql_sandbox5722.sock

# pmm-admin list
pmm-admin 1.17.1

mysql:metrics  ps.57        42004      YES      msandbox:***@unix(/tmp/mysql_sandbox5725.sock)
mysql:metrics  mysql-prod01  42005      YES      msandbox:***@unix(/tmp/mysql_sandbox5722.sock)
Access MySQL Overview dashboard for these hosts. **
Check prometheus.log
e manager" scrape_pool=mysql-lr target=https:Error on ingesting out-of-order samples" num_dropped=2
level=warn ts=2019-06-03T12:30:21.272032597Z caller=scrape.go:942 component="scrape manager" scrape_pool=mysql-lr target=https:level=warn ts=2019-06-03T12:31:21.293849304Z caller=scrape.go:942 component="scrape manager" scrape_pool=mysql-lr target=https:level=warn ts=2019-06-03T12:43:34.539480692Z caller=scrape.go:942 component="scrape manager" scrape_pool=mysql-lr target=https:level=warn ts=2019-06-03T12:52:34.513913737Z caller=scrape.go:942 component="scrape manager" scrape_pool=mysql-lr target=https:
Remove all host from monitoring and add Host as ‘ps57‘
# pmm-admin rm —all
#pmm-admin add mysql ps57 --user=msandbox --password=msandbox --socket=/tmp/mysql_sandbox5725.sock
I do not see msg=»Error on ingesting out-of-order samples» num_dropped=2″ message in prometheus.log when instance name is ‘ps57’