A Java stack trace is displayed when an error or exception occurs. The stack trace, also called a backtrace, consists of a collection of stack records, which store an application’s movement during its execution.
The stack trace includes information about program subroutines and can be used to debug or troubleshoot and is often used to create log files. These exceptions could be custom (defined by the user) or built-in. Examples include RuntimeException,NullPointerException, andArrayIndexOutofBoundsException.
Now that you know what a stack trace is, let’s take a look at some examples, how to analyze stack traces, and how you can avoid a stack trace altogether with error handling.
Examples of Java Stack Traces
Example 1 — Temperature Conversion from Celsius to Fahrenheit
Let’s look at an example of converting temperatures from Celsius to Fahrenheit. Only an integer or float input is valid here. But if we try to provide another data type, such as a string, the compiler will throw an exception and print the stack trace.
import java.util.Scanner;

public class hello{
    public static void main(String[] args) {
        Scanner scanner = new Scanner(System.in);

        System.out.print("Enter value in Celsius to convert in fahrenheit:");

        double Celsius = scanner.nextFloat();
        double fahrenheit = (Celsius * 1.8)+32;

        System.out.printf("%.1f degrees Celsuis is %.1f degrees in Fahrenheit ",Celsius,fahrenheit);
    }
}
When we run the above code and enter some invalid value, let’s say the string «hero,» we get the following output:
Enter value in Celsius to convert in fahrenheit: hero
Exception in thread "main" java.util.InputMismatchException
    at java.base/java.util.Scanner.throwFor(Scanner.java:939)
    at java.base/java.util.Scanner.next(Scanner.java:1594)
    at java.base/java.util.Scanner.nextFloat(Scanner.java:2496)
    at com.example.myJavaProject.hello.main(hello.java:12)
Example 2 — Function Chaining
This is an example of function chaining, in which one function calls another in a chain-like fashion. Unlike in Example 1, no exception is thrown here, but the stack trace is explicitly printed using the dumpstack() method (a useful method when creating log files). This is good practice because we can use this code later for maintenance or to check the overall health or condition of the application.
public class Example {
   public static void main(String args[]) {
       f1();
   }

   static void f1() {
       f2();
   }

   static void f2() {
       f3();
   }

   static void f3() {
       f4();
   }

   static void f4() {
       Thread.dumpStack();
   }

}
When the above code is executed, we get the following output:
java.lang.Exception: Stack trace
    at java.base/java.lang.Thread.dumpStack(Thread.java:1380)
    at com.example.myJavaProject.Example.f4(Example.java:25)
    at com.example.myJavaProject.Example.f3(Example.java:20)
    at com.example.myJavaProject.Example.f2(Example.java:15)
    at com.example.myJavaProject.Example.f1(Example.java:10)
    at com.example.myJavaProject.Example.main(Example.java:6)
How to Read and Analyze Example 1’s Stack Trace
Let’s consider Example 1 for this analysis. Below is the breakdown of the output from its execution:
The first line in the stack trace:
The bottom line in the stack trace:
Now, let’s look at the entire stack trace and try to analyze it:
Enter value in Celsius to convert in fahrenheit: hero
Exception in thread "main" java.util.InputMismatchException
    at java.base/java.util.Scanner.throwFor(Scanner.java:939)
    at java.base/java.util.Scanner.next(Scanner.java:1594)
    at java.base/java.util.Scanner.nextFloat(Scanner.java:2496)
    at com.example.myJavaProject.hello.main(hello.java:12)
The main() method is at the bottom of the stack because that is where the program began. By reading from bottom to top, we can now identify where and what exception is being raised. Tracing the source of this error back to the main() method reveals that an exception occurs when the user’s input is taken.
The second line from the top shows that the float input was taken using the function nextFloat(), which in turn calls the next() function, which in turn calls the throwFor() function. As a result, it throws an InputMismatchException.
How to Fix Example 1’s Code Using Error Handling and Stack Traces
Stack traces and exceptions are clearly related, as evidenced by the preceding examples. Stack traces can be avoided; in short, some common error handling techniques can be used to handle and resolve any exceptions thrown by the code during execution. The technique listed below can help avoid a stack trace.
Examine, Investigate, and Handle Java Errors
It’s common for amateur programmers to overlook exceptions in their code. Being able to examine, investigate, and handle mistakes can be very helpful prior to moving to the next step. Let’s handle the exception in Example 1 by using try and catch statements.
import java.util.Scanner;

public class hello {
   public static void main(String[] args) {
       Scanner scanner = new Scanner(System.in);

       System.out.print("Enter value in Celsius to convert in fahrenheit:");

       try {

           double Celsius = scanner.nextFloat();
           double fahrenheit = (Celsius * 1.8) + 32;

           System.out.printf("%.1f degrees Celsuis is %.1f degrees in Fahrenheit ", Celsius, fahrenheit);
       } catch (InputMismatchException e) {
           System.out.println("Wrong input type entered...exiting the program");
       }

   }
}
In the above code, we have used a try—catch block to catch the exception and then print a custom message to notify the user to enter a valid input.
When the code above is executed, we get the following output:
Enter value in Celsius to convert in fahrenheit: hero
Wrong input type entered…exiting the program
Process finished with exit code 0
With the help of the try and catch blocks, the code to be tested is placed in the try block and any exception thrown by the code is handled in the catch block.
This is the most commonly used method to handle exceptions in Java and thus avoid stack traces.
Track, Analyze and Manage Errors With Rollbar
Managing errors and exceptions in your code is challenging. It can make deploying production code an unnerving experience. Being able to track, analyse, and manage errors in real-time can help you proceed with more confidence. Rollbar automates error monitoring and triaging, making fixing Java errors easier than ever. Sign Up Today!
Практика показала, что хардкорные расшифровки с наших докладов хорошо заходят, так что мы решили продолжать. Сегодня у нас в меню смесь из подходов к поиску и анализу ошибок и крэшей, приправленная щепоткой полезных инструментов, подготовленная на основе доклада Андрея Паньгина aka apangin из Одноклассников на одном из JUG’ов (это была допиленная версия его доклада с JPoint 2016). В без семи минут двухчасовом докладе Андрей подробно рассказывает о стек-трейсах и хип-дампах.
Пост получился просто огромный, так что мы разбили его на две части. Сейчас вы читаете первую часть, вторая часть лежит здесь.
Сегодня я буду рассказывать про стек-трейсы и хип-дампы — тему, с одной стороны, известную каждому, с другой — позволяющую постоянно открывать что-то новое (я даже багу нашел в JVM, пока готовил эту тему).
Когда я делал тренировочный прогон этого доклада у нас в офисе, один из коллег спросил: «Все это очень интересно, но на практике это кому-нибудь вообще полезно?» После этого разговора первым слайдом в свою презентацию я добавил страницу с вопросами по теме на StackOverflow. Так что это актуально.
Сам я работаю ведущим программистом в Одноклассниках. И так сложилось, что зачастую мне приходится работать с внутренностями Java — тюнить ее, искать баги, дергать что-то через системные классы (порой не совсем легальными способами). Оттуда я и почерпнул большую часть информации, которую сегодня хотел вам представить. Конечно, в этом мне очень помог мой предыдущий опыт: я 6 лет работал в Sun Microsystems, занимался непосредственно разработкой виртуальной Java-машины. Так что теперь я знаю эту тему как изнутри JVM, так и со стороны пользователя-разработчика.
Стек-трейсы
Стек-трейсы exception

Когда начинающий разработчик пишет свой «Hello world!», у него выскакивает эксепшн и ему демонстрируется стек-трейс, где произошла эта ошибка. Так что какие-то представления о стек-трейсах есть у большинства.
Перейдем сразу к примерам.
Я написал небольшую программку, которая в цикле 100 миллионов раз производит такой эксперимент: создает массив из 10 случайных элементов типа long и проверяет, сортированный он получился или нет.
package demo1;

import java.util.concurrent.ThreadLocalRandom;

public class ProbabilityExperiment {

    private static boolean isSorted(long[] array) {
        for (int i = 0; i < array.length; i++) {
            if (array[i] > array[i + 1]) {
                return false;
            }
        }
        return true;
    }

    public void run(int experiments, int length) {
        int sorted = 0;

        for (int i = 0; i < experiments; i++) {
            try {
                long[] array = ThreadLocalRandom.current().longs(length).toArray();
                if (isSorted(array)) {
                    sorted++;
                }
            } catch (Exception e) {
                e.printStackTrace();
            }
        }

        System.out.printf("%d of %d arrays are sortedn", sorted, experiments);
    }

    public static void main(String[] args) {
        new ProbabilityExperiment().run(100_000_000, 10);
    }
}
По сути он считает вероятность получения сортированного массива, которая приблизительно равна 1/n!. Как это часто бывает, в программке ошиблись на единичку:
for (int i = 0; i < array.length; i++)
Что произойдет? Эксепшн, выход за пределы массива.
Давайте разбираться, в чем дело. У нас в консоль выводится:
java.lang.ArrayIndexOutOfBoundsExceptionно стек-трейсов никаких нет. Куда делись?
В HotSpot JVM есть такая оптимизация: у эксепшенов, которые кидает сама JVM из горячего кода, а в данном случае код у нас горячий — 100 миллионов раз дергается, стек-трейсы не генерируются.
Это можно исправить с помощью специального ключика:
-XX:-OmitStackTraceInFastThrowТеперь попробуем запустить пример. Получаем все то же самое, только все стек-трейсы на месте.
Подобная оптимизация работает для всех неявных эксепшенов, которые бросает JVM: выход за границы массива, разыменование нулевого указателя и т.д.
Раз оптимизацию придумали, значит она зачем-то нужна? Понятно, что программисту удобнее, когда стек-трейсы есть.
Давайте измерим, сколько «стоит» у нас создание эксепшена (сравним с каким-нибудь простым Java-объектом, вроде Date).
@Benchmark
public Object date() {
    return new Date();
}

@Benchmark
public Object exception() {
    return new Exception();
}
С помощью JMH напишем простенькую бенчмарку и измерим, сколько наносекунд занимают обе операции.
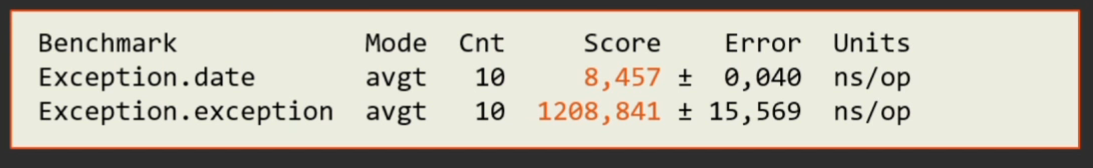
Оказывается, создать эксепшн в 150 раз дороже, чем обычный объект.
И тут не все так просто. Для виртуальной машины эксепшн не отличается от любого другого объекта, но разгадка кроется в том, что практически все конструкторы эксепшн так или иначе сводятся к вызову метода fillInStackTrace, который заполняет стек-трейс этого эксепшена. Именно заполнение стек-трейса отнимает время.
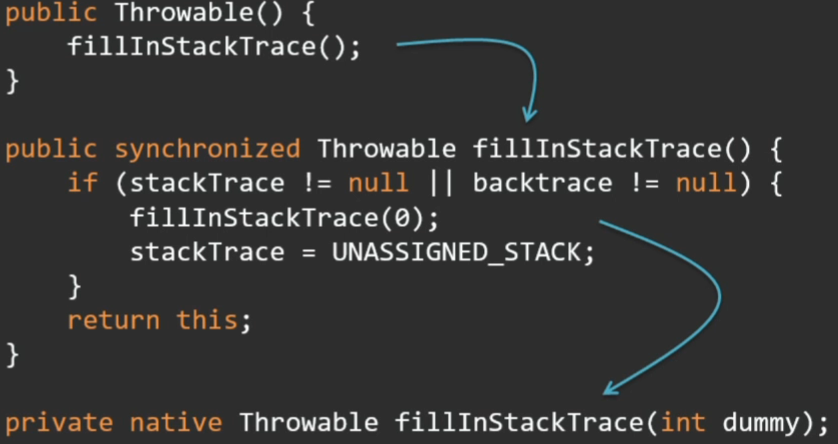
Этот метод в свою очередь нативный, падает в VM рантайм и там гуляет по стеку, собирает все фреймы.
Метод fillInStackTrace публичный, не final. Давайте его просто переопределим:
@Benchmark
public Object exceptionNoStackTrace() {
    return new Exception() {
        @Override
        public Throwable fillInStackTrace() {
            return this;
        }
    };
}
Теперь создание обычного объекта и эксепшена без стек-трейса отнимают одинаковое время.

Есть и другой способ создать эксепшн без стек-трейса. Начиная с Java 7, у Throwable и у Exception есть protected-конструктор с дополнительным параметром writableStackTrace:
protected Exception(String message, Throwable cause,
                    boolean enableSuppression,
                    boolean writableStackTrace);
Если туда передать false, то стек-трейс генерироваться не будет, и создание эксепшена будет очень быстрым.
Зачем нужны эксепшены без стек-трейсов? К примеру, если эксепшн используется в коде в качестве способа быстро выбраться из цикла. Конечно, лучше так не делать, но бывают случаи, когда это действительно дает прирост производительности.
А сколько стоит бросить эксепшн?
Рассмотрим разные случаи: когда он бросается и ловится в одном методе, а также ситуации с разной глубиной стека.
@Param("1", "2", "10", "100", "1000"})
int depth;

@Benchmark
public Object throwCatch() {
    try {
        return recursive(depth);
    } catch (Exception e) {
        return e;
    }
}
Вот, что дают измерения:
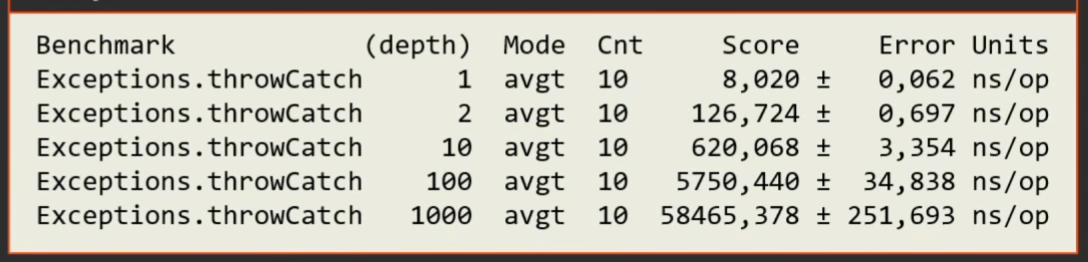
Т.е. если у нас глубина небольшая (эксепшн ловится в том же фрейме или фреймом выше — глубина 0 или 1), эксепшн ничего не стоит. Но как только глубина стека становится большой, затраты совсем другого порядка. При этом наблюдается четкая линейная зависимость: «стоимость» исключения почти линейно зависит от глубины стека.
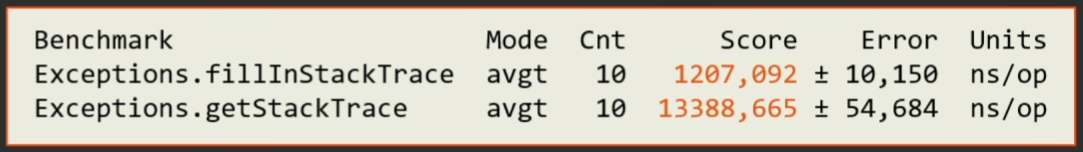
Дорого стоит не только получение стек-трейса, но и дальнейшие манипуляции — распечатка, отправка по сети, запись, — все, для чего используется метод getStackTrace, который переводит сохраненный стек-трейс в объекты Java.
@Benchmark
public Object fillInStackTrace() {
    return new Exception();
}

@Benchmark
public Object getStackTrace() {
    return new Exception().getStackTrace();
}
Видно, что преобразование стек-трейса в 10 раз «дороже» его получения:
Почему это происходит?
Вот метод getStackTrace в исходниках JDK:
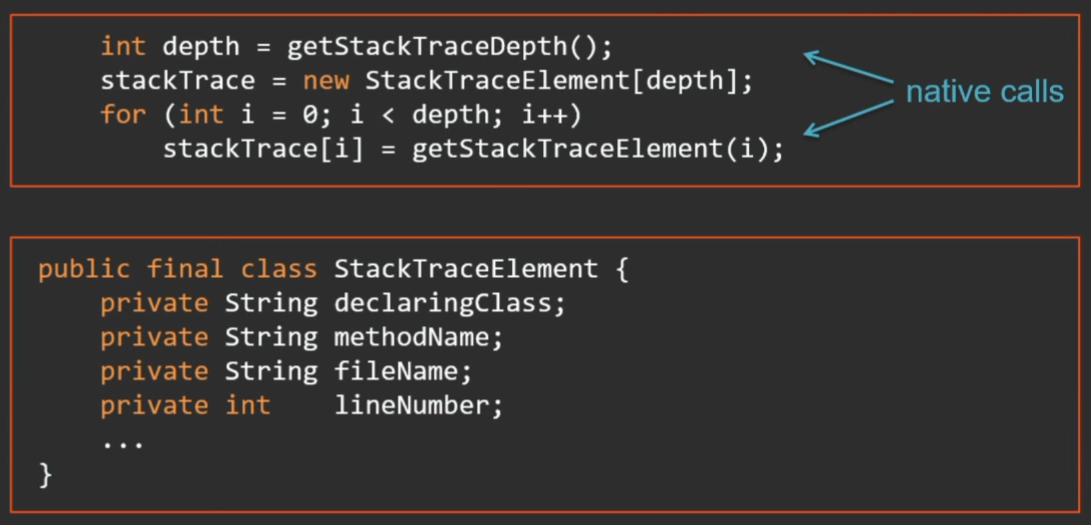
Сначала через вызов нативного метода мы узнаем глубину стека, потом в цикле до этой глубины вызываем нативный метод, чтобы получить очередной фрейм и сконвертировать его в объект StackTraceElement (это нормальный объект Java с кучей полей). Мало того, что это долго, процедура отнимает много памяти.
Более того, в Java 9 этот объект дополнен новыми полями (в связи с известным проектом модуляризации) — теперь каждому фрейму приписывается отметка о том, из какого он модуля.
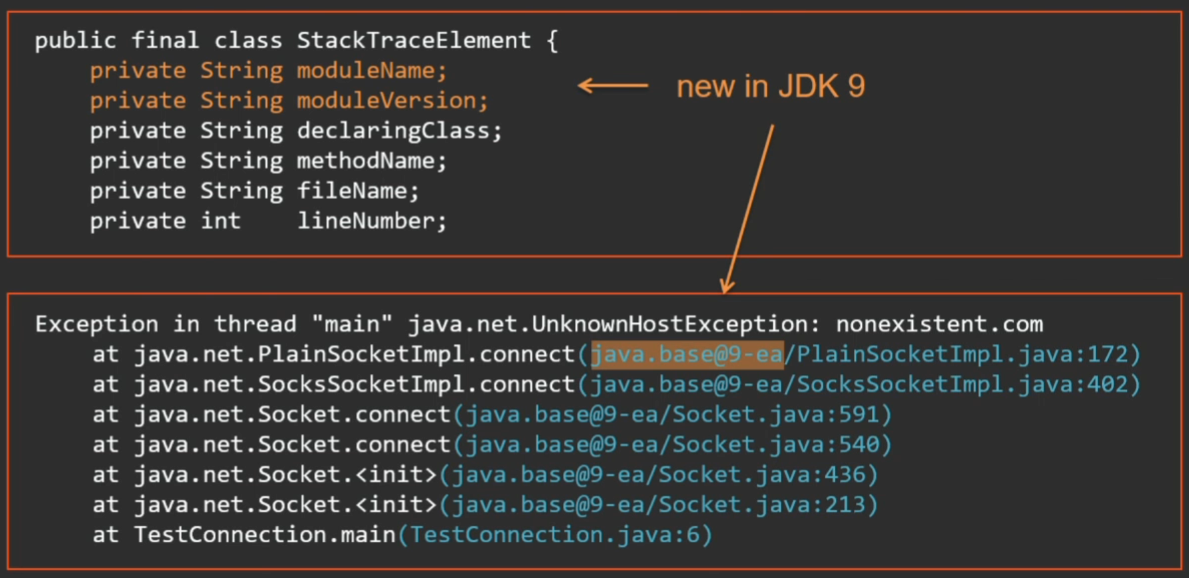
Привет тем, кто парсит эксепшены с помощью регулярных выражений. Готовьтесь к сюрпризам в Java 9 — появятся еще и модули.
Давайте подведем итоги
- создание самого объекта эксепшн — дешевое;
- занимает время получение его стек-трейса;
- еще дороже — преобразование этого внутреннего стек-трейса в Java-объект в StackTraceElement. Сложность этого дела прямо пропорциональна глубине стека.
- бросание эксепшн — быстрое, оно почти ничего не стоит (почти как безусловный переход),
- но только если эксепшн ловится в том же фрейме. Тут надо дополнить еще, что JIT у нас умеет инлайнить методы, поэтому один скомпилированный фрейм может в себя включать несколько Java-методов, заинлайниных друг в друга. Но если эксепшн ловится где-то глубже по стеку, его дороговизна пропорциональна глубине стека.
Пара советов:
- отключайте на продакшене оптимизацию, возможно, это сэкономит много времени на отладке:
-XX:-OmitStackTraceInFastThrow
- не используйте эксепшены для управления потоком программы; это считается не очень хорошей практикой;
- но если вы все-таки прибегаете к этому способу, позаботьтесь о том, чтобы эксепшены были быстрыми и лишний раз не создавали стек-трейсы.
Стек-трейсы в тред дампах
Чтобы узнать, что же делает программа, проще всего взять тред дамп, например, утилитой jstack.
Фрагменты вывода этой утилиты:
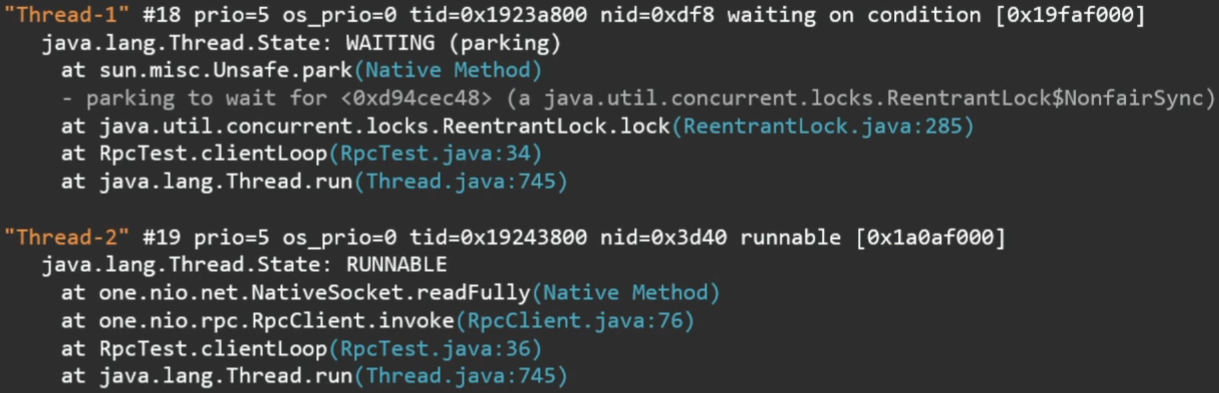
Что здесь видно? Какие есть потоки, в каком они состоянии и их текущий стек.
Более того, если потоки захватили какие-то локи, ожидают входа в synchronized-секцию или взятия ReentrantLock, это также будет отражено в стек-трейсе.
Порой полезным оказывается малоизвестный идентификатор:
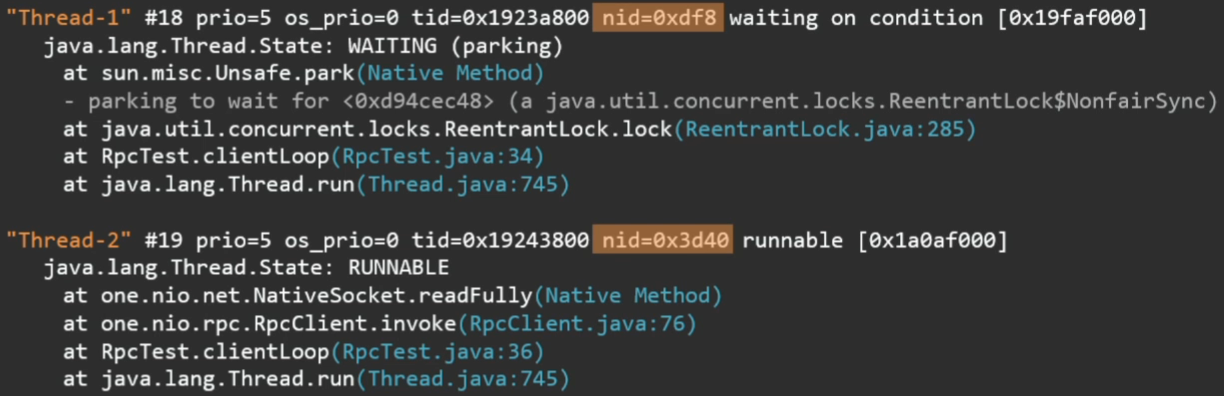
Он напрямую связан с ID потока в операционной системе. Например, если вы смотрите программой top в Linux, какие треды у вас больше всего едят CPU, pid потока — это и есть тот самый nid, который демонстрируется в тред дампе. Можно тут же найти, какому Java-потоку он соответствует.
В случае с мониторами (с synchronized-объектами) прямо в тред дампе будет написано, какой тред и какие мониторы держит, кто пытается их захватить.
В случае с ReentrantLock это, к сожалению, не так. Здесь видно, как Thread 1 пытается захватить некий ReentrantLock, но при этом не видно, кто этот лок держит. На этот случай в VM есть опция:
-XX:+PrintConcurrentLocksЕсли мы запустим то же самое с PrintConcurrentLocks, в тред дампе увидим и ReentrantLock.
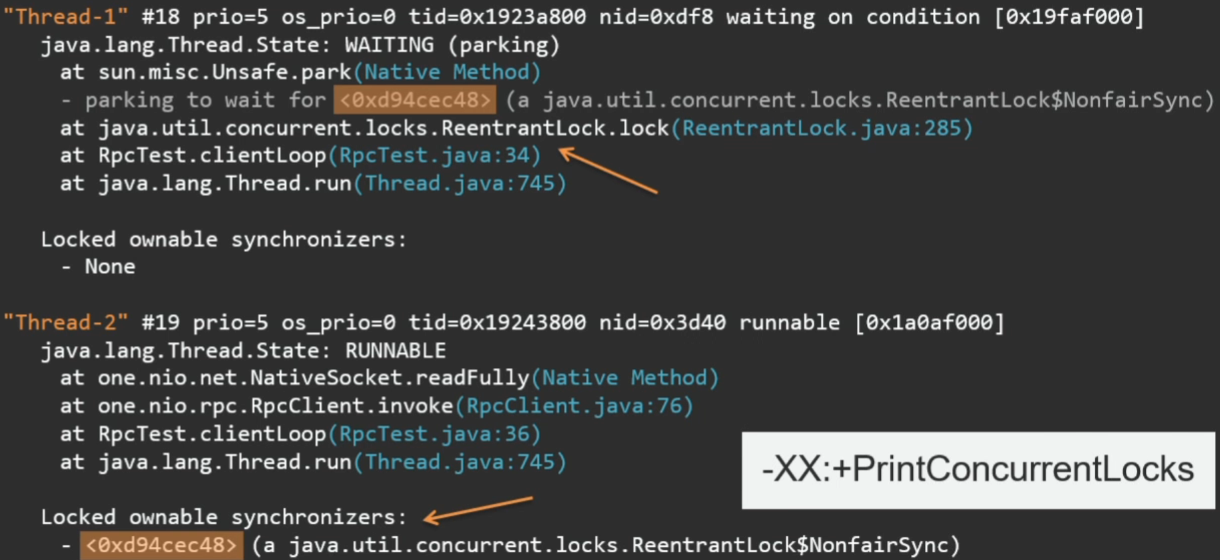
Здесь указан тот самый id лока. Видно, что его захватил Thread 2.
Если опция такая хорошая, почему бы ее не сделать «по умолчанию»?
Она тоже чего-то стоит. Чтобы напечатать информацию о том, какой поток какие ReentrantLock’и держит, JVM пробегает весь Java heap, ищет там все ReentrantLock’и, сопоставляет их с тредами и только потом выводит эту информацию (у треда нет информации о том, какие локи он захватил; информация есть только в обратную сторону — какой лок связан с каким тредом).
В указанном примере по названиям потоков (Thread 1 / Thread 2) непонятно, к чему они относятся. Мой совет из практики: если у вас происходит какая-то длинная операция, например, сервер обрабатывает клиентские запросы или, наоборот, клиент ходит к нескольким серверам, выставляйте треду понятное имя (как в случае ниже — прямо IP того сервера, к которому клиент сейчас идет). И тогда в дампе потока сразу будет видно, ответа от какого сервера он сейчас ждет.

Хватит теории. Давайте опять к практике. Этот пример я уже не раз приводил.
package demo2;

import java.util.stream.IntStream;

public class ParallelSum {
    static int SUM = IntStream.range(0, 100).parallel().reduce(0, (x, y) -> x + y);

    public static void main(String[] args) {
        System.out.println(SUM);
    }
}
Запускаем программку 3 раза подряд. 2 раза она выводит сумму чисел от 0 до 100 (не включая 100), третий — не хочет. Давайте смотреть тред дампы:

Первый поток оказывается RUNNABLE, выполняет наш reduce. Но смотрите, какой интересный момент: Thread.State вроде как RUNNABLE, но при этом написано, что поток in Object.wait().
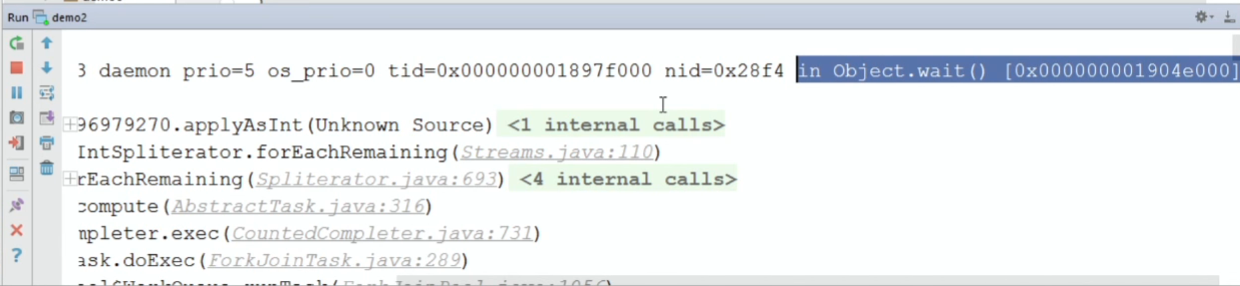
Мне тоже это было не понятно. Я даже хотел сообщить о баге, но оказывается, такая бага заведена много лет назад и закрыта с формулировкой: «not an issue, will not fix».
В этой программке действительно есть дедлок. Его причина — инициализация классов.
Выражение выполняется в статическом инициализаторе класса ParallelSum:
static int SUM = IntStream.range(0, 100).parallel().reduce(0, (x, y) -> x + y);Но поскольку стрим параллельный, исполнение происходит в отдельных потоках ForkJoinPool, из которых вызывается тело лямбды:
(x, y) -> x + yКод лямбды записан Java-компилятором прямо в классе ParallelSum в виде приватного метода. Получается, что из ForkJoinPool мы пытаемся обратиться к классу ParallelSum, который в данный момент находится на этапе инициализации. Поэтому потоки начинают ждать, когда же закончится инициализация класса, а она не может закончиться, поскольку ожидает вычисления этой самой свертки. Дедлок.
Почему вначале сумма считалась? Просто повезло. У нас небольшое количество элементов суммируется, и иногда все исполняется в одном потоке (другой поток просто не успевает).
Но почему же тогда поток в стек-трейсе RUNNABLE? Если почитать документацию к Thread.State, станет понятно, что никакого другого состояния здесь быть не может. Не может быть состояния BLOCKED, поскольку поток не заблокирован на Java-мониторе, нет никакой synchronized-секции, и не может быть состояния WAITING, потому что здесь нет никаких вызовов Object.wait(). Синхронизация происходит на внутреннем объекте виртуальной машины, который, вообще говоря, даже не обязан быть Java-объектом.
Стек-трейс при логировании
Представьте себе ситуацию: в куче мест в нашем приложении что-то логируется. Было бы полезно узнать, из какого места появилась та или иная строчка.

В Java нет препроцессора, поэтому нет возможности использовать макросы __FILE__, __LINE__, как в С (эти макросы еще на этапе компиляции преобразуются в текущее имя файла и строку). Поэтому других способов дополнить вывод именем файла и номером строки кода, откуда это было напечатано, кроме как через стек-трейсы, нет.
public static String getLocation() {
    StackTraceElement s = new Exception().getStackTrace()[2];
	return s.getFileName() + ':' + s.getLineNumber();
}
Генерим эксепшн, у него получаем стек-трейс, берем в данном случае второй фрейм (нулевой — это метод getLocation, а первый — вызывает метод warning).
Как мы знаем, получение стек-трейса и, тем более, преобразование его в стек-трейс элементы очень дорого. А нам нужен один фрейм. Можно ли как-то проще сделать (без эксепшн)?
Помимо getStackTrace у исключения есть метод getStackTrace объекта Thread.
Thread.current().getStackTrace()Будет ли так быстрее?
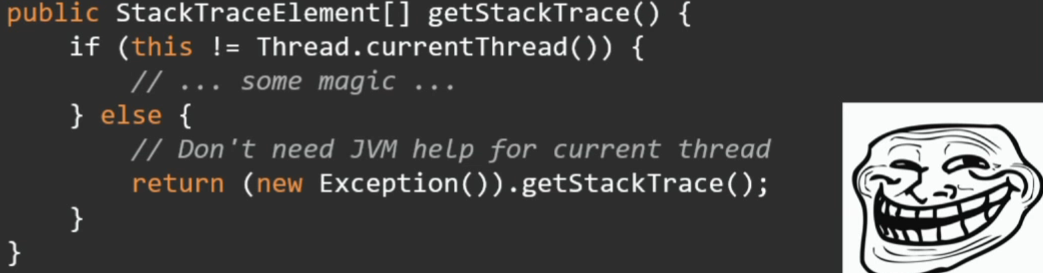
Нет. JVM никакой магии не делает, здесь все будет работать через тот же эксепшн с точно таким же стек-трейсом.
Но хитрый способ все-таки есть:
public static String getLocation() {
    StackTraceElement s = sun.misc.SharedSecrets.getJavaLangAccess()
            .getStackTraceElement(new Exception(), 2);

    return s.getFileName() + ':' + s.getLineNumber();
}
Я люблю всякие приватные штуки: Unsafe, SharedSecrets и т.д.
Есть аксессор, который позволяет получить StackTraceElement конкретного фрейма (без необходимости преобразовывать весь стек-трейс в Java-объекты). Это будет работать быстрее. Но есть плохая новость: в Java 9 это работать не будет. Там проделана большая работа по рефакторингу всего, что связано со стек-трейсами, и таких методов там теперь просто нет.
Конструкция, позволяющая получить какой-то один фрейм, может быть полезна в так называемых Caller-sensitive методах — методах, чей результат может зависеть от того, кто их вызывает. В прикладных программах с такими методами приходится сталкиваться нечасто, но в самой JDK подобных примеров немало:

В зависимости от того, кто вызывает Class.forName, поиск класса будет осуществляться в соответствующем класс-лоадере (того класса, который вызвал этот метод); аналогично — с получением ResourceBundle и загрузкой библиотеки System.loadLibrary. Также информация о том, кто вызывает, полезна при использовании различных методов, которые проверяют пермиссии (а имеет ли данный код право вызывать этот метод). На этот случай в «секретном» API предусмотрен метод getCallerClass, который на самом деле является JVM-интринсиком и вообще почти ничего не стоит.
sun.reflect.Reflection.getCallerClassКак уже много раз говорилось, приватный API — это зло, использовать которое крайне не рекомендуется (сами рискуете нарваться на проблемы, подобные тем, что ранее вызвал Unsafe). Поэтому разработчики JDK задумались над тем, что раз этим пользуются, нужна легальная альтернатива — новый API для обхода потоков. Основные требования к этому API:
- чтобы можно было обойти только часть фреймов (если нам нужно буквально несколько верхних фреймов);
- возможность фильтровать фреймы (не показывать ненужные фреймы, относящиеся к фреймворку или системным классам);
- чтобы эти фреймы конструировались ленивым образом (lazy) — если нам не нужно получать информацию о том, с каким файлом он связан, эта информация преждевременно не извлекается;
- как в случае с getCallerClass — нам нужно не имя класса, а сам инстанс java.lang.Class.
Известно, что в публичном релизе Java 9 будет java.lang.StackWalker.
Получить его экземпляр очень просто — методом getInstance. У него есть несколько вариантов — дефолтный StackWalker или незначительно конфигурируемый опциями:

- опция RETAIN_CLASS_REFERENCE означает, что вам нужны не имена классов, а именно инстансы;
- прочие опции позволяют показать в стек-трейсе фреймы, относящиеся к системным классам и классам рефлекшн (по умолчанию они не будут показаны в стек-трейсе).
Также для оптимизации можно задавать примерную глубину, которая необходима (чтобы JVM могла оптимизировать получение стек-фреймов в batch).
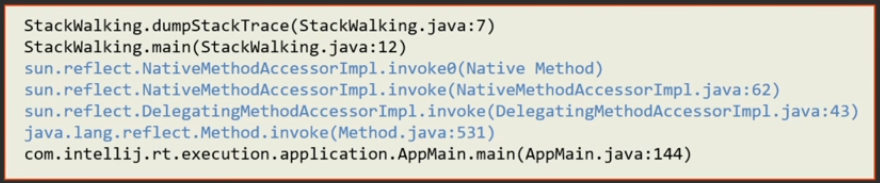
Простейший пример, как этим пользоваться:
StackWalker sw = StackWalker.getInstance();
sw.forEach(System.out::println);
Берем StackWalker и вызываем метод forEach, чтобы он обошел все фреймы. В результате получим такой простой стек-трейс:
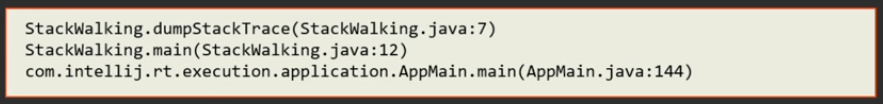
То же самое с опцией SHOW_REFLECT_FRAMES:
StackWalker sw = StackWalker.getInstance(StackWalker.Option.SHOW_REFLECT_FRAMES);
sw.forEach(System.out::println);
В этом случае добавятся методы, относящиеся к вызову через рефлекшн:
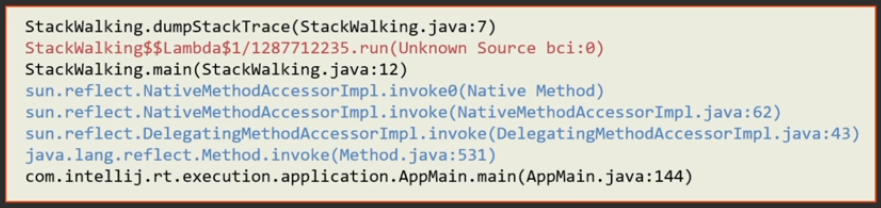
Если добавить опцию SHOW_HIDDEN_FRAMES (она, кстати, включает в себя SHOW_REFLECT_FRAMES, т.е. рефлекшн-фреймы тоже будут показаны):
StackWalker sw = StackWalker.getInstance(StackWalker.Option.SHOW_HIDDEN_FRAMES);
sw.forEach(System.out::println);
В стек-трейсе появятся методы динамически-сгенерированных классов лямбд:
А теперь самый главный метод, который есть в StackWalker API — метод walk с такой хитрой непонятной сигнатурой с кучей дженериков:
public <T> T walk(Function<? super Stream<StackFrame>, ? extends T> function)Метод walk принимает функцию от стек-фрейма.
Его работу проще показать на примере.
Несмотря на то, что все это выглядит страшно, как этим пользоваться — очевидно. В функцию передается стрим, а уже над стримом можно проводить все привычные операции. К примеру, вот так выглядел бы метод getCallerFrame, который достает только второй фрейм: пропускаются первые 2, потом вызывается findFirst:
public static StackFrame getCallerFrame() {
    return StackWalker.getInstance()
            .walk(stream -> stream.skip(2).findFirst())
            .orElseThrow(NoSuchElementException::new);
}
Метод walk возвращает тот результат, который возвращает эта функция стрима. Все просто.
Для данного конкретного случая (когда нужно получить просто Caller класс) есть специальный shortcut метод:
return StackWalker.getInstance(RETAIN_CLASS_REFERENCE).getCallerClass();Еще один пример посложнее.
Обходим все фреймы, оставляем только те, которые относятся к пакету org.apache, и выводим первые 10 в список.
StackWalker sw = StackWalker.getInstance();

List<StackFrame> frames = sw.walk(stream ->
        stream.filter(sf -> sf.getClassName().startsWith("org.apache."))
              .limit(10)
              .collect(Collectors.toList()));
Интересный вопрос: зачем такая длинная сигнатура с кучей дженериков? Почему бы просто не сделать у StackWalker метод, который возвращает стрим?
public Stream<StackFrame> stream();Если дать API, который возвращает стрим, у JDK теряется контроль над тем, что дальше над этим стримом делают. Можно дальше этот стрим положить куда-то, отдать в другой поток, попробовать его использовать через 2 часа после получения (тот стек, который мы пытались обойти, давно потерян, а тред может быть давно убит). Таким образом будет невозможно обеспечить «ленивость» Stack Walker API.
Основной поинт Stack Walker API: пока вы находитесь внутри walk, у вас зафиксировано состояние стека, поэтому все операции на этом стеке можно делать lazy.
На десерт еще немного интересного.
Как всегда, разработчики JDK прячут от нас кучу сокровищ. И помимо обычных стек-фреймов они для каких-то своих нужд сделали живые стек-фреймы, которые отличаются от обычных тем, что имеют дополнительные методы, позволяющие не только получить информацию о методе и классе, но еще и о локальных переменных, захваченных мониторах и значениях экспрешн-стека данного стек-фрейма.
/* package-private */
interface LiveStackFrame extends StackFrame {

    public Object[] getMonitors();
    public Object[] getLocals();
    public Object[] getStack();
    public static StackWalker getStackWalker();
}
Защита здесь не ахти какая: класс просто сделали непубличным. Но кто же нам мешает взять рефлекшн и попробовать его? (Примечание: в актуальных сборках JDK 9 доступ к непубличному API через рефлекшн запрещён. Чтобы его разрешить, необходимо добавить опцию JVM --add-opens=java.base/java.lang=ALL-UNNAMED)
Пробуем на таком примере. Есть программа, которая рекурсивным методом ищет выход из лабиринта. У нас есть квадратное поле size x size. Есть метод visit с текущими координатами. Мы пытаемся из текущей клетки пойти влево / вправо / вверх / вниз (если они не заняты). Если дошли из правой-нижней клетки в левую-верхнюю, считаем, что нашли выход и распечатываем стек.
package demo3;

import java.util.Random;

public class Labyrinth {
    static final byte FREE = 0;
    static final byte OCCUPIED = 1;
    static final byte VISITED = 2;

    private final byte[][] field;

    public Labyrinth(int size) {
        Random random = new Random(0);
        field = new byte[size][size];

        for (int x = 0; x < size; x++) {
            for (int y = 0; y < size; y++) {
                if (random.nextInt(10) > 7) {
                    field[x][y] = OCCUPIED;
                }
            }
        }

        field[0][0] = field[size - 1][size - 1] = FREE;
    }

    public int size() {
        return field.length;
    }

    public boolean visit(int x, int y) {
        if (x == 0 && y == 0) {
            StackTrace.dump();
            return true;
        }

        if (x < 0 || x >= size() || y < 0 || y >= size() || field[x][y] != FREE) {
            return false;
        }

        field[x][y] = VISITED;
        return visit(x - 1, y) || visit(x, y - 1) || visit(x + 1, y) || visit(x, y + 1);
    }

    public String toString() {
        return "Labyrinth";
    }

    public static void main(String[] args) {
        Labyrinth lab = new Labyrinth(10);
        boolean exitFound = lab.visit(9, 9);
        System.out.println(exitFound);
    }
}
Запускаем:
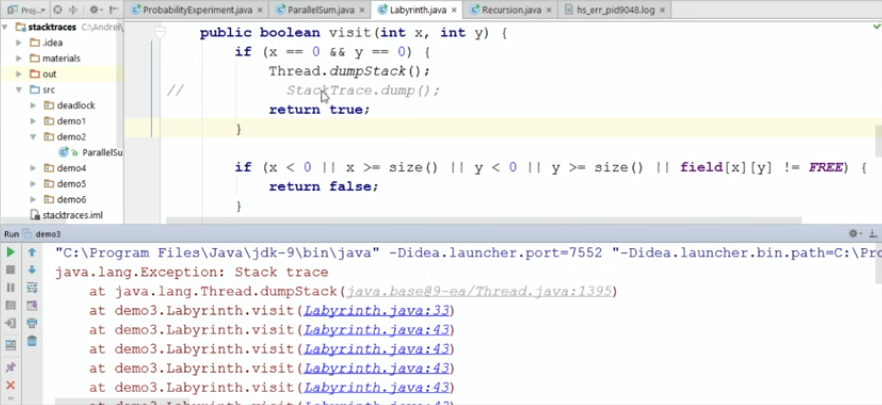
Если я делаю обычный dumpStack, который был еще в Java 8, получаем обычный стек-трейс, из которого ничего не понятно. Очевидно — рекурсивный метод сам себя вызывает, но интересно, на каком шаге (и с какими значениями координат) вызывается каждый метод.
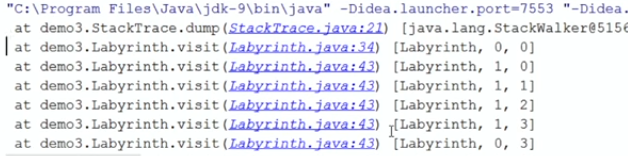
Заменим стандартный dumpStack на наш StackTrace.dump, который через рефлекшн использует live стек-фреймы:
package demo3;

import java.lang.reflect.Method;
import java.util.Arrays;

public class StackTrace {

    private static Object invoke(String methodName, Object instance) {
        try {
            Class<?> liveStackFrame = Class.forName("java.lang.LiveStackFrame");
            Method m = liveStackFrame.getMethod(methodName);
            m.setAccessible(true);
            return m.invoke(instance);
        } catch (ReflectiveOperationException e) {
            throw new AssertionError("Should not happen", e);
        }
    }

    public static void dump() {
        StackWalker sw = (StackWalker) invoke("getStackWalker", null);
        sw.forEach(frame -> {
            Object[] locals = (Object[]) invoke("getLocals", frame);
            System.out.println(" at " + frame + "  " + Arrays.toString(locals));
        });
    }
}
В первую очередь надо получить соответствующий StackWalker, вызвав метод getStackWalker. Все фреймы, которые будут передаваться в getStackWalker, на самом деле будут экземплярами лайв стек-фрейма, у которого есть дополнительные методы, в частности, getLocals для получения локальных переменных.
Запускаем. Получаем то же самое, но у нас отображается весь путь из лабиринта в виде значений локальных переменных:
На этом мы заканчиваем первую часть поста. Вторая часть здесь.
Лично встретиться с Андреем в Москве можно будет уже совсем скоро — 7-8 апреля на JPoint 2017. В этот раз он выступит с докладом «JVM-профайлер с чувством такта», в котором расскажет, как можно получить честные замеры производительности приложения, комбинируя несколько подходов к профилированию. Доклад будет «всего» часовой, зато в дискуссионной зоне никто не будет ограничивать вас от вопросов и горячих споров!
Кроме этого, на JPoint есть целая куча крутых докладов практически обо всем из мира Java — обзор планируемых докладов мы давали в другом посте, а просто программу конференции вы найдете на сайте мероприятия.
Deploying your Java code to production limits your troubleshooting options. Connecting to your app in production with a debugger is usually out of the question, and you might not even be able to get console access. So even with monitoring, you’re going to end up troubleshooting many problems post-mortem. This means looking at logs and, if you’re lucky, working with a Java stack trace.
That’s right, I said you’re lucky if you have a stack trace. It’s like getting a compass, a map, and a first-class airplane ticket handed to you all at once! Let’s talk about what a Java stack trace is and how you can use it.

What’s a Java Stack Trace?
A stack trace, also called a stack backtrace or even just a backtrace, is a list of stack frames. These frames represent a moment during an application’s execution. A stack frame is information about a method or function that your code called. So the Java stack trace is a list of frames that starts at the current method and extends to when the program started.
Sometimes there’s confusion between a stack and the Stack. A stack is a data structure that acts as a stack of papers on your desk: it’s first-in-last-out. You add documents to the pile and take them off in the reverse order you put them there. The Stack, more accurately called the runtime or call stack, is a set of stack frames a program creates as it executes, organized in a stack data structure.
Let’s look at an example.
Java Stack Trace Example
Let’s take a look at a Java program. This class calls four methods and prints a stack trace to the console from the
public class StackTrace {

  public static void main(String[] args) {
    a();
  }

  static void a() {
    b();
  }

  static void b() {
    c();
  }

  static void c() {
    d();
  }

  static void d() {
    Thread.dumpStack();
  }
}
When you run the class, you’ll see something like this:
java.lang.Exception: Stack trace
at java.base/java.lang.Thread.dumpStack(Thread.java:1383)
at com.ericgoebelbecker.stacktraces.StackTrace.d(StackTrace.java:23)
at com.ericgoebelbecker.stacktraces.StackTrace.c(StackTrace.java:19)
at com.ericgoebelbecker.stacktraces.StackTrace.b(StackTrace.java:15)
at com.ericgoebelbecker.stacktraces.StackTrace.a(StackTrace.java:11)
at com.ericgoebelbecker.stacktraces.StackTrace.main(StackTrace.java:7)
The d() method() is at the top of the stack because that’s where the app generated the trace. The main() method is at the bottom because that’s where the program started. When the program started, the Java runtime executed the main() method. Main() called a(). A() called b(), and b() called c(), which called d(). Finally, d() called dumpStack(), which generated the output. This Java stack trace gives us a picture of what the program did, in the order that it did it.
A Java stack trace is a snapshot of a moment in time. You can see where your application was and how it got there. That’s valuable insight that you can use a few different ways.
How to Use Java Stack Traces
Now that you’ve seen what Java stack traces show you, how can you use them?
Java Exceptions
Stack traces and exceptions are often associated with each other. When you see a Java application throw an exception, you usually see a stack trace logged with it. This is because of how exceptions work.
When Java code throws an exception, the runtime looks up the stack for a method that has a handler that can process it. If it finds one, it passes the exception to it. If it doesn’t, the program exits. So exceptions and the call stack are linked directly. Understanding this relationship will help you figure out why your code threw an exception.
Let’s change our sample code.
First, modify the d() method:
static void d() {
  throw new NullPointerException("Oops!");
}
Then, change main() and a() so main can catch an exception. You’ll need to add a checked exception to a() so the code will compile.
public static void main(String[] args)
{
  try {
    a();
  } catch (InvalidClassException ice) {
    System.err.println(ice.getMessage());
  }
}

static void a() throws InvalidClassException
{
  b();
}
You’re deliberately catching the “wrong” exception. Run this code and watch what happens.
Exception in thread "main" java.lang.NullPointerException: Oops!
at com.ericgoebelbecker.stacktraces.StackTrace.d(StackTrace.java:29)
at com.ericgoebelbecker.stacktraces.StackTrace.c(StackTrace.java:24)
at com.ericgoebelbecker.stacktraces.StackTrace.b(StackTrace.java:20)
at com.ericgoebelbecker.stacktraces.StackTrace.a(StackTrace.java:16)
at com.ericgoebelbecker.stacktraces.StackTrace.main(StackTrace.java:9)
The exception bubbled up the stack past main() because you were trying to catch a different exception. So the runtime threw it, terminating the application. You can still see a stack trace though, so it’s easy to determine what happened.
Now, change main() to catch a NullPointerException instead. You can remove the checked exception from a() too.
public static void main(String[] args) {
  try {
    a();
  } catch (NullPointerException ice) {
    System.err.println(ice.getMessage());
  }
}

static void a() {
  b();
}
Rerun the program.
Oops!
We lost the stack trace! By only printing the message attached to the exception, you missed some vital context. Unless you can remember why you wrote Oops! in that message, tracking down this problem is going to be
public static void main(String[] args) {
  try {
    a();
  } catch (NullPointerException npe) {
    npe.printStackTrace();
  }
}
Rerun the application.
java.lang.NullPointerException: Oops!
at com.ericgoebelbecker.stacktraces.StackTrace.d(StackTrace.java:28)
at com.ericgoebelbecker.stacktraces.StackTrace.c(StackTrace.java:24)
at com.ericgoebelbecker.stacktraces.StackTrace.b(StackTrace.java:20)
at com.ericgoebelbecker.stacktraces.StackTrace.a(StackTrace.java:16)
at com.ericgoebelbecker.stacktraces.StackTrace.main(StackTrace.java:9)
That’s better! We see the stack trace, and it ends at d() where the exception occurred, even though main() printed it.
Logging Java Stack Traces
What if you don’t want to print an error message to the console but to a log file instead? The good news is that most loggers, including Log4j and Logback, will write exceptions with stack traces if you call them with the right arguments.
Pass in the exception object as the last argument to the message, without a formatting directive. So if you used Log4j or Logback with the sample code like this:
logger.error(“Something bad happened:”, npe);
You would see this in your log file:
Something bad happened:
java.lang.NullPointerException: Oops!
at com.ericgoebelbecker.stacktraces.StackTrace.d(StackTrace.java:28)
at com.ericgoebelbecker.stacktraces.StackTrace.c(StackTrace.java:24)
at com.ericgoebelbecker.stacktraces.StackTrace.b(StackTrace.java:20)
at com.ericgoebelbecker.stacktraces.StackTrace.a(StackTrace.java:16)
at com.ericgoebelbecker.stacktraces.StackTrace.main(StackTrace.java:9)
One of the best things you can do with exceptions and stack traces is to log them so you can use them to isolate a problem. If you get in the habit of printing useful log messages with details like stack traces and log indexing, then search tools, like Scalyr, become one of the most powerful tools in your troubleshooting tool bag.
The Java Debugger
Debuggers work by taking control of a program’s runtime and letting you both observe and control it. To do this, it shows you the program stack and enables you to traverse it in either direction. When you’re in a debugger, you get a more complete picture of a stack frame than you do when looking at stack traces in a log message.
Let’s make a small code change and then throw the sample code into a debugger.
First, add a local variable to the d() method:
static void d() {
  String message = “Oops.”
  throw new NullPointerException(message);
}
Then add a breakpoint where d() throws the exception in your debugger. I’m using IntelliJ’s debugger for this image.
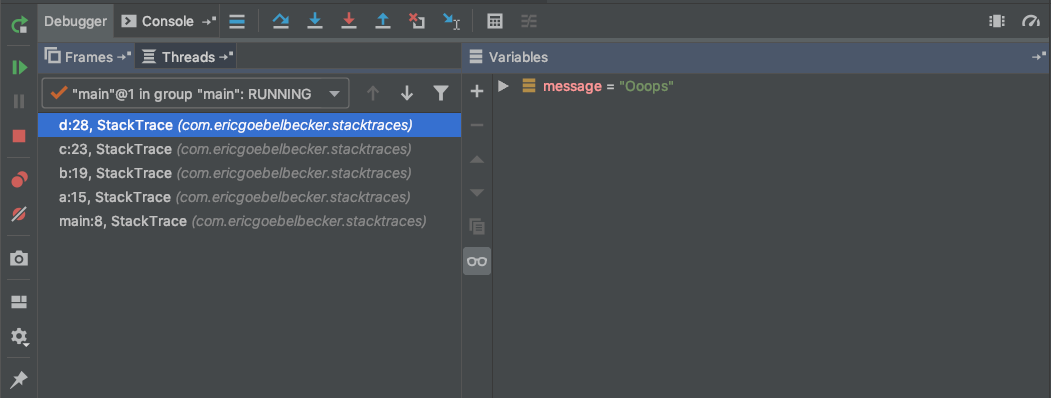
Here you can see that the string we added to d() is part of the stack frame because it’s a local variable. Debuggers operate inside the Stack and give you a detailed picture of each frame.
Forcing a Thread Dump
Thread dumps are great post-mortem tools, but they can be useful for runtime issues too. If your application stops responding or is consuming more CPU or memory than you expect, you can retrieve information about the running app with jstack.
Modify main() so the application will run until killed:
public static void main(String[] args) throws Exception {
  try {
      while(true) {
          Thread.sleep(1000);
      }
  } catch (NullPointerException ice)  {
      ice.printStackTrace();
  }
}
Run the app, determine its pid, and then run jstack. On Windows, you’ll need to press ctrl-break in the DOS window you’re running your code in.
$ jstack <pid>
Jstack will generate a lot of output.
2019-05-13 10:06:17
Full thread dump OpenJDK 64-Bit Server VM (12+33 mixed mode, sharing):

Threads class SMR info:
_java_thread_list=0x00007f8bb2727190, length=10, elements={
0x00007f8bb3807000, 0x00007f8bb2875000, 0x00007f8bb2878000, 0x00007f8bb4000800,
0x00007f8bb300a800, 0x00007f8bb287b800, 0x00007f8bb287f000, 0x00007f8bb28ff800,
0x00007f8bb300b800, 0x00007f8bb3805000
}

"main" #1 prio=5 os_prio=31 cpu=60.42ms elapsed=103.32s tid=0x00007f8bb3807000 nid=0x2503 waiting on condition  [0x0000700001a0e000]
   java.lang.Thread.State: TIMED_WAITING (sleeping)
	at java.lang.Thread.sleep([email protected]/Native Method)
	at com.ericgoebelbecker.stacktraces.StackTrace.main(StackTrace.java:9)

"Reference Handler" #2 daemon prio=10 os_prio=31 cpu=0.08ms elapsed=103.29s tid=0x00007f8bb2875000 nid=0x4603 waiting on condition  [0x0000700002123000]
   java.lang.Thread.State: RUNNABLE
	at java.lang.ref.Reference.waitForReferencePendingList([email protected]/Native Method)
	at java.lang.ref.Reference.processPendingReferences([email protected]/Reference.java:241)
	at java.lang.ref.Reference$ReferenceHandler.run([email protected]/Reference.java:213)

"Finalizer" #3 daemon prio=8 os_prio=31 cpu=0.13ms elapsed=103.29s tid=0x00007f8bb2878000 nid=0x3903 in Object.wait()  [0x0000700002226000]
   java.lang.Thread.State: WAITING (on object monitor)
	at java.lang.Object.wait([email protected]/Native Method)
	- waiting on <0x000000070ff02770> (a java.lang.ref.ReferenceQueue$Lock)
	at java.lang.ref.ReferenceQueue.remove([email protected]/ReferenceQueue.java:155)
	- locked <0x000000070ff02770> (a java.lang.ref.ReferenceQueue$Lock)
	at java.lang.ref.ReferenceQueue.remove([email protected]/ReferenceQueue.java:176)
	at java.lang.ref.Finalizer$FinalizerThread.run([email protected]/Finalizer.java:170)

"Signal Dispatcher" #4 daemon prio=9 os_prio=31 cpu=0.27ms elapsed=103.28s tid=0x00007f8bb4000800 nid=0x3e03 runnable  [0x0000000000000000]
   java.lang.Thread.State: RUNNABLE

"C2 CompilerThread0" #5 daemon prio=9 os_prio=31 cpu=6.12ms elapsed=103.28s tid=0x00007f8bb300a800 nid=0x5603 waiting on condition  [0x0000000000000000]
   java.lang.Thread.State: RUNNABLE
   No compile task

"C1 CompilerThread0" #7 daemon prio=9 os_prio=31 cpu=12.01ms elapsed=103.28s tid=0x00007f8bb287b800 nid=0xa803 waiting on condition  [0x0000000000000000]
   java.lang.Thread.State: RUNNABLE
   No compile task

"Sweeper thread" #8 daemon prio=9 os_prio=31 cpu=0.73ms elapsed=103.28s tid=0x00007f8bb287f000 nid=0xa603 runnable  [0x0000000000000000]
   java.lang.Thread.State: RUNNABLE

"Service Thread" #9 daemon prio=9 os_prio=31 cpu=0.04ms elapsed=103.27s tid=0x00007f8bb28ff800 nid=0xa503 runnable  [0x0000000000000000]
   java.lang.Thread.State: RUNNABLE

"Common-Cleaner" #10 daemon prio=8 os_prio=31 cpu=0.27ms elapsed=103.27s tid=0x00007f8bb300b800 nid=0xa303 in Object.wait()  [0x000070000293b000]
   java.lang.Thread.State: TIMED_WAITING (on object monitor)
	at java.lang.Object.wait([email protected]/Native Method)
	- waiting on <0x000000070ff91690> (a java.lang.ref.ReferenceQueue$Lock)
	at java.lang.ref.ReferenceQueue.remove([email protected]/ReferenceQueue.java:155)
	- locked <0x000000070ff91690> (a java.lang.ref.ReferenceQueue$Lock)
	at jdk.internal.ref.CleanerImpl.run([email protected]/CleanerImpl.java:148)
	at java.lang.Thread.run([email protected]/Thread.java:835)
	at jdk.internal.misc.InnocuousThread.run([email protected]/InnocuousThread.java:134)

"Attach Listener" #11 daemon prio=9 os_prio=31 cpu=0.72ms elapsed=0.10s tid=0x00007f8bb3805000 nid=0x5e03 waiting on condition  [0x0000000000000000]
   java.lang.Thread.State: RUNNABLE

"VM Thread" os_prio=31 cpu=3.83ms elapsed=103.29s tid=0x00007f8bb2874800 nid=0x3703 runnable

"GC Thread#0" os_prio=31 cpu=0.13ms elapsed=103.31s tid=0x00007f8bb282b800 nid=0x3003 runnable

"G1 Main Marker" os_prio=31 cpu=0.26ms elapsed=103.31s tid=0x00007f8bb2845000 nid=0x3103 runnable

"G1 Conc#0" os_prio=31 cpu=0.04ms elapsed=103.31s tid=0x00007f8bb3810000 nid=0x3303 runnable

"G1 Refine#0" os_prio=31 cpu=0.39ms elapsed=103.31s tid=0x00007f8bb2871000 nid=0x3403 runnable

"G1 Young RemSet Sampling" os_prio=31 cpu=13.60ms elapsed=103.31s tid=0x00007f8bb2872000 nid=0x4d03 runnable
"VM Periodic Task Thread" os_prio=31 cpu=66.44ms elapsed=103.27s tid=0x00007f8bb2900800 nid=0xa403 waiting on condition

JNI global refs: 5, weak refs: 0
My application was running 11 threads, and jstack generated a stack trace for all of them. The first thread, helpfully named main, is the one we’re concerned with. You can see it sleeping on wait().
Java Stack Traces: Your Roadmap
A stack trace is more than just a picture inside your application. It’s a snapshot of a moment in time that includes every step your code took to get there. There’s no reason to dread seeing one in your logs because they’re a gift from Java that tells you exactly what happened. Make sure you’re logging them when an error crops up and send them to a tool like Scalyr so they’re easy to find.
Now that you understand what a Java stack trace is and how to use it, take a look at your code. Are you throwing away critical information about errors and exceptions in your code? Is there a spot where a call to Thread.dumpstack() might help you isolate a recurring bug? Perhaps it’s time to run your app through the debugger a few times with some strategically-chosen breakpoints.
- NullPointerException if
objisnullin code which callsobj.someMethod() - ArithmeticException if a division by zero happens in integer arithmetic, ie
1/0— curiously there is no Exception if this is a floating-point calculation though,1.0/0.0returnsinfinityjust fine! - NullPointerException if a
nullInteger is unboxed to anintin code like this:Integer a=null; a++; - There are some other examples in the Java Language Specification, so it’s important to be aware that Exceptions can arise without being explicitly thrown.
- Our users are shielded from having to care about the
ArithmeticException— giving us flexibility to change how commons-lang is used. - More context can be added, eg stating that it’s the number of FooBars that is causing the problem.
- It can make stack traces easier to read, too, as we’ll see below.
- Your code calls methods in a Library
- Your code is called by methods in a Framework
- Handle Twilio Debugger Events with Python and Flask
- Locally Developing and Debugging Twilio Applications
- How to Debug and Fix PHP Mail in Local Host
When things go wrong in a running Java application, often the first sign you will have is lines printed to the screen that look like the code below. This is a Java Stack Trace, and in this post, I’ll explain what they are, how they are made, and how to read and understand them. If that looks painful to you then read on…
Exception in thread "main" java.lang.RuntimeException: Something has gone wrong, aborting!
    at com.myproject.module.MyProject.badMethod(MyProject.java:22)
    at com.myproject.module.MyProject.oneMoreMethod(MyProject.java:18)
    at com.myproject.module.MyProject.anotherMethod(MyProject.java:14)
    at com.myproject.module.MyProject.someMethod(MyProject.java:10)
    at com.myproject.module.MyProject.main(MyProject.java:6)
Java Stack Trace: What It Is and How It Works
A stack trace (also known as a stack backtrace or stack traceback) is an incredibly useful tool when it comes to debugging code. Learn more about what it is and how it works.
What Is a Java Stack Trace?
A stack trace shows the call stack (sets of active stack frames) and provides information on the methods that your code called. Usually, a stack trace is shown when an Exception is not handled correctly in code. (An exception is what a runtime environment uses to tell you that there’s an error in your code.) This may be one of the built-in Exception types, or a custom Exception created by a program or a library.
The stack trace contains the Exception’s type and a message, and a list of all the method calls which were in progress when it was thrown.
How to Read a Java Stack Trace
Let’s dissect that stack trace. The first line tells us the details of the Exception:

This is a good start. Line 2 shows what code was running when that happened:

That helps us narrow down the problem, but what part of the code called badMethod? The answer is on the next line down, which can be read in the exact same way. And how did we get there? Look on the next line. And so on, until you get to the last line, which is the main method of the application. Reading the stack trace from bottom to top you can trace the exact path from the beginning of your code, right to the Exception.
What Triggered the Stack Trace?

The thing that causes an Exception is usually an explicit throw statement. Using the file name and line number you can check exactly what code threw the Exception. It will probably look something like this:
throw new RuntimeException("Something has gone wrong, aborting!");
This is a great place to start looking for the underlying problem: are there any if statements around that? What does that code do? Where does the data used in that method come from?
It is also possible for code to throw an Exception without an explicit throw statement, for example you can get:
Dealing with Exceptions Thrown by Libraries
One of the great strengths of Java is the huge number of libraries available. Any popular library will be well tested so generally when faced with an Exception from a library, it’s best to check first whether the error is caused by how our code uses it.
For example, if we’re using the Fraction class from Apache Commons Lang and pass it some input like this:
Fraction.getFraction(numberOfFoos, numberOfBars);
If numberOfBars is zero, then the stack trace will be like this:
Exception in thread "main" java.lang.ArithmeticException: The denominator must not be zero
    at org.apache.commons.lang3.math.Fraction.getFraction(Fraction.java:143)
    at com.project.module.MyProject.anotherMethod(MyProject.java:17)
    at com.project.module.MyProject.someMethod(MyProject.java:13)
    at com.project.module.MyProject.main(MyProject.java:9)
Many good libraries provide Javadoc which includes information about what kinds of Exceptions may be thrown and why. In this case Fraction.getFraction has documented will throw an ArithmeticException if a Fraction has a zero denominator. Here it’s also clear from the message, but in more complicated or ambiguous situations the docs can be a great help.
To read this stack trace, start at the top with the Exception’s type — ArithmeticException and message The denominator must not be zero. This gives an idea of what went wrong, but to discover what code caused the Exception, skip down the stack trace looking for something in the package com.myproject (it’s on the 3rd line here), then scan to the end of the line to see where the code is (MyProject.java:17). That line will contain some code that calls Fraction.getFraction. This is the starting point for investigation: What is passed to getFraction? Where did it come from?
In big projects with many libraries, stack traces can be hundreds of lines long so if you see a big stack trace, practice scanning the list of at ... at ... at ... looking for your own code — it’s a useful skill to develop.
Best Practice: Catching and Rethrowing Exceptions
Let’s say we are working on a big project that deals with fictional FooBars, and our code is going to be used by others. We might decide to catch the ArithmeticException from Fraction and re-throw it as something project-specific, which looks like this:
   try {
            ....
           Fraction.getFraction(x,y);
            ....
   } catch ( ArithmeticException e ){
           throw new MyProjectFooBarException("The number of FooBars cannot be zero", e);
   }
Catching the ArithmeticException and rethrowing it has a few benefits:
It isn’t necessary to catch-and-rethrow on every Exception, but where there seems to be a jump in the layers of your code, like calling into a library, it often makes sense.
Notice that the constructor for MyProjectFooBarException takes 2 arguments: a message and the Exception which caused it. Every Exception in Java has a cause field, and when doing a catch-and-rethrow like this then you should always set that to help people debug errors. A stack trace might now look something like this:
Exception in thread "main" com.myproject.module.MyProjectFooBarException: The number of FooBars cannot be zero
    at com.myproject.module.MyProject.anotherMethod(MyProject.java:19)
    at com.myproject.module.MyProject.someMethod(MyProject.java:12)
    at com.myproject.module.MyProject.main(MyProject.java:8)
Caused by: java.lang.ArithmeticException: The denominator must not be zero
    at org.apache.commons.lang3.math.Fraction.getFraction(Fraction.java:143)
    at com.myproject.module.MyProject.anotherMethod(MyProject.java:17)
    ... 2 more
The most recently thrown Exception is on the first line, and the location where it was thrown is still on line 2. However, this type of stack trace can cause confusion because the catch-and-rethrow has changed the order of method calls compared to the stack traces we saw before. The main method is no longer at the bottom, and the code which first threw an Exception is no longer at the top. When you have multiple stages of catch-and-rethrow then it gets bigger but the pattern is the same:
Check the sections from first to last looking for your code, then read relevant sections from bottom to top.
Libraries vs Frameworks
The difference between a Library and a Framework in Java is:
A common type of Framework is a web application server, like SparkJava or Spring Boot. Using SparkJava and Commons-Lang with our code we might see a stack trace like this:
com.framework.FrameworkException: Error in web request
    at com.framework.ApplicationStarter.lambda$start$0(ApplicationStarter.java:15)
    at spark.RouteImpl$1.handle(RouteImpl.java:72)
    at spark.http.matching.Routes.execute(Routes.java:61)
    at spark.http.matching.MatcherFilter.doFilter(MatcherFilter.java:134)
    at spark.embeddedserver.jetty.JettyHandler.doHandle(JettyHandler.java:50)
    at org.eclipse.jetty.server.session.SessionHandler.doScope(SessionHandler.java:1568)
    at org.eclipse.jetty.server.handler.ScopedHandler.handle(ScopedHandler.java:144)
    at org.eclipse.jetty.server.handler.HandlerWrapper.handle(HandlerWrapper.java:132)
    at org.eclipse.jetty.server.Server.handle(Server.java:503)
    at org.eclipse.jetty.server.HttpChannel.handle(HttpChannel.java:364)
    at org.eclipse.jetty.server.HttpConnection.onFillable(HttpConnection.java:260)
    at org.eclipse.jetty.io.AbstractConnection$ReadCallback.succeeded(AbstractConnection.java:305)
    at org.eclipse.jetty.io.FillInterest.fillable(FillInterest.java:103)
    at org.eclipse.jetty.io.ChannelEndPoint$2.run(ChannelEndPoint.java:118)
    at org.eclipse.jetty.util.thread.QueuedThreadPool.runJob(QueuedThreadPool.java:765)
    at org.eclipse.jetty.util.thread.QueuedThreadPool$2.run(QueuedThreadPool.java:683)
    at java.base/java.lang.Thread.run(Thread.java:834)
Caused by: com.project.module.MyProjectFooBarException: The number of FooBars cannot be zero
    at com.project.module.MyProject.anotherMethod(MyProject.java:20)
    at com.project.module.MyProject.someMethod(MyProject.java:12)
    at com.framework.ApplicationStarter.lambda$start$0(ApplicationStarter.java:13)
    ... 16 more
Caused by: java.lang.ArithmeticException: The denominator must not be zero
    at org.apache.commons.lang3.math.Fraction.getFraction(Fraction.java:143)
    at com.project.module.MyProject.anotherMethod(MyProject.java:18)
    ... 18 more
OK that is getting quite long now. As before we should suspect our own code first, but it’s getting harder and harder to find where that is. At the top there is the Framework’s Exception, at the bottom the Library’s and right in the middle is our own code. Phew!
A complex Framework and Library can create a dozen or more Caused by: sections, so a good strategy is to jump down those looking for your own code: Caused by: com.myproject... Then read that section in detail to isolate the problem.
Java Stack Trace Takeaways
Learning how to understand stack traces and read them quickly will let you home in on problems and makes debugging much less painful. It’s a skill that improves with practice, so next time you see a big stack trace don’t be intimidated — there is a lot of useful information there if you know how to extract it.

If you have any tips or tricks about dealing with Java stack traces, I’d love to hear about them so get in touch with me and let’s share what we know.
mgilliard@twilio.com
For more resources on debugging code and applications, check out these articles:
Write enough programs, and you’ll agree that it’s impossible to write an exception-free program, at least in the first go. Java debugging is a major part of the coding process, and knowing how to debug your code efficiently can make or break your day. And in Java applications, understanding and leveraging stack traces can be the game-changer you need to ship your application quickly.
This article will cover how to debug in Java and how Java stack traces simplify it. Let’s start with what debugging is.
What is debugging in Java?
Debugging in Java is testing your code under different scenarios, edge cases, and fixing any errors you might encounter. Depending on the complexity of the program, debugging can range from relying on the compiler to catch simple syntax errors or using a variety of Java tools such as debuggers and breakpoints to find logical errors that are easily overlooked.
One tool that significantly speeds up the Java debugging process is called a stack trace. Not only does it help you submit relatively clean code during development, but it’s also one of the primary tools to troubleshoot your code after deployment.
What is a Java stack trace?
A Java stack trace is the long list of function calls printed on the programming terminal in case of any errors in the program. Let’s understand how it is generated.
Java programs use a call stack model for execution. Each call stack is made up of stack frames that store function calls. That means anytime you call a method, the call stack creates a stack frame that stores information such as variables, arguments, return address, etc. If a program cannot execute successfully, the compiler prints a copy of the active stack frames to the terminal. That’s the stack trace.
As a stack trace lists all your function calls before the program crashes, it lets you know where you should start looking for the error. This is vital because it has the potential to cut down your java debugging time in half since you’re no longer flying blind.
Java Stack Trace Example
Let’s take the example of a program that takes three numbers and divides the largest by one of the other numbers and returns the quotient.
public class GreatestNumber {

    //method which returns the quotient
  public static int greater(int a, int b, int c) {
      int div;
      if (a>b && a>c)
      {
          div = a / b;
          return div;

      }
      else if (b>c && b>a)
      {
          div = b / c;
          return div;
      }
      else
      {
          div = c/a;
          return c;
      }
  }


 //main method
  public static void main(String[] args) {
      int m;
      m = greater (0, 3, 10);
      System.out.println (m);
  }
}
This program would work perfectly when all numbers are non-zero integers. However, since we have set the input for “a” as zero, the program triggers an Arithmetic exception.
Here’s the stack trace:
Exception in thread "main" java. lang.ArithmeticException: / by zero
at GreatestNumber.greater(GreatestNumber.java:18)
at GreatestNumber.main(GreatestNumber.java:27)
How to read a Java stack trace
Sometimes, the sheer number of lines in a stack trace might feel intimidating. However, a big stack trace can also contain useful information that can help you debug faster. This section will help you understand the strategy to read even the most nested exceptions.
Let’s break down the example from earlier:
Exception in thread "main" java.lang.ArithmeticException: / by zero In the first line, the program tells us that the exception has occurred in the “main” thread, which is useful when there are multiple threads in your application. The next word tells us the type of Exception that has occurred — in this case, an ArithmeticException. Typically, every Exception will have associated documentation or “Javadocs” which you can refer to troubleshoot that error.
The rest of the stack trace tells us where the exception occurred exactly. Traces are printed in a “last in, first out” manner. That means the last function called when the exception occurred will be printed first. Here, since the Arithmetic exception occurred while the program’s control was passed to the “greater” function, we can see that function call in the stack trace along with the line number. Now, where was this called from? It’s printed on the next line — the “main” method.
GreatestNumber.greater(GreatestNumber.java:18)at
GreatestNumber.main(GreatestNumber.java:27)
Using this logic, you can decode even nested exceptions like these:
Exception in thread "main" java.lang.IllegalStateException: A phone has a null property
        at com.test.project.Phone.getModelNumber(Phone.java:28)
        at com.test.project.Bootstrap.main(Bootstrap.java:4)
Caused by: java.lang.NullPointerException
        at com.test.project.Phone.getModelNumber(Phone.java:12)
        at com.test.project.Manufacturer.getPhoneModel(Manufacturer.java:15)
        ... 1 more,
In this case, you want to traverse the “Caused by” sections until you find the section that might be the root cause of the error. Once you’re sure of that, you can follow the “at” trail to determine the exact line that needs fixing.
With this exception, the root cause is the “NullPointerException.” Thus, you should look at line 12 of Phone.java to figure out why the function returns a null value.
Handling exceptions in Java
Exception handling ensures that your application will still work even if one function doesn’t. You want your application to maintain (or at least attempt) a normal execution flow until you can fix the exceptions. A simple try-catch block or a try-catch-finally block usually does the job.
This is how it would look in our previous example if we include a try-catch block to address the ArithmeticException:
public static void main(String[] args) {
      int m;
      try {
          m = greater (0, 3, 10);
          System.out.println (m);
      } catch(ArithmeticException e) {
        System.out.println("Division by zero is not allowed:"+ e.getMessage());
        e.printStackTrace();
      }
}
And the corresponding trace would be:
Division by zero is not allowed - Error message: / by zero
java.lang.ArithmeticException: / by zero
at GreatestNumber.greater(GreatestNumber.java:18)
	at GreatestNumber.main(GreatestNumber.java:28)
As you can see, the custom message makes it much clearer for users. They do not have to understand what an Arithmetic Exception is – only that zero is not allowed as an input parameter. Additionally, it provides more context to the stack trace, which is helpful when it is too long.
Exception Handling & Third-Party Libraries
Exception handling is essential when calling third-party code libraries. Since well-known Java code libraries are extensively tested based on secure code practices, exceptions typically occur due to internal code.
For instance, say, we’re trying to write to a file by using the IO library provided by Java. If the file does not have the associated permission, the library will throw an AccessControl exception that looks something like this:
java.security.AccessControlException: access denied
("java.io.FilePermission" "test.txt" "read")
    at java.base/java.security.AccessControlContext.checkPermission(AccessControlContext.java:472)
    at java.base/java.security.AccessController.checkPermission(AccessController.java:897)
    at java.base/java.lang.SecurityManager.checkPermission(SecurityManager.java:322)
    at java.base/java.lang.SecurityManager.checkRead(SecurityManager.java:883)
    at
java.base/java.io.FileInputStream.<init>(FileInputStream.java:225)
    at
java.base/java.io.FileInputStream.<init>(FileInputStream.java:187)
    at java.base/java.io.FileReader.<init>(FileReader.java:96)
    at test.main(File.java:19)
In this example, the stack trace prints all the function calls inside three Java libraries — security, lang, and IO. This makes the stack trace confusing because the problematic code is not due to the library but instead due to how you use it. Thus, making sense of the stack trace in the Java debugging process and identifying references to the code or package you used becomes difficult.
Instead, if you incorporate a try-catch block in your code, the stack trace would directly start from your code without traversing the internal third-party libraries. That’ll make the trace more readable and easier to handle.
Now that you understand how to read a stack trace and handle exceptions, let’s talk about managing them during Java debugging effectively.
Java tracing and writing them to logs
In distributed or complex applications, the number of function calls is massive. As you can imagine, errors cause lengthy stack traces, which can be hard to keep track of. This is even more problematic in large production-level events where multiple applications depend on each other. The solution is to write traces to logs and use a log management platform to manage them.
Some log management platforms, such as Coralogix, offer features such as log clustering, auto-parsing, and proactive anomaly detection. These features help you constantly monitor the health of your application and detect errors even before they occur.
Investigating errors with Java debugger
Sometimes, finding errors is not as simple as a NullPointerException or an ArithmeticException. Nuances in the code can cause logical errors that can give incorrect outputs.
In cases such as these, printing a stack trace using a Thread.dumpStack() is a good way to point your efforts in the right direction. You can choose strategic breakpoints based on the information provided by the trace and then go through the code line by line with a debugger.
With debuggers, you can halt the program’s execution, figure out the state of the variables and understand the program flow easily. Typically, Java IDEs like Eclipse have built-in debuggers that you use to carry out this activity.
The Ultimate Java Debugging Tools: Stack Traces & Log Management
Deploying code to production can sometimes be nerve-wracking. The actual problem starts when the code you deployed breaks already working applications. Since you don’t have the luxury of using debuggers in production, the only thing that can help you is a java stack trace and accessing those details to log files. Those log files make pinpointing the issue much easier and save you big escalations and headaches. You can also set up log monitoring platforms like Coralogix to constantly analyze your logs and set up alerts whenever an exception occurs.