-
Alen59
- Posts: 25
- Joined: Mon Mar 19, 2018 12:00 pm
Error with command: gdb —version
Hi,
i can run debugger using command line but i can’t run it using eclipse, i get the following error, could you please help, i attached my eclipse debugger configuration snapshot
Error with command: gdb —version
Cannot run program «gdb»: Launching failed
- Attachments
-
- eclipse debugger setting.pdf
- (73.42 KiB) Downloaded 992 times
-
ESP_igrr
- Posts: 1969
- Joined: Tue Dec 01, 2015 8:37 am
Re: Error with command: gdb —version
Postby ESP_igrr » Sat Dec 15, 2018 9:19 am
The screenshots are of two different debugging configuration wizards. First two pages are from GDB Hardware Debugging, which is the correct one to use. However the last screenshot is for some different debugging configuration, which you seem to be launching. At least, it has «gdb» as the debugger, which matches the error message you are getting.
You need to launch «gdb hardware debugging» configuration (i.e. the one set up by the first two screens).
-
Alen59
- Posts: 25
- Joined: Mon Mar 19, 2018 12:00 pm
Re: Error with command: gdb —version
Postby Alen59 » Tue Dec 18, 2018 1:15 pm
ok thanks, if i use the first one, these are the error i get
Error in final launch sequence
Failed to execute MI command:
-target-select remote localhost:3333
Error message from debugger back end:
localhost:3333: The system tried to join a drive to a directory on a joined drive.
localhost:3333: The system tried to join a drive to a directory on a joined drive.
-
ESP_igrr
- Posts: 1969
- Joined: Tue Dec 01, 2015 8:37 am
Re: Error with command: gdb —version
Postby ESP_igrr » Tue Dec 18, 2018 1:22 pm
Is OpenOCD program running at the time you are trying to start GDB? Did you get any prompts from Windows firewall about allowing OpenOCD to open ports?
-
Alen59
- Posts: 25
- Joined: Mon Mar 19, 2018 12:00 pm
Re: Error with command: gdb —version
Postby Alen59 » Tue Dec 18, 2018 1:57 pm
sorry i did not know i need to run OpenOCD when running eclipse debugger, i just did and now i am getting the following error
Error in final launch sequence
Reset command not defined for device ‘Generic TCP/IP’
-
Alen59
- Posts: 25
- Joined: Mon Mar 19, 2018 12:00 pm
Re: Error with command: gdb —version
Postby Alen59 » Tue Dec 18, 2018 2:24 pm
ok, when i removed check marks in startup tab from «RESET» and «delay and Halt» it seems solved the problem
Who is online
Users browsing this forum: Bing [Bot], ghost23, spadespwnz and 37 guests
Eclipse Luna on Mac Yosemite, CDT, XCode7.
HelloWorld with makefile:
— Copied from Eclipse Tutorial main.cpp and makefile for HelloWorld;
— Ran ‘Build Project’ and got the console:
»
11:39:25 **** Build of configuration Debug for project HelloWorldMakefile ****
make all
Building file: ../main.cpp
Invoking: GCC C++ Compiler
g++ -O0 -g3 -Wall -c -fmessage-length=0 -MMD -MP -MF»main.d» -MT»main.d» -o «main.o» «../main.cpp»
Finished building: ../main.cpp
Building target: HelloWorldMakefile
Invoking: MacOS X C++ Linker
g++ -o «HelloWorldMakefile» ./main.o
Finished building target: HelloWorldMakefile
11:39:25 Build Finished (took 330ms)
»
— Tried to run Debug, and got the error that ‘gdb’ cannot run.
Question:
Why no .exe file was built?
1. The run files on OS X are not .exe files, but files without a specific extension.
2. The XCode packege does not use GDB as standard debugger. You have to install it into the system separately.
3. It seems that your run firl has been built under the name HelloWorldMakefile.
Источник
Error with command gdb version eclipse
Community
Participate
Eclipse IDE
Breadcrumbs
Home » Language IDEs » C / C++ IDE (CDT) » Error while launching command: gdb —version
|
|||||||||||||||||||||||||||||||||||||||||||||||||||||||||||||
|

 Jamie Lahowetz

 yyy
yyy 
If you prefer watching videos to reading articles, Cody Henrichsen has created a video walkthrough of this procedure.
With its new OS release, Apple has discontinued the use of GDB in OS X. Since 2005 Apple has steadily been moving away from the GNU toolchain in favor of LLVM. This means that Xcode now uses LLDB instead.
LLDB looks to be a very nice replacement for GDB, and I hope to use it in the future, but currently Xcode is the only graphical front-end that supports its use; pretty much every other debugging GUI uses GDB under the hood, including Eclipse. So, if you want to debug C/C++ code in Eclipse CDT on the Mac, you must install GDB.1
Here is the procedure that worked for me.2 Others have reported issues with this, so please do let me know in the comments if it doesn’t work for you.
Known Issues
GDB will not be able to breakpoint inside any template function, though it should be able to step into it. This problem may be resolved if you use the MacPorts installation procedure (below) but it may only work if you also compile with Apple’s GCC.
It was also reported in the comments that it cannot breakpoint into a shared library function. I have not confirmed this issue myself.
On OS X Yosemite, the MacPorts version will require some extra hoops to jump through. See below.
Installing GDB
You can install via MacPorts or Homebrew. MacPorts has Apple’s official GDB distribution, which is modified for OS X. This is probably the best option (thanks to CC’s comment for this tip). However, on my machine this only seems to work if the program is compiled using Apple’s GCC, which is no longer supported by Apple. All things being equal, I vastly prefer to avoid MacPorts altogether. So I installed with Homebrew, despite recommending MacPorts. If you have no preference either way, go with MacPorts.
Update for Yosemite users: I haven’t upgraded to Yosemite yet, but some folks have reported problems in the comments below (and for some, it worked fine). It seems that Apple’s GDB (the MacPorts install) is currently broken on Yosemite. If you know what you’re doing, you can apply the Portfile patch from this ticket. It seems like a bit of a pain, though, so you might switch to plain vanilla GDB, which can be installed with either MacPorts or Homebrew.
Install with MacPorts
- Install Xcode and MacPorts, if not already installed.
- Now install the Apple GCC and GDB from MacPorts:
$ sudo port install gdb—apple
$ sudo port install apple—gcc42
- For the remainder of the tutorial, use /opt/local/bin/gdb-apple as the GDB executable
- Remember if you want breakpoints in template functions to work, you’ll need to change your compiler to g++-apple-4.2 instead of g++! This can be done in your Makefiles or in your IDE settings.
Install with Homebrew
- Install Xcode and Homebrew, if not already installed.
- Now install GDB from Homebrew:
$ brew tap homebrew/dupes
$ brew install gdb
- For the remainder of the tutorial, use /usr/local/bin/gdb as the GDB executable
If that worked, then lucky you! Getting it compiled is where many people seem to have trouble. Now you just need to sign it to give it permission to control OS X processes.
Certifying GDB
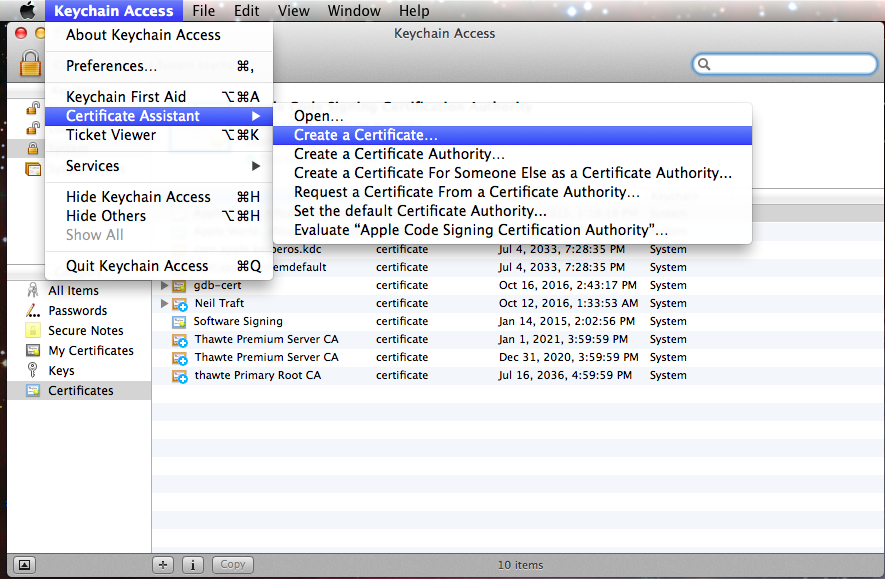
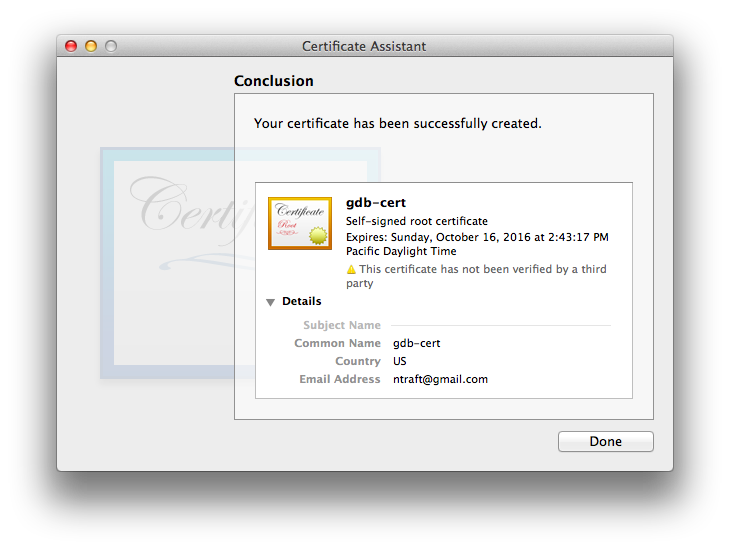
Open up the Keychain Access application (/Applications/Utilities/Keychain Access.app). Navigate via the menu to Keychain Access > Certificate Assistant > Create Certificate…
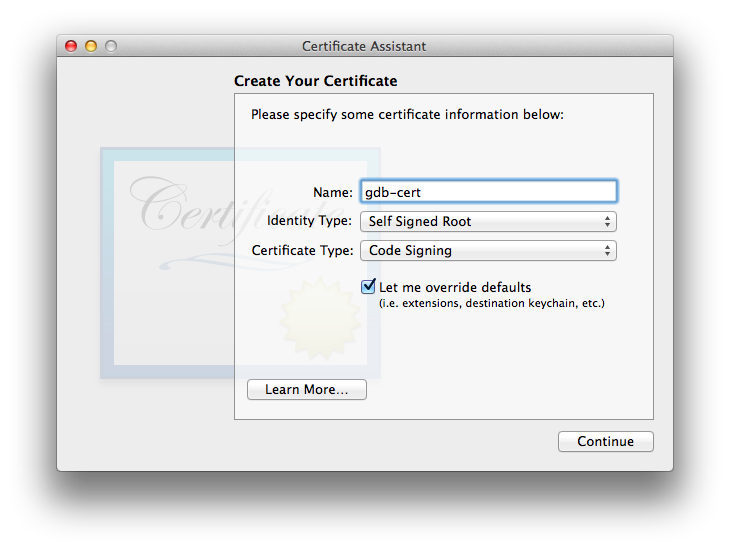
Enter a name for the certificate. For this how-to, I’ll call it «gdb-cert». Set the fields exactly as shown below.
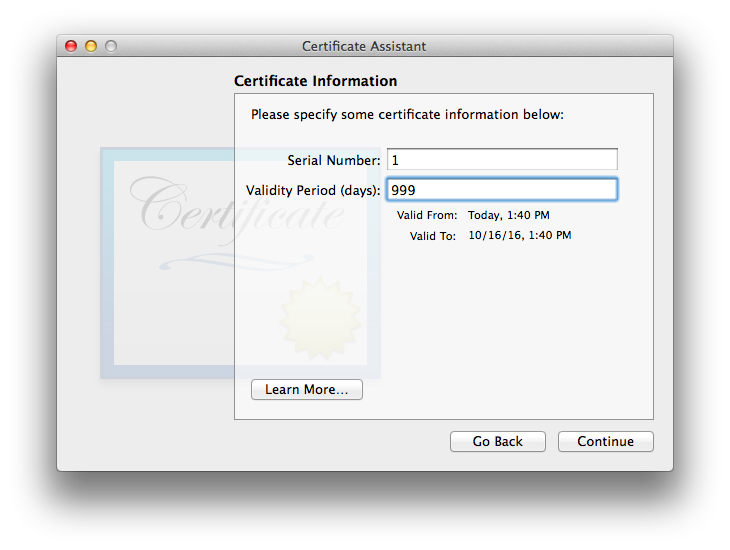
The maximum validity period is 999 days. I don’t really want to deal with this again, so I’m going to max it out.
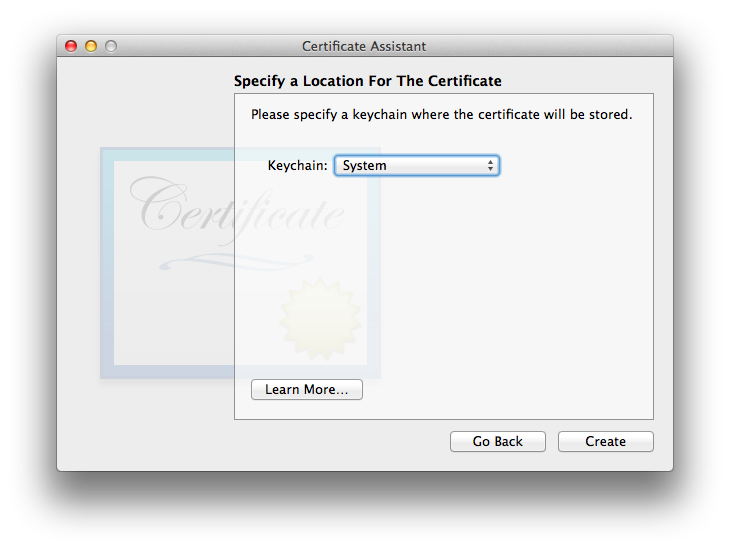
Keep clicking the «Continue» button until you are asked for a location. Set it to «System».3
Success!
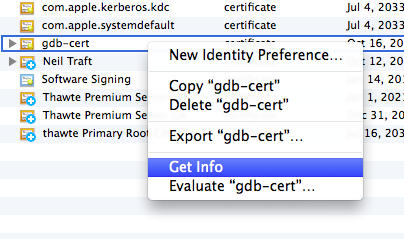
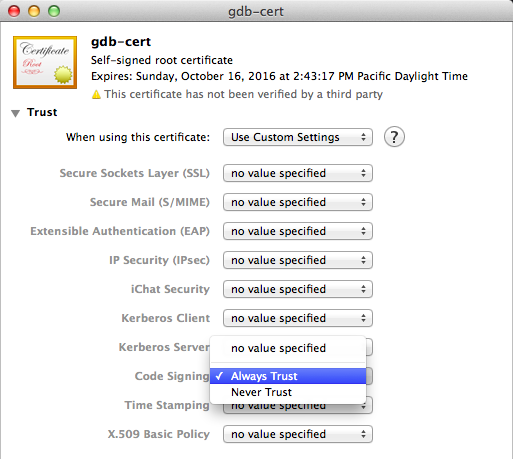
Now make sure the cert is always trusted. Right-click the new certificate and select Get Info. Under the Trust section, set Code Signing to Always Trust.
Now that we have a certificate, we need to use it to sign GDB. First, we’ll restart the taskgated process to make sure it picks up the new certificate. Quit Keychain Access (you must quit Keychain Access!) and return to the Terminal for these final commands.
Find the taskgated process.
|
$ ps —e | grep taskgated 56822 ?? 0:03.11 /usr/libexec/taskgated —s 60944 ttys002 0:00.00 grep —color=auto taskgated |
The first number in the above output is the PID. Use this to kill the process (it will immediately restart itself).
Now you can finally code sign GDB.
|
# MacPorts version $ codesign —s gdb—cert $(which gdb—apple) # Homebrew version $ codesign —s gdb—cert $(which gdb) |
Now you should be all set! The OS X Keychain may ask for your password the first time you attempt to debug a program, but it should work!
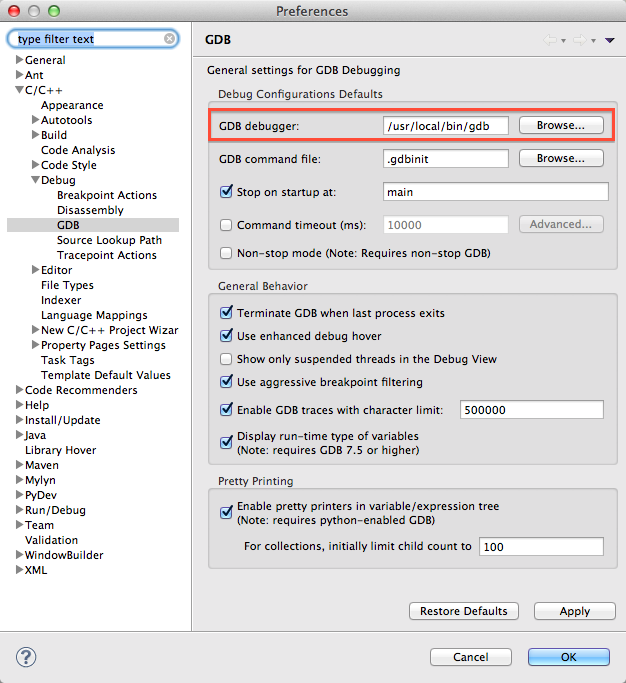
Getting it to Work with Eclipse
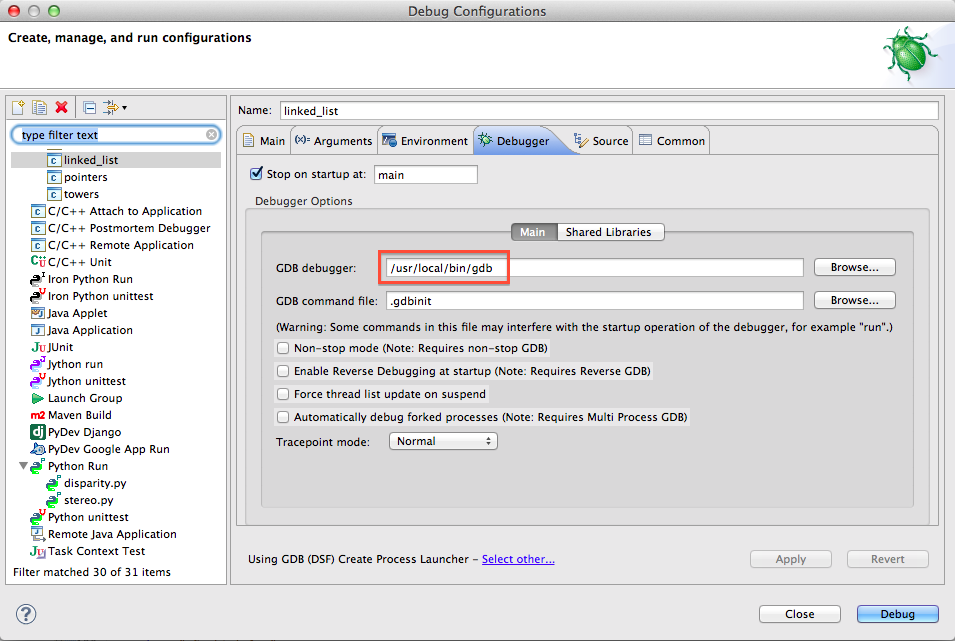
There’s one more step for Eclipse users. You need to specify where Eclipse can find the new GDB. Specify the path to GDB in Preferences > C/C++ > Debug > GDB:
If you already have some debug configurations, you may need to edit them individually to point to the correct place (under Run > Debug Configurations…):
- The CDT developers are planning to support LLDB, but they will have to write a whole new interface, and I think most of them only work on Eclipse in their spare time, so it will likely be at least some months before LLDB support is there.
- The procedure is derived from this StackOverflow post and this GDB Wiki page.
- If you are unable to save it to the System keychain, then save it to the login keychain. You can later export the cert, and then import it into the System keychain. I didn’t have to do this, so comment if you have any problem.
Three years ago I published “Debugging Failure: Check List and Hints” and unfortunately this article is one of the most popular ones: obviously debugging problems are very common. Debugging with GDB works usually fine, but if things are failing, then it can be hard to find the cause for it. Recently I have been asked to check some failures, so here are two more hints about what could go wrong…

Error while launching command: arm-none-eabi-gdb –version
I’m assuming a cross-debugging environment with Eclipse, the Eclipse GDB client and an external GDB server (see “GDB Client and Server: Unlocking GDB“) with the GNU MCU Eclipse plugins (although behaviour can be very similar for other combinations).
GDB Debugger Version

Debugger Console
As a diagnostic hint: check the version of the debugger/gdb in the Debugger console view. Verify that this version matches what you *think* you are using.
One common problem is that cygwin or other tool chains are installed and have changed the global system path, and the wrong toolchain and GDB gets used. Mixing different GNU versions (compiler/debugger) is always a bad thing.
💡 see the next sections about which GNU tools are used.
Error while launching command: arm-none-eabi-gdb –version
Error while launching command: arm-none-eabi-gdb –version
If you get that error, this basically means that the gdb has not been found and cannot be launched.
Check your global toolchain folder if the gdb executable really exists in that path. Below is the setting for the machine:

Global Toolchain Folder
There is the possibility to overwrite the global setting with a setting for the workspace. I keep it usually empty (so it uses the global setting), but check that path as well:

Workspace Toolchain Path
Lastly, there is setting for each project. If it is empty, then it uses the workspace setting. So check that project setting too:

Project Toolchain Path
Check as well in the debugger launch configuration if the settings are correct:

Debugger Launch Configuration
For the GDB Client executable, you might consider directly to point to the gdb executable to avoid any path search issues.
Global System Path used in Eclipse
The other thing to check is the global system path used by Eclipse when it launches an executable. You can find this in the screenshot below in the workspace settings:

System Path in Eclipse Workspace Settings
With this, I hope you can find the problem. Otherwise have a read in the articles listed in the Links section below.
Happy Debugging 🙂
Links
- Debugging Failure: Check List and Hints
- Troubleshooting Tips for FreeRTOS Thread Aware Debugging in Eclipse
- Board Bring-Up Tips, GDB Logs and Traces in Eclipse
- Solving “Launching: Configuring GDB Aborting Configuring GDB”
Join the DZone community and get the full member experience.
Join For Free
Three years ago, I published “Debugging Failure: Checklist and Hints” and unfortunately, that article is one of my most popular ones: Obviously, debugging problems are very common. Debugging with GDB usually works fine, but if things are failing, then it can be hard to find the cause for it. Recently, I was asked to check some failures, so here are two more hints about what could go wrong…
Error while launching command: arm-none-eabi-gdb –version
For this post, I’m assuming a cross-debugging environment with Eclipse, the Eclipse GDB client, and an external GDB server (see GDB Client and Server: Unlocking GDB) with the GNU MCU Eclipse plugins (although the behavior can be very similar for other combinations).
GDB Debugger Version
Debugger console
As a diagnostic hint: Check the version of the debugger/GDB in the debugger console view. Verify that this version matches what you think you are using.
One common problem is that cygwin or other toolchains are installed and have changed the global system path — leading to the wrong toolchain and GDB being used. Mixing different GNU versions (compiler/debugger) is always a bad thing.
Error While Launching the Command: arm-none-eabi-gdb –version
Error while launching the command: arm-none-eabi-gdb –version
If you get that error, this basically means that the GDB has not been found and cannot be launched.
Check your global toolchain folder to see if the GDB executable really exists in that path. Below is the setting for the machine:
Global toolchain folder
There is the possibility to overwrite the global setting with a setting for the workspace. I usually keep it empty (so it uses the global setting), but check that path as well:
Workspace toolchain path
Lastly, there is the setting for each project. If it is empty, then it uses the workspace setting. So check that project setting, too:
Project toolchain path
Also check in the debugger launch configuration to see if the settings are correct:
Debugger launch configuration
For the GDB client executable, you might consider directly pointing to the GDB executable to avoid any path search issues.
Global System Path Used in Eclipse
The other thing to check is the global system path used by Eclipse when it launches an executable. You can find this in the screenshot below in the workspace settings:
System path in Eclipse workspace settings
With this, I hope you can find the problem. Otherwise, read the articles listed in the Links section below.
Happy debugging!
Links
- Debugging Failure: Checklist and Hints
- Troubleshooting Tips for FreeRTOS Thread Aware Debugging in Eclipse
- Board Bring-Up Tips, GDB Logs, and Traces in Eclipse
- Solving “Launching: Configuring GDB Aborting Configuring GDB”
Eclipse