-
Описание ошибки
-
Решение проблемы
-
В Internet Explorer
-
В приложениях и играх
Технологии не стоят на месте. Вспомните, какими были сайты 15 лет назад. Лишь текст на цветном фоне. Ни анимации, ни плавных переходов, ни разнообразия функций. Сейчас же многие визуальные эффекты и функции реализованы с помощью скриптов. Так давайте рассмотрим, как исправить ошибку сценария в Windows?
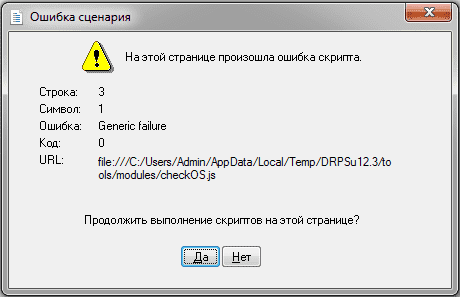
Описание ошибки
Ошибка сценария – это сбой в работе скрипта, который выполняет ту или иную функцию на веб странице. И не удивляйтесь, если подобная проблема появилась во время игры, установленной на ПК, – они тоже реализуют свой функционал с помощью JavaScript и Visual Basic. К счастью, никаких фатальных последствий для личных данных и системы в целом ошибка скрипта не представляет. А лечится проблема несколькими простыми способами.
Решение проблемы
Универсальных способов не существует, поэтому для начала нужно знать, при использовании чего появляется сообщение о сбое. Не удивительно, что в нашем списке есть Internet Explorer – браузер лидирует во многих антирейтингах по стабильности и производительности, поэтому рекомендуется заменить его на более качественный аналог. Возможно, это и будет лучшим решением данной проблемы.
В Internet Explorer
Но если вы истинный фанат софта от Microsoft или просто прикипели за долгие годы к приложению, то выполните следующее:
- Откройте браузер и перейдите на страницу, на которой отображалось сообщение об ошибке.
- Обновите страницу с очисткой кэша, нажав Ctrl+F5.
- Проверьте наличие проблемы.
Если ошибка скрипта не появляется – поздравляю! Иначе – переходите к следующим пунктам:
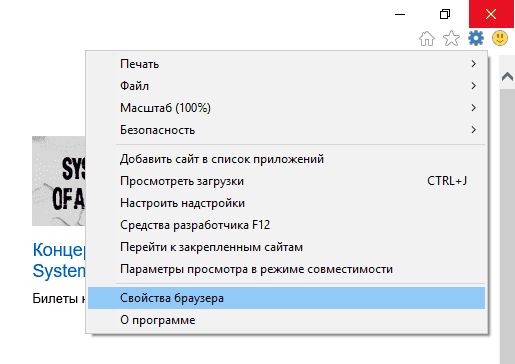
- Перейдите в «Меню» – «Свойства браузера».

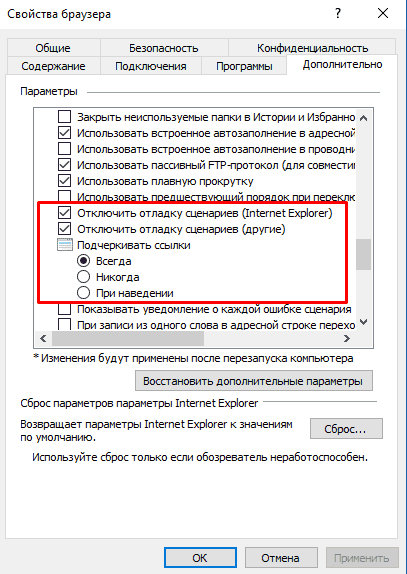
- Откройте вкладку «Дополнительно».
- Установите параметры работы скриптов в соответствии с данными на скриншоте.

- Сохраняем параметры нажатием кнопки «ОК».
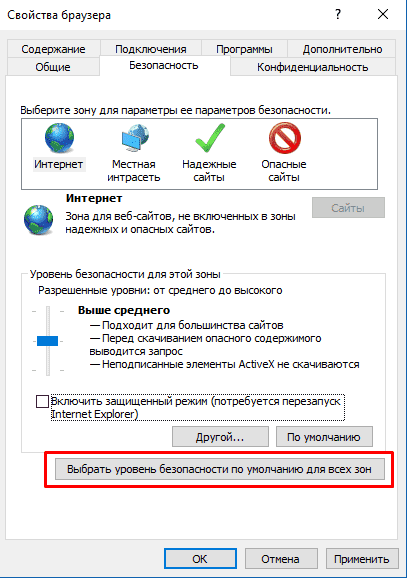
- Далее перейдите во вкладку «Безопасность» и нажмите кнопку «Выбрать уровень безопасности по умолчанию для всех зон».

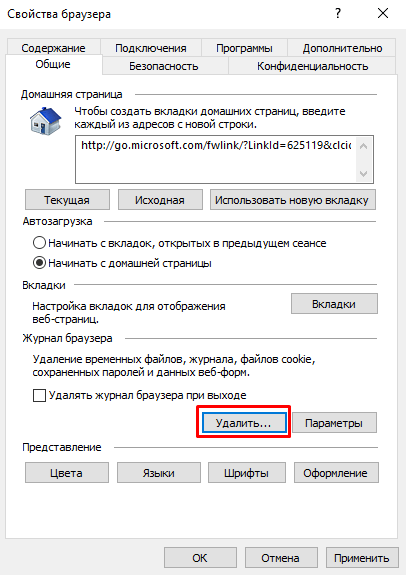
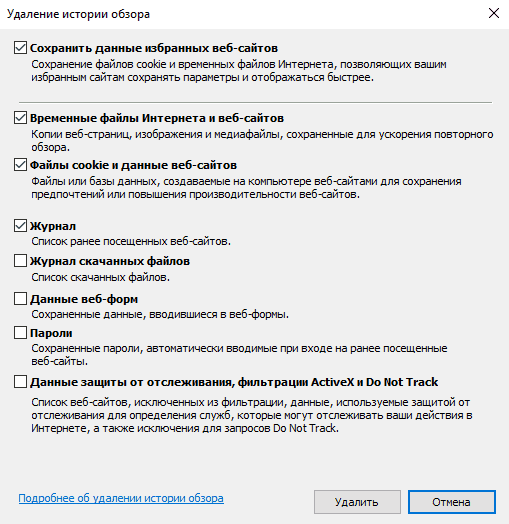
- После этого откройте вкладку «Общие» и нажмите кнопку «Удалить» в подкатегории «Журнал браузера».

- Выберите все поля и нажмите кнопку «Удалить».

Внимание! При очистке паролей все сохраненные данные для входа на сайты удалятся! Убедитесь, что знаете всю необходимую информацию. В противном случае не отмечайте пункт «Пароли».
В приложениях и играх
Для решения проблем с ошибкой сценария в приложениях и играх выполните несколько шагов:
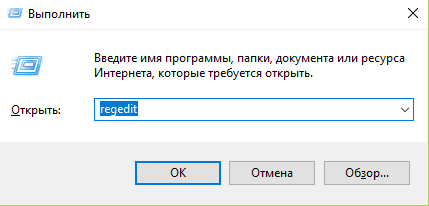
- Откройте окно «Выполнить» нажав Win+R.
- В текстовое поле окна введите
regeditи нажмите «ОК».

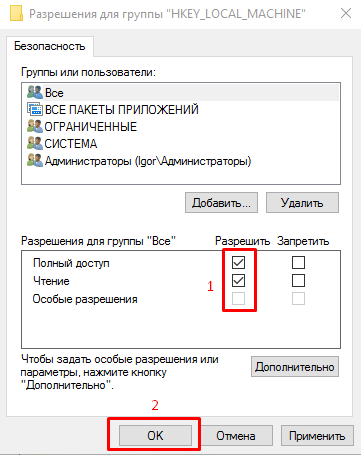
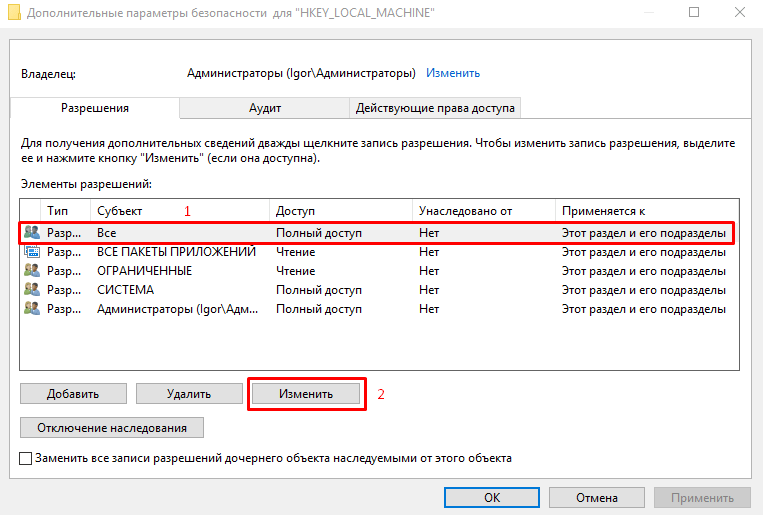
- В новом окне ищем HKEY_LOCAL_MACHINE, нажимаем ПКМ по полю и выбираем пункт «Разрешения».
- Ставим галочки напротив всех доступных полей в столбце «Разрешить».

- Далее нажимаем кнопку «Дополнительно».
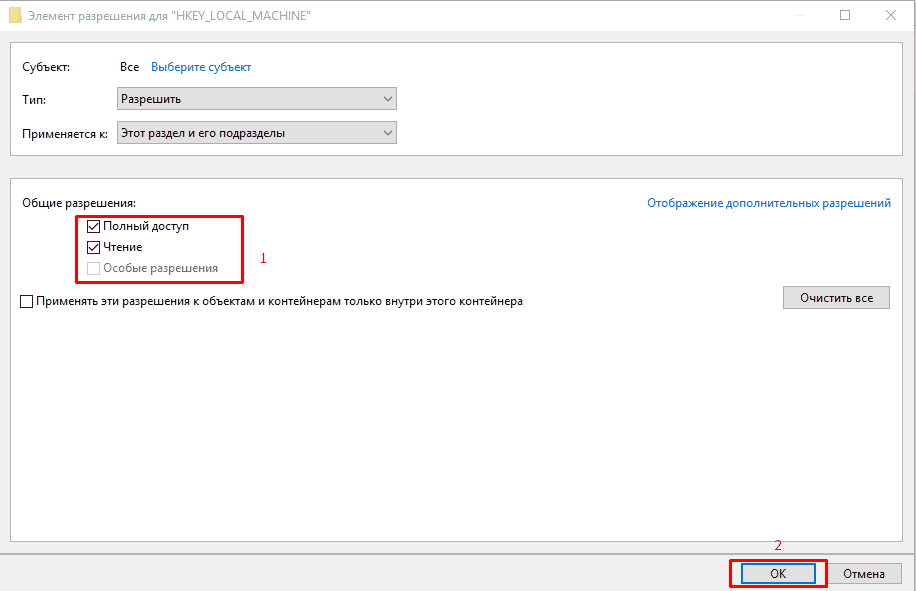
- Кликаем на поле, где в столбце «Субъект» стоит значение «Все» и нажимаем кнопку «Изменить».

- В новом окне устанавливаем галочку возле поля «Полный доступ» и нажимаем «ОК».

- Перезагружаем компьютер.
Теперь осталось зарегистрировать внесенные изменения:
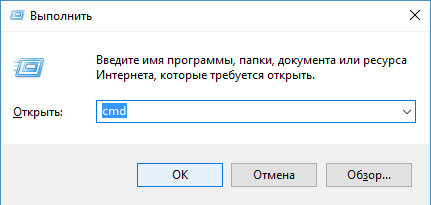
- Откройте окно «Выполнить» нажав Win+R.
- Введите команду
cmdи нажмите «ОК».

- В командной строке наберите
regsvr32 msxml.dllи нажмите Enter. - Перезапустите устройство.
Выше представлены исчерпывающие методы, которые работают в 99% случаев. Теперь вы знаете, что такое ошибка скрипта и как ее исправить. Если известен какой-либо другой способ – поделитесь им в комментариях. Удачи!
JavaScript Errors Handbook
This README contains information that I’ve learned over the years about dealing with JavaScript errors, reporting them to the server, and navigating through a lot of bugs that can make this all really hard. Browsers have improved in this area, but there is still room left to improve to make sure that all applications can sanely and soundly handle any error that happens.
Test cases for content found in this guide can be found at https://mknichel.github.io/javascript-errors/.
Table of Contents
- Introduction
- Anatomy of a JavaScript Error
- Producing a JavaScript Error
- Error Messages
- Stack Trace Format
- Catching JavaScript Errors
- window.onerror
- try/catch
- Protected Entry Points
- Promises
- Web Workers
- Chrome Extensions
Introduction
Catching, reporting, and fixing errors is an important part of any application to ensure the health and stability of the application. Since JavaScript code is also executed on the client and in many different browser environments, staying on top of JS Errors from your application can also be hard. There are no formal web specs for how to report JS errors which cause differences in each browser’s implementation. Additionally, there have been many bugs in browsers’ implementation of JavaScript errors as well that have made this even harder. This page navigates through these aspects of JS Errors so that future developers can handle errors better and browsers will hopefully converge on standardized solutions.
Anatomy of a JavaScript Error
A JavaScript error is composed of two primary pieces: the error message and the stack trace. The error message is a string that describes what went wrong, and the stack trace describes where in the code the error happened. JS Errors can be produced either by the browser itself or thrown by application code.
Producing a JavaScript Error
A JS Error can be thrown by the browser when a piece of code doesn’t execute properly, or it can be thrown directly by code.
For example:
In this example, a variable that is actually a number can’t be invoked as a function. The browser will throw an error like TypeError: a is not a function with a stack trace that points to that line of code.
A developer might also want to throw an error in a piece of code if a certain precondition is not met. For example
if (!checkPrecondition()) {
  throw new Error("Doesn't meet precondition!");
}
In this case, the error will be Error: Doesn't meet precondition!. This error will also contain a stack trace that points to the appropriate line. Errors thrown by the browser and application code can be handled the same.
There are multiple ways that developers can throw an error in JavaScript:
throw new Error('Problem description.')throw Error('Problem description.')<— equivalent to the first onethrow 'Problem description.'<— badthrow null<— even worse
Throwing a string or null is really not recommended since the browser will not attach a stack trace to that error, losing the context of where that error ocurred in the code. It is best to throw an actual Error object, which will contain the error message as well as a stack trace that points to the right lines of code where the error happened.
Error Messages
Each browser has its own set of messages that it uses for the built in exceptions, such as the example above for trying to call a non-function. Browsers will try to use the same messages, but since there is no spec, this is not guaranteed. For example, both Chrome and Firefox use {0} is not a function for the above example while IE11 will report Function expected (notably also without reporting what variable was attempted to be called).
However, browsers tend to diverge often as well. When there are multiple default statements in a switch statement, Chrome will throw "More than one default clause in switch statement" while Firefox will report "more than one switch default". As new features are added to the web, these error messages have to be updated. These differences can come into play later when you are trying to handle reported errors from obfuscated code.
You can find the templates that browsers use for error messages at:
- Firefox — http://mxr.mozilla.org/mozilla1.9.1/source/js/src/js.msg
- Chrome — https://code.google.com/p/v8/source/browse/branches/bleeding_edge/src/messages.js
- Internet Explorer — https://github.com/Microsoft/ChakraCore/blob/4e4d4f00f11b2ded23d1885e85fc26fcc96555da/lib/Parser/rterrors.h
 Browsers will produce different error messages for some exceptions.
Stack Trace Format
The stack trace is a description of where the error happened in the code. It is composed of a series of frames, where each frames describe a particular line in the code. The topmost frame is the location where the error was thrown, while the subsequent frames are the function call stack — or how the code was executed to get to that point where the error was thrown. Since JavaScript is usually concatenated and minified, it is also important to have column numbers so that the exact statement can be located when a given line has a multitude of statements.
A basic stack trace in Chrome looks like:
  at throwError (http://mknichel.github.io/javascript-errors/throw-error-basic.html:8:9)
  at http://mknichel.github.io/javascript-errors/throw-error-basic.html:12:3
Each stack frame consists of a function name (if applicable and the code was not executed in the global scope), the script that it came from, and the line and column number of the code.
Unfortunately, there is no standard for the stack trace format so this differs by browser.
Microsoft Edge and IE 11’s stack trace looks similar to Chrome’s except it explicitly lists Global code:
  at throwError (http://mknichel.github.io/javascript-errors/throw-error-basic.html:8:3)
  at Global code (http://mknichel.github.io/javascript-errors/throw-error-basic.html:12:3)
Firefox’s stack trace looks like:
  throwError@http://mknichel.github.io/javascript-errors/throw-error-basic.html:8:9
  @http://mknichel.github.io/javascript-errors/throw-error-basic.html:12:3
Safari’s format is similar to Firefox’s format but is also slightly different:
  throwError@http://mknichel.github.io/javascript-errors/throw-error-basic.html:8:18
  global code@http://mknichel.github.io/javascript-errors/throw-error-basic.html:12:13
The same basic information is there, but the format is different.
Also note that in the Safari example, aside from the format being different than Chrome, the column numbers are different than both Chrome and Firefox. The column numbers also can deviate more in different error situations — for example in the code (function namedFunction() { throwError(); })();, Chrome will report the column for the throwError() function call while IE11 reports the column number as the start of the string. These differences will come back into play later when the server needs to parse the stack trace for reported errors and deobfuscate obfuscated stack traces.
See https://developer.mozilla.org/en-US/docs/Web/JavaScript/Reference/Global_Objects/Error/Stack for more information on the stack property of errors. When accessing the Error.stack property, Chrome does include the error message as part of the stack but Safari 10+ does not.
The format of stack traces is different by browser in form and column numbers used.
Diving in more, there are a lot of nuances to stack trace formats that are discussed in the below sections.
Naming anonymous functions
By default, anonymous functions have no name and either appear as empty string or «Anonymous function» in the function names in the stack trace (depending on the browser). To improve debugging, you should add a name to all functions to ensure it appears in the stack frame. The easiest way to do this is to ensure that anonymous functions are specified with a name, even if that name is not used anywhere else. For example:
setTimeout(function nameOfTheAnonymousFunction() { ... }, 0);
This will cause the stack trace to go from:
at http://mknichel.github.io/javascript-errors/javascript-errors.js:125:17
to
at nameOfTheAnonymousFunction (http://mknichel.github.io/javascript-errors/javascript-errors.js:121:31)
In Safari, this would go from:
https://mknichel.github.io/javascript-errors/javascript-errors.js:175:27
to
nameOfTheAnonymousFunction@https://mknichel.github.io/javascript-errors/javascript-errors.js:171:41
This method ensures that nameOfTheAnonymousFunction appears in the frame for any code from inside that function, making debugging much easier. See http://www.html5rocks.com/en/tutorials/developertools/async-call-stack/#toc-debugging-tips for more information.
Assigning functions to a variable
Browsers will also use the name of the variable or property that a function is assigned to if the function itself does not have a name. For example, in
var fnVariableName = function() { ... };
browsers will use fnVariableName as the name of the function in stack traces.
    at throwError (http://mknichel.github.io/javascript-errors/javascript-errors.js:27:9)
    at fnVariableName (http://mknichel.github.io/javascript-errors/javascript-errors.js:169:37)
Even more nuanced than that, if this variable is defined within another function, all browsers will use just the name of the variable as the name of the function in the stack trace except for Firefox, which will use a different form that concatenates the name of the outer function with the name of the inner variable. Example:
function throwErrorFromInnerFunctionAssignedToVariable() {
  var fnVariableName = function() { throw new Error("foo"); };
  fnVariableName();
}
will produce in Firefox:
throwErrorFromInnerFunctionAssignedToVariable/fnVariableName@http://mknichel.github.io/javascript-errors/javascript-errors.js:169:37
In other browsers, this would look like:
at fnVariableName (http://mknichel.github.io/javascript-errors/javascript-errors.js:169:37)
Firefox uses different stack frame text for functions defined within another function.
displayName Property
The display name of a function can also be set by the displayName property in all major browsers except for IE11. In these browsers, the displayName will appear in the devtools debugger, but in all browsers but Safari, it will not be used in Error stack traces (Safari differs from the rest by also using the displayName in the stack trace associated with an error).
var someFunction = function() {};
someFunction.displayName = " # A longer description of the function.";
There is no official spec for the displayName property, but it is supported by all the major browsers. See https://developer.mozilla.org/en-US/docs/Web/JavaScript/Reference/Global_Objects/Function/displayName and http://www.alertdebugging.com/2009/04/29/building-a-better-javascript-profiler-with-webkit/ for more information on displayName.
IE11 doesn’t support the displayName property.
Safari uses the displayName property as the symbol name in Error stack traces.
Programatically capturing stack traces
If an error is reported without a stack trace (see more details when this would happen below), then it’s possible to programatically capture a stack trace.
In Chrome, this is really easy to do by using the Error.captureStackTrace API. See https://github.com/v8/v8/wiki/Stack%20Trace%20API for more information on the use of this API.
For example:
function ignoreThisFunctionInStackTrace() {
  var err = new Error();
  Error.captureStackTrace(err, ignoreThisFunctionInStackTrace);
  return err.stack;
}
In other browsers, a stack trace can also be collected by creating a new error and accessing the stack property of that object:
var err = new Error('');
return err.stack;
However, IE10 only populates the stack trace when the error is actually thrown:
try {
  throw new Error('');
} catch (e) {
  return e.stack;
}
If none of these approaches work, then it’s possible to create a rough stack trace without line numbers or columns by iterating over the arguments.callee.caller object — this won’t work in ES5 Strict Mode though and it’s not a recommended approach.
Async stack traces
It is very common for asynchronous points to be inserted into JavaScript code, such as when code uses setTimeout or through the use of Promises. These async entry points can cause problems for stack traces, since they cause a new execution context to form and the stack trace starts from scratch again.
Chrome DevTools has support for async stack traces, or in other words making sure the stack trace of an error also shows the frames that happened before the async point was introduced. With the use of setTimeout, this will capture who called the setTimeout function that eventually produced an error. See http://www.html5rocks.com/en/tutorials/developertools/async-call-stack/ for more information.
An async stack trace will look like:
  throwError	@	throw-error.js:2
  setTimeout (async)
  throwErrorAsync	@	throw-error.js:10
  (anonymous function)	@	throw-error-basic.html:14
Async stack traces are only supported in Chrome DevTools right now, only for exceptions that are thrown when DevTools are open. Stack traces accessed from Error objects in code will not have the async stack trace as part of it.
It is possible to polyfill async stack traces in some cases, but this could cause a significant performance hit for your application since capturing a stack trace is not cheap.
Only Chrome DevTools natively supports async stack traces.
Naming inline scripts and eval
Stack traces for code that was eval’ed or inlined into a HTML page will use the page’s URL and line/column numbers for the executed code.
For example:
  at throwError (http://mknichel.github.io/javascript-errors/throw-error-basic.html:8:9)
  at http://mknichel.github.io/javascript-errors/throw-error-basic.html:12:3
If these scripts actually come from a script that was inlined for optimization reasons, then the URL, line, and column numbers will be wrong. To work around this problem, Chrome and Firefox support the //# sourceURL= annotation (Safari, Edge, and IE do not). The URL specified in this annotation will be used as the URL for all stack traces, and the line and column number will be computed relative to the start of the <script> tag instead of the HTML document. For the same error as above, using the sourceURL annotation with a value of «inline.js» will produce a stack trace that looks like:
  at throwError (http://mknichel.github.io/javascript-errors/inline.js:8:9)
  at http://mknichel.github.io/javascript-errors/inline.js:12:3
This is a really handy technique to make sure that stack traces are still correct even when using inline scripts and eval.
http://www.html5rocks.com/en/tutorials/developertools/sourcemaps/#toc-sourceurl describes the sourceURL annotation in more detail.
Safari, Edge, and IE do not support the sourceURL annotation for naming inline scripts and evals. If you use inline scripts in IE or Safari and you obfuscate your code, you will not be able to deobfuscate errors that come from those scripts.
Up until Chrome 42, Chrome did not compute line numbers correctly for inline scripts that use the sourceURL annotation. See https://bugs.chromium.org/p/v8/issues/detail?id=3920 for more information.
Line numbers for stack frames from inline scripts are incorrect when the sourceURL annotation is used since they are relative to the start of the HTML document instead of the start of the inline script tag (making correct deobfuscation not possible). https://code.google.com/p/chromium/issues/detail?id=578269
Eval stack traces
For code that uses eval, there are other differences in the stack trace besides whether or not it uses the sourceURL annotation. In Chrome, a stack trace from a statement used in eval could look like:
Error: Error from eval
    at evaledFunction (eval at evalError (http://mknichel.github.io/javascript-errors/javascript-errors.js:137:3), <anonymous>:1:36)
    at eval (eval at evalError (http://mknichel.github.io/javascript-errors/javascript-errors.js:137:3), <anonymous>:1:68)
    at evalError (http://mknichel.github.io/javascript-errors/javascript-errors.js:137:3)
In MS Edge and IE11, this would look like:
Error from eval
    at evaledFunction (eval code:1:30)
    at eval code (eval code:1:2)
    at evalError (http://mknichel.github.io/javascript-errors/javascript-errors.js:137:3)
In Safari:
Error from eval
    evaledFunction
    eval code
    eval@[native code]
    evalError@http://mknichel.github.io/javascript-errors/javascript-errors.js:137:7
and in Firefox:
Error from eval
    evaledFunction@http://mknichel.github.io/javascript-errors/javascript-errors.js line 137 > eval:1:36
    @http://mknichel.github.io/javascript-errors/javascript-errors.js line 137 > eval:1:11
    evalError@http://mknichel.github.io/javascript-errors/javascript-errors.js:137:3
These differences can make it hard to parse eval code the same across all browsers.
Each browser uses a different stack trace format for errors that happened inside eval.
Stack traces with native frames
Your JavaScript code can also be called directly from native code. Array.prototype.forEach is a good example — you pass a function to forEach and the JS engine will call that function for you.
function throwErrorWithNativeFrame() {
  var arr = [0, 1, 2, 3];
  arr.forEach(function namedFn(value) {
    throwError();
  });
}
This produces different stack traces in different browsers. Chrome and Safari append the name of the native function in the stack trace itself as a separate frame, such as:
(Chrome)
    at namedFn (http://mknichel.github.io/javascript-errors/javascript-errors.js:153:5)
    at Array.forEach (native)
    at throwErrorWithNativeFrame (http://mknichel.github.io/javascript-errors/javascript-errors.js:152:7)

(Safari)
    namedFn@http://mknichel.github.io/javascript-errors/javascript-errors.js:153:15
    forEach@[native code]
    throwErrorWithNativeFrame@http://mknichel.github.io/javascript-errors/javascript-errors.js:152:14

(Edge)
    at namedFn (http://mknichel.github.io/javascript-errors/javascript-errors.js:153:5)
    at Array.prototype.forEach (native code)
    at throwErrorWithNativeFrame (http://mknichel.github.io/javascript-errors/javascript-errors.js:152:7)
However, Firefox and IE11 do not show that forEach was called as part of the stack:
namedFn@http://mknichel.github.io/javascript-errors/javascript-errors.js:153:5
throwErrorWithNativeFrame@http://mknichel.github.io/javascript-errors/javascript-errors.js:152:3
Some browsers include native code frames in stack traces, while others do not.
Catching JavaScript Errors
To detect that your application had an error, some code must be able to catch that error and report about it. There are multiple techniques for catching errors, each with their pros and cons.
window.onerror
window.onerror is one of the easiest and best ways to get started catching errors. By assigning window.onerror to a function, any error that is uncaught by another part of the application will be reported to this function, along with some information about the error. For example:
window.onerror = function(msg, url, line, col, err) {
  console.log('Application encountered an error: ' + msg);
  console.log('Stack trace: ' + err.stack);
}
https://developer.mozilla.org/en-US/docs/Web/API/GlobalEventHandlers/onerror describes this in more detail.
Historically, there have been a few problems with this approach:
No Error object provided
The 5th argument to the window.onerror function is supposed to be an Error object. This was added to the WHATWG spec in 2013: https://html.spec.whatwg.org/multipage/webappapis.html#errorevent. Chrome, Firefox, and IE11 now properly provide an Error object (along with the critical stack property), but Safari, MS Edge, and IE10 do not. This works in Firefox since Firefox 14 (https://bugzilla.mozilla.org/show_bug.cgi?id=355430) and in Chrome since late 2013 (https://mikewest.org/2013/08/debugging-runtime-errors-with-window-onerror, https://code.google.com/p/chromium/issues/detail?id=147127). Safari 10 launched support for the Error object in window.onerror.
Safari (versions below 10), MS Edge, and IE10 do not support an Error object with a stack trace in window.onerror.
Cross domain sanitization
In Chrome, errors that come from another domain in the window.onerror handler will be sanitized to «Script error.», «», 0. This is generally okay if you really don’t want to process the error if it comes from a script that you don’t care about, so the application can filter out errors that look like this. However, this does not happen in Firefox or Safari or IE11, nor does Chrome do this for try/catch blocks that wrap the offending code.
If you would like to receive errors in window.onerror in Chrome with full fidelity from cross domain scripts, those resources must provide the appropriate cross origin headers. See https://mikewest.org/2013/08/debugging-runtime-errors-with-window-onerror for more information.
Chrome is the only browser that will sanitize errors that come from another origin. Take care to filter these out, or set the appropriate headers.
Chrome Extensions
In old versions of Chrome, Chrome extensions that are installed on a user’s machine could also throw errors that get reported to window.onerror. This has been fixed in newer versions of Chrome. See the dedicated Chrome Extensions section below.
window.addEventListener(«error»)
The window.addEventListener("error") API works the same as the window.onerror API. See http://www.w3.org/html/wg/drafts/html/master/webappapis.html#runtime-script-errors for more information on this approach.
Showing errors in DevTools console for development
Catching errors via window.onerror does not prevent that error from also appearing in the DevTools console. This is most likely the right behavior for development since the developer can easily see the error. If you don’t want these errors to show up in production to end users, e.preventDefault() can be called if using the window.addEventListener approach.
Recommendation
window.onerror is the best tool to catch and report JS errors. It’s recommended that only JS errors with valid Error objects and stack traces are reported back to the server, otherwise the errors may be hard to investigate or you may get a lot of spam from Chrome extensions or cross domain scripts.
try/catch
Given the above section, unfortunately it’s not possible to rely on window.onerror in all browsers to capture all error information. For catching exceptions locally, a try/catch block is the obvious choice. It’s also possible to wrap entire JavaScript files in a try/catch block to capture error information that can’t be caught with window.onerror. This improves the situations for browsers that don’t support window.onerror, but also has some downsides.
Doesn’t catch all errors
A try/catch block won’t capture all errors in a program, such as errors that are thrown from an async block of code through window.setTimeout. Try/catch can be used with Protected Entry Points to help fill in the gaps.
try/catch blocks wrapping the entire application aren’t sufficient to catch all errors.
Deoptimizations
Old versions of V8 (and potentially other JS engines), functions that contain a try/catch block won’t be optimized by the compiler (http://www.html5rocks.com/en/tutorials/speed/v8/). Chrome fixed this in TurboFan (https://codereview.chromium.org/1996373002).
Protected Entry Points
An «entry point» into JavaScript is any browser API that can start execution of your code. Examples include setTimeout, setInterval, event listeners, XHR, web sockets, or promises. Errors that are thrown from these entry points will be caught by window.onerror, but in the browsers that don’t support the full Error object in window.onerror, an alternative mechanism is needed to catch these errors since the try/catch method mentioned above won’t catch them either.
Thankfully, JavaScript allows these entry points to be wrapped so that a try/catch block can be inserted before the function is invoked to catch any errors thrown by the code.
Each entry point will need slightly different code to protect the entry point, but the gist of the methodology is:
function protectEntryPoint(fn) {
  return function protectedFn() {
    try {
      return fn();
    } catch (e) {
      // Handle error.
    }
  }
}
_oldSetTimeout = window.setTimeout;
window.setTimeout = function protectedSetTimeout(fn, time) {
  return _oldSetTimeout.call(window, protectEntryPoint(fn), time);
};
Promises
Sadly, it’s easy for errors that happen in Promises to go unobserved and unreported. Errors that happen in a Promise but are not handled by attaching a rejection handler are not reported anywhere else — they do not get reported to window.onerror. Even if a Promise attaches a rejection handler, that code itself must manually report those errors for them to be logged. See http://www.html5rocks.com/en/tutorials/es6/promises/#toc-error-handling for more information. For example:
window.onerror = function(...) {
  // This will never be invoked by Promise code.
};

var p = new Promise(...);
p.then(function() {
  throw new Error("This error will be not handled anywhere.");
});

var p2 = new Promise(...);
p2.then(function() {
  throw new Error("This error will be handled in the chain.");
}).catch(function(error) {
  // Show error message to user
  // This code should manually report the error for it to be logged on the server, if applicable.
});
One approach to capture more information is to use Protected Entry Points to wrap invocations of Promise methods with a try/catch to report errors. This might look like:
  var _oldPromiseThen = Promise.prototype.then;
  Promise.prototype.then = function protectedThen(callback, errorHandler) {
    return _oldPromiseThen.call(this, protectEntryPoint(callback), protectEntryPoint(errorHandler));
  };
Sadly, errors from Promises will go unhandled by default.
Error handling in Promise polyfills
Promise implementations, such as Q, Bluebird, and Closure handle errors in different ways which are better than the error handling in the browser implementation of Promises.
- In Q, you can «end» the Promise chain by calling
.done()which will make sure that if an error wasn’t handled in the chain, it will get rethrown and reported. See https://github.com/kriskowal/q#handling-errors - In Bluebird, unhandled rejections are logged and reported immediately. See http://bluebirdjs.com/docs/features.html#surfacing-unhandled-errors
- In Closure’s goog.Promise implementation, unhandled rejections are logged and reported if no chain in the Promise handles the rejection within a configurable time interval (in order to allow code later in the program to add a rejection handler).
Long stack traces
The async stack trace section above discusses that browsers don’t capture stack information when there is an async hook, such as calling Promise.prototype.then. Promise polyfills feature a way to capture the async stack trace points which can make diagnosing errors much easier. This approach is expensive, but it can be really useful for capturing more debug information.
- In Q, call
Q.longStackSupport = true;. See https://github.com/kriskowal/q#long-stack-traces - In Bluebird, call
Promise.longStackTraces()somewhere in the application. See http://bluebirdjs.com/docs/features.html#long-stack-traces. - In Closure, set
goog.Promise.LONG_STACK_TRACESto true.
Promise Rejection Events
Chrome 49 added support for events that are dispatched when a Promise is rejected. This allows applications to hook into Promise errors to ensure that they get centrally reported along with the rest of the errors.
window.addEventListener('unhandledrejection', event => {
  // event.reason contains the rejection reason. When an Error is thrown, this is the Error object.
});
See https://googlechrome.github.io/samples/promise-rejection-events/ and https://www.chromestatus.com/feature/4805872211460096 for more information.
This is not supported in any other browser.
Web Workers
Web workers, including dedicated workers, shared workers, and service workers, are becoming more popular in applications today. Since all of these workers are separate scripts from the main page, they each need their own error handling code. It is recommended that each worker script install its own error handling and reporting code for maximum effectiveness handling errors from workers.
Dedicated workers
Dedicated web workers execute in a different execution context than the main page, so errors from workers aren’t caught by the above mechanisms. Additional steps need to be taken to capture errors from workers on the page.
When a worker is created, the onerror property can be set on the new worker:
var worker = new Worker('worker.js');
worker.onerror = function(errorEvent) { ... };
This is defined in https://html.spec.whatwg.org/multipage/workers.html#handler-abstractworker-onerror. The onerror function on the worker has a different signature than the window.onerror discussed above. Instead of accepting 5 arguments, worker.onerror takes a single argument: an ErrorEvent object. The API for this object can be found at https://developer.mozilla.org/en-US/docs/Web/API/ErrorEvent. It contains the message, filename, line, and column, but no stable browser today contains the «Error» object that contains the stack trace (errorEvent.error is null). Since this API is executed in the parent page’s scope, it would be useful for using the same reporting mechanism as the parent page; unfortunately due to the lack of a stack trace, this API is of limited use.
Inside of the JS run by the worker, you can also define an onerror API that follows the usual window.onerror API: https://html.spec.whatwg.org/multipage/webappapis.html#onerroreventhandler. In the worker code:
self.onerror = function(message, filename, line, col, error) { ... };
The discussion of this API mostly follows the discussion above for window.onerror. However, there are 2 notable things to point out:
Firefox and Safari do not report the «error» object as the 5th argument to the function, so these browsers do not get a stack trace from the worker (Chrome, MS Edge, and IE11 do get a stack trace). Protected Entry Points for the onmessage function within the worker can be used to capture stack trace information for these browsers.
Since this code executes within the worker, the code must choose how to report the error back to the server: It must either use postMessage to communicate the error back to the parent page, or install an XHR error reporting mechanism (discussed more below) in the worker itself.
In Firefox, Safari, and IE11 (but not in Chrome), the parent page’s window.onerror function will also be called after the worker’s own onerror and the onerror event listener set by the page has been called. However, this window.onerror will also not contain an error object and therefore won’t have a stack trace also. These browsers must also take care to not report errors from workers multiple times.
Shared workers
Chrome and Firefox support the SharedWorker API for sharing a worker among multiple pages. Since the worker is shared, it is not attached to one parent page exclusively; this leads to some differences in how errors are handled, although SharedWorker mostly follows the same information as the dedicated web worker.
In Chrome, when there is an error in a SharedWorker, only the worker’s own error handling within the worker code itself will be called (like if they set self.onerror). The parent page’s window.onerror will not be called, and Chrome does not support the inherited AbstractWorker.onerror that can be called in the parent page as defined in the spec.
In Firefox, this behavior is different. An error in the shared worker will cause the parent page’s window.onerror to be called, but the error object will be null. Additionally, Firefox does support the AbstractWorker.onerror property, so the parent page can attach an error handler of its own to the worker. However, when this error handler is called, the error object will be null so there will be no stack trace, so it’s of limited use.
Error handling for shared workers differs by browser.
Service Workers
Service Workers are a brand new spec that is currently only available in recent Chrome and Firefox versions. These workers follow the same discussion as dedicated web workers.
Service workers are installed by calling the navigator.serviceWorker.register function. This function returns a Promise which will be rejected if there was an error installing the service worker, such as it throwing an error during initialization. This error will only contain a string message and nothing else. Additionally, since Promises don’t report errors to window.onerror handlers, the application itself would have to add a catch block to the Promise to catch the error.
navigator.serviceWorker.register('service-worker-installation-error.js').catch(function(error) {
  // error typeof string
});
Just like the other workers, service workers can set a self.onerror function within the service workers to catch errors. Installation errors in the service worker will be reported to the onerror function, but unfortunately they won’t contain an error object or stack trace.
The service worker API contains an onerror property inherited from the AbstractWorker interface, but Chrome does not do anything with this property.
Worker Try/Catch
To capture stack traces in Firefox + Safari within a worker, the onmessage function can be wrapped in a try/catch block to catch any errors that propagate to the top.
self.onmessage = function(event) {
  try {
    // logic here
  } catch (e) {
    // Report exception.
  }
};
The normal try/catch mechanism will capture stack traces for these errors, producing an exception that looks like:
Error from worker
throwError@http://mknichel.github.io/javascript-errors/worker.js:4:9
throwErrorWrapper@http://mknichel.github.io/javascript-errors/worker.js:8:3
self.onmessage@http://mknichel.github.io/javascript-errors/worker.js:14:7
Chrome Extensions
Chrome Extensions deserve their own section since errors in these scripts can operate slightly differently, and historically (but not anymore) errors from Chrome Extensions have also been a problem for large popular sites.
Content Scripts
Content scripts are scripts that run in the context of web pages that a user visits. These scripts run in an isolated execution environment so they can access the DOM but they can not access JavaScript on the parent page (and vice versa).
Since content scripts have their own execution environment, they can assign to the window.onerror handler in their own script and it won’t affect the parent page. However, errors caught by window.onerror in the content script are sanitized by Chrome resulting in a «Script error.» with null filename and 0 for line and column. This bug is tracked by https://code.google.com/p/chromium/issues/detail?id=457785. Until that bug is fixed, a try/catch block or protected entry points are the only ways to catch JS errors in a content script with stack traces.
In years past, errors from content scripts would be reported to the window.onerror handler of the parent page which could result in a large amount of spammy error reports for popular sites. This was fixed in late 2013 though (https://code.google.com/p/chromium/issues/detail?id=225513).
Errors in Chrome Extensions are sanitized before being handled by window.onerror.
Browser Actions
Chrome extensions can also generate browser action popups, which are small HTML pages that spawn when a user clicks a Chrome extension icon to the right of the URL bar. These pages can also run JavaScript, in an entirely different execution environment from everything else. window.onerror works properly for this JavaScript.
Reporting Errors to the Server
Once the client is configured to properly catch exceptions with correct stack traces, these exceptions should be reported back to the server so they can be tracked, analyzed, and then fixed. Typically this is done with a XHR endpoint that records the error message and the stack trace information, along with any relevant client context information, such as the version of the code that’s running, the user agent, the user’s locale, and the top level URL of the page.
If the application uses multiple mechanisms to catch errors, it’s important to not report the same error twice. Errors that contain a stack trace should be preferred; errors reported without a stack trace can be hard to track down in a large application.
- Назад
- Обзор: Первые шаги
- Далее
Когда вы создали игру «Угадай номер» в предыдущей статье, вы, возможно, обнаружили, что она не работает. Не бойтесь — эта статья призвана избавить вас от разрыва волос над такими проблемами, предоставив вам несколько простых советов о том, как найти и исправить ошибки в программах JavaScript.
| Нужно: | базовая компьютерная грамотность, базовое понимание HTML и CSS, понимание того, что такое JavaScript. |
|---|---|
| Цель | получить способность и уверенность в том, чтобы приступить к исправлению простых проблем в вашем собственном коде. |
Типы ошибок
Когда вы делаете что-то не так в коде, есть два основных типа ошибок, с которыми вы столкнётесь:
- Синтаксические ошибки: Это орфографические ошибки в коде, которые фактически заставляют программу вообще не запускаться, или перестать работать на полпути — вам также будут предоставлены некоторые сообщения об ошибках. Обычно они подходят для исправления, если вы знакомы с правильными инструментами и знаете, что означают сообщения об ошибках!
- Логические ошибки: Это ошибки, когда синтаксис действительно правильный, но код не тот, каким вы его предполагали, что означает, что программа работает успешно, но даёт неверные результаты. Их часто сложнее находить, чем синтаксические ошибки, так как обычно не возникает сообщение об ошибке, которое направляет вас к источнику ошибки.
Ладно, все не так просто — есть и другие отличия, которые вы поймёте, пока будете изучать язык JavaScript глубже. Однако вышеуказанной классификации достаточно на раннем этапе вашей карьеры. Мы рассмотрим оба эти типа в дальнейшем.
Ошибочный пример
Чтобы начать работу, давайте вернёмся к нашей игре с угадыванием чисел — за исключением того, что мы будем изучать версию с некоторыми преднамеренными ошибками. Перейдите в Github и сделайте себе локальную копию number-game-errors.html (см. здесь как это работает).
- Чтобы начать работу, откройте локальную копию внутри вашего любимого текстового редактора и вашего браузера.
- Попробуйте сыграть в игру — вы заметите, что когда вы нажимаете кнопку «Submit guess», она не работает!
Примечание: Возможно, у вас может быть собственная версия игрового примера, которая не работает, которую вы можете исправить! Мы по-прежнему хотели бы, чтобы вы работали над статьёй с нашей версией, чтобы вы могли изучать методы, которые мы здесь преподаём. Затем вы можете вернуться и попытаться исправить ваш пример.
На этом этапе давайте рассмотрим консоль разработчика, чтобы увидеть, можем ли мы видеть какие-либо синтаксические ошибки, а затем попытаемся их исправить. Вы узнаете, как это сделать, ниже.
Исправление синтаксических ошибок
Раньше в курсе мы заставили вас набрать некоторые простые команды JavaScript в консоль разработчика JavaScript (если вы не можете вспомнить, как открыть это в своём браузере, следуйте предыдущей ссылке, чтобы узнать, как это сделать). Что ещё более полезно, так это то, что консоль предоставляет вам сообщения об ошибках всякий раз, когда существует синтаксическая ошибка внутри JavaScript, которая подаётся в механизм JavaScript браузера. Теперь пойдём на охоту.
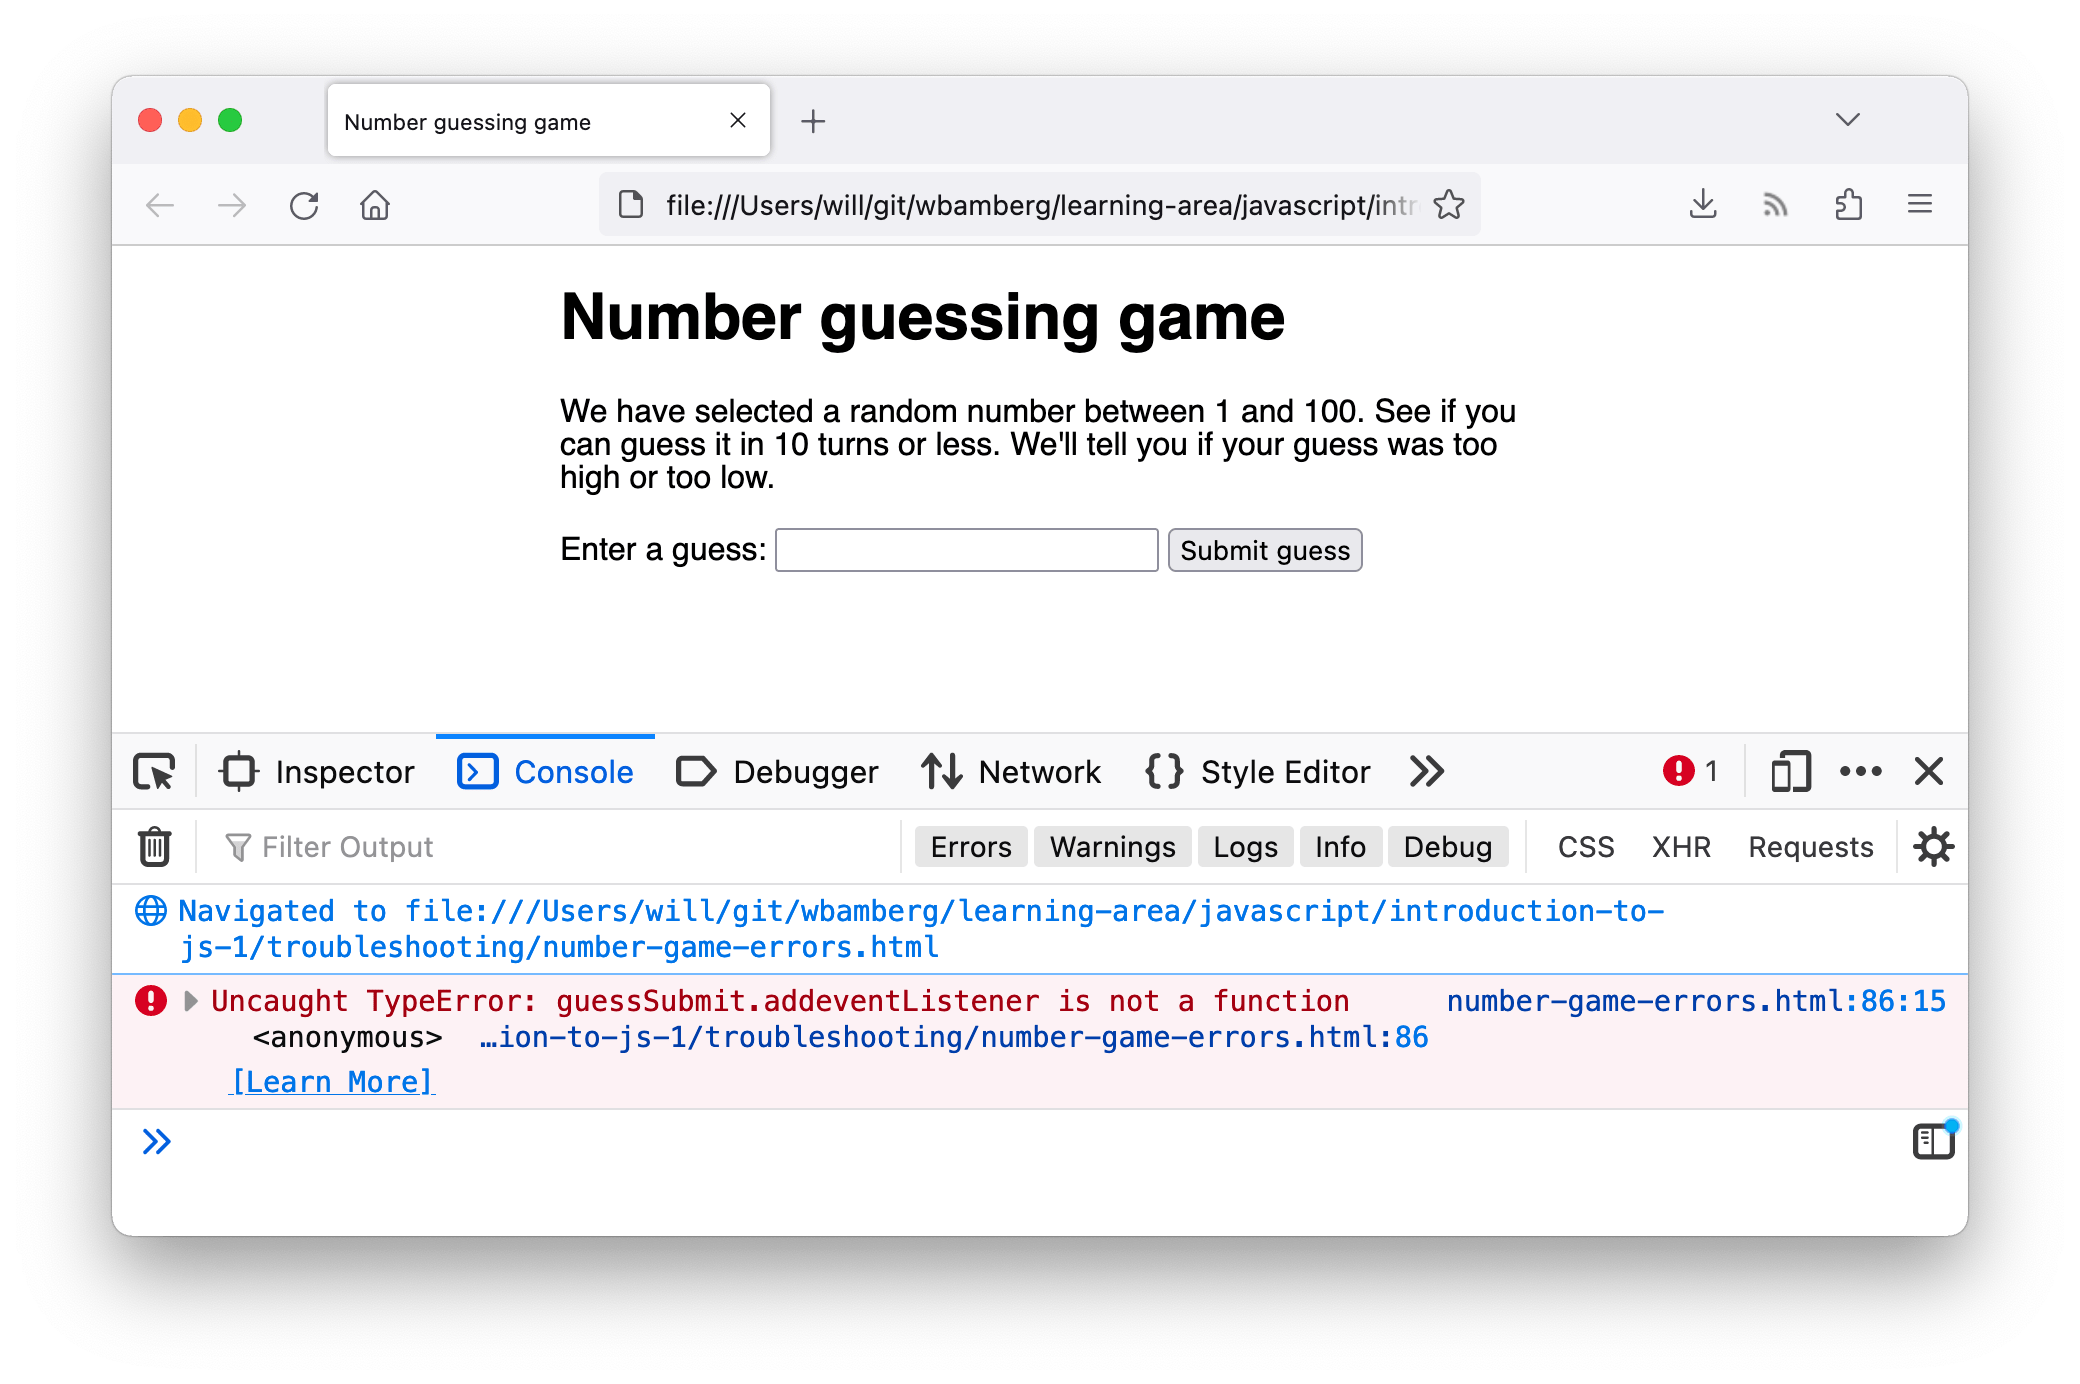
- Перейдите на вкладку, в которой у вас есть number-game-errors.html, и откройте консоль JavaScript. Вы должны увидеть сообщение об ошибке в следующих строках:

- Это довольно простая ошибка для отслеживания, и браузер даёт вам несколько полезных бит информации, которые помогут вам (скриншот выше от Firefox, но другие браузеры предоставляют аналогичную информацию). Слева направо, у нас есть:
- Красный «x» означает, что это ошибка.
- Сообщение об ошибке, указывающее, что пошло не так: «TypeError: guessSubmit.addeventListener не является функцией»
- Ссылка «Узнать больше», которая ссылается на страницу MDN, которая объясняет, что эта ошибка означает в огромных количествах деталей.
- Имя файла JavaScript, который ссылается на вкладку «Отладчик» консоли разработчика. Если вы перейдёте по этой ссылке, вы увидите точную строку, где подсвечивается ошибка.
- Номер строки, в которой находится ошибка, и номер символа в этой строке, где первая ошибка. В этом случае у нас есть строка 86, символ номер 3.
- Если мы посмотрим на строку 86 в нашем редакторе кода, мы найдём эту строку:
guessSubmit.addeventListener('click', checkGuess); - В сообщении об ошибке говорится, что «guessSubmit.addeventListener не является функцией», поэтому мы, вероятно, где-то ошиблись. Если вы не уверены в правильности написания синтаксиса, часто бывает полезно найти функцию на MDN. Лучший способ сделать это в настоящее время — поиск «mdn имя-функции» в вашей любимой поисковой системе. Вот ссылка, которая поможет сократить вам некоторое время в данном случае:
addEventListener(). - Итак, глядя на эту страницу, кажется, что ошибка в том, что мы неправильно назвали имя функции! Помните, что JavaScript чувствителен к регистру, поэтому любые незначительные отличия в орфографии или регистре текста могут вызвать ошибку. Изменение этого параметра в addEventListener должно быть исправлено. Сделайте это сейчас.
**Примечание:**См. наш TypeError: «x» не является справочной страницей функций для получения дополнительной информации об этой ошибке.
Синтаксические ошибки: второй раунд
Примечание: console.log() это часто используемая функция отладки, которая выводит значение в консоль. Поэтому она будет выводить значение lowOrHi в консоли, как только мы попытаемся установить его в строке 48.
- Сохраните и обновите страницу, и вы увидите, что ошибка исчезла.
- Теперь, если вы попробуете ввести значение и нажать кнопку «Submit guess», вы увидите … другую ошибку!
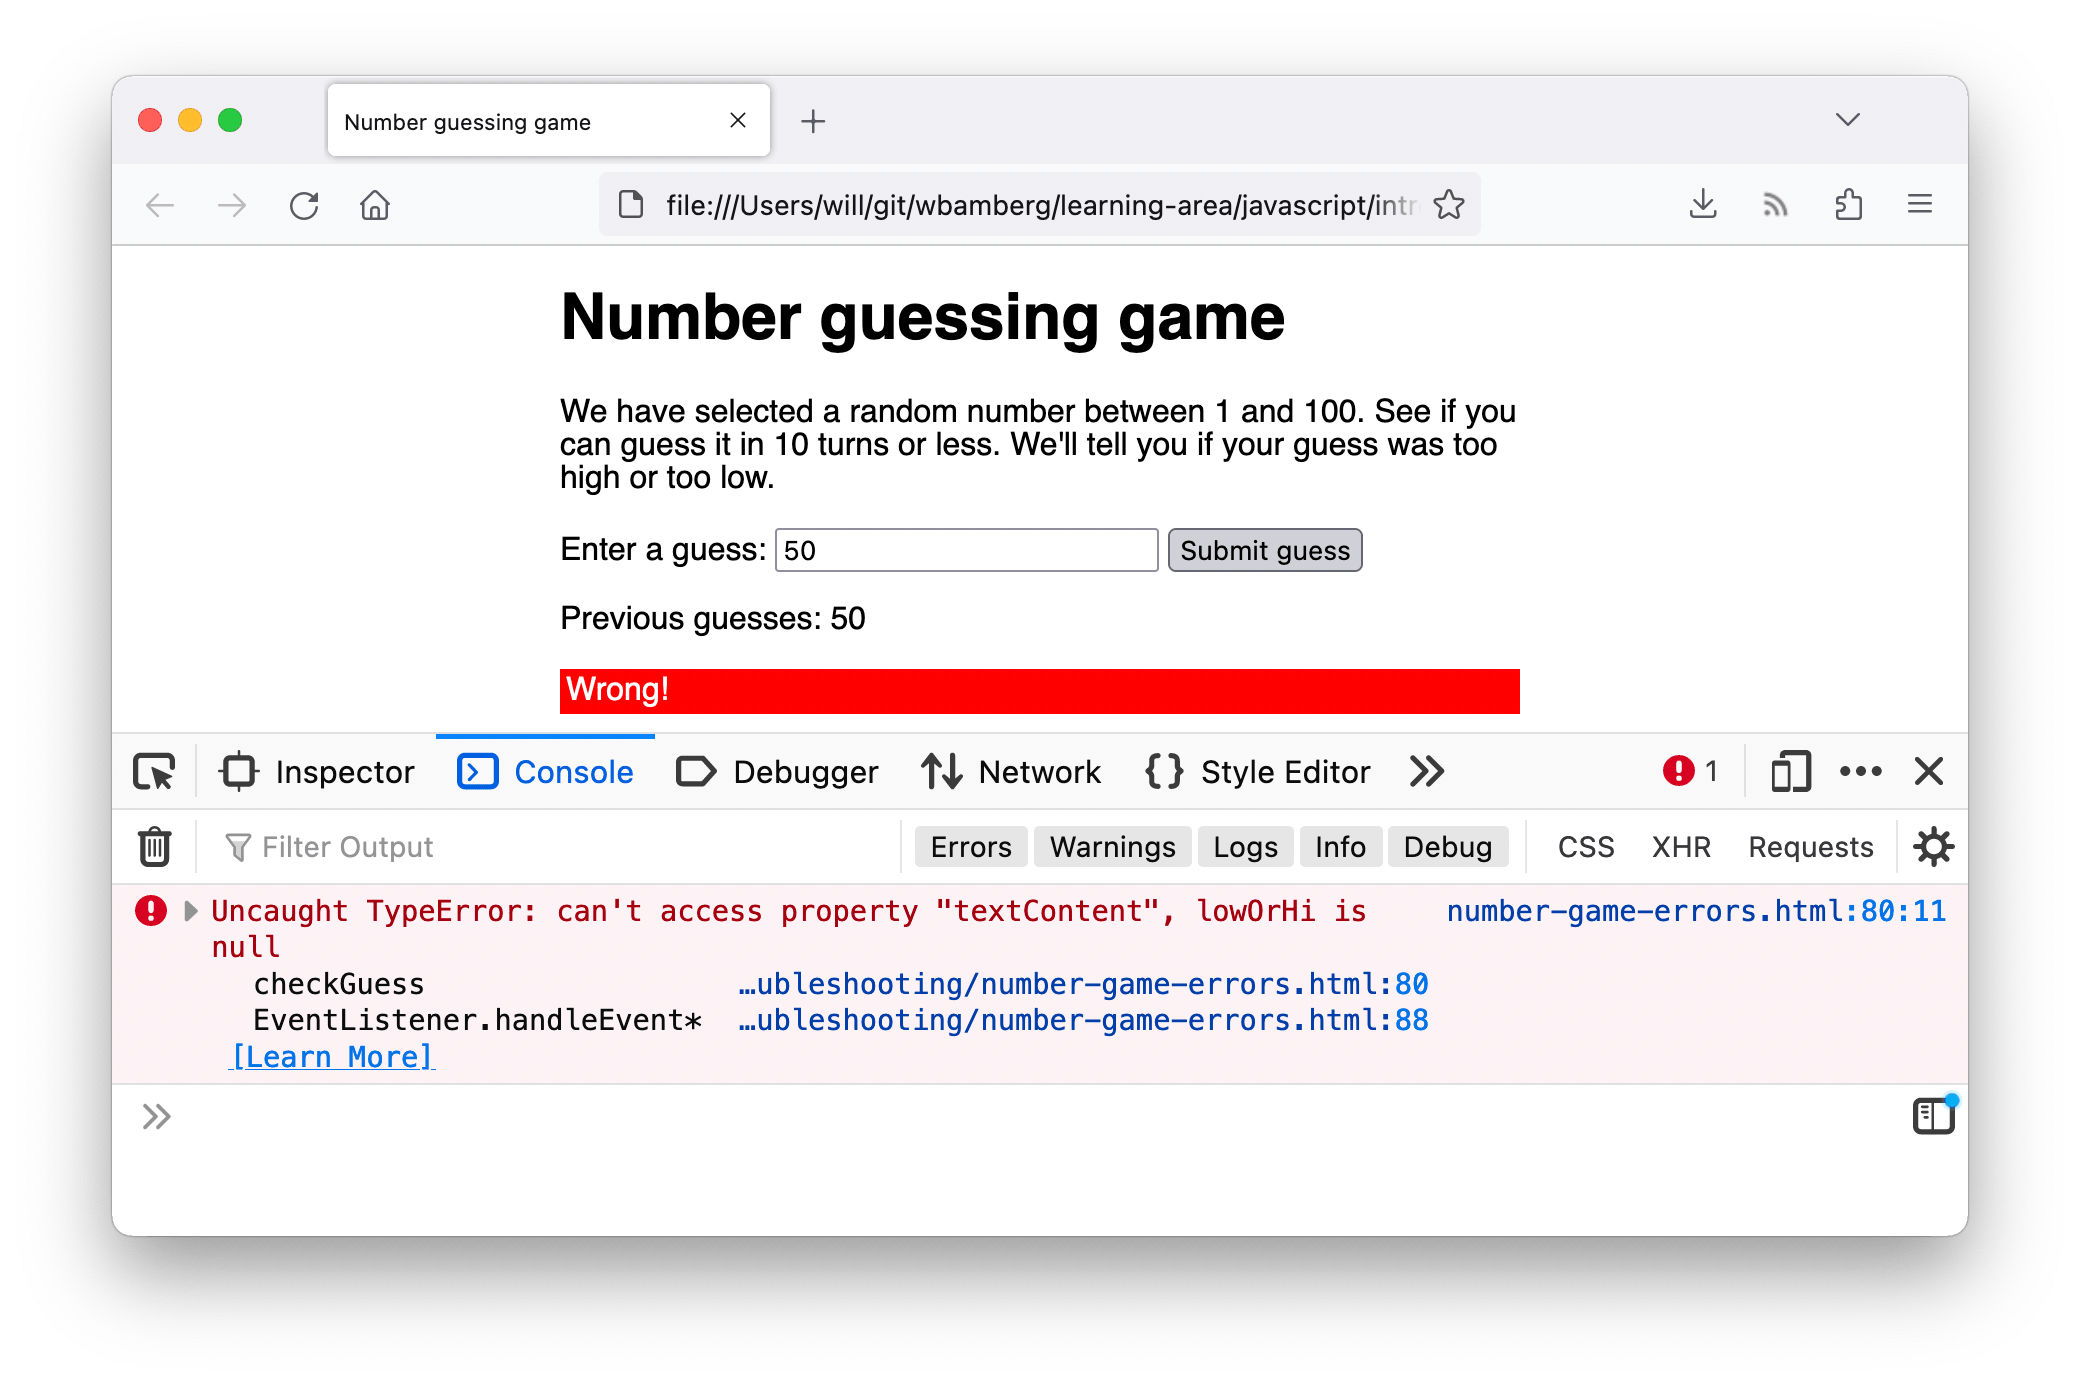
- На этот раз сообщается об ошибке: «TypeError: lowOrHi is null», в строке 78.
Примечание:
Null— это специальное значение, которое означает «ничего» или «не значение». ПоэтомуlowOrHiбыл объявлен и инициализирован без значения — у него нет типа или значения.Примечание: Эта ошибка не появилась, как только страница была загружена, потому что эта ошибка произошла внутри функции (внутри
checkGuess() { ... }блока). Об этом вы узнаете более подробно в нашей более поздней статье о функциях, код внутри функций выполняется в отдельной области для кода внешних функций. В этом случае код не был запущен, и ошибка не была брошена до тех пор, пока функцияcheckGuess()не была запущена строкой 86. - Посмотрите на строку 78, и вы увидите следующий код:
lowOrHi.textContent = 'Last guess was too high!'; - Эта строка пытается установить свойство
textContentпеременнойlowOrHiкак текстовую строку, но это не работает, посколькуlowOrHiне содержит того, что должна. Давайте посмотрим, почему так происходит — попробуйте найти другие экземплярыlowOrHiв коде. Самый ранний экземпляр, который вы найдёте в JavaScript, находится в строке 48:const lowOrHi = document.querySelector('lowOrHi'); - На этом этапе мы пытаемся заставить переменную содержать ссылку на элемент документа HTML. Давайте проверим, является ли значение
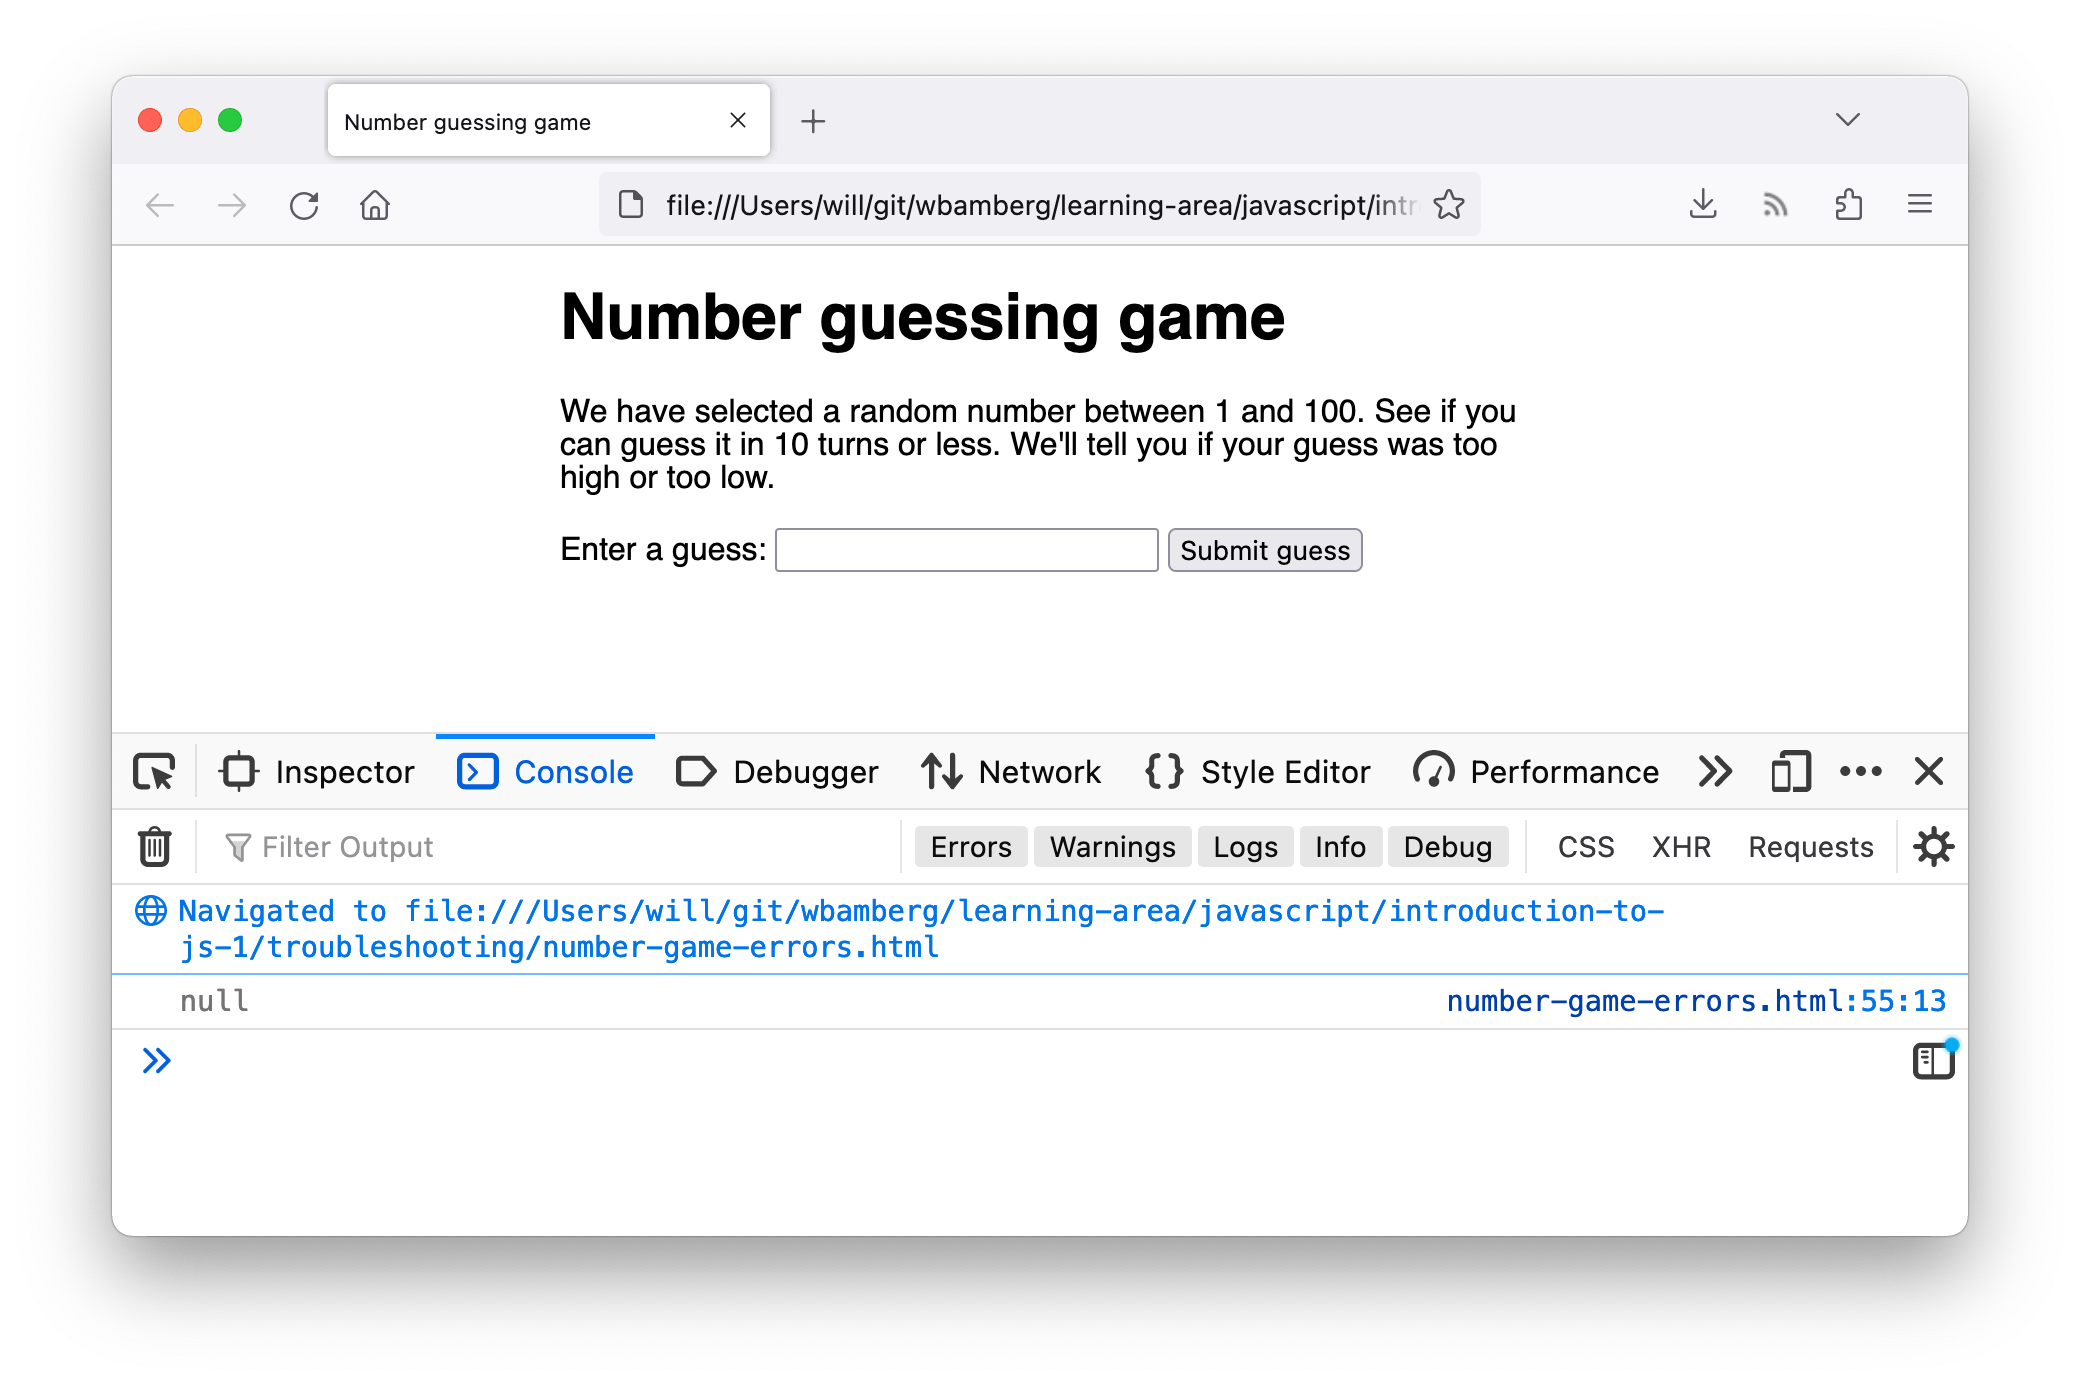
nullпосле выполнения этой строки. Добавьте следующий код в строку 49: - Сохраните и обновите, и вы должны увидеть результат работы
console.log()в консоли браузера.
Разумеется, значение lowOrHiна данный момент равноnull, поэтому определённо существует проблема в строке 48. - Давайте подумаем о том, что может быть проблемой. Строка 48 использует метод
document.querySelector()для получения ссылки на элемент, выбирая его с помощью селектора CSS. Посмотрев далее наш файл, мы можем найти обсуждаемый элемент<p>: - Поэтому нам нужен селектор классов, который начинается с точки (.), но селектор, передаваемый в метод
querySelector()в строке 48, не имеет точки. Возможно, это и есть проблема! Попробуйте изменитьlowOrHiна.lowOrHiв строке 48. - Повторите попытку сохранения и обновления, и ваш вызов
console.log()должен вернуть элемент<p>, который мы хотим. Уф! Ещё одна ошибка исправлена! Вы можете удалить строку сconsole.log()сейчас, или оставить для дальнейшего применения — выбирайте сами.
 Разумеется, значение
 Примечание: Загляните на справочную страницу TypeError: «x» is (not) «y», чтобы узнать больше об этой ошибке.
Синтаксические ошибки: третий раунд
- Теперь, если вы снова попробуете сыграть в игру, вы должны добиться большего успеха — игра должна играть абсолютно нормально, пока вы не закончите игру, либо угадав нужное число, либо потеряв жизни.
- На данном этапе игра снова слетает, и выводится такая же ошибка, как и в начале — «TypeError: resetButton.addeventListener is not a function»! Однако, теперь она происходит из-за строки 94.
- Посмотрев на строку 94, легко видеть, что здесь сделана такая же ошибка. Нам просто нужно изменить
addeventListenerнаaddEventListener.
Логическая ошибка
На этом этапе игра должна проходить отлично, однако, поиграв несколько раз, вы, несомненно заметите, что случайное число, которое вы должны угадать, всегда 0 или 1. Определённо не совсем так, как мы хотим, чтобы игра была разыграна!
Безусловно, где-то в игре есть логическая ошибка — игра не возвращает ошибку, она просто работает неправильно.
- Найдём переменную
randomNumber, и строку где в первый раз устанавливали случайное число. Пример, в котором мы храним случайное число, которое должны угадать, на строке 44:let randomNumber = Math.floor(Math.random()) + 1;И на строке 113, где мы генерируем случайное число, каждый раз после окончания игры:
randomNumber = Math.floor(Math.random()) + 1; - Чтобы проверить, действительно ли проблема в этом, давайте обратимся к нашему другу
console.log()снова — вставьте её ниже строк с ошибками:console.log(randomNumber); - Сохраните и обновите, а дальше попробуйте пару раз сыграть — в консоли вы увидите что
randomNumberравна 1 в каждой точке, где вы её записали после строк с ошибками.
Работаем через логику
Чтобы исправить это, давайте рассмотрим как работает строка. Первое, мы вызываем Math.random(), который генерирует случайное десятичное число, между 0 и 1, например 0.5675493843.
Дальше, мы передаём результат вызова Math.random() через Math.floor(), который округляет число вниз, до ближайшего целого числа. Затем мы добавляем 1 к данному результату:
Math.floor(Math.random()) + 1;
Округление случайного десятичного числа к меньшему, всегда будет возвращать 0, так что добавление к нему единицы будет возвращать всегда 1. Нам нужно умножить случайное число на 100, прежде чем мы округлим его к меньшему. Следующая строка вернёт нам случайное число между 0 и 99:
Math.floor(Math.random() * 100);
поэтому нам нужно добавить 1, чтоб нам возвращалось случайное число между 1 и 100:
Math.floor(Math.random() * 100) + 1;
А теперь, исправьте обе строки с ошибками, затем сохраните и обновите, игра должна работать так, как мы и планировали!
Другие распространённые ошибки
Существуют и другие распространённые ошибки, которые вы обнаружите в своём коде. В этом разделе показано большинство из них.
SyntaxError: отсутствует ; перед постановкой
Эта ошибка обычно означает что вы упустили точку с запятой в конце одной из ваших строк кода, но иногда ошибка может быть более загадочной. Например, если мы изменим эту строку внутри функции checkGuess() :
var userGuess = Number(guessField.value);
на эту
var userGuess === Number(guessField.value);
Это вызовет данную ошибку, потому что браузер подумает, что вы пытались сделать что-то другое. Вы должны быть уверены, что вы не перепутали оператор присваивания (=), который присваивает значение переменной — с оператором сравнения (===), который строго сравнивает операнды, и возвращает true/false .
В программе всегда говорится, что вы выиграли, независимо от того, что вы ввели
Причиной этому является все то же перепутывание оператора присваивания (=) со строгим сравнением (===). Например, если мы изменим внутри checkGuess() эту строку кода:
if (userGuess === randomNumber) {
на эту
if (userGuess = randomNumber) {
мы всегда будем получать true, заставляя программу сообщать, что игра была выиграна. Будьте осторожны!
SyntaxError: отсутствует ) после списка аргументов
Эта ошибка проста — обычно она означает, что вы пропустили закрывающую скобку с конца вызова функции / метода.
SyntaxError: missing : after property id
Эта ошибка обычно связана с неправильно сформированным объектом JavaScript, но в этом случае нам удалось получить её, изменив
на
Это заставило браузер думать, что мы пытаемся передать содержимое функции в функцию в качестве аргумента. Будьте осторожны с этими скобками!
SyntaxError: missing } after function body
Это легко — обычно это означает, что вы пропустили одну из ваших фигурных скобок из функции или условной структуры. Мы получили эту ошибку, удалив одну из закрывающих фигурных скобок возле нижней части функции checkGuess().
SyntaxError: expected expression, got ‘string‘ or SyntaxError: unterminated string literal
Эти ошибки обычно означает, что вы пропустили открывающую или закрывающую кавычку для строковых значений. В первой ошибки выше, строка будет заменена на неожиданный персонаж (ей) , что браузер нашёл вместо кавычек в начале строки. Вторая ошибка означает , что строка не закончилась кавычки.
При всех этих ошибках действуйте так, как в наших примерах, которые мы рассмотрели в пошаговом руководстве. Когда возникает ошибка, посмотрите полученный номер строки, перейдите к этой строке и посмотрите, можете ли вы определить, что случилось. Имейте в виду, что ошибка не обязательно будет на этой строке, а также, что ошибка может быть вызвана не такой же проблемой, которую мы привели выше!
Резюме
Итак, мы научились основам выяснения ошибок в простых программах JavaScript. Не всегда так просто разобраться, что не так в вашем коде, но, по крайней мере, это сэкономит вам несколько часов сна и позволит вам продвигаться немного быстрее, когда что-либо заработает не так, как ожидалось, в вашем учебном путешествии.
Смотрите также
- Есть много других типов ошибок, которые не перечислены здесь; мы составляем ссылку , которая объясняет , что они означают подробно — см. ссылку ошибки JavaScript .
- Если вы столкнётесь с любыми ошибками в коде, которые вы не знаете , как исправить после прочтения этой статьи, вы можете получить помощь! Спросите на нить обучения Область дискурсе , или в #mdn IRC канал на Mozilla IRC. Расскажите нам, какая у вас ошибка, и мы постараемся вам помочь. Приложите пример своего кода для большей ясности проблемы.
- Назад
- Обзор: Первые шаги
- Далее
A script error is an error that occurs when the instructions from a script can’t be executed correctly for some reason.
Most computer users will encounter script errors most often in the browser when it can’t execute JavaScript or VBScript (or other scripting language) instructions from a web page, but they can happen in desktop applications, too.
Markus Spiske / Unsplash
Script Error Examples
Here are some example script error messages:
- Errors on this webpage might cause it to work incorrectly.
- A Runtime Error has occurred. Do you wish to debug?
- Internet Explorer Script Error. An error has occurred in the script on line 1. Do you wish to continue running scripts on this page?
- A script on this page is causing Internet Explorer to run slowly. If it continues to run, your computer may become unresponsive. Do you want to abort the script?
- An error has occurred in the script on this page.
Why You’re Getting Script Errors
A common reason for scripting errors is that an error has occurred behind the scenes, either on the web server for errors in a web browser or on the programming end of a software program.
Incorrect code implementation or some other bad configuration on the software side isn’t your problem to fix. The best thing to do in that situation is to wait for an update from the developer.
However, scripting errors can also be due to something happening on your end, like with your own software program or operating system that’s unable to load the script correctly. For example, there might be a setting in your web browser that’s blocking scripts, or your security software might be treating a harmless script as if it’s a threat that needs to be deleted.
Script errors are most commonly seen in Internet Explorer or in an application that uses IE to access the internet or run local scripts, so most of these troubleshooting steps are with regard to IE.
While Microsoft Edge has replaced IE, some of the same problems can crop up. The fixes are also the same or very similar.
So, the quickest way to stop getting script errors is to simply switch browsers! Use something like Edge, Chrome, Firefox, or Opera. However, doing that doesn’t actually solve the script error.
Follow these steps in order, checking after each one to see if you still get the error:
Turn Off Scripting Errors in IE
The average user doesn’t actually need to see script errors, since they only serve as an annoyance. This is especially true if the error doesn’t prevent you from using the website or program normally.
You can safely turn off script errors in Internet Explorer, as well as programs that use IE on the backend, like this:
-
Open the Run dialog box by pressing the Windows Key and then the R key.
-
Enter the inetcpl.cpl command to launch Internet Properties.
-
Open the tab called Advanced.
-
Scroll down until you find the Browsing section, and then look for these three settings (what you see will depend on the OS you’re using):
- Make sure both Disable script debugging (Internet Explorer) and Disable script debugging (Other) have a check next to them.
- Just below those options, double-check that Display a notification about every script error is not checked (so that you won’t see notifications about script errors.)
These are the default settings for Windows 11 and Windows 10.
-
Press OK to save the changes.
Make Sure IE Isn’t Blocking Important Scripting Features
Turning off scripting errors will stop you from seeing them, but doesn’t necessarily mean that the scripts themselves will work properly just because their related errors are no longer seen.
Make sure you haven’t disabled ActiveX scripting and that Internet Explorer isn’t blocking Java or ActiveX. Certain security settings in IE will prevent ActiveX and Java from running properly, which can affect the usability of the web page that’s running the script.
The quickest way to get these features working again (if they aren’t already) is to reset the security settings in Internet Explorer.
Delete Temporary Internet Files
Temporary files are cached on your computer by Internet Explorer so that you can revisit websites quicker, but a cache that’s too large or one that’s storing corrupted data can result in script errors. You should periodically delete these cache files in Internet Explorer.
Allow for Pop-ups in Your Browser
A pop-up blocker is extremely useful most of the time, but might actually be causing script errors if the script isn’t given enough time to run because the browser is preventing pop-ups.
All web browsers let you control the pop-up blocker settings. If you disable the blocker, then pop-ups will be allowed to run again.
Update Your Software
Outdated software might be what’s causing the specific script error that you’re seeing. This might be because the website or program showing the error, has a minimum requirement that your computer doesn’t meet, or because a script error was corrected through an update that you never received.
You should always keep Windows up to date.
Update your third-party programs if they’re getting script errors. A free software updater tool is one easy way to do this.
Check Your Security Software
It’s possible that your antivirus program or firewall application is blocking scripts or ActiveX controls from running normally. Temporarily disable both to see if you still get the script error.
You should never leave your computer open to attacks, but in this case, the security software might be to blame, so temporarily disabling them just for a few minutes won’t do any harm.
The procedure is different for every program, but you should be able to right-click the software running on the Windows taskbar, next to the clock, to turn off the AV shields or disable the firewall. If not, try opening the program—there’s most definitely an option there to disable the application.
Something else to look for with your antivirus scanner is whether it’s configured to check for viruses in folders that your web browser uses to keep temporary files. If so, the scanner might incorrectly identify scripts as malware, and quarantine or delete them before they can run. Add a folder exclusion if your app allows it.
Internet Explorer uses this folder by default:
C:Users[username]AppDataLocalMicrosoftWindowsINetCache
Google Chrome caches data here:
C:Users[username]AppDataLocalGoogleChromeUser DataDefaultCache
Reset All of Internet Explorer’s Settings
There could be a number of settings or add-ons causing scripting errors in Internet Explorer. The easiest way to return all of those settings to their defaults is to reset Internet Explorer.
Resetting IE will disable all the toolbars and add-ons, as well as reset every privacy, security, pop-up, tabbed browsing, default web browser, and advanced option.
An alternative method is to see if just a single add-on is causing the script error, which you can do through Tools > Manage add-ons. Disable add-ons one at a time and test for the script error after each one.
Otherwise, here’s how to completely reset Internet Explorer:
-
Open the Run dialog box with the WIN + R hotkey.
-
Enter inetcpl.cpl to open Internet Properties.
-
From the Advanced tab, choose Reset at the bottom, and then again on the Reset Internet Explorer Settings screen.
The only option for Windows 11 users from this screen is Restore advanced settings.
-
Select Close when all the settings have been reset.
-
Restart your computer.
Disable Smooth Scrolling
This is at the bottom because it’s the least likely cause of a script error. However, if you’re getting an error when viewing videos in Internet Explorer, or the video just doesn’t display correctly, the Smooth Scrolling option in IE could be causing issues with scripts that are trying to run on the page.
Here’s how to turn off Smooth Scrolling in Internet Explorer:
-
Use the Run dialog box (Windows Key + R) to enter the inetcpl.cpl command.
-
Navigate to the Advanced tab.
-
Under the Browsing section, toward the bottom, remove the check mark next to Use smooth scrolling.
-
Press OK to save and exit.
Thanks for letting us know!
Get the Latest Tech News Delivered Every Day
Subscribe
Do you use an error tracking tool for your website? Have you ever tried to debug a problem that a user reported, and when you looked at your error tracking tool the reported error was simply: “Script Error”? Such errors are impossible to further debug because there is no additional information apart from that message.
In this article, I’ll explain what a script error is, what can cause it and how to fix it, or more precisely, how do we get detailed information for errors that originate in scripts served from a different origin.
Let’s get started!
If you are using an error tracking tool for your frontend code, you might have noticed an error with a rather cryptic “Script error” message. These are errors from your website that originate in JavaScript files served from a different origin (different domain, port, or protocol).
The problem with these errors is that they don’t contain any details, not even the stack trace. This makes it impossible to find the location of the bug in code, which defeats the purpose of using error tracking tools.
What Causes Script Error Messages
Error tracking tools use window.onerror to catch and log uncaught errors.
This works fine most of the time, but when the error is in a JavaScript file served from a different origin the browser will provide only the cryptic Script error. message without any additional information. This is to prevent leaking of potentially sensitive information.
Different origin means that the JavaScript file is hosted on a different domain or subdomain or protocol (http vs https) or port.
The Same-Origin Policy
Browsers enforce the same-origin policy, which means that scripts have full access rights only if they are loaded from the same origin as the website itself.
In an effort to improve loading times most websites will use Content Delivery Networks (CDN) for hosting JavaScript, CSS, and other static content. This means that in most cases, JavaScript files will be served from a different origin than the website itself as the CDN will use a different domain.
If your website has a lot of application code defined in JavaScript files hosted on CDNs and a runtime error happens, the error description that hits the window.onerror event handler won’t have any stack trace or detailed message for you to debug.
How to Fix Script Errors
So how do we fix this, or more precisely, how do we get detailed information for errors that originate in scripts served from a different origin? This is a two step process, we need to make changes both on our website and on the third-party origin.
1. Add `crossorigin` attribute on the script tag
If you are trying to load a script on your website from a different origin and add the script tag like the one below, the browser will refuse to load the script.
`<script src="//third-party.com/index.js"></script>`
To enable cross origin requests for this script you need to add the crossorigin="anonymous" attribute to the tag like this:
`<script crossorigin="anonymous" src="//third-party.com/index.js"></script>`
Now the browser will perform a CORS request for this script but it will omit any sensitive data such as cookies or HTTP authentication data.
Most CDNs will do this by default as their main purpose is serving static files to other origins, but if you are running your own servers for serving static files, they will need to return the following HTTP header for static files:
`Access-Control-Allow-Origin: *`
This will enable browsers to fetch static files from this server from any domain. If you have a known list of domain you want to allow, for example if your website is at www.my-site.com, then you can allow that domain only:
`Access-Control-Allow-Origin: www.my-site.com`
If you are not sure how to add these headers on your servers or the service you are using, you should check out https://enable-cors.org/server.html.
Using a Web Proxy to Remove Script Errors
If you are a developer and you have run into this issue, and you need a quick fix, you could use a web proxy such as CORS Anywhere. The proxy server forwards the requests to the third-party server, and then sends them back to your website with the CORS headers added.
Obviously, you should not use this in a production environment, but it’s a quick solution if you don’t have access to the second origin servers.
Script Errors on Different Browsers
There are some browser quirks that you should be aware of. What we wrote above applies to the latest browser, or more specifically to:
- Chrome 30+
- Firefox 13+
- Opera 12.50+
- Safari (at least 6+)
- Edge 0.10+
Firefox has different behavior for runtime errors. These will be provided to the onerror callback without any obfuscation, even if the script is served from a different origin. Syntax errors will be blocked though if the CORS headers are missing.
Internet Explorer 10 and below will report all available data for errors. This is now considered a security risk. And in Internet Explorer 11+ scripts loaded from different origins will never have any additional data provided, regardless of the CORS headers and the crossorigin attribute mentioned above.
Stopping Script Errors with RUM Solutions
Real user monitoring tools such as Sematext Experience, can help you detect script errors by logging them to a remote server. RUM tools that have error tracking will report such errors as they happen to real users on your website.
When error tracking tools report errors, they usually report a detailed stack trace and error message which helps the developer track down the issue in their code.
But as explained earlier, this special kind of error will be missing this additional information. You can avoid this by following the instructions above to adjust the script tag and the servers from which the script is served.
The Bottom Line
Script Error is a special kind of error that you get when a runtime or syntax error occurs in a script that is served from a different domain, subdomain, or port.
To even detect such errors you need a good monitoring solution. You could go for a real user monitoring solution such as Sematext Experience or a front-end monitoring tool that features RUM, logging, and synthetic monitoring that gives you end-to-end visibility into your application performance, in which case, Sematext Cloud is the tools for you. Use the 14-day free trial to explore Sematext’s features!
If you have already detected such errors with your RUM tools and you are wondering why the stack trace or message is missing, you should follow the instructions above to adjust the script tag or the server from where the files are served.
Существует ряд причин, по которым код JavaScript может вызывать ошибки, например:
- Проблема с сетевым подключением;
- Пользователь мог ввести неверное значение в поля формы;
- Ссылка на объекты или функции, которые не существуют;
- Неправильные данные отправляются или принимаются с веб-сервера;
- Служба, к которой приложение должно получить доступ, может быть временно недоступна.
Эти типы ошибок известны как ошибки времени выполнения (runtime errors), поскольку они возникают во время выполнения скрипта. Профессиональное приложение должно иметь возможность корректно обрабатывать такие ошибки во время выполнения. Обычно это означает понятное информирование пользователя о возникшей проблеме.
Оператор try…catch
JavaScript предоставляет оператор try-catch, чтобы перехватывать ошибки времени выполнения и корректно их обработать.
Любой код, который может вызвать ошибку, должен быть помещен в блок оператора try, а код для обработки ошибки помещен в блок catch, как показано здесь:
try {
    // Код, который может вызвать ошибку
} catch(error) {
    // Действие, которое нужно выполнить при возникновении ошибки
}
Если ошибка возникает в любой точке блока try, выполнение кода немедленно переносится из блока try в блок catch. Если в блоке try ошибки не возникает, блок catch будет проигнорирован, и программа продолжит выполнение после оператора try-catch.
Следующий пример демонстрирует, как работает оператор try-catch:
try {
    var greet = "Hi, there!";
    document.write(greet);

    // Попытка получить доступ к несуществующей переменной
    document.write(welcome);

    // Если произошла ошибка, следующая строка не будет выполнена
    alert("All statements are executed successfully.");
} catch(error) {
    // Обработка ошибки
  alert("Caught error: " + error.message);
}

// Продолжаем исполнение кода
document.write("<p>Hello World!</p>");
Приведенный выше скрипт генерирует ошибку, которая отображается в диалоговом окне с предупреждением, а не выводится в консоль браузера. Кроме того, программа не остановилась внезапно, даже если произошла ошибка.
Также обратите внимание, что за ключевым словом catch указывается идентификатор в скобках. Этот идентификатор действует как параметр функции. При возникновении ошибки интерпретатор JavaScript генерирует объект, содержащий сведения о нем. Этот объект ошибки затем передается в качестве аргумента для обработки.
Оператор try-catch является механизмом обработки исключений. Исключением является сигнал, который указывает, что во время выполнения программы возникли какие-то исключительные условия или ошибки. Термины «исключение» и «ошибка» часто используются взаимозаменяемо.
Оператор try…catch…finally
Оператор try-catch также может содержать предложение finally. Код внутри блока finally всегда будет выполняться независимо от того, произошла ошибка в блоке try или нет.
В следующем примере всегда отображается общее время, затраченное на выполнение кода.
// Присвоение значения, возвращаемого диалоговым окном
var num = prompt("Enter a positive integer between 0 to 100");

// Запоминание времени начала исполнения
var start = Date.now();

try {
    if(num > 0 && num <= 100) {
        alert(Math.pow(num, num)); // the base to the exponent power
    } else {
        throw new Error("An invalid value is entered!");
    }
} catch(e) {
    alert(e.message);
} finally {
    // Отображение времени, необходимого для выполнения кода
    alert("Execution took: " + (Date.now() - start) + "ms");
}
Вызов ошибок с помощью оператора throw
До сих пор мы видели ошибки, которые автоматически генерируются парсером JavaScript. Тем не менее, также можно вызвать ошибку вручную с помощью оператора throw.
Общий синтаксис оператора throw: throw expression;
Выражение expression может быть объектом или значением любого типа данных. Однако лучше использовать объекты, желательно со свойствами name и message. Встроенный в JavaScript конструктор Error() предоставляет удобный способ создания объекта ошибки. Давайте посмотрим на некоторые примеры:
throw 123;
throw "Missing values!";
throw true;
throw { name: "InvalidParameter", message: "Parameter is not a number!" };
throw new Error("Something went wrong!");
Если вы используете встроенные в JavaScript функции конструктора ошибок (например, Error(), TypeError() и т. д.) для создания объектов ошибок, тогда свойство name совпадает с именем конструктора, а message равно аргументу функции конструктора.
Теперь мы собираемся создать функцию squareRoot(), чтобы найти квадратный корень числа. Это можно сделать просто с помощью встроенной в JavaScript функции Math.sqrt(), но проблема здесь в том, что она возвращает NaN для отрицательных чисел, не давая никаких подсказок о том, что пошло не так.
Мы собираемся исправить эту проблему, показывая пользователю ошибку, если указано отрицательное число.
function squareRoot(number) {
    // Выдает ошибку, если число отрицательное
    if(number < 0) {
        throw new Error("Sorry, can't calculate square root of a negative number.");
    } else {
        return Math.sqrt(number);
    }
}

try {
    squareRoot(16);
    squareRoot(625);
    squareRoot(-9);
    squareRoot(100);

    // Если выдается ошибка, следующая строка не будет выполнена
    alert("All calculations are performed successfully.");
} catch(e) {
    // Обработка ошибки
    alert(e.message);
}
Теоретически можно вычислить квадратный корень из отрицательного числа, используя мнимое число i, где i2 = -1. Следовательно, квадратный корень из -4 равен 2i, квадратный корень из -9 равен 3i и так далее. Но мнимые числа не поддерживаются в JavaScript.
Типы ошибок
Объект Error является базовым типом всех ошибок и имеет два основных свойства: name, указывающее тип ошибки и свойство message, которое содержит сообщение, описывающее ошибку более подробно. Любая выданная ошибка будет экземпляром объекта Error.
Существует несколько различных типов ошибок, которые могут возникнуть во время выполнения программы JavaScript, например RangeError, ReferenceError, SyntaxError, TypeError, и URIError.
В следующем разделе описывается каждый из этих типов ошибок более подробно:
RangeError
RangeError генерируется, когда вы используете число, выходящее за пределы допустимых значений. Например, создание массива с отрицательной длиной вызовет RangeError.
var num = 12.735;
num.toFixed(200); // выдает ошибку диапазона (допустимый диапазон от 0 до 100)

var array = new Array(-1); // выдает ошибку диапазона
ReferenceError
Ошибка ReferenceError обычно выдается, когда вы пытаетесь сослаться на переменную или объект, которые не существуют, или получить к ним доступ. В следующем примере показано, как происходит ошибка ReferenceError.
var firstName = "Harry";
console.log(firstname); // выдает ошибку ссылки (имена переменных чувствительны к регистру)

undefinedObj.getValues(); // выдает ошибку ссылки

nonexistentArray.length; // выдает ошибку ссылки
SyntaxError
SyntaxError генерируется, если в вашем коде JavaScript есть какие-либо синтаксические проблемы. Например, если закрывающая скобка отсутствует, циклы не структурированы должным образом и т. д.
var array = ["a", "b", "c"];
document.write(array.slice(2); // выдает синтаксическую ошибку (отсутствует скобка)

alert("Hello World!'); // выдает синтаксическую ошибку (несоответствие кавычек)
TypeError
Ошибка TypeError возникает, когда значение не относится к ожидаемому типу. Например, вызов метода строки для числа, вызов метода массива для строки и т. д.
var num = 123;
num.toLowerCase(); /* выдает ошибку (поскольку toLowerCase() является строковым методом, число не может быть преобразовано в нижний регистр) */

var greet = "Hello World!"
greet.join() // выдает ошибку (так как join() является методом массива)
URIError
URIError генерируется, когда вы указали недопустимый URI (расшифровывается как Uniform Resource Identifier) для функций, связанных с URI, таких как encodeURI() или decodeURI(), как показано здесь:
var a = "%E6%A2%B";
decodeURI(a);  // выдает ошибку URI

var b = "uD800";
encodeURI(b);   // выдает ошибку URI
Существует еще один тип ошибки EvalError, который генерируется при возникновении ошибки во время выполнения кода с помощью функции eval(). Хотя эта ошибка больше не генерируется JavaScript, этот объект все еще остается для обратной совместимости.
Конкретный тип ошибки также может быть выдан вручную с использованием соответствующего конструктора и оператора throw. Например, чтобы сгенерировать ошибку TypeError, вы можете использовать конструктор TypeError(), например:
var num = prompt("Please enter a number");

try {
    if(num != "" && num !== null && isFinite(+num)) {
        alert(Math.exp(num));
    } else {
        throw new TypeError("You have not entered a number.");
    }
} catch(e) {
    alert(e.name);
    alert(e.message);
    alert(e.stack); // нестандартное свойство
}
Объект Error также поддерживает некоторые нестандартные свойства. Одним из наиболее широко используемых таких свойств является: stack trace, который возвращает трассировку стека для этой ошибки. Вы можете использовать его в целях отладки, но не используйте его на рабочих сайтах.