Конструктор Error создаёт объект ошибки. Экземпляры объекта Error выбрасываются при возникновении ошибок во время выполнения. Объект Error также может использоваться в качестве базового для пользовательских исключений. Смотрите ниже стандартные встроенные типы ошибок.
Синтаксис
new Error([message[, fileName[, lineNumber]]])
Параметры
messageНеобязательный-
Человеко-читаемое описание ошибки.
fileName
Non-standard
Необязательный-
Значение свойства
fileNameсозданного объектаError. Значением по умолчанию является имя файла, содержащего код, вызвавший конструкторError(). lineNumber
Non-standard
Необязательный-
Значение свойства
lineNumberсозданного объектаError. Значением по умолчанию является номер строки, содержащей вызов конструктораError().
Описание
Во время выполнения кода ошибки приводят к созданию и выбрасыванию новых объектов Error.
Данная страница документирует использование объекта Error как самого по себе, так и при использовании в качестве функции-конструктора. Список свойств и методов, унаследованных экземплярами объекта Error, смотрите в разделе Error.prototype (en-US).
Использование как функции
Когда Error используется как функции— без new, она возвращает Error объект. Следовательно простой вызов Error произведёт тот же результат, что и конструктор Error объявленный через new.
// this:
const x = Error('I was created using a function call!');
// Такая же функциональность:
const y = new Error('I was constructed via the "new" keyword!');
Типы ошибок
Кроме общего конструктора Error, в JavaScript существует ещё семь других основных конструкторов ошибок. По обработке исключений смотрите раздел Выражения обработки исключений.
EvalError-
Создаёт экземпляр, представляющий ошибку, возникающую в глобальной функции
eval(). InternalError
Non-standard
-
Создаёт экземпляр, представляющий ошибку, возникающую при выбрасывании внутренней ошибки в движке JavaScript. К примеру, ошибки «слишком глубокая рекурсия» («too much recursion»).
RangeError-
Создаёт экземпляр, представляющий ошибку, возникающую при выходе числовой переменной или параметра за пределы допустимого диапазона.
ReferenceError-
Создаёт экземпляр, представляющий ошибку, возникающую при разыменовывании недопустимой ссылки.
SyntaxError-
Создаёт экземпляр, представляющий синтаксическую ошибку, возникающую при разборе исходного кода в функции
eval(). TypeError-
Создаёт экземпляр, представляющий ошибку, возникающую при недопустимом типе для переменной или параметра.
URIError-
Создаёт экземпляр, представляющий ошибку, возникающую при передаче в функции
encodeURI()илиdecodeURI()недопустимых параметров.
Свойства
Error.prototype(en-US)-
Позволяет добавлять свойства в экземпляры объекта
Error.
Методы
Глобальный объект Error не содержит собственных методов, однако, он наследует некоторые методы из цепочки прототипов.
Экземпляры объекта Error
{{page(‘/ru/docs/Web/JavaScript/Reference/Global_Objects/Error/prototype’, ‘Description’)}}
Свойства
{{page(‘/ru/docs/Web/JavaScript/Reference/Global_Objects/Error/prototype’, ‘Properties’)}}
Методы
{{page(‘/ru/docs/Web/JavaScript/Reference/Global_Objects/Error/prototype’, ‘Methods’)}}
Примеры
Пример: выбрасывание обычной ошибки
Обычно, вы создаёте объект Error с намерением возбудить ошибку с помощью ключевого слова throw. Вы можете обработать ошибку с помощью конструкции try...catch:
try {
  throw new Error('Уупс!');
} catch (e) {
  console.log(e.name + ': ' + e.message);
}
Пример: обработка ошибки конкретного типа
Возможно, это следует удалить вы можете обрабатывать только какой-то определённый вид ошибок, проверяя тип ошибки в свойстве constructor или, если вы пишете для современных движков JavaScript, с помощью ключевого слова instanceof:
try {
  foo.bar();
} catch (e) {
  if (e instanceof EvalError) {
    console.log(e.name + ': ' + e.message);
  } else if (e instanceof RangeError) {
    console.log(e.name + ': ' + e.message);
  }
  // ... и т.д.
}
Пример: пользовательские типы ошибок
Вы можете захотеть определить свои собственные типы ошибок, унаследованные от Error, что бы иметь возможность писать throw new MyError() и использовать instanceof MyError для проверки вида ошибки в обработчике исключений. Ниже продемонстрирован общий подход к выполнению этой задачи.
Предупреждение: обратите внимание, что выбрасывание MyError будет сообщать неправильные номер строки lineNumber и имя файла fileName как минимум, в Firefox.
Также смотрите обсуждение «Какой способ расширения Error в JavaScript более предпочтителен?» на Stackoverflow.
// Создаём новый объект, затем через прототип делаем его наследником конструктора Error.
function MyError(message) {
  this.name = 'MyError';
  this.message = message || 'Сообщение по умолчанию';
  this.stack = (new Error()).stack;
}
MyError.prototype = Object.create(Error.prototype);
MyError.prototype.constructor = MyError;

try {
  throw new MyError();
} catch (e) {
  console.log(e.name);     // 'MyError'
  console.log(e.message);  // 'Сообщение по умолчанию'
}

try {
  throw new MyError('пользовательское сообщение');
} catch (e) {
  console.log(e.name);     // 'MyError'
  console.log(e.message);  // 'пользовательское сообщение'
}
Спецификации
| Specification |
|---|
| ECMAScript Language Specification # sec-error-objects |
Совместимость с браузерами
BCD tables only load in the browser
Смотрите также
Websites use several different Website coding languages to work. All websites use HTML, CSS, and JavaScript to render the webpage to the visitor.
When the website is loading but the website is not displaying correctly, this is usually due to a coding error on the site. Usually this is caused by JavaScript or CSS errors. This article will focus on diagnosing JavaScript coding errors.
How do I know its a JavaScript problem?
JavaScript is used to make different behaviors happen on your site. These behaviors are all done through the Visitor of the sites browser. Examples of this are Image Slide Shows, Pop Up boxes, Menus, and more. When your website loads, but the behaviors on your site stopped working, this is usually because of the JavaScript code not working.
What happens when your JavaScript fails?
If you have JavaScript’s on your site that are not working you can diagnose them by using your browsers “Error Console“. Each browser has a built in “Error Console” for diagnosing scripting errors on your site. Below will show you how to check the “Error Console” in FireFox, Internet Explorer, Chrome, Opera, and Safari.
Diagnosing a JavaScript error

In order to explain how to diagnose a JavaScript error, we will use the simple “pop up” script below (Snapshot to the right shows what it does):
This script simply creates a pop up box that says “I am an alert box!“. We will break the script so that is causes an error by removing one of the quotes like the following.

When the website is ran, the code will break where the quote is missing. The snapshot to the right shows the code that’s broken, and where the lines are in the code.
In this case Line 33 is broken. The methods below will show you how to find the lines of broken code through your browser.
Javascript console for FireFox
Using the code example from the “Diagnosing a JavaScript error” section above, We will find the JavaScript error using Firefox.
- Open FireFox.

Go to Tools > Web Developer > Error Console. If you do not have Tools at the top you can use the following shortcut:
Ctrl + Shift + J
-
Visit the page with the error. In this case you will see the error on Line 33 in the FireFox Error Console. See image to the right.


Javascript console for Internet Explorer
Keep in mind we are using the code example from the “Diagnosing a JavaScript error” section at the beginning of this article. Below is how to use the Error Console in Internet Explorer.
- Open Internet Explorer.
- Press the function key on your keyboard, F12.
-
Visit your webpage with the error. You will see the error with the line number of where the error occurs in the document in the bottom Error Console window. The snapshot to the right shows the error on line 33.

Javascript console for Chrome
From the “Diagnosing a JavaScript error” section example towards the top, we will find the JavaScript error on a webpage in Google Chrome.
- Open Google Chrome.
- Click the “Customize and Control Google Chrome” button at the top right side.
-
From the drop menu, go to Tools > JavaScript console. Or you can press:
Ctrl + Shift + J
-
Visit the site with the error. In the Error Console window you will see the error show on line 33. See image to the right.


Javascript console for Opera
Continuing to diagnose the error from “Diagnosing a JavaScript error” section, we will find the JavaScript error on a webpage in Opera.
- Open Opera.
- Click the Opera button towards the top right.
-
Navigate to Page > Developer Tools > Error Console. Or you can press the following keyboard keys:
Ctrl + Shift + O
-
The Error Console will pop up. You can move the window to the side while you visit your site. You will see the errors list when you visit the site with the broken code. The image to the right shows the error on line 33.


Javascript console for Safari
Continuing the previous example error from “Diagnosing a JavaScript error” section, We will look at the Error Console in Safari.
- Open up your Safari browser.
- Click the “Display a menu of general Safari settings” button towards the top right that looks like a gear.
-
Click Preferences.
-
On the Advanced tab, make sure you have the “Show Develop menu in menu bar” box checked.
-
“Display a menu for the current page” icon towards the top right that looks like a paper with a bent corner.
Go to Develop > Show Error Console. Or you can press:
Ctrl + Alt + C
Â
-
Visit your webpage that is broken and check the Error Console at the bottom. The errors will list when you refresh your browser. In this case you can see the error on line 33 in the snapshot to the right.


How to Solve Common Browser Issues » Advanced Browser Troubleshooting
After you’ve tried preliminary browser troubleshooting steps, this support page will help you provide us with more information to troubleshoot why your WordPress.com site may not be loading in your browser.
Table of Contents
Traceroutes
If it seems like you’re having difficulty connecting to our servers here at WordPress.com, we might ask you to run a “traceroute” which gives us detailed information about how you’re connecting to us.
To get a traceroute, follow the instructions below. You can paste the output of this command into a text file (Notepad for Windows or TextEdit for OS X), then attach the .txt file to your email when you reply to us or copy-paste it.
✅
In the following commands replace
mydomain.wordpress.comwith any public WordPress.com URL that you are having trouble loading. Do NOT copy a full link with http:// at the beginning, but rather type out the URL without that.
Traceroutes in Windows
- Windows 10, 7 , and Vista: From the Start Menu, in the search field, type “cmd,” then press the Enter key to open a command prompt window.
Previous versions of Windows: From the Start menu, click Start → Run, type “cmd,” then press the Enter key. - Type the following command into the Command Prompt window, and press Enter:
tracert mydomain.wordpress.com
- Allow the command to finish running even if it seems like it’s going to hang. Highlight the result of the command and press the Control + C keys to copy. Then, select all of the text in the command prompt window and press the Enter key.
- Paste (Control + V) it into your reply.
Traceroutes in Mac OS X
- Go to your Applications → Utilities folder.
- Open the Terminal.
- In the Terminal, type the following command, and press the return key:
traceroute -I mydomain.wordpress.com
- Allow the command to finish running even if it seems like it’s going to hang. Highlight the result of the command and press the Command + A keys to select all the text, then press the Command + C keys to copy it to your clipboard.
- Paste (Command + V) the output into your reply.
Traceroutes in Linux
- Open the terminal emulator of your choice.
- Type the following command and press ENTER:
traceroute -I mydomain.wordpress.com
- Allow the command to finish running even if it seems like it’s going to hang. Then, copy all the output.
- Paste the output into your reply.
If it seems like certain resources on your WordPress.com or dashboard are loading slowly or not at all, we might ask you to send us the HTTP headers output from your browser.
To send this to us, follow the below instructions depending on your browser:
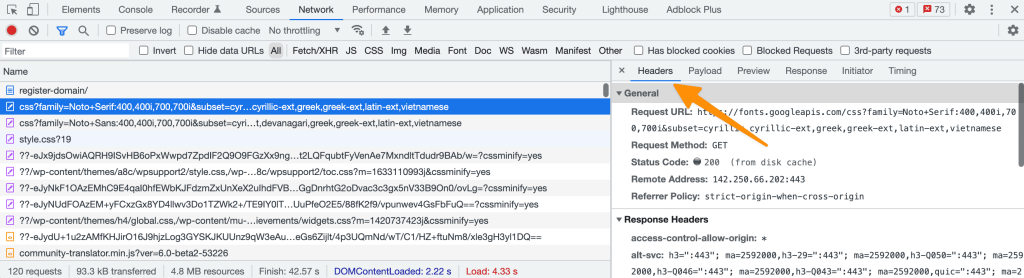
- Go to Tools → Browser Tools → Web Developer Tools in the Firefox menu. Then click on the Network tab on the bottom panel.
- You can also open Developer Tools from Application Menu (the three horizontal lines at the top right) → More Tools → Web Developer Tools.
- In your browser address bar, go to your WordPress.com site. That will log HTTP calls in the Network tab.
- Click the Separate Window option at the upper–right corner of the Network tab, then maximize that window:

- Take a screenshot image for each “page” by scrolling down until you’ve captured all the results in screenshots (it will likely take more than one).
- (Optional) If there are any resources that take more than a few seconds to load, you can click on that line to display the Request and Response Headers:

- In Google Chrome, go to View → Developer → Developer Tools (Ctrl-Shift-I for Windows), then click the Network tab at the top of the console that opens.
- You can also open Developer Tools from Settings (the three vertical dots at the top right) → More Tools → Developer Tools. Then click on the Network tab.
- In your browser address bar, go to your WordPress.com site. That will log HTTP calls in the Network tab. Click the Undock into separate window button, located at the upper–right corner of Developer Tools, then maximize that window:

- Click on the Time column at the top to sort by time (descending, denoted with a downward pointing arrow in the header row). Scroll to the top of the list to display the slowest loading content.
- Take a screenshot image for each “page” by scrolling down until you’ve captured all the results in screenshots (it will likely take more than one).
- (Optional) If there are any resources that take more than a few seconds to load, you can click on that line to display the Request and Response Headers:
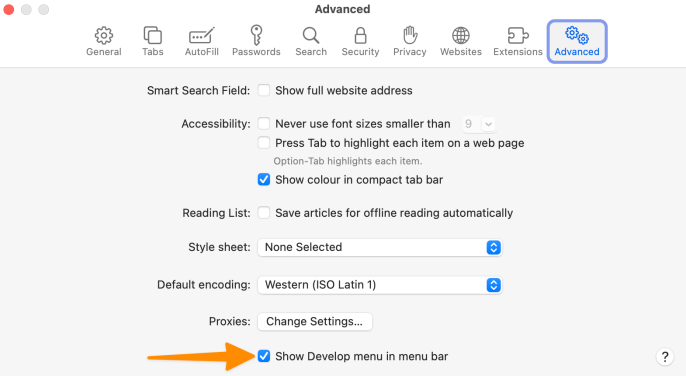
- In Safari, open Preferences, then click the Advanced tab, and check “Show Develop menu in menu bar”.
- In the Safari menu, go to Develop → Show Web Inspector.
- In the panel that opens at the bottom, click on the Timelines tab, and then on the Network Requests panel on the left.
- In the address bar, go to your WordPress.com site. That will log HTTP calls in the Details section at the bottom of the Network Requests tab:

- Take a screenshot image for each “page” by scrolling down until you’ve captured all the results in screenshots (it will likely take more than one).
- You can also see the Request and Response Headers by clicking on the Network tab, and then on a specific request on the left:

JavaScript Errors
If you’re having trouble with one of the interactive elements in your Dashboard, such as the Add Media button, we might ask you to check your console for JavaScript errors.
To do this, go to the screen where you are having the problem, and then follow the steps for your browser below:
JavaScript Errors in Mozilla Firefox
- Go to Tools → Browser Tools → Web Developer Tools in the Firefox menu.
- You can also open Browser Console from Application Menu (the three horizontal lines at the top right) → More Tools → Browser Console.
- Click on the Console tab.
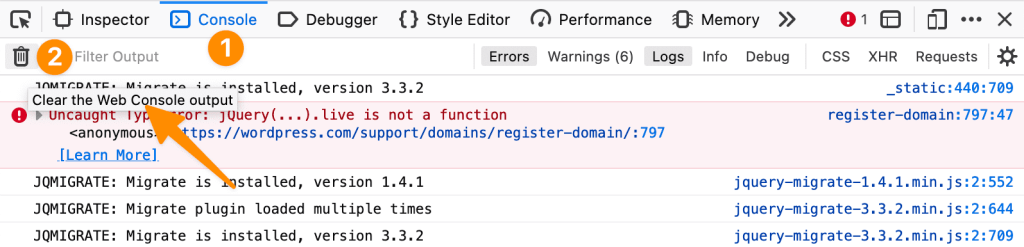
- In the console toolbar, click the Clear the Web Console output button, and reload the page.
- Take a screenshot of all the errors that are shown. You can choose the Separate Window option to display all the errors on a larger window before capturing the screenshot.

JavaScript Errors in Google Chrome
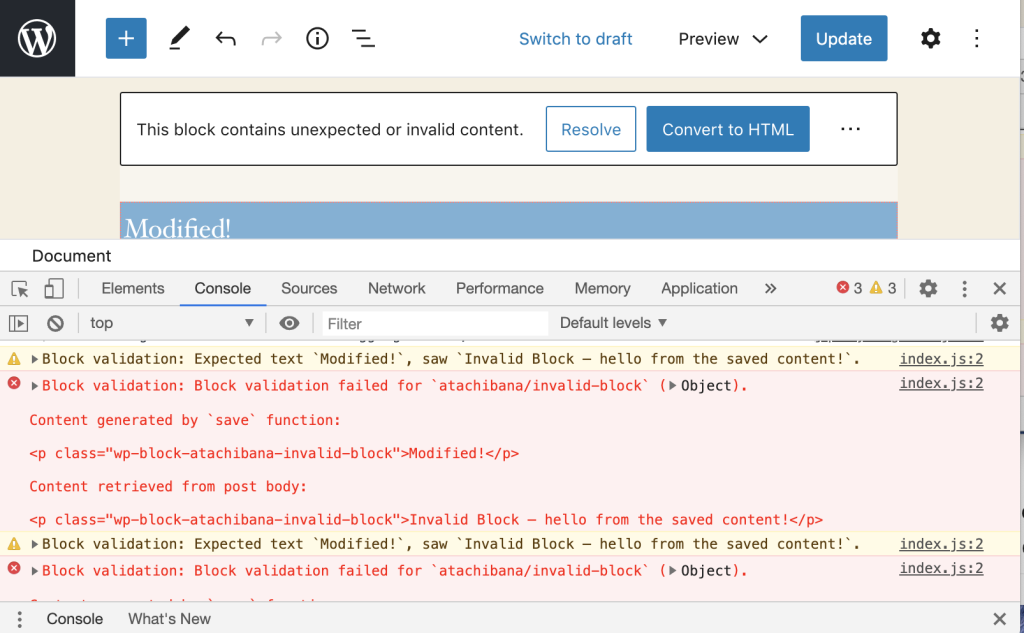
- In Google Chrome, go to View → Developer → JavaScript Console (Press Ctrl-Shift-I for Windows).
- You can also open Developer Tools from Settings (the three vertical dots at the top right) → More Tools → Developer Tools, and then click on the Console tab.
- The error console will open at the bottom of the page. If you don’t see any errors, make sure that the Console tab at the top of the console and reload your site to log any JavaScript errors.

- Take a screenshot of all the errors that are shown. You might need to drag the top of the console higher so that all the errors are displayed on the screen.
JavaScript Errors in Safari
- In Safari, open Preferences, then click the Advanced tab, and check “Show Develop menu in menu bar”.
- In your Safari menu, go to Develop → Show JavaScript Console, and the Error Console will open at the bottom of your screen:

- Take a screenshot of all the errors that are shown. You might need to drag the top of the console higher so that all the errors are displayed on the screen.
Screenshots
When we need to see a screenshot and you can still access your dashboard, you can upload the screenshot images to your Media Library. Otherwise, you can upload your screenshot images to a third-party service, such as Snipboard, and share the link(s) with us.
JavaScript Errors Handbook
This README contains information that I’ve learned over the years about dealing with JavaScript errors, reporting them to the server, and navigating through a lot of bugs that can make this all really hard. Browsers have improved in this area, but there is still room left to improve to make sure that all applications can sanely and soundly handle any error that happens.
Test cases for content found in this guide can be found at https://mknichel.github.io/javascript-errors/.
Table of Contents
- Introduction
- Anatomy of a JavaScript Error
- Producing a JavaScript Error
- Error Messages
- Stack Trace Format
- Catching JavaScript Errors
- window.onerror
- try/catch
- Protected Entry Points
- Promises
- Web Workers
- Chrome Extensions
Introduction
Catching, reporting, and fixing errors is an important part of any application to ensure the health and stability of the application. Since JavaScript code is also executed on the client and in many different browser environments, staying on top of JS Errors from your application can also be hard. There are no formal web specs for how to report JS errors which cause differences in each browser’s implementation. Additionally, there have been many bugs in browsers’ implementation of JavaScript errors as well that have made this even harder. This page navigates through these aspects of JS Errors so that future developers can handle errors better and browsers will hopefully converge on standardized solutions.
Anatomy of a JavaScript Error
A JavaScript error is composed of two primary pieces: the error message and the stack trace. The error message is a string that describes what went wrong, and the stack trace describes where in the code the error happened. JS Errors can be produced either by the browser itself or thrown by application code.
Producing a JavaScript Error
A JS Error can be thrown by the browser when a piece of code doesn’t execute properly, or it can be thrown directly by code.
For example:
In this example, a variable that is actually a number can’t be invoked as a function. The browser will throw an error like TypeError: a is not a function with a stack trace that points to that line of code.
A developer might also want to throw an error in a piece of code if a certain precondition is not met. For example
if (!checkPrecondition()) {
  throw new Error("Doesn't meet precondition!");
}
In this case, the error will be Error: Doesn't meet precondition!. This error will also contain a stack trace that points to the appropriate line. Errors thrown by the browser and application code can be handled the same.
There are multiple ways that developers can throw an error in JavaScript:
throw new Error('Problem description.')throw Error('Problem description.')<— equivalent to the first onethrow 'Problem description.'<— badthrow null<— even worse
Throwing a string or null is really not recommended since the browser will not attach a stack trace to that error, losing the context of where that error ocurred in the code. It is best to throw an actual Error object, which will contain the error message as well as a stack trace that points to the right lines of code where the error happened.
Error Messages
Each browser has its own set of messages that it uses for the built in exceptions, such as the example above for trying to call a non-function. Browsers will try to use the same messages, but since there is no spec, this is not guaranteed. For example, both Chrome and Firefox use {0} is not a function for the above example while IE11 will report Function expected (notably also without reporting what variable was attempted to be called).
However, browsers tend to diverge often as well. When there are multiple default statements in a switch statement, Chrome will throw "More than one default clause in switch statement" while Firefox will report "more than one switch default". As new features are added to the web, these error messages have to be updated. These differences can come into play later when you are trying to handle reported errors from obfuscated code.
You can find the templates that browsers use for error messages at:
- Firefox — http://mxr.mozilla.org/mozilla1.9.1/source/js/src/js.msg
- Chrome — https://code.google.com/p/v8/source/browse/branches/bleeding_edge/src/messages.js
- Internet Explorer — https://github.com/Microsoft/ChakraCore/blob/4e4d4f00f11b2ded23d1885e85fc26fcc96555da/lib/Parser/rterrors.h
 Browsers will produce different error messages for some exceptions.
Stack Trace Format
The stack trace is a description of where the error happened in the code. It is composed of a series of frames, where each frames describe a particular line in the code. The topmost frame is the location where the error was thrown, while the subsequent frames are the function call stack — or how the code was executed to get to that point where the error was thrown. Since JavaScript is usually concatenated and minified, it is also important to have column numbers so that the exact statement can be located when a given line has a multitude of statements.
A basic stack trace in Chrome looks like:
  at throwError (http://mknichel.github.io/javascript-errors/throw-error-basic.html:8:9)
  at http://mknichel.github.io/javascript-errors/throw-error-basic.html:12:3
Each stack frame consists of a function name (if applicable and the code was not executed in the global scope), the script that it came from, and the line and column number of the code.
Unfortunately, there is no standard for the stack trace format so this differs by browser.
Microsoft Edge and IE 11’s stack trace looks similar to Chrome’s except it explicitly lists Global code:
  at throwError (http://mknichel.github.io/javascript-errors/throw-error-basic.html:8:3)
  at Global code (http://mknichel.github.io/javascript-errors/throw-error-basic.html:12:3)
Firefox’s stack trace looks like:
  throwError@http://mknichel.github.io/javascript-errors/throw-error-basic.html:8:9
  @http://mknichel.github.io/javascript-errors/throw-error-basic.html:12:3
Safari’s format is similar to Firefox’s format but is also slightly different:
  throwError@http://mknichel.github.io/javascript-errors/throw-error-basic.html:8:18
  global code@http://mknichel.github.io/javascript-errors/throw-error-basic.html:12:13
The same basic information is there, but the format is different.
Also note that in the Safari example, aside from the format being different than Chrome, the column numbers are different than both Chrome and Firefox. The column numbers also can deviate more in different error situations — for example in the code (function namedFunction() { throwError(); })();, Chrome will report the column for the throwError() function call while IE11 reports the column number as the start of the string. These differences will come back into play later when the server needs to parse the stack trace for reported errors and deobfuscate obfuscated stack traces.
See https://developer.mozilla.org/en-US/docs/Web/JavaScript/Reference/Global_Objects/Error/Stack for more information on the stack property of errors. When accessing the Error.stack property, Chrome does include the error message as part of the stack but Safari 10+ does not.
The format of stack traces is different by browser in form and column numbers used.
Diving in more, there are a lot of nuances to stack trace formats that are discussed in the below sections.
Naming anonymous functions
By default, anonymous functions have no name and either appear as empty string or «Anonymous function» in the function names in the stack trace (depending on the browser). To improve debugging, you should add a name to all functions to ensure it appears in the stack frame. The easiest way to do this is to ensure that anonymous functions are specified with a name, even if that name is not used anywhere else. For example:
setTimeout(function nameOfTheAnonymousFunction() { ... }, 0);
This will cause the stack trace to go from:
at http://mknichel.github.io/javascript-errors/javascript-errors.js:125:17
to
at nameOfTheAnonymousFunction (http://mknichel.github.io/javascript-errors/javascript-errors.js:121:31)
In Safari, this would go from:
https://mknichel.github.io/javascript-errors/javascript-errors.js:175:27
to
nameOfTheAnonymousFunction@https://mknichel.github.io/javascript-errors/javascript-errors.js:171:41
This method ensures that nameOfTheAnonymousFunction appears in the frame for any code from inside that function, making debugging much easier. See http://www.html5rocks.com/en/tutorials/developertools/async-call-stack/#toc-debugging-tips for more information.
Assigning functions to a variable
Browsers will also use the name of the variable or property that a function is assigned to if the function itself does not have a name. For example, in
var fnVariableName = function() { ... };
browsers will use fnVariableName as the name of the function in stack traces.
    at throwError (http://mknichel.github.io/javascript-errors/javascript-errors.js:27:9)
    at fnVariableName (http://mknichel.github.io/javascript-errors/javascript-errors.js:169:37)
Even more nuanced than that, if this variable is defined within another function, all browsers will use just the name of the variable as the name of the function in the stack trace except for Firefox, which will use a different form that concatenates the name of the outer function with the name of the inner variable. Example:
function throwErrorFromInnerFunctionAssignedToVariable() {
  var fnVariableName = function() { throw new Error("foo"); };
  fnVariableName();
}
will produce in Firefox:
throwErrorFromInnerFunctionAssignedToVariable/fnVariableName@http://mknichel.github.io/javascript-errors/javascript-errors.js:169:37
In other browsers, this would look like:
at fnVariableName (http://mknichel.github.io/javascript-errors/javascript-errors.js:169:37)
Firefox uses different stack frame text for functions defined within another function.
displayName Property
The display name of a function can also be set by the displayName property in all major browsers except for IE11. In these browsers, the displayName will appear in the devtools debugger, but in all browsers but Safari, it will not be used in Error stack traces (Safari differs from the rest by also using the displayName in the stack trace associated with an error).
var someFunction = function() {};
someFunction.displayName = " # A longer description of the function.";
There is no official spec for the displayName property, but it is supported by all the major browsers. See https://developer.mozilla.org/en-US/docs/Web/JavaScript/Reference/Global_Objects/Function/displayName and http://www.alertdebugging.com/2009/04/29/building-a-better-javascript-profiler-with-webkit/ for more information on displayName.
IE11 doesn’t support the displayName property.
Safari uses the displayName property as the symbol name in Error stack traces.
Programatically capturing stack traces
If an error is reported without a stack trace (see more details when this would happen below), then it’s possible to programatically capture a stack trace.
In Chrome, this is really easy to do by using the Error.captureStackTrace API. See https://github.com/v8/v8/wiki/Stack%20Trace%20API for more information on the use of this API.
For example:
function ignoreThisFunctionInStackTrace() {
  var err = new Error();
  Error.captureStackTrace(err, ignoreThisFunctionInStackTrace);
  return err.stack;
}
In other browsers, a stack trace can also be collected by creating a new error and accessing the stack property of that object:
var err = new Error('');
return err.stack;
However, IE10 only populates the stack trace when the error is actually thrown:
try {
  throw new Error('');
} catch (e) {
  return e.stack;
}
If none of these approaches work, then it’s possible to create a rough stack trace without line numbers or columns by iterating over the arguments.callee.caller object — this won’t work in ES5 Strict Mode though and it’s not a recommended approach.
Async stack traces
It is very common for asynchronous points to be inserted into JavaScript code, such as when code uses setTimeout or through the use of Promises. These async entry points can cause problems for stack traces, since they cause a new execution context to form and the stack trace starts from scratch again.
Chrome DevTools has support for async stack traces, or in other words making sure the stack trace of an error also shows the frames that happened before the async point was introduced. With the use of setTimeout, this will capture who called the setTimeout function that eventually produced an error. See http://www.html5rocks.com/en/tutorials/developertools/async-call-stack/ for more information.
An async stack trace will look like:
  throwError	@	throw-error.js:2
  setTimeout (async)
  throwErrorAsync	@	throw-error.js:10
  (anonymous function)	@	throw-error-basic.html:14
Async stack traces are only supported in Chrome DevTools right now, only for exceptions that are thrown when DevTools are open. Stack traces accessed from Error objects in code will not have the async stack trace as part of it.
It is possible to polyfill async stack traces in some cases, but this could cause a significant performance hit for your application since capturing a stack trace is not cheap.
Only Chrome DevTools natively supports async stack traces.
Naming inline scripts and eval
Stack traces for code that was eval’ed or inlined into a HTML page will use the page’s URL and line/column numbers for the executed code.
For example:
  at throwError (http://mknichel.github.io/javascript-errors/throw-error-basic.html:8:9)
  at http://mknichel.github.io/javascript-errors/throw-error-basic.html:12:3
If these scripts actually come from a script that was inlined for optimization reasons, then the URL, line, and column numbers will be wrong. To work around this problem, Chrome and Firefox support the //# sourceURL= annotation (Safari, Edge, and IE do not). The URL specified in this annotation will be used as the URL for all stack traces, and the line and column number will be computed relative to the start of the <script> tag instead of the HTML document. For the same error as above, using the sourceURL annotation with a value of «inline.js» will produce a stack trace that looks like:
  at throwError (http://mknichel.github.io/javascript-errors/inline.js:8:9)
  at http://mknichel.github.io/javascript-errors/inline.js:12:3
This is a really handy technique to make sure that stack traces are still correct even when using inline scripts and eval.
http://www.html5rocks.com/en/tutorials/developertools/sourcemaps/#toc-sourceurl describes the sourceURL annotation in more detail.
Safari, Edge, and IE do not support the sourceURL annotation for naming inline scripts and evals. If you use inline scripts in IE or Safari and you obfuscate your code, you will not be able to deobfuscate errors that come from those scripts.
Up until Chrome 42, Chrome did not compute line numbers correctly for inline scripts that use the sourceURL annotation. See https://bugs.chromium.org/p/v8/issues/detail?id=3920 for more information.
Line numbers for stack frames from inline scripts are incorrect when the sourceURL annotation is used since they are relative to the start of the HTML document instead of the start of the inline script tag (making correct deobfuscation not possible). https://code.google.com/p/chromium/issues/detail?id=578269
Eval stack traces
For code that uses eval, there are other differences in the stack trace besides whether or not it uses the sourceURL annotation. In Chrome, a stack trace from a statement used in eval could look like:
Error: Error from eval
    at evaledFunction (eval at evalError (http://mknichel.github.io/javascript-errors/javascript-errors.js:137:3), <anonymous>:1:36)
    at eval (eval at evalError (http://mknichel.github.io/javascript-errors/javascript-errors.js:137:3), <anonymous>:1:68)
    at evalError (http://mknichel.github.io/javascript-errors/javascript-errors.js:137:3)
In MS Edge and IE11, this would look like:
Error from eval
    at evaledFunction (eval code:1:30)
    at eval code (eval code:1:2)
    at evalError (http://mknichel.github.io/javascript-errors/javascript-errors.js:137:3)
In Safari:
Error from eval
    evaledFunction
    eval code
    eval@[native code]
    evalError@http://mknichel.github.io/javascript-errors/javascript-errors.js:137:7
and in Firefox:
Error from eval
    evaledFunction@http://mknichel.github.io/javascript-errors/javascript-errors.js line 137 > eval:1:36
    @http://mknichel.github.io/javascript-errors/javascript-errors.js line 137 > eval:1:11
    evalError@http://mknichel.github.io/javascript-errors/javascript-errors.js:137:3
These differences can make it hard to parse eval code the same across all browsers.
Each browser uses a different stack trace format for errors that happened inside eval.
Stack traces with native frames
Your JavaScript code can also be called directly from native code. Array.prototype.forEach is a good example — you pass a function to forEach and the JS engine will call that function for you.
function throwErrorWithNativeFrame() {
  var arr = [0, 1, 2, 3];
  arr.forEach(function namedFn(value) {
    throwError();
  });
}
This produces different stack traces in different browsers. Chrome and Safari append the name of the native function in the stack trace itself as a separate frame, such as:
(Chrome)
    at namedFn (http://mknichel.github.io/javascript-errors/javascript-errors.js:153:5)
    at Array.forEach (native)
    at throwErrorWithNativeFrame (http://mknichel.github.io/javascript-errors/javascript-errors.js:152:7)

(Safari)
    namedFn@http://mknichel.github.io/javascript-errors/javascript-errors.js:153:15
    forEach@[native code]
    throwErrorWithNativeFrame@http://mknichel.github.io/javascript-errors/javascript-errors.js:152:14

(Edge)
    at namedFn (http://mknichel.github.io/javascript-errors/javascript-errors.js:153:5)
    at Array.prototype.forEach (native code)
    at throwErrorWithNativeFrame (http://mknichel.github.io/javascript-errors/javascript-errors.js:152:7)
However, Firefox and IE11 do not show that forEach was called as part of the stack:
namedFn@http://mknichel.github.io/javascript-errors/javascript-errors.js:153:5
throwErrorWithNativeFrame@http://mknichel.github.io/javascript-errors/javascript-errors.js:152:3
Some browsers include native code frames in stack traces, while others do not.
Catching JavaScript Errors
To detect that your application had an error, some code must be able to catch that error and report about it. There are multiple techniques for catching errors, each with their pros and cons.
window.onerror
window.onerror is one of the easiest and best ways to get started catching errors. By assigning window.onerror to a function, any error that is uncaught by another part of the application will be reported to this function, along with some information about the error. For example:
window.onerror = function(msg, url, line, col, err) {
  console.log('Application encountered an error: ' + msg);
  console.log('Stack trace: ' + err.stack);
}
https://developer.mozilla.org/en-US/docs/Web/API/GlobalEventHandlers/onerror describes this in more detail.
Historically, there have been a few problems with this approach:
No Error object provided
The 5th argument to the window.onerror function is supposed to be an Error object. This was added to the WHATWG spec in 2013: https://html.spec.whatwg.org/multipage/webappapis.html#errorevent. Chrome, Firefox, and IE11 now properly provide an Error object (along with the critical stack property), but Safari, MS Edge, and IE10 do not. This works in Firefox since Firefox 14 (https://bugzilla.mozilla.org/show_bug.cgi?id=355430) and in Chrome since late 2013 (https://mikewest.org/2013/08/debugging-runtime-errors-with-window-onerror, https://code.google.com/p/chromium/issues/detail?id=147127). Safari 10 launched support for the Error object in window.onerror.
Safari (versions below 10), MS Edge, and IE10 do not support an Error object with a stack trace in window.onerror.
Cross domain sanitization
In Chrome, errors that come from another domain in the window.onerror handler will be sanitized to «Script error.», «», 0. This is generally okay if you really don’t want to process the error if it comes from a script that you don’t care about, so the application can filter out errors that look like this. However, this does not happen in Firefox or Safari or IE11, nor does Chrome do this for try/catch blocks that wrap the offending code.
If you would like to receive errors in window.onerror in Chrome with full fidelity from cross domain scripts, those resources must provide the appropriate cross origin headers. See https://mikewest.org/2013/08/debugging-runtime-errors-with-window-onerror for more information.
Chrome is the only browser that will sanitize errors that come from another origin. Take care to filter these out, or set the appropriate headers.
Chrome Extensions
In old versions of Chrome, Chrome extensions that are installed on a user’s machine could also throw errors that get reported to window.onerror. This has been fixed in newer versions of Chrome. See the dedicated Chrome Extensions section below.
window.addEventListener(«error»)
The window.addEventListener("error") API works the same as the window.onerror API. See http://www.w3.org/html/wg/drafts/html/master/webappapis.html#runtime-script-errors for more information on this approach.
Showing errors in DevTools console for development
Catching errors via window.onerror does not prevent that error from also appearing in the DevTools console. This is most likely the right behavior for development since the developer can easily see the error. If you don’t want these errors to show up in production to end users, e.preventDefault() can be called if using the window.addEventListener approach.
Recommendation
window.onerror is the best tool to catch and report JS errors. It’s recommended that only JS errors with valid Error objects and stack traces are reported back to the server, otherwise the errors may be hard to investigate or you may get a lot of spam from Chrome extensions or cross domain scripts.
try/catch
Given the above section, unfortunately it’s not possible to rely on window.onerror in all browsers to capture all error information. For catching exceptions locally, a try/catch block is the obvious choice. It’s also possible to wrap entire JavaScript files in a try/catch block to capture error information that can’t be caught with window.onerror. This improves the situations for browsers that don’t support window.onerror, but also has some downsides.
Doesn’t catch all errors
A try/catch block won’t capture all errors in a program, such as errors that are thrown from an async block of code through window.setTimeout. Try/catch can be used with Protected Entry Points to help fill in the gaps.
try/catch blocks wrapping the entire application aren’t sufficient to catch all errors.
Deoptimizations
Old versions of V8 (and potentially other JS engines), functions that contain a try/catch block won’t be optimized by the compiler (http://www.html5rocks.com/en/tutorials/speed/v8/). Chrome fixed this in TurboFan (https://codereview.chromium.org/1996373002).
Protected Entry Points
An «entry point» into JavaScript is any browser API that can start execution of your code. Examples include setTimeout, setInterval, event listeners, XHR, web sockets, or promises. Errors that are thrown from these entry points will be caught by window.onerror, but in the browsers that don’t support the full Error object in window.onerror, an alternative mechanism is needed to catch these errors since the try/catch method mentioned above won’t catch them either.
Thankfully, JavaScript allows these entry points to be wrapped so that a try/catch block can be inserted before the function is invoked to catch any errors thrown by the code.
Each entry point will need slightly different code to protect the entry point, but the gist of the methodology is:
function protectEntryPoint(fn) {
  return function protectedFn() {
    try {
      return fn();
    } catch (e) {
      // Handle error.
    }
  }
}
_oldSetTimeout = window.setTimeout;
window.setTimeout = function protectedSetTimeout(fn, time) {
  return _oldSetTimeout.call(window, protectEntryPoint(fn), time);
};
Promises
Sadly, it’s easy for errors that happen in Promises to go unobserved and unreported. Errors that happen in a Promise but are not handled by attaching a rejection handler are not reported anywhere else — they do not get reported to window.onerror. Even if a Promise attaches a rejection handler, that code itself must manually report those errors for them to be logged. See http://www.html5rocks.com/en/tutorials/es6/promises/#toc-error-handling for more information. For example:
window.onerror = function(...) {
  // This will never be invoked by Promise code.
};

var p = new Promise(...);
p.then(function() {
  throw new Error("This error will be not handled anywhere.");
});

var p2 = new Promise(...);
p2.then(function() {
  throw new Error("This error will be handled in the chain.");
}).catch(function(error) {
  // Show error message to user
  // This code should manually report the error for it to be logged on the server, if applicable.
});
One approach to capture more information is to use Protected Entry Points to wrap invocations of Promise methods with a try/catch to report errors. This might look like:
  var _oldPromiseThen = Promise.prototype.then;
  Promise.prototype.then = function protectedThen(callback, errorHandler) {
    return _oldPromiseThen.call(this, protectEntryPoint(callback), protectEntryPoint(errorHandler));
  };
Sadly, errors from Promises will go unhandled by default.
Error handling in Promise polyfills
Promise implementations, such as Q, Bluebird, and Closure handle errors in different ways which are better than the error handling in the browser implementation of Promises.
- In Q, you can «end» the Promise chain by calling
.done()which will make sure that if an error wasn’t handled in the chain, it will get rethrown and reported. See https://github.com/kriskowal/q#handling-errors - In Bluebird, unhandled rejections are logged and reported immediately. See http://bluebirdjs.com/docs/features.html#surfacing-unhandled-errors
- In Closure’s goog.Promise implementation, unhandled rejections are logged and reported if no chain in the Promise handles the rejection within a configurable time interval (in order to allow code later in the program to add a rejection handler).
Long stack traces
The async stack trace section above discusses that browsers don’t capture stack information when there is an async hook, such as calling Promise.prototype.then. Promise polyfills feature a way to capture the async stack trace points which can make diagnosing errors much easier. This approach is expensive, but it can be really useful for capturing more debug information.
- In Q, call
Q.longStackSupport = true;. See https://github.com/kriskowal/q#long-stack-traces - In Bluebird, call
Promise.longStackTraces()somewhere in the application. See http://bluebirdjs.com/docs/features.html#long-stack-traces. - In Closure, set
goog.Promise.LONG_STACK_TRACESto true.
Promise Rejection Events
Chrome 49 added support for events that are dispatched when a Promise is rejected. This allows applications to hook into Promise errors to ensure that they get centrally reported along with the rest of the errors.
window.addEventListener('unhandledrejection', event => {
  // event.reason contains the rejection reason. When an Error is thrown, this is the Error object.
});
See https://googlechrome.github.io/samples/promise-rejection-events/ and https://www.chromestatus.com/feature/4805872211460096 for more information.
This is not supported in any other browser.
Web Workers
Web workers, including dedicated workers, shared workers, and service workers, are becoming more popular in applications today. Since all of these workers are separate scripts from the main page, they each need their own error handling code. It is recommended that each worker script install its own error handling and reporting code for maximum effectiveness handling errors from workers.
Dedicated workers
Dedicated web workers execute in a different execution context than the main page, so errors from workers aren’t caught by the above mechanisms. Additional steps need to be taken to capture errors from workers on the page.
When a worker is created, the onerror property can be set on the new worker:
var worker = new Worker('worker.js');
worker.onerror = function(errorEvent) { ... };
This is defined in https://html.spec.whatwg.org/multipage/workers.html#handler-abstractworker-onerror. The onerror function on the worker has a different signature than the window.onerror discussed above. Instead of accepting 5 arguments, worker.onerror takes a single argument: an ErrorEvent object. The API for this object can be found at https://developer.mozilla.org/en-US/docs/Web/API/ErrorEvent. It contains the message, filename, line, and column, but no stable browser today contains the «Error» object that contains the stack trace (errorEvent.error is null). Since this API is executed in the parent page’s scope, it would be useful for using the same reporting mechanism as the parent page; unfortunately due to the lack of a stack trace, this API is of limited use.
Inside of the JS run by the worker, you can also define an onerror API that follows the usual window.onerror API: https://html.spec.whatwg.org/multipage/webappapis.html#onerroreventhandler. In the worker code:
self.onerror = function(message, filename, line, col, error) { ... };
The discussion of this API mostly follows the discussion above for window.onerror. However, there are 2 notable things to point out:
Firefox and Safari do not report the «error» object as the 5th argument to the function, so these browsers do not get a stack trace from the worker (Chrome, MS Edge, and IE11 do get a stack trace). Protected Entry Points for the onmessage function within the worker can be used to capture stack trace information for these browsers.
Since this code executes within the worker, the code must choose how to report the error back to the server: It must either use postMessage to communicate the error back to the parent page, or install an XHR error reporting mechanism (discussed more below) in the worker itself.
In Firefox, Safari, and IE11 (but not in Chrome), the parent page’s window.onerror function will also be called after the worker’s own onerror and the onerror event listener set by the page has been called. However, this window.onerror will also not contain an error object and therefore won’t have a stack trace also. These browsers must also take care to not report errors from workers multiple times.
Shared workers
Chrome and Firefox support the SharedWorker API for sharing a worker among multiple pages. Since the worker is shared, it is not attached to one parent page exclusively; this leads to some differences in how errors are handled, although SharedWorker mostly follows the same information as the dedicated web worker.
In Chrome, when there is an error in a SharedWorker, only the worker’s own error handling within the worker code itself will be called (like if they set self.onerror). The parent page’s window.onerror will not be called, and Chrome does not support the inherited AbstractWorker.onerror that can be called in the parent page as defined in the spec.
In Firefox, this behavior is different. An error in the shared worker will cause the parent page’s window.onerror to be called, but the error object will be null. Additionally, Firefox does support the AbstractWorker.onerror property, so the parent page can attach an error handler of its own to the worker. However, when this error handler is called, the error object will be null so there will be no stack trace, so it’s of limited use.
Error handling for shared workers differs by browser.
Service Workers
Service Workers are a brand new spec that is currently only available in recent Chrome and Firefox versions. These workers follow the same discussion as dedicated web workers.
Service workers are installed by calling the navigator.serviceWorker.register function. This function returns a Promise which will be rejected if there was an error installing the service worker, such as it throwing an error during initialization. This error will only contain a string message and nothing else. Additionally, since Promises don’t report errors to window.onerror handlers, the application itself would have to add a catch block to the Promise to catch the error.
navigator.serviceWorker.register('service-worker-installation-error.js').catch(function(error) {
  // error typeof string
});
Just like the other workers, service workers can set a self.onerror function within the service workers to catch errors. Installation errors in the service worker will be reported to the onerror function, but unfortunately they won’t contain an error object or stack trace.
The service worker API contains an onerror property inherited from the AbstractWorker interface, but Chrome does not do anything with this property.
Worker Try/Catch
To capture stack traces in Firefox + Safari within a worker, the onmessage function can be wrapped in a try/catch block to catch any errors that propagate to the top.
self.onmessage = function(event) {
  try {
    // logic here
  } catch (e) {
    // Report exception.
  }
};
The normal try/catch mechanism will capture stack traces for these errors, producing an exception that looks like:
Error from worker
throwError@http://mknichel.github.io/javascript-errors/worker.js:4:9
throwErrorWrapper@http://mknichel.github.io/javascript-errors/worker.js:8:3
self.onmessage@http://mknichel.github.io/javascript-errors/worker.js:14:7
Chrome Extensions
Chrome Extensions deserve their own section since errors in these scripts can operate slightly differently, and historically (but not anymore) errors from Chrome Extensions have also been a problem for large popular sites.
Content Scripts
Content scripts are scripts that run in the context of web pages that a user visits. These scripts run in an isolated execution environment so they can access the DOM but they can not access JavaScript on the parent page (and vice versa).
Since content scripts have their own execution environment, they can assign to the window.onerror handler in their own script and it won’t affect the parent page. However, errors caught by window.onerror in the content script are sanitized by Chrome resulting in a «Script error.» with null filename and 0 for line and column. This bug is tracked by https://code.google.com/p/chromium/issues/detail?id=457785. Until that bug is fixed, a try/catch block or protected entry points are the only ways to catch JS errors in a content script with stack traces.
In years past, errors from content scripts would be reported to the window.onerror handler of the parent page which could result in a large amount of spammy error reports for popular sites. This was fixed in late 2013 though (https://code.google.com/p/chromium/issues/detail?id=225513).
Errors in Chrome Extensions are sanitized before being handled by window.onerror.
Browser Actions
Chrome extensions can also generate browser action popups, which are small HTML pages that spawn when a user clicks a Chrome extension icon to the right of the URL bar. These pages can also run JavaScript, in an entirely different execution environment from everything else. window.onerror works properly for this JavaScript.
Reporting Errors to the Server
Once the client is configured to properly catch exceptions with correct stack traces, these exceptions should be reported back to the server so they can be tracked, analyzed, and then fixed. Typically this is done with a XHR endpoint that records the error message and the stack trace information, along with any relevant client context information, such as the version of the code that’s running, the user agent, the user’s locale, and the top level URL of the page.
If the application uses multiple mechanisms to catch errors, it’s important to not report the same error twice. Errors that contain a stack trace should be preferred; errors reported without a stack trace can be hard to track down in a large application.
If you’re experiencing issues with your interactive functionality this may be due to JavaScript errors or conflicts. For example, your flyout menus may be broken, your metaboxes don’t drag, or your add media buttons aren’t working. In order to formulate your support request it helps the team to know what the JavaScript error is.
This guide will show you how to diagnose JavaScript issues in different browsers.
Step 1: Try Another Browser
To make sure that this is a JavaScript error, and not a browser error, first of all try opening your site in another browser.
- if the site is not having the same issue in the new browser you know that the error is browser specific
- if the site is having the same error it is not an error that is specific to one browser
Make note of any browsers you are experiencing the error in. You can use this information when you are making a support request.
Step 2: Enable SCRIPT_DEBUG
You need to turn on script debugging. Open wp-config.php and add the following line before “That’s all, stop editing! Happy blogging”.
define('SCRIPT_DEBUG', true);Check to see if you are still having an issue.
- Issue is fixed – turn off script debugging and report the issue on the support forum, telling the volunteers that you turned on script debugging and it solved the problem.
- Issue persists – proceed to Step 3.
Step 3: Diagnosis
Now that you know which browsers you are experiencing issues in you can start to diagnose the issue.
Chrome
1. Open the DevTools
Press Command+Option+J (Mac) or Control+Shift+J (Windows, Linux, Chrome OS) to jump straight into the Console panel of Chrome DevTools.
Or, navigate to More Tools > Developer Tools from Chrome menu, and click Console tab.
2. Identify the Error
The error console will open. If you don’t see any errors try reloading the page. The error may be generated when the page loads.
The console will provide you with the error type, the location of the error and the line number
Firefox
1. Open the Web Console
Press Command+Option+K (Mac) or Control+Shift+K (Windows) to jump straight into the Console panel of Firefox Web Console.
Or, navigate to Web Development > Web Console from Firefox menu, and click Console tab.
2. Identify the Error
The error console will open. If you don’t see any errors try reloading the page. The error may be generated when the page loads.
The console will provide you with the error type, the location of the error and the line number
Edge
Refer above Chrome section.
Internet Explorer
Bear in mind, IE behaves vastly differently from other browsers when it comes to JS errors, and reports on them in disparate ways. The first thing to check when facing a problem in IE is if the problem only exists in IE. Also note that the debugging tools built into some IE versions are limited, and may not be available.
NOTE: WordPress officially dropped support for Internet Explorer 11 in WordPress 5.8. If you are currently using IE11, it is strongly recommended that you switch to a more modern browser, such as Google Chrome, Mozilla Firefox, Safari, or Microsoft Edge. More information can be found on the Making WordPress Blog.
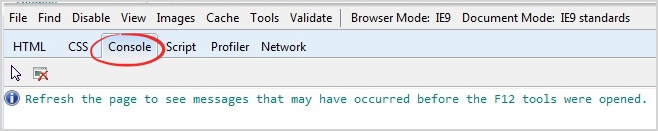
1. Open the Console
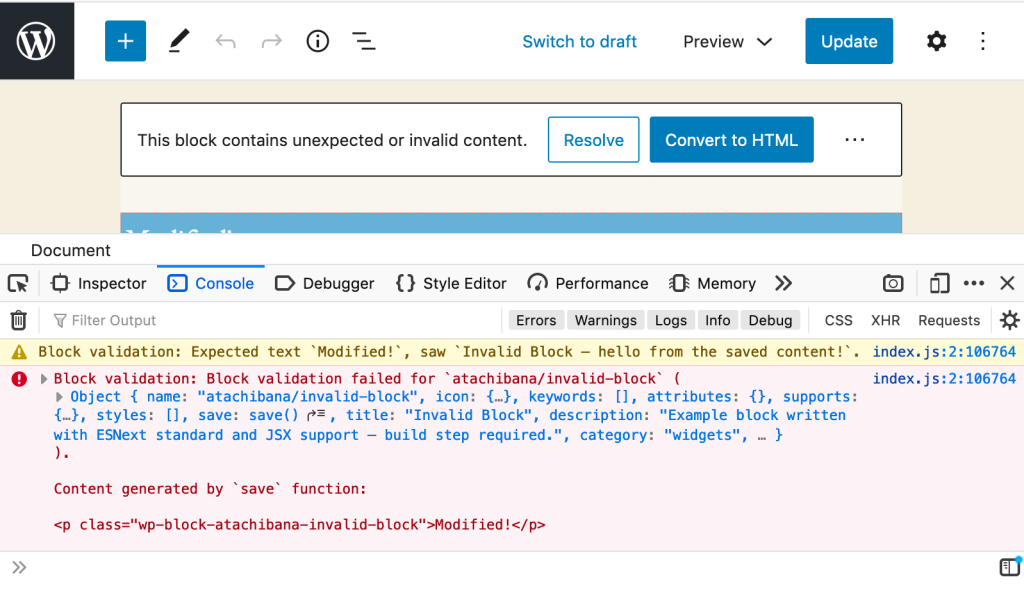
Go to the screen where you are experiencing the error. In Internet Explorer, navigate to Settings > F12 Developer Tools. Or click F12
Click on the Console tab.
2. Identify the Error
The error console will open. If you don’t see any errors try reloading the page. The error may be generated when the page loads.
The console will provide you with the error type, the location of the error and the line number

The image above shows the error to be in jquery.js on line 2.
Safari
1. Enable Developer Tools
Navigate to Safari > Preferences > Advanced and check the box that says Show Develop menu in menu bar
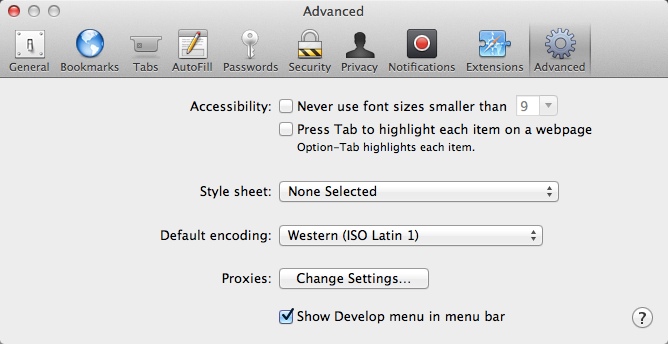
2. Open the Console
Go to the screen where you are experiencing the error. In Safari, navigate to Develop > Show Error Console
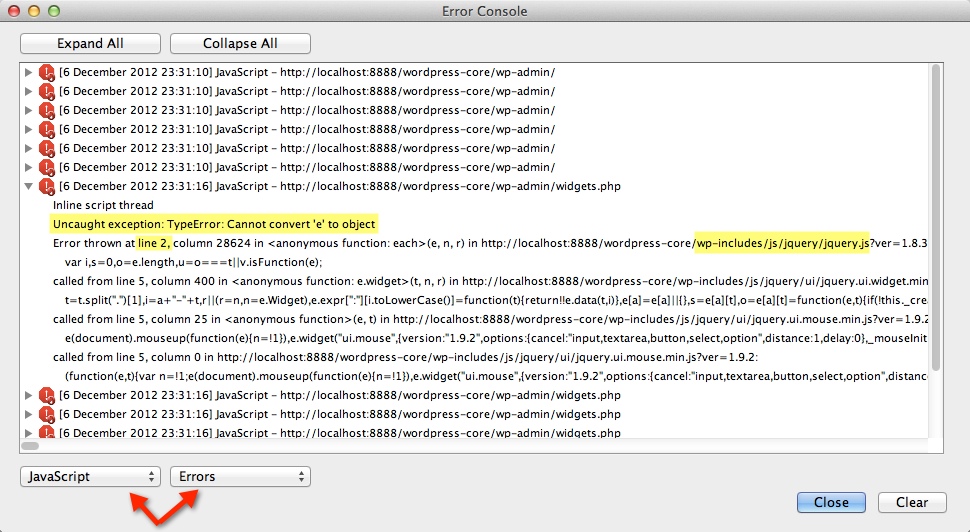
3. Identify the Error
The error console will open. If you don’t see any errors try reloading the page.
The console show you the error, the error location and the line number:

The image above shows the error to be in jquery.js on line 2.
Note: If you cannot see the error click the back button within the console.

Opera
1. Open the Console
Go to the screen where you are experiencing the error. In Chrome, navigate to Tools > Advanced > Error Console.
2. Identify the Error
The error console will open. Select JavaScript and Errors from the two drop downs. To find the error location, expand one of the errors. You’ll see the error and the location.
The image above shows the error to be in jquery.js on line 2, however remember to copy the whole stack information! Just saying what line is less helpful that showing context.
Step 4: Reporting
Now that you have diagnosed your error, you should make your support forum request. Go to the troubleshooting forum.
If your problem is with a specific theme or plugin, you can access their dedicated support forum by visiting https://wordpress.org/support/plugin/PLUGINNAME or https://wordpress.org/support/theme/THEMENAME
Please include the below information:
- the browsers that you are experiencing the problem in
- whether SCRIPT_DEBUG fixed the error or not
- the JavaScript error
- the location of the error – both the file name and the line number
- the context of the error – including the whole error stack will help developers

От автора: приветствую вас, друзья. Из этой небольшой статьи мы с вами узнаем, как увидеть и исправить ошибки JavaScript. Статья написана для начинающих изучение JavaScript.
При написании программы на любом языке программирования так или иначе не обходится без ошибок, которые необходимо уметь найти и исправить. В качестве примера давайте напишем простейшую программу, которая должна показать модальное окно:
В этой простейшей программе есть ошибка JavaScript, которую нам и нужно найти, поскольку с ней наш код не работает и модальное окно не показывается. Мало того, в JavaScript многие ошибки можно назвать фатальными, поскольку из-за них может прекратить работу не только ваш скрипт, но и сторонние библиотеки JavaScript до тех пор, пока ошибка не будет исправлена.

JavaScript. Быстрый старт
Изучите основы JavaScript на практическом примере по созданию веб-приложения
Узнать подробнее
Что же поможет найти ошибки JavaScript? Консоль браузера. Здесь мы вкратце пройдемся по этому инструменту в различных браузерах, в частности это будет Firefox и Chrome. В обоих браузерах консоль есть из коробки.
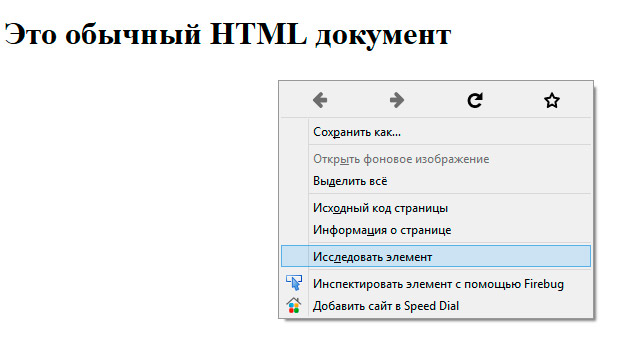
Начнем с Firefox. Для того, чтобы увидеть ошибку в нашем коде, необходимо открыть консоль браузера. Для этого кликаем в окне браузера правой кнопкой мыши и в контекстном меню выбираем пункт Исследовать элемент.
Внизу окна появится панель, в которой мы можем исследовать и отлаживать наш код. Полагаю, если вы верстали сайты, вы уже могли использовать этот инспектор кода для исследования верстки. Инструмент значительно упрощает жизнь верстальщика, даже и не представляю, как раньше верстали сайты без него 🙂
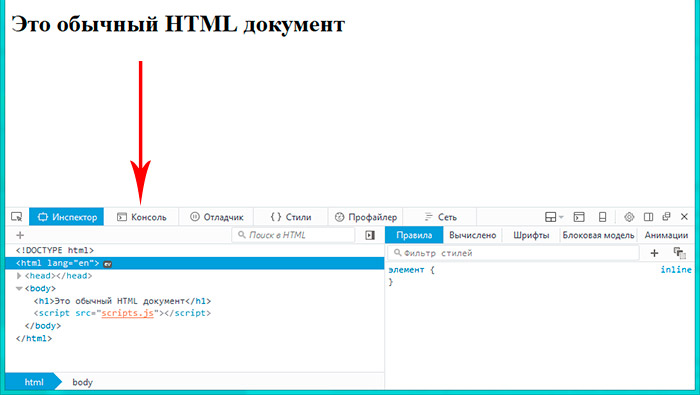
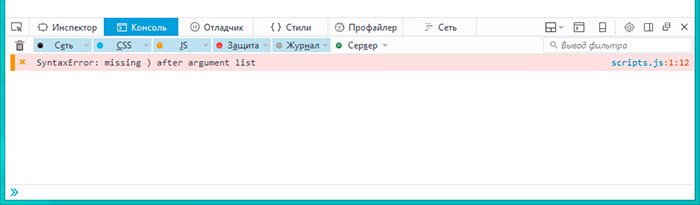
Итак, в открывшейся панели рядом со вкладкой Инспектор есть вкладка Консоль, она то нас и интересует. Переключимся на нее, еще раз обновим страницу и увидим все ошибки JavaScript. В нашем случае это всего одна синтаксическая ошибка, которая произошла в файле scripts.js на первой строке.
Нам остается лишь перейти в данный файл, заметить, что мы забыли заключить строку в кавычки и исправить эту ошибку:

Вот теперь ошибок нет и код успешно выполнился. Кроме встроенной консоли для Firefox можно отдельно установить расширение Firebug, которое, по сути, является аналогом. После установки Firebug можно вызвать, как и встроенную консоль, из контекстного меню или использовать для этого горячую клавишу F12. Вот таким образом выглядит Firebug:

Ну и консоль Хрома:

Она также вызывается из контекстного меню или клавишей F12.
Конечно, для исправления ошибки в единственной строке кода консоль зачастую не нужна. Но если кода десятки и сотни строк, тогда без консоли обойтись практически нереально. При этом в консоли можно не только смотреть ошибки, но и даже писать собственный JavaScript код, но это уже тема отдельной статьи.
На этом статья подошла к концу, теперь вы знаете, как найти в своем коде ошибки JavaScript и исправить их. Если вы хотите больше узнать о JavaScript, тогда рекомендую обратить свое внимание на уроки по JavaScript и отдельный курс по языку JavaScript. Удачи!
JavaScript. Быстрый старт
Изучите основы JavaScript на практическом примере по созданию веб-приложения
Узнать подробнее

JavaScript. Быстрый старт
Изучите основы JavaScript на практическом примере по созданию веб-приложения
Смотреть