Handling Application Errors
Applications fail, servers fail. Sooner or later you will see an exception
in production. Even if your code is 100% correct, you will still see
exceptions from time to time. Why? Because everything else involved will
fail. Here are some situations where perfectly fine code can lead to server
errors:
- the client terminated the request early and the application was still
reading from the incoming data - the database server was overloaded and could not handle the query
- a filesystem is full
- a harddrive crashed
- a backend server overloaded
- a programming error in a library you are using
- network connection of the server to another system failed
And that’s just a small sample of issues you could be facing. So how do we
deal with that sort of problem? By default if your application runs in
production mode, and an exception is raised Flask will display a very simple
page for you and log the exception to the :attr:`~flask.Flask.logger`.
But there is more you can do, and we will cover some better setups to deal
with errors including custom exceptions and 3rd party tools.
Error Logging Tools
Sending error mails, even if just for critical ones, can become
overwhelming if enough users are hitting the error and log files are
typically never looked at. This is why we recommend using Sentry for dealing with application errors. It’s
available as a source-available project on GitHub and is also available as a hosted version which you can try for free. Sentry
aggregates duplicate errors, captures the full stack trace and local
variables for debugging, and sends you mails based on new errors or
frequency thresholds.
To use Sentry you need to install the sentry-sdk client with extra
flask dependencies.
$ pip install sentry-sdk[flask]
And then add this to your Flask app:
import sentry_sdk
from sentry_sdk.integrations.flask import FlaskIntegration

sentry_sdk.init('YOUR_DSN_HERE', integrations=[FlaskIntegration()])
The YOUR_DSN_HERE value needs to be replaced with the DSN value you
get from your Sentry installation.
After installation, failures leading to an Internal Server Error
are automatically reported to Sentry and from there you can
receive error notifications.
See also:
- Sentry also supports catching errors from a worker queue
(RQ, Celery, etc.) in a similar fashion. See the Python SDK docs for more information. - Getting started with Sentry
- Flask-specific documentation
Error Handlers
When an error occurs in Flask, an appropriate HTTP status code will be
returned. 400-499 indicate errors with the client’s request data, or
about the data requested. 500-599 indicate errors with the server or
application itself.
You might want to show custom error pages to the user when an error occurs.
This can be done by registering error handlers.
An error handler is a function that returns a response when a type of error is
raised, similar to how a view is a function that returns a response when a
request URL is matched. It is passed the instance of the error being handled,
which is most likely a :exc:`~werkzeug.exceptions.HTTPException`.
The status code of the response will not be set to the handler’s code. Make
sure to provide the appropriate HTTP status code when returning a response from
a handler.
Registering
Register handlers by decorating a function with
:meth:`~flask.Flask.errorhandler`. Or use
:meth:`~flask.Flask.register_error_handler` to register the function later.
Remember to set the error code when returning the response.
@app.errorhandler(werkzeug.exceptions.BadRequest)
def handle_bad_request(e):
    return 'bad request!', 400

# or, without the decorator
app.register_error_handler(400, handle_bad_request)
:exc:`werkzeug.exceptions.HTTPException` subclasses like
:exc:`~werkzeug.exceptions.BadRequest` and their HTTP codes are interchangeable
when registering handlers. (BadRequest.code == 400)
Non-standard HTTP codes cannot be registered by code because they are not known
by Werkzeug. Instead, define a subclass of
:class:`~werkzeug.exceptions.HTTPException` with the appropriate code and
register and raise that exception class.
class InsufficientStorage(werkzeug.exceptions.HTTPException):
    code = 507
    description = 'Not enough storage space.'

app.register_error_handler(InsufficientStorage, handle_507)

raise InsufficientStorage()
Handlers can be registered for any exception class, not just
:exc:`~werkzeug.exceptions.HTTPException` subclasses or HTTP status
codes. Handlers can be registered for a specific class, or for all subclasses
of a parent class.
Handling
When building a Flask application you will run into exceptions. If some part
of your code breaks while handling a request (and you have no error handlers
registered), a «500 Internal Server Error»
(:exc:`~werkzeug.exceptions.InternalServerError`) will be returned by default.
Similarly, «404 Not Found»
(:exc:`~werkzeug.exceptions.NotFound`) error will occur if a request is sent to an unregistered route.
If a route receives an unallowed request method, a «405 Method Not Allowed»
(:exc:`~werkzeug.exceptions.MethodNotAllowed`) will be raised. These are all
subclasses of :class:`~werkzeug.exceptions.HTTPException` and are provided by
default in Flask.
Flask gives you the ability to raise any HTTP exception registered by
Werkzeug. However, the default HTTP exceptions return simple exception
pages. You might want to show custom error pages to the user when an error occurs.
This can be done by registering error handlers.
When Flask catches an exception while handling a request, it is first looked up by code.
If no handler is registered for the code, Flask looks up the error by its class hierarchy; the most specific handler is chosen.
If no handler is registered, :class:`~werkzeug.exceptions.HTTPException` subclasses show a
generic message about their code, while other exceptions are converted to a
generic «500 Internal Server Error».
For example, if an instance of :exc:`ConnectionRefusedError` is raised,
and a handler is registered for :exc:`ConnectionError` and
:exc:`ConnectionRefusedError`, the more specific :exc:`ConnectionRefusedError`
handler is called with the exception instance to generate the response.
Handlers registered on the blueprint take precedence over those registered
globally on the application, assuming a blueprint is handling the request that
raises the exception. However, the blueprint cannot handle 404 routing errors
because the 404 occurs at the routing level before the blueprint can be
determined.
Generic Exception Handlers
It is possible to register error handlers for very generic base classes
such as HTTPException or even Exception. However, be aware that
these will catch more than you might expect.
For example, an error handler for HTTPException might be useful for turning
the default HTML errors pages into JSON. However, this
handler will trigger for things you don’t cause directly, such as 404
and 405 errors during routing. Be sure to craft your handler carefully
so you don’t lose information about the HTTP error.
from flask import json
from werkzeug.exceptions import HTTPException

@app.errorhandler(HTTPException)
def handle_exception(e):
    """Return JSON instead of HTML for HTTP errors."""
    # start with the correct headers and status code from the error
    response = e.get_response()
    # replace the body with JSON
    response.data = json.dumps({
        "code": e.code,
        "name": e.name,
        "description": e.description,
    })
    response.content_type = "application/json"
    return response
An error handler for Exception might seem useful for changing how
all errors, even unhandled ones, are presented to the user. However,
this is similar to doing except Exception: in Python, it will
capture all otherwise unhandled errors, including all HTTP status
codes.
In most cases it will be safer to register handlers for more
specific exceptions. Since HTTPException instances are valid WSGI
responses, you could also pass them through directly.
from werkzeug.exceptions import HTTPException

@app.errorhandler(Exception)
def handle_exception(e):
    # pass through HTTP errors
    if isinstance(e, HTTPException):
        return e

    # now you're handling non-HTTP exceptions only
    return render_template("500_generic.html", e=e), 500
Error handlers still respect the exception class hierarchy. If you
register handlers for both HTTPException and Exception, the
Exception handler will not handle HTTPException subclasses
because it the HTTPException handler is more specific.
Unhandled Exceptions
When there is no error handler registered for an exception, a 500
Internal Server Error will be returned instead. See
:meth:`flask.Flask.handle_exception` for information about this
behavior.
If there is an error handler registered for InternalServerError,
this will be invoked. As of Flask 1.1.0, this error handler will always
be passed an instance of InternalServerError, not the original
unhandled error.
The original error is available as e.original_exception.
An error handler for «500 Internal Server Error» will be passed uncaught
exceptions in addition to explicit 500 errors. In debug mode, a handler
for «500 Internal Server Error» will not be used. Instead, the
interactive debugger will be shown.
Custom Error Pages
Sometimes when building a Flask application, you might want to raise a
:exc:`~werkzeug.exceptions.HTTPException` to signal to the user that
something is wrong with the request. Fortunately, Flask comes with a handy
:func:`~flask.abort` function that aborts a request with a HTTP error from
werkzeug as desired. It will also provide a plain black and white error page
for you with a basic description, but nothing fancy.
Depending on the error code it is less or more likely for the user to
actually see such an error.
Consider the code below, we might have a user profile route, and if the user
fails to pass a username we can raise a «400 Bad Request». If the user passes a
username and we can’t find it, we raise a «404 Not Found».
from flask import abort, render_template, request

# a username needs to be supplied in the query args
# a successful request would be like /profile?username=jack
@app.route("/profile")
def user_profile():
    username = request.arg.get("username")
    # if a username isn't supplied in the request, return a 400 bad request
    if username is None:
        abort(400)

    user = get_user(username=username)
    # if a user can't be found by their username, return 404 not found
    if user is None:
        abort(404)

    return render_template("profile.html", user=user)
Here is another example implementation for a «404 Page Not Found» exception:
from flask import render_template

@app.errorhandler(404)
def page_not_found(e):
    # note that we set the 404 status explicitly
    return render_template('404.html'), 404
When using :doc:`/patterns/appfactories`:
from flask import Flask, render_template

def page_not_found(e):
  return render_template('404.html'), 404

def create_app(config_filename):
    app = Flask(__name__)
    app.register_error_handler(404, page_not_found)
    return app
An example template might be this:
{% extends "layout.html" %}
{% block title %}Page Not Found{% endblock %}
{% block body %}
  <h1>Page Not Found</h1>
  <p>What you were looking for is just not there.
  <p><a href="{{ url_for('index') }}">go somewhere nice</a>
{% endblock %}
Further Examples
The above examples wouldn’t actually be an improvement on the default
exception pages. We can create a custom 500.html template like this:
{% extends "layout.html" %}
{% block title %}Internal Server Error{% endblock %}
{% block body %}
  <h1>Internal Server Error</h1>
  <p>Oops... we seem to have made a mistake, sorry!</p>
  <p><a href="{{ url_for('index') }}">Go somewhere nice instead</a>
{% endblock %}
It can be implemented by rendering the template on «500 Internal Server Error»:
from flask import render_template

@app.errorhandler(500)
def internal_server_error(e):
    # note that we set the 500 status explicitly
    return render_template('500.html'), 500
When using :doc:`/patterns/appfactories`:
from flask import Flask, render_template

def internal_server_error(e):
  return render_template('500.html'), 500

def create_app():
    app = Flask(__name__)
    app.register_error_handler(500, internal_server_error)
    return app
When using :doc:`/blueprints`:
from flask import Blueprint

blog = Blueprint('blog', __name__)

# as a decorator
@blog.errorhandler(500)
def internal_server_error(e):
    return render_template('500.html'), 500

# or with register_error_handler
blog.register_error_handler(500, internal_server_error)
Blueprint Error Handlers
In :doc:`/blueprints`, most error handlers will work as expected.
However, there is a caveat concerning handlers for 404 and 405
exceptions. These error handlers are only invoked from an appropriate
raise statement or a call to abort in another of the blueprint’s
view functions; they are not invoked by, e.g., an invalid URL access.
This is because the blueprint does not «own» a certain URL space, so
the application instance has no way of knowing which blueprint error
handler it should run if given an invalid URL. If you would like to
execute different handling strategies for these errors based on URL
prefixes, they may be defined at the application level using the
request proxy object.
from flask import jsonify, render_template

# at the application level
# not the blueprint level
@app.errorhandler(404)
def page_not_found(e):
    # if a request is in our blog URL space
    if request.path.startswith('/blog/'):
        # we return a custom blog 404 page
        return render_template("blog/404.html"), 404
    else:
        # otherwise we return our generic site-wide 404 page
        return render_template("404.html"), 404

@app.errorhandler(405)
def method_not_allowed(e):
    # if a request has the wrong method to our API
    if request.path.startswith('/api/'):
        # we return a json saying so
        return jsonify(message="Method Not Allowed"), 405
    else:
        # otherwise we return a generic site-wide 405 page
        return render_template("405.html"), 405
Returning API Errors as JSON
When building APIs in Flask, some developers realise that the built-in
exceptions are not expressive enough for APIs and that the content type of
:mimetype:`text/html` they are emitting is not very useful for API consumers.
Using the same techniques as above and :func:`~flask.json.jsonify` we can return JSON
responses to API errors. :func:`~flask.abort` is called
with a description parameter. The error handler will
use that as the JSON error message, and set the status code to 404.
from flask import abort, jsonify

@app.errorhandler(404)
def resource_not_found(e):
    return jsonify(error=str(e)), 404

@app.route("/cheese")
def get_one_cheese():
    resource = get_resource()

    if resource is None:
        abort(404, description="Resource not found")

    return jsonify(resource)
We can also create custom exception classes. For instance, we can
introduce a new custom exception for an API that can take a proper human readable message,
a status code for the error and some optional payload to give more context
for the error.
This is a simple example:
from flask import jsonify, request

class InvalidAPIUsage(Exception):
    status_code = 400

    def __init__(self, message, status_code=None, payload=None):
        super().__init__()
        self.message = message
        if status_code is not None:
            self.status_code = status_code
        self.payload = payload

    def to_dict(self):
        rv = dict(self.payload or ())
        rv['message'] = self.message
        return rv

@app.errorhandler(InvalidAPIUsage)
def invalid_api_usage(e):
    return jsonify(e.to_dict()), e.status_code

# an API app route for getting user information
# a correct request might be /api/user?user_id=420
@app.route("/api/user")
def user_api(user_id):
    user_id = request.arg.get("user_id")
    if not user_id:
        raise InvalidAPIUsage("No user id provided!")

    user = get_user(user_id=user_id)
    if not user:
        raise InvalidAPIUsage("No such user!", status_code=404)

    return jsonify(user.to_dict())
A view can now raise that exception with an error message. Additionally
some extra payload can be provided as a dictionary through the payload
parameter.
Logging
See :doc:`/logging` for information about how to log exceptions, such as
by emailing them to admins.
Debugging
See :doc:`/debugging` for information about how to debug errors in
development and production.
New in version 0.3.
Applications fail, servers fail. Sooner or later you will see an exception
in production. Even if your code is 100% correct, you will still see
exceptions from time to time. Why? Because everything else involved will
fail. Here some situations where perfectly fine code can lead to server
errors:
- the client terminated the request early and the application was still
reading from the incoming data. - the database server was overloaded and could not handle the query.
- a filesystem is full
- a harddrive crashed
- a backend server overloaded
- a programming error in a library you are using
- network connection of the server to another system failed.
And that’s just a small sample of issues you could be facing. So how do we
deal with that sort of problem? By default if your application runs in
production mode, Flask will display a very simple page for you and log the
exception to the logger.
But there is more you can do, and we will cover some better setups to deal
with errors.
Error Mails
If the application runs in production mode (which it will do on your
server) you won’t see any log messages by default. Why is that? Flask
tries to be a zero-configuration framework. Where should it drop the logs
for you if there is no configuration? Guessing is not a good idea because
chances are, the place it guessed is not the place where the user has
permission to create a logfile. Also, for most small applications nobody
will look at the logs anyways.
In fact, I promise you right now that if you configure a logfile for the
application errors you will never look at it except for debugging an issue
when a user reported it for you. What you want instead is a mail the
second the exception happened. Then you get an alert and you can do
something about it.
Flask uses the Python builtin logging system, and it can actually send
you mails for errors which is probably what you want. Here is how you can
configure the Flask logger to send you mails for exceptions:
ADMINS = ['yourname@example.com']
if not app.debug:
    import logging
    from logging.handlers import SMTPHandler
    mail_handler = SMTPHandler('127.0.0.1',
                               'server-error@example.com',
                               ADMINS, 'YourApplication Failed')
    mail_handler.setLevel(logging.ERROR)
    app.logger.addHandler(mail_handler)
So what just happened? We created a new
SMTPHandler that will send mails with the mail
server listening on 127.0.0.1 to all the ADMINS from the address
server-error@example.com with the subject “YourApplication Failed”. If
your mail server requires credentials, these can also be provided. For
that check out the documentation for the
SMTPHandler.
We also tell the handler to only send errors and more critical messages.
Because we certainly don’t want to get a mail for warnings or other
useless logs that might happen during request handling.
Before you run that in production, please also look at Controlling the Log Format to
put more information into that error mail. That will save you from a lot
of frustration.
Logging to a File
Even if you get mails, you probably also want to log warnings. It’s a
good idea to keep as much information around that might be required to
debug a problem. Please note that Flask itself will not issue any
warnings in the core system, so it’s your responsibility to warn in the
code if something seems odd.
There are a couple of handlers provided by the logging system out of the
box but not all of them are useful for basic error logging. The most
interesting are probably the following:
FileHandler— logs messages to a file on the
filesystem.RotatingFileHandler— logs messages to a file
on the filesystem and will rotate after a certain number of messages.NTEventLogHandler— will log to the system
event log of a Windows system. If you are deploying on a Windows box,
this is what you want to use.SysLogHandler— sends logs to a UNIX
syslog.
Once you picked your log handler, do like you did with the SMTP handler
above, just make sure to use a lower setting (I would recommend
WARNING):
if not app.debug:
    import logging
    from themodule import TheHandlerYouWant
    file_handler = TheHandlerYouWant(...)
    file_handler.setLevel(logging.WARNING)
    app.logger.addHandler(file_handler)
Controlling the Log Format
By default a handler will only write the message string into a file or
send you that message as mail. A log record stores more information,
and it makes a lot of sense to configure your logger to also contain that
information so that you have a better idea of why that error happened, and
more importantly, where it did.
A formatter can be instantiated with a format string. Note that
tracebacks are appended to the log entry automatically. You don’t have to
do that in the log formatter format string.
Here some example setups:
Email
from logging import Formatter
mail_handler.setFormatter(Formatter('''
Message type:       %(levelname)s
Location:           %(pathname)s:%(lineno)d
Module:             %(module)s
Function:           %(funcName)s
Time:               %(asctime)s

Message:

%(message)s
'''))
File logging
from logging import Formatter
file_handler.setFormatter(Formatter(
    '%(asctime)s %(levelname)s: %(message)s '
    '[in %(pathname)s:%(lineno)d]'
))
Complex Log Formatting
Here is a list of useful formatting variables for the format string. Note
that this list is not complete, consult the official documentation of the
logging package for a full list.
| Format | Description |
|---|---|
%(levelname)s |
Text logging level for the message ( 'DEBUG', 'INFO', 'WARNING','ERROR', 'CRITICAL'). |
%(pathname)s |
Full pathname of the source file where the logging call was issued (if available). |
%(filename)s |
Filename portion of pathname. |
%(module)s |
Module (name portion of filename). |
%(funcName)s |
Name of function containing the logging call. |
%(lineno)d |
Source line number where the logging call was issued (if available). |
%(asctime)s |
Human-readable time when the LogRecord` was created. By default this is of the form "2003-07-08 16:49:45,896" (the numbers afterthe comma are millisecond portion of the time). This can be changed by subclassing the formatter and overriding the formatTime() method. |
%(message)s |
The logged message, computed as msg % args |
If you want to further customize the formatting, you can subclass the
formatter. The formatter has three interesting methods:
format():- handles the actual formatting. It is passed a
LogRecordobject and has to return the formatted
string. formatTime():- called for asctime formatting. If you want a different time format
you can override this method. formatException()- called for exception formatting. It is passed an
exc_info
tuple and has to return a string. The default is usually fine, you
don’t have to override it.
For more information, head over to the official documentation.
Other Libraries
So far we only configured the logger your application created itself.
Other libraries might log themselves as well. For example, SQLAlchemy uses
logging heavily in its core. While there is a method to configure all
loggers at once in the logging package, I would not recommend using
it. There might be a situation in which you want to have multiple
separate applications running side by side in the same Python interpreter
and then it becomes impossible to have different logging setups for those.
Instead, I would recommend figuring out which loggers you are interested
in, getting the loggers with the getLogger() function and
iterating over them to attach handlers:
from logging import getLogger
loggers = [app.logger, getLogger('sqlalchemy'),
           getLogger('otherlibrary')]
for logger in loggers:
    logger.addHandler(mail_handler)
    logger.addHandler(file_handler)
Debugging Application Errors
For production applications, configure your application with logging and
notifications as described in Logging Application Errors. This section provides
pointers when debugging deployment configuration and digging deeper with a
full-featured Python debugger.
When in Doubt, Run Manually
Having problems getting your application configured for production? If you
have shell access to your host, verify that you can run your application
manually from the shell in the deployment environment. Be sure to run under
the same user account as the configured deployment to troubleshoot permission
issues. You can use Flask’s builtin development server with debug=True on
your production host, which is helpful in catching configuration issues, but
be sure to do this temporarily in a controlled environment. Do not run in
production with debug=True.
Working with Debuggers
To dig deeper, possibly to trace code execution, Flask provides a debugger out
of the box (see Debug Mode). If you would like to use another Python
debugger, note that debuggers interfere with each other. You have to set some
options in order to use your favorite debugger:
debug— whether to enable debug mode and catch exceptionsuse_debugger— whether to use the internal Flask debuggeruse_reloader— whether to reload and fork the process on exception
debug must be True (i.e., exceptions must be caught) in order for the other
two options to have any value.
If you’re using Aptana/Eclipse for debugging you’ll need to set both
use_debugger and use_reloader to False.
A possible useful pattern for configuration is to set the following in your
config.yaml (change the block as appropriate for your application, of course):
FLASK:
    DEBUG: True
    DEBUG_WITH_APTANA: True
Then in your application’s entry-point (main.py), you could have something like:
if __name__ == "__main__":
    # To allow aptana to receive errors, set use_debugger=False
    app = create_app(config="config.yaml")

    if app.debug: use_debugger = True
    try:
        # Disable Flask's debugger if external debugger is requested
        use_debugger = not(app.config.get('DEBUG_WITH_APTANA'))
    except:
        pass
    app.run(use_debugger=use_debugger, debug=app.debug,
            use_reloader=use_debugger, host='0.0.0.0')
Время прочтения
14 мин
Просмотры 50K
blog.miguelgrinberg.com
Miguel Grinberg
<<< предыдущая следующая >>>
Эта статья является переводом седьмой части нового издания учебника Мигеля Гринберга, выпуск которого автор планирует завершить в мае 2018.Прежний перевод давно утратил свою актуальность.
Я, со своей стороны, постараюсь не отставать с переводом.
Это седьмая глава серии Flask Mega-Tutorial, в которой я расскажу вам, как выполнять обработку ошибок в приложении Flask.
Для справки ниже приведен список статей этой серии.
Примечание 1: Если вы ищете старые версии данного курса, это здесь.
Примечание 2: Если вдруг Вы хотели бы выступить в поддержку моей(Мигеля) работы в этом блоге, или просто не имеете терпения дожидаться неделю статьи, я (Мигель Гринберг)предлагаю полную версию данного руководства упакованную электронную книгу или видео. Для получения более подробной информации посетите learn.miguelgrinberg.com.
В этой главе я перехожу от кодирования новых функций для моего микроблогического приложения и вместо этого обсужу несколько стратегий борьбы с ошибками, которые неизменно появляются в любом программном проекте. Чтобы проиллюстрировать эту тему, я намеренно допустил ошибку в коде, который я добавил в главе 6. Прежде чем продолжить чтение, посмотрите, сможете ли вы его найти!
Ссылки GitHub для этой главы: Browse, Zip, Diff.
Обработка ошибок в Flask
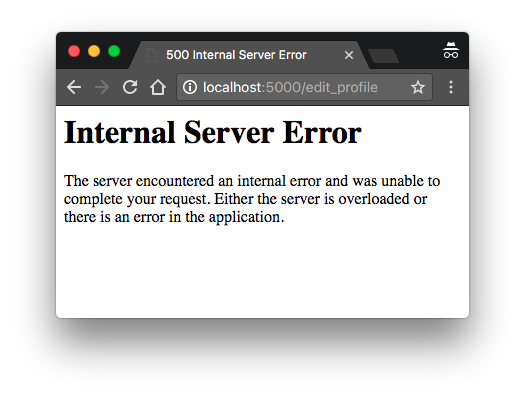
Что происходит, когда возникает ошибка в приложении Flask? Лучший способ узнать это — испытать это самому. Запустите приложение и убедитесь, что у вас зарегистрировано не менее двух пользователей. Войдите в систему как один из пользователей, откройте страницу профиля и нажмите ссылку «Изменить». В редакторе профиля попробуйте изменить имя пользователя на существующее имя другого пользователя, который уже зарегистрирован, и попытайтесь применить исправления! Это приведет к появлению страшной страницы «Internal Server Error» ( «Внутренняя ошибка сервера» ):
В сеансе терминала, на котором запущено приложение, вы видите трассировку стека ошибки. Трассировки стека чрезвычайно полезны при отладке ошибок, поскольку они показывают последовательность вызовов в этом стеке, вплоть до строки, вызвавшей ошибку:
(venv) $ flask run
 * Serving Flask app "microblog"
 * Running on http://127.0.0.1:5000/ (Press CTRL+C to quit)
[2017-09-14 22:40:02,027] ERROR in app: Exception on /edit_profile [POST]
Traceback (most recent call last):
  File "/home/miguel/microblog/venv/lib/python3.6/site-packages/sqlalchemy/engine/base.py", line 1182, in _execute_context
    context)
  File "/home/miguel/microblog/venv/lib/python3.6/site-packages/sqlalchemy/engine/default.py", line 470, in do_execute
    cursor.execute(statement, parameters)
sqlite3.IntegrityError: UNIQUE constraint failed: user.username
Трассировка стека указывает, чем вызвана ошибка. Приложение позволяет пользователю изменять имя пользователя без проверки, что новое имя пользователя не совпадает с другим пользователем, уже находящимся в системе. Ошибка возникает из SQLAlchemy, которая пытается записать новое имя пользователя в базу данных, но база данных отвергает его, потому что столбец имени пользователя определен с unique = True.
Важно, что страница с ошибкой, представленная пользователю, не содержит много информации об ошибке, и это правильно. Я определенно не хочу, чтобы пользователи узнали, что авария была вызвана ошибкой базы данных или какой базой данных я пользуюсь, а также именами таблиц и полей в моей базе данных. Вся эта информация должна быть внутренней.
Есть несколько вещей, которые далеки от идеала. У меня есть страница с ошибкой, которая безобразна и не соответствует макету приложения. У меня также есть важные трассировки стека приложений, которые сбрасываются на терминале, и мне нужно постоянно следить за тем, чтобы я не пропустил никаких ошибок. И, конечно, у меня есть ошибка. Я собираюсь решить все эти проблемы, но сначала поговорим о режиме отладки Flask.
Режим отладки
То, как ошибки обрабатываются выше, отлично подходит для системы, которая работает на production сервере. Если есть ошибка, пользователь получает страницу с неопределенной ошибкой (хотя я собираюсь сделать эту страницу с ошибкой более приятной), а важные данные об ошибке — в выводе сервера или в файле журнала.
Но когда вы разрабатываете приложение, вы можете включить режим отладки, режим, в котором Flask выводит действительно хороший отладчик непосредственно в ваш браузер. Чтобы активировать режим отладки, остановите приложение, а затем установите следующую переменную среды:
(venv) $ export FLASK_DEBUG=1Если вы работаете в ОС Microsoft Windows, не забудьте использовать set вместо экспорта.
После того, как вы установили FLASK_DEBUG, перезапустите сервер. Строки на вашем терминале будут немного отличаться от того, что вы привыкли видеть:
(venv) microblog2 $ flask run
 * Serving Flask app "microblog"
 * Forcing debug mode on
 * Running on http://127.0.0.1:5000/ (Press CTRL+C to quit)
 * Restarting with stat
 * Debugger is active!
 * Debugger PIN: 177-562-960
Теперь устроим приложению аварийный сбой еще раз, чтобы увидеть интерактивный отладчик в вашем браузере:
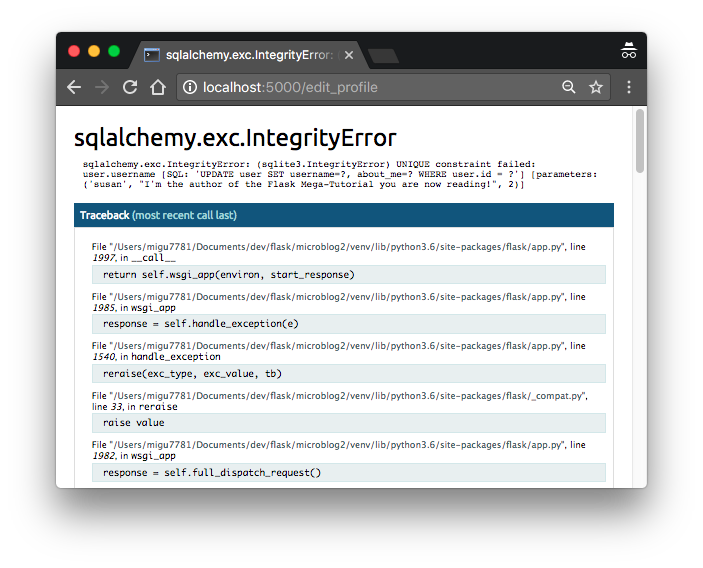
Отладчик позволяет развернуть каждый уровень стека и увидеть соответствующий исходный код. Вы также можете открыть Python для любого из фреймов и выполнить любые допустимые выражения Python, например, чтобы проверить значения переменных.
Крайне важно, чтобы вы никогда не запускали приложение Flask в режиме отладки на рабочем сервере. Отладчик позволяет удаленно выполнять код на сервере, поэтому он может стать неожиданным подарком злоумышленнику, который хочет проникнуть в ваше приложение или на ваш сервер. В качестве дополнительной меры безопасности отладчик, запущенный в браузере, закроется, и при первом использовании запросит PIN-код, который вы можете увидеть на выходе команды flask run.
Поскольку я говорю о режиме отладки, следует упомянуть про вторую важную функцию, которая включена в режиме отладки — перезагрузка. Это очень полезная функция разработки, которая автоматически перезапускает приложение при изменении исходного файла. Если вы выполните flask run в режиме отладки, можно продолжать работать в своем приложении и при каждом сохранении файла, приложение перезапустится, чтобы забрать новый код.
Пользовательские страницы ошибок
Flask предоставляет механизм приложения для создания собственных страниц ошибок, так что вашим пользователям не нужно видеть простые и скучные значения по умолчанию. В качестве примера давайте определим пользовательские страницы ошибок для ошибок HTTP 404 и 500, двух наиболее распространенных. Определение страниц для других ошибок работает одинаково.
Чтобы объявить пользовательский обработчик ошибок, используется декоратор @errorhandler. Я собираюсь поместить обработчики ошибок в новый модуль app/errors.py.
from flask import render_template
from app import app, db

@app.errorhandler(404)
def not_found_error(error):
    return render_template('404.html'), 404

@app.errorhandler(500)
def internal_error(error):
    db.session.rollback()
    return render_template('500.html'), 500
Функции ошибок работают аналогично функциям просмотра. Для этих двух ошибок я возвращаю содержимое их соответствующих шаблонов. Обратите внимание, что обе функции возвращают второе значение после шаблона, который является номером кода ошибки. Для всех функций представления, которые я создал до сих пор, мне не нужно было добавлять второе возвращаемое значение, потому что по умолчанию 200 (код состояния для успешного завершения) — это то, что я хотел. Сейчас это страницы с ошибками, поэтому я хочу, чтобы код состояния ответа это отражал.
Обработчик ошибок для 500-й ошибки может быть вызван после возникновения сбоя базы данных, которая на самом деле была вызвана умышленным случаем дубликата имени пользователя. Чтобы убедиться, что неудачные сеансы базы данных не мешают доступу к базе данных, вызванным шаблоном, я выдаю откат сеанса. Это сбрасывает сеанс в чистое состояние.
Вот шаблон для ошибки 404:
{% extends "base.html" %}

{% block content %}
    <h1>File Not Found</h1>
    <p><a href="{{ url_for('index') }}">Back</a></p>
{% endblock %}
И вот одна из ошибок 500:
{% extends "base.html" %}

{% block content %}
    <h1>An unexpected error has occurred</h1>
    <p>The administrator has been notified. Sorry for the inconvenience!</p>
    <p><a href="{{ url_for('index') }}">Back</a></p>
{% endblock %}
Оба шаблона наследуют шаблон base.html, так что страница с ошибками имеет тот же внешний вид, что и обычные страницы приложения.
Чтобы получить эти обработчики ошибок, зарегистрированные в Flask, мне нужно импортировать новый модуль app/errors.py после создания экземпляра приложения:
# ...

from app import routes, models, errors
Если вы установили FLASK_DEBUG = 0 в сеансе терминала и затем снова вызвали ошибку повторного имени пользователя, вы увидите более приятную страницу с ошибкой.
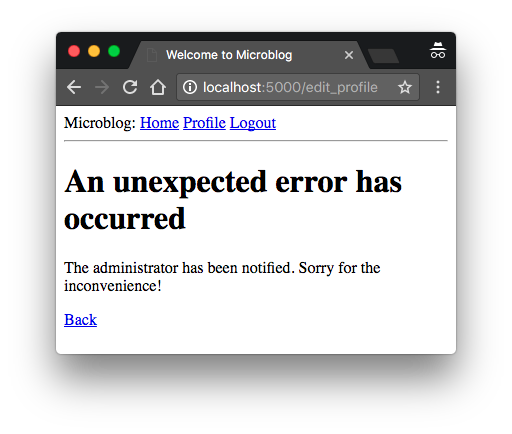
Или так! Рекомендую придумать что то свое в качестве упражнения.

Отправка ошибок по электронной почте
Другая проблема с обработкой ошибок по умолчанию, предоставляемой Flask, заключается в том, что нет уведомлений! Трассировка стека ошибки печатается на терминале, а это означает, что вывод процесса сервера должен контролироваться на обнаружение ошибок. Когда вы запускаете приложение во время разработки, это нормально, но как только приложение будет развернуто на production сервере, никто не будет смотреть на результат, поэтому необходимо создать более надежное решение.
Я думаю, что очень важно, чтобы я активно реагировал на ошибки. Если в production версии приложения возникает ошибка, я хочу знать сразу. Таким образом, моим первым решением будет сконфигурировать Flask для отправки мне сообщения по email сразу после возникновения ошибки с трассировкой стека ошибки в сообщении электронной почты.
Первым шагом является добавление данных сервера электронной почты в файл конфигурации:
class Config(object):
    # ...
    MAIL_SERVER = os.environ.get('MAIL_SERVER')
    MAIL_PORT = int(os.environ.get('MAIL_PORT') or 25)
    MAIL_USE_TLS = os.environ.get('MAIL_USE_TLS') is not None
    MAIL_USERNAME = os.environ.get('MAIL_USERNAME')
    MAIL_PASSWORD = os.environ.get('MAIL_PASSWORD')
    ADMINS = ['your-email@example.com']
Переменные конфигурации для электронной почты содержат сервер и порт, флаг для включения зашифрованных соединений и необязательное имя пользователя и пароль. Пять переменных конфигурации получены из их сопоставлений переменным среды. Если сервер электронной почты не установлен в среде, то я буду использовать это как знак того, что ошибки электронной почты должны быть отключены. Порт сервера электронной почты также можно указать в переменной среды, но если он не установлен, используется стандартный порт 25. Учетные данные почтового сервера по умолчанию не используются, но могут быть предоставлены при необходимости. Переменная конфигурации ADMINS представляет собой список адресов электронной почты, которые будут получать отчеты об ошибках, поэтому ваш собственный адрес электронной почты должен быть в этом списке.
Flask использует пакет logging Python для ведения своих журналов, а этот пакет уже имеет возможность отправлять журналы по электронной почте. Все, что мне нужно сделать, чтобы отправлять электронные сообщения, содержащие ошибки, — это добавить экземпляр SMTPHandler в объект журнала Flask, которым является app.logger:
import logging
from logging.handlers import SMTPHandler

# ...

if not app.debug:
    if app.config['MAIL_SERVER']:
        auth = None
        if app.config['MAIL_USERNAME'] or app.config['MAIL_PASSWORD']:
            auth = (app.config['MAIL_USERNAME'], app.config['MAIL_PASSWORD'])
        secure = None
        if app.config['MAIL_USE_TLS']:
            secure = ()
        mail_handler = SMTPHandler(
            mailhost=(app.config['MAIL_SERVER'], app.config['MAIL_PORT']),
            fromaddr='no-reply@' + app.config['MAIL_SERVER'],
            toaddrs=app.config['ADMINS'], subject='Microblog Failure',
            credentials=auth, secure=secure)
        mail_handler.setLevel(logging.ERROR)
        app.logger.addHandler(mail_handler)
Как видно, я включил регистратор электронной почты только, когда приложение работает без режима отладки, что определено приложением в app.debug как True, а также когда сервер электронной почты существует в конфигурации.
Настройка почтового регистратора несколько утомительна из-за необходимости обрабатывать дополнительные параметры безопасности, которые присутствуют на многих серверах электронной почты. Но в сущности, вышеприведенный код создает экземпляр SMTPHandler, устанавливает его уровень, чтобы он отправлял только сообщения об ошибках, а не предупреждения, информационные или отладочные сообщения и, наконец, прикреплял их к app.logger из Flask.
Существует два подхода к проверке работоспособности этой функции. Самый простой способ — использовать SMTP-сервер отладки от Python. Это ложный почтовый сервер, который принимает сообщения электронной почты, но вместо их отправки выводит их на консоль. Чтобы запустить этот сервер, откройте второй сеанс терминала и запустите на нем следующую команду:
(venv) $ python -m smtpd -n -c DebuggingServer localhost:8025Оставьте запущенный SMTP-сервер отладки и вернитесь к своему первому терминалу и установите export MAIL_SERVER = localhost и MAIL_PORT = 8025 (используйте set вместо export, если вы используете Microsoft Windows). Убедитесь, что для переменной FLASK_DEBUG установлено значение 0 или не установлено вообще, так как приложение не будет отправлять электронные письма в режиме отладки.
Запустите приложение и вызовите ошибку SQLAlchemy еще раз, чтобы узнать, как сеанс терминала, на котором работает поддельный почтовый сервер, показывает электронное письмо с полным содержимым стека ошибки.
Второй метод тестирования для этой функции — настроить настоящий почтовый сервер. Ниже приведена конфигурация для использования почтового сервера для учетной записи Gmail:
export MAIL_SERVER=smtp.googlemail.com
export MAIL_PORT=587
export MAIL_USE_TLS=1
export MAIL_USERNAME=<your-gmail-username>
export MAIL_PASSWORD=<your-gmail-password>
Если вы используете Microsoft Windows, не забудьте использовать set вместо export в каждой из приведенной выше инструкции.
Функции безопасности вашей учетной записи Gmail могут препятствовать приложению отправлять электронную почту через нее, если вы явно не разрешаете «less secure apps» («менее безопасным приложениям») доступ к вашей учетной записи Gmail. Прочитать об этом можно здесь, и если вас беспокоит безопасность вашей учетной записи, можно создать вторичную учетную запись, которую настройте только для проверки электронной почты, или временно включите разрешение для менее безопасных приложений на время запуска этого теста, а затем вернитесь к умолчанию.
Запись лога в файл
Получение ошибок по электронной почте полезно, но иногда недостаточно. Есть некоторые случаи сбоя, которые не описываются исключением Python и не являются серьезной проблемой, но они все равно могут быть достаточно интересными для сохранения в целях отладки. По этой причине я также буду поддерживать логфайл для приложения.
Чтобы включить ведение журнала другого обработчика, на этот раз типа RotatingFileHandler необходимо включить logger приложения аналогично обработчику электронной почты.
# ...
from logging.handlers import RotatingFileHandler
import os

# ...

if not app.debug:
    # ...

    if not os.path.exists('logs'):
        os.mkdir('logs')
    file_handler = RotatingFileHandler('logs/microblog.log', maxBytes=10240,
                                       backupCount=10)
    file_handler.setFormatter(logging.Formatter(
        '%(asctime)s %(levelname)s: %(message)s [in %(pathname)s:%(lineno)d]'))
    file_handler.setLevel(logging.INFO)
    app.logger.addHandler(file_handler)

    app.logger.setLevel(logging.INFO)
    app.logger.info('Microblog startup')
Я пишу логфайл с именем microblog.log в каталоге logs, который я создаю, если он еще не существует.
Класс RotatingFileHandler удобен, потому что он переписывает журналы, гарантируя, что файлы журнала не будут слишком большими, если приложение работает в течение длительного времени. В этом случае я ограничиваю размер логфайла 10 КБ, и храню последние десять файлов журнала в качестве резервных копий.
Класс logging.Formatter предоставляет настройку формата сообщений журнала. Поскольку эти сообщения отправляются в файл, я хочу, чтобы они содержали как можно больше информации. Поэтому я использую формат, который включает отметку времени, уровень ведения журнала,
сообщение, исходный файл и номер строки, откуда возникла запись в журнале.
Чтобы сделать регистрацию более полезной, я также понижаю уровень ведения журнала до категории INFO, как в регистраторе приложений, так и в обработчике файлов. Если вы не знакомы с категориями ведения журнала, это DEBUG, INFO, WARNING,ERROR и CRITICAL в порядке возрастания степени тяжести.
В качестве первого полезного использования логфайла сервер записывает строку в журнал каждый раз, когда он запускается. Когда приложение запускается на production сервере, эти записи журнала сообщают вам, когда сервер был перезапущен.
Исправление дубля имени пользователя
Я слишком долго использовал ошибку дублирования имени пользователя. Теперь, когда я показал вам, как подготовить приложение для обработки подобных ошибок, я могу наконец-то это исправить.
Если вы помните, RegistrationForm уже выполняет проверку для имен пользователей, но требования формы редактирования немного отличаются. Во время регистрации мне нужно убедиться, что имя пользователя, введенное в форму, не существует в базе данных. В форме профиля редактирования я должен выполнить ту же проверку, но с одним исключением. Если пользователь оставляет исходное имя пользователя нетронутым, то проверка должна его разрешить, поскольку это имя пользователя уже назначено этому пользователю. Ниже вы можете увидеть, как я выполнил проверку имени пользователя для этой формы:
class EditProfileForm(FlaskForm):
    username = StringField('Username', validators=[DataRequired()])
    about_me = TextAreaField('About me', validators=[Length(min=0, max=140)])
    submit = SubmitField('Submit')

    def __init__(self, original_username, *args, **kwargs):
        super(EditProfileForm, self).__init__(*args, **kwargs)
        self.original_username = original_username

    def validate_username(self, username):
        if username.data != self.original_username:
            user = User.query.filter_by(username=self.username.data).first()
            if user is not None:
                raise ValidationError('Please use a different username.')
Реализация выполняется в специальном методе проверки, функция super в конструкторе класса, который принимает исходное имя пользователя в качестве аргумента. Это имя пользователя сохраняется как переменная экземпляра и проверяется в методе validate_username(). Если имя пользователя, введенное в форму, совпадает с исходным именем пользователя, то нет причин проверять базу данных на наличие дубликатов.
Чтобы использовать этот новый метод проверки, мне нужно добавить исходный аргумент имени пользователя в функцию вида, где создается объект формы:
@app.route('/edit_profile', methods=['GET', 'POST'])
@login_required
def edit_profile():
    form = EditProfileForm(current_user.username)
    # ...
Теперь ошибка исправлена, и дубликаты в форме профиля редактирования будут предотвращены в большинстве случаев. Это не идеальное решение, поскольку оно может не работать, когда два или несколько процессов одновременно обращаются к базе данных. В этой ситуации состояние гонки может привести к валидации, но спустя мгновение при попытке переименования база данных уже была изменена другим процессом и не может переименовать пользователя. Это несколько маловероятно, за исключением очень занятых приложений, у которых много серверных процессов, поэтому я пока не буду беспокоиться об этом.
На этом этапе вы можете попытаться воспроизвести ошибку еще раз, чтобы увидеть, как ее предотвращает метод проверки формы.
<<< предыдущая следующая >>>
P.S.
Работа над ошибками
От переводчика
Решил я проверить получение сообщений ошибки админу на почту. Для этого я испортил модуль routes.py. Для этой самой «порчи», я закомментировал декоратор @app.route('/edit_profile', methods=['GET', 'POST']) перед def edit_profile(). В итоге получил ошибку и в файл лога все это вывалилось, а вот письмо не прилетело. Я использую Python 3.3. Возможно в более новых версиях этого и не случится. Но в Windows 7 с русской раскладкой это случилось.
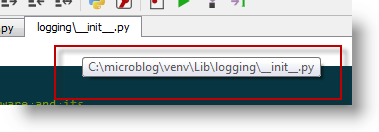
При попытке отправить сообщение админу приложение получило ошибку кодировки при формировании сообщения. В окне консоли содержались такие строки:

Как видим ссылка указывает на директорию в стандартном питоне, а не в виртуальном окружении.
logging в 3-й версии является стандартной библиотекой Python, поэтому вам не нужно устанавливать ее используя pip.
Про стандартные модули
И модуль протоколирования, который вы можете найти в PyPI, устаревший, а не Python3-совместимый.
(Согласно файлу README его последняя версия была выпущена 02 марта 2005 года.)
Поэтому просто не пытайтесь установить logging.
Возьмите новый модуль в стандартной библиотеке как должное. Если вам принципиально использовать его в виртальной библиотеке.
После копии в venvLib logging импортируется из виртуальной среды
Еще раз получаю ошибку

logging теперь виртуальный. А вот smtplib стандартный.
Не думаю, что надо тащить все библиотеки из стандартной среды в виртуальную.
Ошибка от этого не исчезнет.
Про стандартный модуль email
Проблема с кодировкой в сообщении решается использованием стандартного пакета email для создания сообщения с указанием предпочитаемой кодировки.
Вот пример с просторов интернета для этого пакета :
# -*- coding: utf-8 -*-
from email.mime.multipart import MIMEMultipart
from email.mime.text import MIMEText
import quopri
def QuoHead(String):
    s = quopri.encodestring(String.encode('UTF-8'), 1, 0)
    return "=?utf-8?Q?" + s.decode('UTF-8') + "?="
FIOin = "Хрюша Степашкин"
emailout = "some@test.ru"
emailin = "some2@test.ru"
msg = MIMEMultipart()
msg["Subject"] = QuoHead("Добрый день " + FIOin).replace('=n', '')
msg["From"] = (QuoHead("Каркуша Федоровна") + "  <" + emailout + ">").replace('=n', '')
msg["To"] = (QuoHead(FIOin) + "  <" + emailin + ">").replace('=n', '')
m = """Добрый день.
  Это тестовое письмо.
Пожалуйста, не отвечайте на него."""
text = MIMEText(m.encode('utf-8'), 'plain', 'UTF-8')
msg.attach(text)
print(msg.as_string())
Но, как это применить для отправки сообщений об ошибке?!
Может кто-то предложит в комментариях к статье.
В модуле flask-mail эта ситуевина вроде как поправлена. Но тут используется logging и smtplib
В итоге пока так. Поправил я строку в модуле smtplib.py .
Добавил encode('utf-8')

И после перезапуска сервера при искусственной ошибке я, наконец-то, получил сообщение на почту.

<<< предыдущая следующая >>>
Logging is a crucial component in the software life cycle. It allows you to take
a peek inside your application and understand what is happening, which helps you
address the problems as they appear.
Flask is one of the most popular
web frameworks for Python and logging in Flask is based on the standard Python
logging module. In this article, you will
learn how to create a functional and effective logging system for your Flask
application.
🔭 Want to centralize and monitor your Flask application logs?
Head over to Logtail and start ingesting your logs in 5 minutes.
Prerequisites
Before proceeding with this article, ensure that you have a recent version of
Python 3 installed on your machine. To best
learn the concepts discussed here, you should also create a new Flask project so
that you may try out all the code snippets and examples.
Create a new working directory and change into it with the command below:
mkdir flask-logging && cd flask-logging
Install the latest version of Flask with the following command.
Getting started with logging in Flask
To get started, you need to create a new Flask application first. Go to the root
directory of your project and create an app.py file.
app.py
from flask import Flask

app = Flask(__name__)

@app.route("/")
def hello():
    return "Hello, World!"

@app.route("/info")
def info():
    return "Hello, World! (info)"

@app.route("/warning")
def warning():
    return "A warning message. (warning)"
In this example, a new instance of the Flask application (app) is created and
three new routes are defined. When these routes are accessed, different
functions will be invoked, and different strings will be returned.
Next, you can add logging calls to the info() and warning() functions so
that when they are invoked, a message will be logged to the console.
app.py
. . .
@app.route("/info")
def info():
    app.logger.info("Hello, World!")
    return "Hello, World! (info)"


@app.route("/warning")
def warning():
    app.logger.warning("A warning message.")
    return "A warning message. (warning)"
The highlighted lines above show how to access the standard Python logging
module via app.logger. In this example, the
info() method logs Hello, World! at the INFO level, and the warning()
method logs "A warning message" at the WARNING level. By default, both
messages are logged to the console.
To test this logger, start the dev server using the following command:
Output
 * Debug mode: off
WARNING: This is a development server. Do not use it in a production deployment. Use a production WSGI server instead.
 * Running on http://127.0.0.1:5000
Press CTRL+C to quit
Keep the Flask dev server running and open up a new terminal window. Run the
following command to test the /warning route:
curl http://127.0.0.1:5000/warning
The following text should be returned:
Output
A warning message. (warning)
And then, go back to the dev server window, and a log message should appear:
Output
[2022-10-17 12:43:33,907] WARNING in app: A warning message.
As you can see, the output contains a lot more information than just the log
message itself. The warning() method will automatically include the timestamp
([2022-09-24 17:18:06,304]), the log level (WARNING), and the program that
logged this message (app).
However, if you visit the /info route, you will observe that the «Hello
World!» message isn’t logged as expected. That’s because Flask ignores messages
with log level lower than WARNING by default, but we’ll show how you can
customize this behavior shortly.
One more thing to note is that every time you make changes to your Flask
application, such as adding more loggers or modifying related configurations,
you need to stop the dev server (by pressing CTRL+C), and then restart it for
the changes to take effect.
Understanding log levels
Log levels are used to indicate how urgent a log record is, and the logging
module used under the hood by Flask offers six different log
levels, each associated with an integer
value: CRITICAL (50), ERROR (40), WARNING (30), INFO (20) and DEBUG
(10). You can learn more about log levels and how they are typically used by
reading this article.
Each of these log level has a corresponding method, which allows you to send log
entry with that log level. For instance:
app.py
. . .
@app.route("/")
def hello():

    app.logger.debug("A debug message")
    app.logger.info("An info message")
    app.logger.warning("A warning message")
    app.logger.error("An error message")
    app.logger.critical("A critical message")

    return "Hello, World!"
However, when you run this code, only messages with log level higher than INFO
will be logged. That is because you haven’t configured this logger yet, which
means Flask will use the default configurations leading to the dropping of the
DEBUG and INFO messages.
Remember to restart the server before making a request to the / route:
curl http://127.0.0.1:5000/
Output
[2022-07-18 11:47:39,589] WARNING in app: A warning message
[2022-07-18 11:47:39,590] ERROR in app: An error message
[2022-07-18 11:47:39,590] CRITICAL in app: A critical message
In the next section, we will discuss how to override the default Flask logging
configurations so that you can customize its behavior according to your needs.
Configuring your logging system
Flask recommends that you use the logging.config.dictConfig() method to
overwrite the default configurations. Here is an example:
app.py
from flask import Flask
from logging.config import dictConfig
dictConfig(
{
"version": 1,
"formatters": {
"default": {
"format": "[%(asctime)s] %(levelname)s in %(module)s: %(message)s",
}
},
"handlers": {
"console": {
"class": "logging.StreamHandler",
"stream": "ext://sys.stdout",
"formatter": "default",
}
},
"root": {"level": "DEBUG", "handlers": ["console"]},
}
)
app = Flask(__name__)
. . .
Let’s take a closer look at this configuration. First of all, the version key
represents the schema version and, at the time this article is written, the only
valid option is 1. Having this key allows the schema format to evolve in the
future while maintaining backward compatibility.
Next, the formatters key is where you specify formatting patterns for your log
records. In this example, only a default formatter is defined. To define a
format, you need to use
LogRecord attributes,
which always start with a % symbol.
For example, %(asctime)s indicates the timestamp in ASCII encoding, s
indicates this attribute corresponds to a string. %(levelname)s is the log
level, %(module)s is the name of the module that pushed the message, and
finally, %(message)s is the message itself.
Inside the handlers key, you can create different handlers for your loggers.
Handlers are used to push log records to various destinations. In this case, a
console handler is defined, which uses the logging.StreamHandler library to
push messages to the standard output. Also, notice that this handler is using
the default formatter you just defined.
Finally, the root key is where you specify configurations for the root
logger, which is the default logger unless otherwise specified.
"level": "DEBUG" means this root logger will log any messages higher than or
equal to DEBUG, and "handlers": ["console"] indicates this logger is using
the console handler you just saw.
One last thing you should notice in this example is that the configurations are
defined before the application (app) is initialized. It is recommended to
configure logging behavior as soon as possible. If the app.logger is accessed
before logging is configured, it will create a default handler instead, which
could be in conflict with your configuration.
Formatting your log records
Let’s take a closer look at how to format log records in Flask. In the previous
section, we introduced some LogRecord attributes and discussed how you can use
them to create custom log messages:
app.py
. . .
dictConfig(
{
"version": 1,
"formatters": {
"default": {
"format": "[%(asctime)s] %(levelname)s | %(module)s >>> %(message)s",
}
},
. . .
}
)
. . .
@app.route("/")
def hello():
app.logger.info("An info message")
return "Hello, World!"
This configuration produces a log record that is formatted like this:
Output
[2022-10-17 13:13:25,484] INFO | app >>> An info message
Some of the attributes support further customization. For example, you can
customize how the timestamp is displayed by adding a datefmt key in the
configurations:
app.py
. . .

dictConfig(
    {
        "version": 1,
        "formatters": {
            "default": {
                "format": "[%(asctime)s] %(levelname)s | %(module)s >>> %(message)s",
                "datefmt": "%B %d, %Y %H:%M:%S %Z",
            }
        },
        . . .
    }
)

. . .
This yields a timestamp in the following format:
Output
[October 17, 2022 13:22:40 Eastern Daylight Time] INFO | app >>> An info message
You can read
this article to learn
more about customizing timestamps in Python. Besides %(asctime)s
%(levelname)s , %(module)s, and %(message)s, there are several other
LogRecord attributes
available. You can find all of them in the linked documentation.
Logging to files
Logging to the console is great for development, but you will need a more
persistent medium to store log records in production so that you may reference
them in the future. A great way to start persisting your logs is to send them to
local files on the server. Here’s how to set it up:
app.py
. . .
dictConfig(
    {
        "version": 1,
        . . .
        "handlers": {
            "console": {
                "class": "logging.StreamHandler",
                "stream": "ext://sys.stdout",
                "formatter": "default",
            },
            "file": {
                "class": "logging.FileHandler",
                "filename": "flask.log",
                "formatter": "default",
            },
        },
        "root": {"level": "DEBUG", "handlers": ["console", "file"]},
    }
)
. . .
@app.route("/")
def hello():

    app.logger.debug("A debug message")

    return "Hello, World!"
A new file handler is added to the handlers object and it uses the
logging.FileHandler class. It also defines a filename which specifies the
path to the file where the logs are stored. In the root object, the file
handler is also registered so that logs are sent to the console and the
configured file.
Once you restart your server, make a request to the /hello and observe that a
flask.log file is generated at the root directory of your project. You can
view its contents the following command:
Output
. . .
[October 17, 2022 13:29:12 Eastern Daylight Time] DEBUG | app >>> A debug message
Rotating your log files
The FileHandler discussed above does not support log rotation so if you desire
to rotate your log files, you can use either RotatingFileHandler or
TimedRotatingFileHandler. They take the same parameters as FileHandler with
some extra options.
For example, RotatingFileHandler takes two more parameters:
maxBytesdetermines the maximum size of each log file. When the size limit
is about to be exceeded, the file will be closed, and another file will be
automatically created.backupCountspecifies the number of files that will be retained on the disk,
and the older files will be deleted. The retained files will be appended with
a number extension.1,.2, and so on.
app.py
. . .

dictConfig(
    {
        "version": 1,
        . . .
        "handlers": {
            "size-rotate": {
                "class": "logging.handlers.RotatingFileHandler",
                "filename": "flask.log",
                "maxBytes": 1000000,
                "backupCount": 5,
                "formatter": "default",
            },
        },
        "root": {"level": "DEBUG", "handlers": ["size-rotate"]},
    }
)
. . .
Notice that we are using logging.handlers.RotatingFileHandler and not
logging.RotatingFileHandler. In this example, this logging system will retain
six files, from flask.log, flask.log.1 up to flask.log.5, and each one has
a maximum size of 1MB.
On the other hand, TimedRotatingFileHandler splits the log files based on
time. Here’s how to use it:
app.py
. . .

dictConfig(
    {
        "version": 1,
        . . .
        "handlers": {
            "time-rotate": {
                "class": "logging.handlers.TimedRotatingFileHandler",
                "filename": "flask.log",
                "when": "D",
                "interval": 10,
                "backupCount": 5,
                "formatter": "default",
            },
        },
        "root": {
            "level": "DEBUG",
            "handlers": ["time-rotate"],
        },
    }
)
. . .
Theinterval specifies the time interval, and when specifies the unit, which
could be any of the following:
"S": seconds"M": minutes"H": hours"D": days"W0"—"W6": weekdays,"W0"indicates Sunday. You can also specify an
atTimeoption, which determines at what time the rollover happens. The
intervaloption is not used in this case."midnight": creates a new file at midnight. You can also specify anatTime
option, which determines at what time the rollover happens.
When we are using the TimedRotatingFileHandler, the old file will be appended
a timestamp extension in the format %Y-%m-%d_%H-%M-%S
(time-rotate.log.2022-07-19_13-02-13).
If you need more flexibility when it comes to log rotation, you’re better off
using a utility like
logrotate instead as
Python’s file rotation handlers are not designed for heavy production workloads.
🔭 Want to centralize and monitor your Flask logs?
Head over to Logtail and start ingesting your logs in 5 minutes.
Logging HTTP requests
Since Flask is a web framework, your application will likely be handling many
HTTP requests, and logging information about them will help you understand what
is happening inside your application. To demonstrate relevant concepts, we’ll
setup a
demo application
where users can search for a location and get its current time, and then we will
create a logging system for it (see the
logging branch
for the final implementation).
Start by cloning the repository to your machine using the following command:
git clone https://github.com/betterstack-community/flask-world-clock.git
Change into the project directory:
You can check the structure of this project using the tree command:
Output
flask-world-clock
├── LICENSE
├── README.md
├── app.py
├── requirements.txt
├── screenshot.png
├── templates
│   ├── fail.html
│   ├── home.html
│   ├── layout.html
│   └── success.html
└── worldClock.log
Install the required dependencies by running the command below:
pip install -r requirements.txt
Start the development server:
Output
 * Debug mode: off
WARNING: This is a development server. Do not use it in a production deployment. Use a production WSGI server instead.
 * Running on http://127.0.0.1:5000
Press CTRL+C to quit
If you see this output, that means the world clock app is up and running. You
can access it by visiting http://127.0.0.1:5000 in your
browser. You should first land on the home page:
If you type in a query, and a location is successfully found. You should see the
result page:
If a location is not found, then you should see the fail page:
This project also uses two API services,
Nominatim which is a geolocation
tool that returns a coordinate given a search query, and the
Time API which gives you the current
time based on coordinates. Please read the linked documentations if you don’t
know how to use them. This project will also use the
requests module to make API
requests, so make sure you have it installed.
app.py
from flask import Flask, request, render_template
import requests

app = Flask(__name__)


@app.route("/")
def home():

    return render_template("home.html")


@app.route("/search", methods=["POST"])
def search():

    # Get the search query
    query = request.form["q"]

    # Pass the search query to the Nominatim API to get a location
    location = requests.get(
        "https://nominatim.openstreetmap.org/search",
        {"q": query, "format": "json", "limit": "1"},
    ).json()

    # If a location is found, pass the coordinate to the Time API to get the current time
    if location:
        coordinate = [location[0]["lat"], location[0]["lon"]]

        time = requests.get(
            "https://timeapi.io/api/Time/current/coordinate",
            {"latitude": coordinate[0], "longitude": coordinate[1]},
        )

        return render_template("success.html", location=location[0], time=time.json())

    # If a location is NOT found, return the error page
    else:

        return render_template("fail.html")
Creating a logging system for your Flask project
Next, it is time for you to add logging to this application. The
logging branch
of the repository includes the complete setup.
You can start by setting up the configurations:
app.py
. . .
from logging.config import dictConfig


dictConfig(
    {
        "version": 1,
        "formatters": {
            "default": {
                "format": "[%(asctime)s] [%(levelname)s | %(module)s] %(message)s",
                "datefmt": "%B %d, %Y %H:%M:%S %Z",
            },
        },
        "handlers": {
            "console": {
                "class": "logging.StreamHandler",
                "formatter": "default",
            },
            "file": {
                "class": "logging.FileHandler",
                "filename": "worldClock.log",
                "formatter": "default",
            },
        },
        "root": {"level": "DEBUG", "handlers": ["console", "file"]},
    }
)

app = Flask(__name__)
. . .
Make sure you put the configurations before you declare the Flask application
(app = Flask(__name__)). This configuration specifies a default formatter,
which is tied to both console and file handler. And these handlers are then
assigned to the root logger. The console handler will push the log records to
the console, and the file handler will push the records to a file named
worldClock.log.
Next, you can start creating logging calls for each route. For example, when
users visit your application, they would first make a request to the home
route. Therefore, you can assign that request a unique ID, and then you can log
that ID like this:
app.py
from flask import session
import uuid

. . .

app = Flask(__name__)

app.secret_key = "<secret_key>"


@app.route("/")
def home():

    session["ctx"] = {"request_id": str(uuid.uuid4())}
    app.logger.info("A user visited the home page >>> %s", session["ctx"])

    return render_template("home.html")
This example uses
sessions
to store the request_id, and for the sessions to be secure, you need to create
a secret key for your application.
Go ahead and do the same for the search route as well:
app.py
. . .
@app.route("/search", methods=["POST"])
def search():

    # Get the search query
    query = request.form["q"]
    app.logger.info(
        "A user performed a search. | query: %s >>> %s", query, session["ctx"]
    )

    # Pass the search query to the Nominatim API to get a location
    location = requests.get(
        "https://nominatim.openstreetmap.org/search",
        {"q": query, "format": "json", "limit": "1"},
    ).json()

    # If a location is found, pass the coordinate to the Time API to get the current time
    if location:

        app.logger.info(
            "A location is found. | location: %s >>> %s", location, session["ctx"]
        )

        coordinate = [location[0]["lat"], location[0]["lon"]]

        time = requests.get(
            "https://timeapi.io/api/Time/current/coordinate",
            {"latitude": coordinate[0], "longitude": coordinate[1]},
        )

        return render_template("success.html", location=location[0], time=time.json())

    # If a location is NOT found, return the error page
    else:

        app.logger.info("A location is NOT found. >>> %s", session["ctx"])

        return render_template("fail.html")
Besides logging information about the request, you can also log something about
the response as well. To do that, create a function with the
@app.after_request decorator.
app.py
. . .
@app.after_request
def logAfterRequest(response):

    app.logger.info(
        "path: %s | method: %s | status: %s | size: %s >>> %s",
        request.path,
        request.method,
        response.status,
        response.content_length,
        session["ctx"],
    )

    return response
Restart the dev server and go to http://127.0.0.1:5000,
and you will see the following log entries being displayed.
Output
[September 24, 2022 16:48:29 EDT] [INFO | app] A user visited the home page >>> {'request_id': 'd6b8c572-33b3-4510-b941-d177f49ca7de'}
[September 24, 2022 16:48:29 EDT] [INFO | app] path: / | method: GET | status: 200 OK | size: 946 >>> {'request_id': 'd6b8c572-33b3-4510-b941-d177f49ca7de'}
When a search action is successful:
Output
[September 24, 2022 16:49:39 EDT] [INFO | app] A user performed a search. | query: new york >>> {'request_id': 'd6b8c572-33b3-4510-b941-d177f49ca7de'}
If a location is found:
Output
[September 24, 2022 16:49:40 EDT] [INFO | app] A location is found. | location: [{. . .}] >>> {'request_id': 'd6b8c572-33b3-4510-b941-d177f49ca7de'}
[September 24, 2022 16:49:41 EDT] [INFO | app] path: /search | method: POST | status: 200 OK | size: 1176 >>> {'request_id': 'd6b8c572-33b3-4510-b941-d177f49ca7de'}
If a location is not found:
Output
[September 24, 2022 16:51:15 EDT] [INFO | app] A user performed a search. | query: idufvuiew >>> {'request_id': 'd6b8c572-33b3-4510-b941-d177f49ca7de'}
[September 24, 2022 16:51:16 EDT] [INFO | app] A location is NOT found. >>> {'request_id': 'd6b8c572-33b3-4510-b941-d177f49ca7de'}
[September 24, 2022 16:51:16 EDT] [INFO | app] path: /search | method: POST | status: 200 OK | size: 497 >>> {'request_id': 'd6b8c572-33b3-4510-b941-d177f49ca7de'}
Working with multiple loggers
In the previous examples, you are only using the root logger, but in fact, it
is possible for you to create multiple loggers and configure them separately.
app.py
from flask import Flask
from logging.config import dictConfig
import logging

dictConfig(
    {
        "version": 1,
        "formatters": {
            . . .
        },
        "handlers": {
            . . .
        },
        "root": {"level": "DEBUG", "handlers": ["console"]},

        "loggers": {
            "extra": {
                "level": "INFO",
                "handlers": ["time-rotate"],
                "propagate": False,
            }
        },
    }
)

root = logging.getLogger("root")
extra = logging.getLogger("extra")

app = Flask(__name__)


@app.route("/")
def hello():

    root.debug("A debug message")
    root.info("An info message")
    root.warning("A warning message")
    root.error("An error message")
    root.critical("A critical message")

    extra.debug("A debug message")
    extra.info("An info message")
    extra.warning("A warning message")
    extra.error("An error message")
    extra.critical("A critical message")

    return "Hello, World!"
In the first highlighted section, an extra logger is defined. This logger has
a minimum log level INFO, and it uses the handler time-rotate. However,
notice that it has an extra option called propagate. It determines whether or
not this logger should propagate to its parent, which is the root logger. The
default value is True, which means messages logged to the extra logger will
also be logged by the root logger, unless we set its value to False.
If you execute the above code, you will get the following output in the console:
Output
[July 25, 2022 16:24:47 Eastern Daylight Time] [DEBUG | app] A debug message
[July 25, 2022 16:24:47 Eastern Daylight Time] [INFO | app] An info message
[July 25, 2022 16:24:47 Eastern Daylight Time] [WARNING | app] A warning message
[July 25, 2022 16:24:47 Eastern Daylight Time] [ERROR | app] An error message
[July 25, 2022 16:24:47 Eastern Daylight Time] [CRITICAL | app] A critical message
And the following logs in the flask.log file:
Output
[July 25, 2022 16:25:32 Eastern Daylight Time] [INFO | app] An info message
[July 25, 2022 16:25:32 Eastern Daylight Time] [WARNING | app] A warning message
[July 25, 2022 16:25:32 Eastern Daylight Time] [ERROR | app] An error message
[July 25, 2022 16:25:32 Eastern Daylight Time] [CRITICAL | app] A critical message
Notice that the DEBUG message is ignored here. By creating multiple loggers
for your application, you can create a more complex logging system.
For example, previously, we mentioned that you can include contextual
information in your log record like this:
app.logger.debug("A debug message: %s", "test message")
However, this method can be very inefficient since you’ll have to micromanage
each logging call, and sometimes the same information should be included in many
different log records. To solve this problem, you can have the extra logger
use a different formatter, which include custom information:
app.py
. . .
dictConfig(
    {
        "version": 1,
        "formatters": {
            "default": {
                "format": "[%(asctime)s] %(levelname)s | %(module)s >>> %(message)s",
                "datefmt": "%B %d, %Y %H:%M:%S %Z",
            },
            "extra": {
                "format": "[%(asctime)s] %(levelname)s | %(module)s >>> %(message)s >>> User: %(user)s",
                "datefmt": "%B %d, %Y %H:%M:%S %Z",
            },
        },
        "handlers": {
            "console1": {
                "class": "logging.StreamHandler",
                "stream": "ext://sys.stdout",
                "formatter": "default",
            },
            "console2": {
                "class": "logging.StreamHandler",
                "stream": "ext://sys.stdout",
                "formatter": "extra",
            },
        },
        "root": {"level": "DEBUG", "handlers": ["console1"]},
        "loggers": {
            "extra": {
                "level": "DEBUG",
                "handlers": ["console2"],
                "propagate": False,
            }
        },
    }
)
. . .
In this new configuration, the root logger uses the console1 handler, which
applies the default formatter. The extra logger, on the other hand, uses the
console2 handler, which applies the extra formatter. The extra formatter
expects a custom field, %(user)s, and you can pass this user field using the
extra parameter like this:
app.py
. . .
extra = logging.getLogger("extra")


@app.route("/")
def hello():
    extra.info("A user has visited the home page", extra={"user": "Jack"})
    return "Hello, World!"
Restart the Flask dev server, and visit the / route again. You should get the
following log record:
Output
[October 18, 2022 13:31:32 EDT] INFO | app >>> A user has visited the home page >>> User: Jack
One more thing to note is that the extra formatter always expects a user
field, so if you have a log record without a user field, you should not use
the extra formatter. This is also why you can not use the root logger with
the extra formatter, because the root logger is also used by Flask to record
internal logs, and they don’t have a user field.
Centralizing your logs in the cloud
After your application has been deployed to production, it will start to
generate logs which may be stored in various servers. It is very inconvenient
having to log into each server just to check some log records. In such cases, it
is probably better to use a cloud-based log management system such as
Logtail, so that you can manage, monitor and
analyze all your log records together.
To use Logtail in your Flask application, first make sure you have registered an
account, and then go to the Sources page, click the Connect source
button.
Next, give your source a name, and remember to choose Python as your platform.
After you’ve successfully created a new source, scroll down to the
Installation instructions section. You can follow the instructions to
install the necessary packages and connect your existing loggers to Logtail.
However, if you prefer the standard Flask way, things are a little different.
Install the logtail-python package:
pip install logtail-python
Output
Collecting logtail-python
 Downloading logtail_python-0.1.3-py2.py3-none-any.whl (8.0 kB)
. . .
Installing collected packages: msgpack, urllib3, idna, charset-normalizer, certifi, requests, logtail-python
Successfully installed certifi-2022.6.15 charset-normalizer-2.1.0 idna-3.3 logtail-python-0.1.3 msgpack-1.0.4 requests-2.28.1 urllib3-1.26.11
Setup the LogtailHandler like this:
app.py
. . .
dictConfig(
    {
        "version": 1,
        "formatters": {
            . . .
        },
        "handlers": {
            . . .
            "logtail": {
                "class": "logtail.LogtailHandler",
                "source_token": "qU73jvQjZrNFHimZo4miLdxF",
                "formatter": "default",
            },
        },
        "root": {"level": "DEBUG", "handlers": ["console", "file", "logtail"]},
    }
)

. . .

app.logger.debug("A debug message")
This time when you run the above code, your log messages will be sent to
Logtail. Go to the Live tail page.
Conclusion
In this article, we briefly discussed how to start logging in Flask. Logging in
Flask is based on Python’s logging module, and in this tutorial, you learned
how to create a logging system using its handlers, log levels, and formatters.
However, we merely scratched the surface of the logging module, and it offers
us lots of other functionalities such as the Filter object, the
LoggerAdapter object and so on. You can read more about logging in Python in
this article.
Thanks for reading, and happy logging!
Centralize all your logs into one place.
Analyze, correlate and filter logs with SQL.
Create actionable
dashboards.
Share and comment with built-in collaboration.
Got an article suggestion?
Let us know
![]()
![]()
![]()
Next article
How to Get Started with Logging in Go
Go has built-in features for simple logging but third-party tools also exist for this purpose. How do you know which one to pick? This article will equip you to answer that question.
→
![]()
This work is licensed under a Creative Commons Attribution-NonCommercial-ShareAlike 4.0 International License.
This tutorial covers:
- The Flask logging module
- Logging Flask events by severity level
- Testing the logging module
Without logs, or a good understanding of them, debugging an application or looking through an error stack trace can be challenging. Luckily, Flask logging can change the way you understand debugging and how you interact with logs produced by the application. The Flask logging module gives you a way to record errors over different severity levels. A default logging module is included in the Python standard library, and it provides both simple and advanced logging functions.
In this tutorial, I will cover how to log Flask application events based on their severity levels and how to test the logging module.
Prerequisites
For this tutorial the following technologies are be required:
- Basic understanding of the Python programming language
- Understanding of the Flask framework
- Basic understanding of testing methods
You also need to have the following installed:
- Python Version >= 3.5 installed in your machine.
- A GitHub account. You can create one here.
- A CircleCI account. Create one here.
Our tutorials are platform-agnostic, but use CircleCI as an example.
If you don’t have a CircleCI account,sign up for a free one here.
Cloning the sample project repository
Get started by cloning the project repository from GitHub.
Once the project is cloned, you also need to install the dependencies. Use the command pip install -r requirements.txt from the root folder of the project.
Understanding Flask logging
Flask uses the standard Python logging module to log messages: [app.logger](https://docs.python.org/3/library/logging.html#module-logging). This logger can be extended and used to log custom messages. Implementing a flexible, event logging system for Flask applications gives you the ability to know when something goes wrong while your applications are executing or when they encounter errors. The diagram below shows the different parts of the Flask logging module and how they contribute to handling application logs.

The Python logger uses four sub-modules:
- Logger is the primary interface that logs events from your application. These events, when recorded, are referred to as log records.
- Handlers direct log events/records into respective destinations.
- Formatters specify the layout of your messages when they are written by the logger.
- Filters help developers manage the log record using parameters. These parameters can be in addition to the log levels.
Implementing a Flask logger
Logging allows developers to monitor the flow of a program with actions taken. You can use loggers to track application flows like tracking transactional data in ecommerce applications or recording events when an API call interacts with a service.
To start with logging in Flask, first import the logging module from Python. This logger module comes out of the box from the Python installation and does not need configuration. The Python logging module logs events based on pre-defined levels. The recorded log events are known as log records. Each record level has a different severity level:
- Debug : 10
- Info: 20
- Warning: 30
- Error: 40
- Critical: 50
The logger records logs only when the severity is bigger than their log levels. Then the logger passes them to the handlers.
This snippet shows the different types of loggers and their usage in a Flask route /.
@app.route('/')
def main():
  app.logger.debug("Debug log level")
  app.logger.info("Program running correctly")
  app.logger.warning("Warning; low disk space!")
  app.logger.error("Error!")
  app.logger.critical("Program halt!")
  return "logger levels!"
You can find this snippet in the app.py file. While the Flask application is running, navigate to the / home route in your browser to review the logs.
Here is how to use the loggers:
Debugprovides developers with detailed information for diagnosing program error.Infodisplays a confirmation message that a program’s flow behavior is executing as expected.Warningshows that something unexpected occurred, or that a problem might occur in the near future (low disk space, for example).Errorindicates a serious problem, like the program failed to execute some functionality.Criticalshows the occurrence of a serious error in the application, such as a program failure.
Configuring a basic logger
A logger that provides just the basics is enough for many applications. To configure this type of logging in your app.py file, add this:
from flask import Flask
import logging

logging.basicConfig(filename='record.log', level=logging.DEBUG)
app = Flask(__name__)

@app.route('/')
def main():
  # showing different logging levels
  app.logger.debug("debug log info")
  app.logger.info("Info log information")
  app.logger.warning("Warning log info")
  app.logger.error("Error log info")
  app.logger.critical("Critical log info")
  return "testing logging levels."


if __name__ == '__main__':
  app.run(debug=True)
This snippet specifies where Flask will log your application based on the levels from DEBUG. It also sets up the message that will be logged when you call your / home route using a client like Postman.
Note: Logging configuration should be completed before you create the Flask app object. If the app.logger is accessed before configuration, it uses the default Python handlers.
This basic configuration using logging.basicConfig logs messages and stores the log information in a .log file. For our sample project it is the record.log file.
Now, execute your Flask application using this command:
FLASK_APP=app.py flask run
Open your client application and make a GET request to your route for the running application. In this case it is http://127.0.0.1:5000/. When the main function in your program is called, it creates the record.log file, and then it sets the logging level to DEBUG. The logging activity should appear in the file record.log and output should be something like this:
## record.log file output

DEBUG:app:debug log info
INFO:app:Info log information
WARNING:app:Warning log info
ERROR:app:Error log info
CRITICAL:app:Critical log info
INFO:werkzeug:127.0.0.1 - - [01/Mar/2022 12:35:19] "GET / HTTP/1.1" 200 -
You were able to manipulate the logger object into logging all the configured loggers based on the different logger levels. When you have different loggers set for recording different levels of information, you can disable some logs from being displayed on the console and enable others. For this configuration to print out the logs on the terminal, you can remove the file configuration filename='record.log' in the logging.basicConfig() object where logs get recorded.
While these log outputs are readable, they may not be very useful, especially because you do not know when the events occurred. To fix this, you can add a format to your logs, as described in the next section.
Formatting log outputs
The Python formatter formats the structure of the record into specific structures that make it easy to read logs and tie them to specific events. It can be applied inside the basicConfig configuration.
The log formatter consists of the following configuration:
%(asctime)sconfigures the timestamp as a string%(levelname)sconfigures the logging level as a string.%(name)sconfigures the logger name as a string.%(threadName)sis the thread name.%(message)sconfigures log messages as a string.
You can apply these formatting options to your configuration for a more accurate object output:
.........
logging.basicConfig(filename='record.log',
                level=logging.DEBUG, format='%(asctime)s %(levelname)s %(name)s %(threadName)s : %(message)s')
app = Flask(__name__)
.........
Using the format configuration specified in the previous snippet, your log output can be tied to a specific timestamp, a specific thread, and even a particular threadname. The resulting output log makes more sense and looks cleaner when you run the application and observe your output.log file:
2022-03-01 13:09:11,787 DEBUG app Thread-3 : debug log info
2022-03-01 13:09:11,788 INFO app Thread-3 : Info log information
2022-03-01 13:09:11,788 WARNING app Thread-3 : Warning log info
2022-03-01 13:09:11,788 ERROR app Thread-3 : Error log info
2022-03-01 13:09:11,788 CRITICAL app Thread-3 : Critical log info
2022-03-01 13:09:11,788 INFO werkzeug Thread-3 : 127.0.0.1 - - [01/Mar/2022 13:09:11] "GET / HTTP/1.1" 200 -
The log levels have the messages but also a timestamp, level of the log, name of the application, the thread of the process, and finally the message of your defined logs. If you encountered an error, this makes it easy to step through the timestamp to identify the specific process, timestamp and even message. This process is much more useful while debugging than just reading plain error logs.
Now that you have created logs with the Python basicConfig, you can write tests for your logger module.
Testing loggers
Testing Python loggers is nearly the same as writing tests for normal Python functions. To write your first test, create a file named test_app.py. Open it and add your first test snippet:
from flask import Flask
from  app import app

import logging
import unittest

class TestLogConfiguration(unittest.TestCase):
    """[config set up]
    """
    def test_INFO__level_log(self):
        """
        Verify log for INFO level
        """
        self.app = app
        self.client = self.app.test_client

        with self.assertLogs() as log:
            user_logs = self.client().get('/')
            self.assertEqual(len(log.output), 4)
            self.assertEqual(len(log.records), 4)
            self.assertIn('Info log information', log.output[0])
In the test snippet above, we use the test_client to first make a request to the / route just as we are doing while running our application, and after we do this, we can verify that the log output logs the INFO level log information. As the wise men say, the only way to know whether our tests run is by executing them, we can do that with the command below on your terminal of choice:
pytest -s
Review the results of your run.

Congratulations! You have executed your first test successfully. Now you can extend your tests to other log levels that are defined in the application. Here’s an example:
def test_WARNING__level_log(self):
      """
      Verify log for WARNING level
      """
      self.app = app
      self.client = self.app.test_client

      with self.assertLogs() as log:
          user_logs = self.client().get('/')
          self.assertEqual(len(log.output), 4)
          self.assertIn('Warning log info', log.output[1])


def test_ERROR__level_log(self):
    """
    Verify log for ERROR level
    """
    self.app = app
    self.client = self.app.test_client

    with self.assertLogs() as log:
        user_logs = self.client().get('/')
        self.assertEqual(len(log.output), 4)
        self.assertIn('Error log info', log.output[2])
These test the log levels at each different stage in the snippets.
Note: The log object contains more information that can then be tested and asserted based on the needs of the application.
Your last task is to share your tests with the world. You can accomplish that using CircleCI as your continuous integration platform.
Setting up Git and pushing to CircleCI
To set up CircleCI, initialize a Git repository in the project by running:
git init
Create a .gitignore file in the root directory. Inside the file, add any modules you want to prevent from being added to your remote repository. Add a commit and then push your project to GitHub.
Now, log into the CircleCI dashboard and navigate to Projects. There will be a list of all the GitHub repositories associated with your GitHub username or organization. The specific repository for this tutorial is logging-with-flask.
From the Projects dashboard, select the option to set up the selected project and use the option for an existing configuration, which uses config.yml in the repository. Start the build.
Tip After initiating the build, expect your pipeline to fail. That is because you have not yet added your customized .circleci/config.yml configuration file to GitHub, which is needed for the project to build properly.
Setting up CircleCI
Create a .circleci directory in your root directory, then add a config.yml file to it. The config file contains the CircleCI configuration for every project. For this set up, you will use CircleCI Python orb. Use this configuration to execute your tests:
version: 2.1
orbs:
  python: circleci/python@1.4.0
workflows:
  build-app-with-test:
    jobs:
      - build-and-test
jobs:
  build-and-test:
    docker:
      - image: cimg/python:3.9
    steps:
      - checkout
      - python/install-packages:
          pkg-manager: pip
      - run:
          name: Run tests
          command: pytest
Note:
CircleCI orbs are reusable packages of YAML configurations that condense multiple lines of code into a single one: python: circleci/python@1.4.0. You may need to enable organization settings (if you are the administrator) or request permission from your organization’s CircleCI admin to allow the use of third party orbs in the CircleCI dashboard.
After setting up the configuration, push your configuration to GitHub. CircleCI will automatically start building your project.
Check the CircleCI dashboard and expand the build details to verify that you have run your first PyTest test successfully. It should be integrated into CircleCI.

Excellent! Not only have you written Flask loggers, but you have also tested them, and shared with the world – or at least with the rest of your team.
Conclusion
In this tutorial you have learned how to configure an API for different log output levels and how to format log output in a way that is not only straightforward but makes it easy to identify issues when they occur. Plus, you learned to write tests for logger methods and to assert different messages that have been defined to be logged. That brings us to the end of this tutorial! As always, I enjoyed creating it and I hope that you enjoyed following along.
Waweru Mwaura is a software engineer and a life-long learner who specializes in quality engineering. He is an author at Packt and enjoys reading about engineering, finance, and technology. You can read more about him on his web profile.
Read more posts by
Waweru Mwaura
We will learn, with this explanation, about error handling, specifically logging errors. By the end of this article, you should know how to log errors to a file and where to go to check out other ways to log errors in Flask.
Log Errors With the Help of the Logging Module in Flask
Typically a production app will not be in debug mode, so the only way we can use the logging module is to know there is an error. In this case, it will be sent to a file, so we can view it later, debug it, and fix the issue.
This is not enabled by default; we have to add a logging feature to our Flask app. That is why we will show you a really basic Flask app running, which is not in debug mode.
from flask import Flask

app = Flask(__name__)

@app.route('/')
def Error_Los():
    return 'The page without error'

if __name__=='__main__':
    app.run()
The first thing to use is the logging module; we will need to import this. It is a built-in Python module, so we do not need to install it if we use Python 3.
We will import two things from the logging module: FileHandler and WARNING.
FileHandler is a way to log errors to a file. The WARNING is the level at that we want to trigger the log; it could be something like an error where it is more serious.
But a warning is nice when we log into a file because we can log as much as we want.
from logging import FileHandler,WARNING
Now we will need to instantiate the FileHandler, and we need to pass the file name where the error will be saved.
F_H=FileHandler('errorlogs.txt')
Now we will need to set the level of the file handler using setLevel(); it is a method on the file FileHandler class, so we pass the WARNING level, which we imported from the logging module.
Now we will need to use logger to our Flask app, and then we use addHandler, and inside it is the file handler object we created above.
F_H.setLevel(WARNING)
app.logger.addHandler(F_H)
If we run this app, an errorlogs.txt file will be created. And one thing you should note is that it only logs applications but not HTTP errors because it is not the type of error you are looking for; it is not an application.
Now we will try to return 1/0, which will fail. We will run the server again and restart the page.
We will get an internal server error which means it is some error that HTTP cannot point to, but if we look in the log file, we see the error details.
def Error_Los():
    return 1/0
Output:
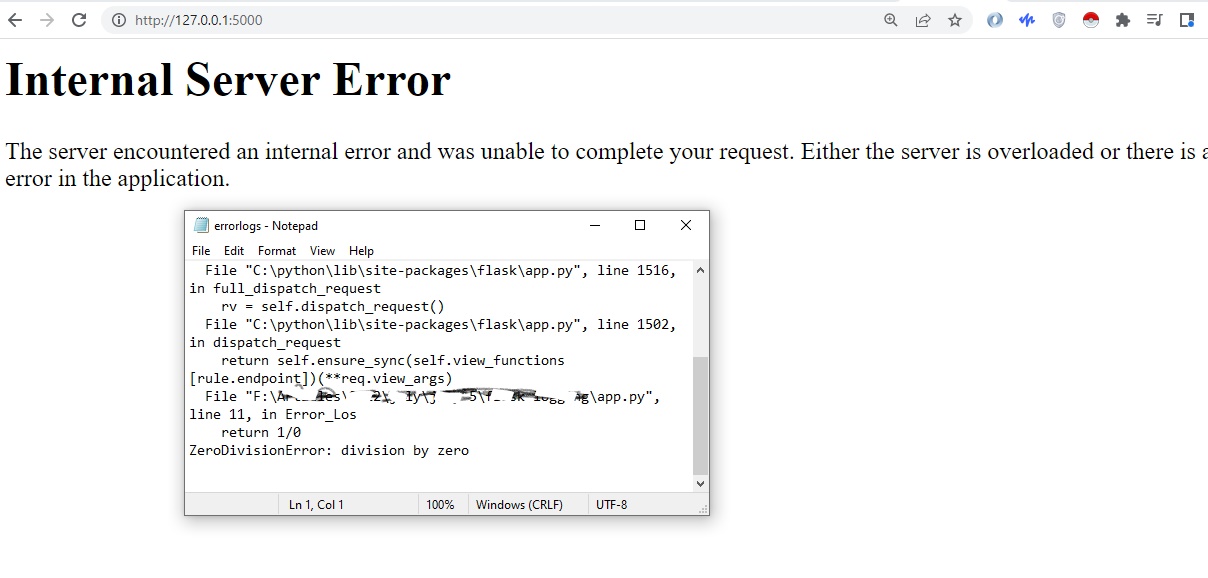
If you want to learn more about the other handlers for error logging, visit the official documents from here.
Complete Python Code:
from flask import Flask
from logging import FileHandler,WARNING

app = Flask(__name__)
F_H=FileHandler('errorlogs.txt')
F_H.setLevel(WARNING)
app.logger.addHandler(F_H)

@app.route('/')
def Error_Los():
    return 1/0

if __name__=='__main__':
    app.run()