Most people use spreadsheets software such as Microsoft Excel to process their data and carry out their analysis tasks.
When performing an analysis of data, a number of statistical metrics come into play. Some of these include the means, the medians, standard deviations, and standard errors. These metrics help in understanding the true nature of the data.
In this article, I will show you two ways to calculate the Standard Error in Excel.
One of the methods involves using a formula and the other involves using a Data Analytics Tool Pack that usually comes with every copy of Excel.
So let’s get started!
What is Standard Error?
When working with real-world data, it is often not possible to work with data of the entire population. So we usually take random samples from the population and work with them.
The standard error of a sample tells how accurate its mean is in terms of the true population mean.
In other words, the standard error of a sample is its standard deviation from the population mean.
This helps analyze how accurately your sample’s mean represents the true population. It also helps analyze the amount of dispersion or variation between your different data samples.
How is Standard Error Calculated?
The Standard Error for a sample is usually calculated using the formula:
In this above formula:
- SE is Standard Error
- σ represents the Standard deviation of the sample
- n represents the sample size.
How to Find the Standard Error in Excel Using a Formula
Unfortunately, unlike the Standard Deviation, Excel does not have a built-in formula to calculate the Standard Error, at least not at the time of writing this tutorial.
However, you could use the above formula to easily and quickly calculate the standard error. Here are the steps you need to follow:
- Click on the cell where you want the Standard Error to appear and click on the formula bar next to the fx symbol just below your toolbar.
- Type the symbol ‘=’ in the formula bar. And type: =STDEV(
- Drag and select the range of cells that are part of your sample data. This will add the location of the range in your formula. So, if your sample data is in cells B2 to B14, you will see: =STDEV(B2:B14 in the formula bar.
- Close the bracket for the STDEV formula. So far, you have used the STDEV function to find the Standard deviation of your sample data.
- Next, we want to divide this Standard deviation by the square root of the sample size. So let’s continue with our formula. Click on the formula bar after the closing brackets of the STDEV formula and add a ‘/’ symbol to indicate that you want to divide the result of the STDEV function. So your formula so far is: =STDEV(B2:B14)/
- To find the square root of a number, we use the SQRT formula. So next, type SQRT(. Your formula bar will now have the formula: =STDEV(B2:B14)/SQRT(
- Finally, you want the sample size. For this, you need to use the COUNT function. So, type COUNT( after what you already have in your formula bar. Again, drag and select the range of cells that are part of your sample data and close the bracket for the COUNT formula. This will give you the number of cells in your selected range.
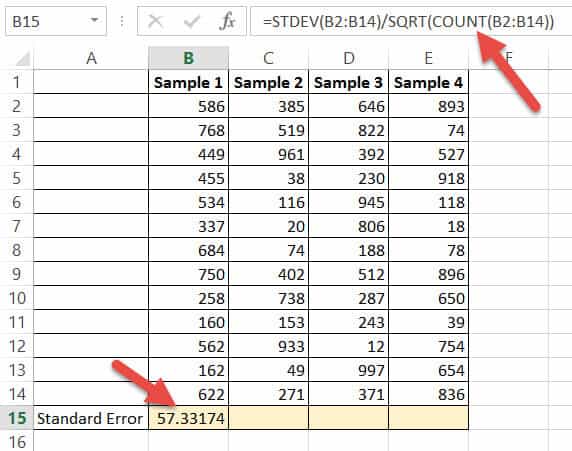
- Close the bracket for the SQRT function too. So your final formula should look like this: =STDEV(B2:B14)/SQRT(COUNT(B2:B14)) Notice there are two closing braces in the end. One is for the COUNT function, the other is for the SQRT function.
- That’s it! Press the return key on your keyboard and you got your sample’s Standard Error!
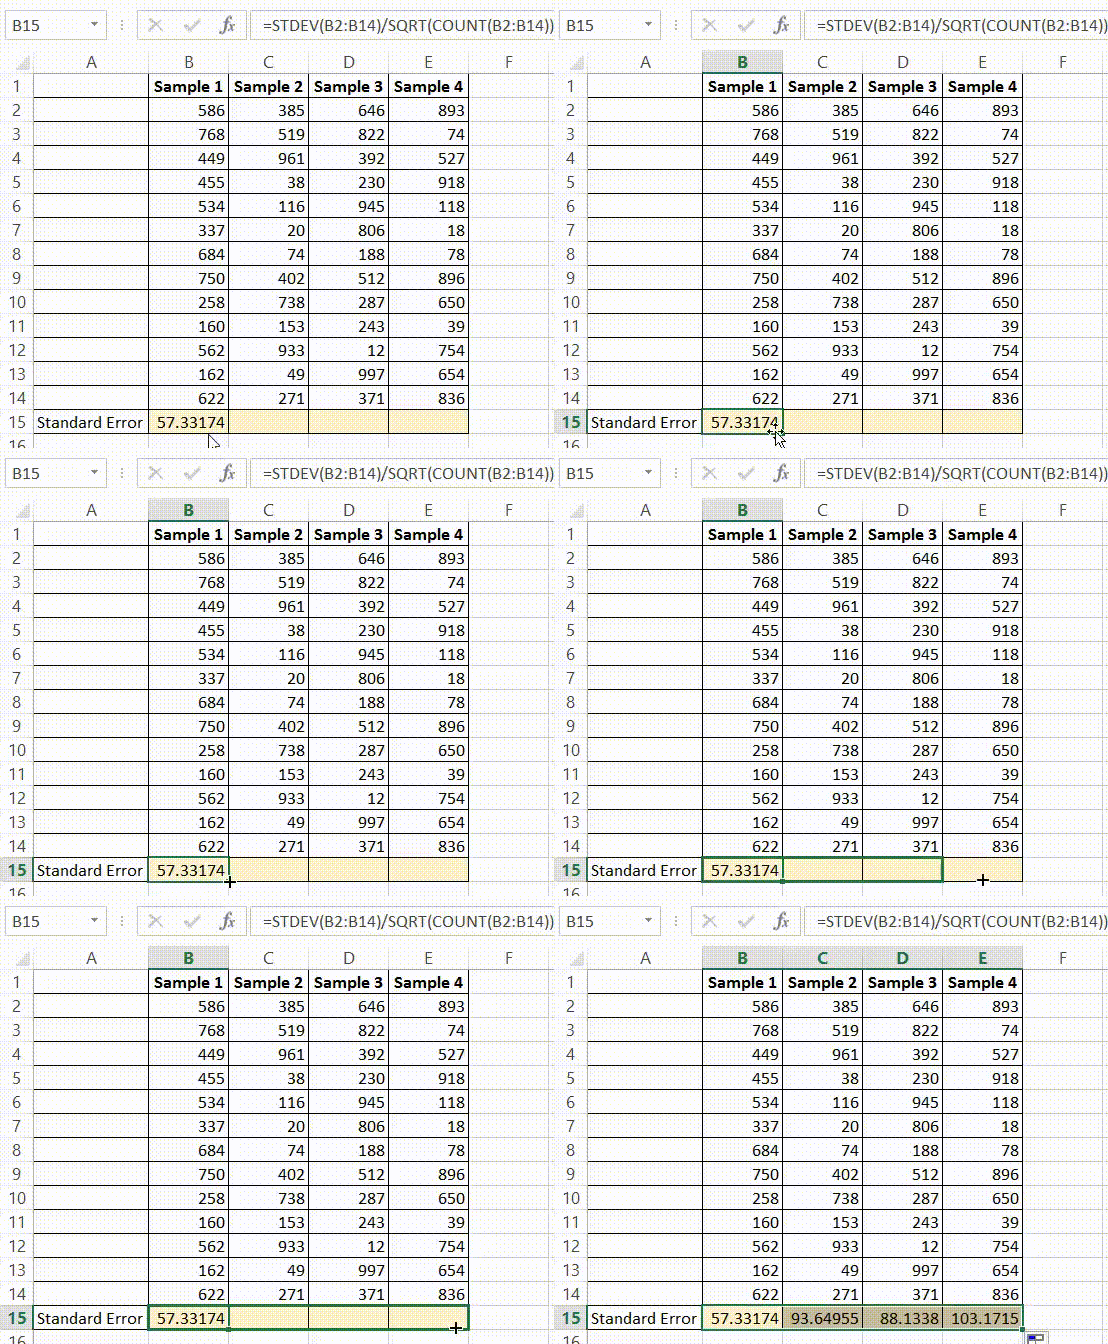
To find the Standard errors for the other samples, you can apply the same formula to these samples too.
If your samples are placed in columns adjacent to one another (as shown in the above image), you only need to drag the fill handle (located at the bottom left corner of your calculated cell) to the right.
This will copy the same formula to all the other cells on the right, and you will get standard errors for each of your samples!
How to Find the Standard Error in Excel Using the Data Analysis Toolpak
If you’re not in the mood to type complex formulae, there’s an easier way to find not just the Standard error, but practically all the statistical metrics you might need to analyze your sample data.
For this, you will need to install the Data Analysis Toolpak. This package gives you access to a variety of statistical functions, which include correlation functions, z-test, and t-test functions too.
Once you install the package, you can use the tool whenever you need to analyze data, without having to re-install it each time.
The Data Analysis Toolpak is free to use and comes along with your Excel package, but for simplicity, it does not appear in your standard toolbar. You need to activate it in order for it to be added to your toolbar.
The process of activating it is quite simple. Just follow these steps to install and activate your Data Analysis Toolpak:
- Click the File tab and click on Options. This will open the Options window for you.
- From here, click “Add-ins” from the left sidebar.
- From the list of Add-ins, select Analysis ToolPak.
- At the bottom of the window, click on the ‘Go’ button just next to Manage: Add-ins.
- Click the checkmark for Analysis ToolPak and click OK.
With this, your Data Analysis Toolpak will get added to your Excel Toolbar. When you click the Excel ‘Data’ tab, you should find a tool named “Data Analysis” at the far right of the Data toolbar (under the ‘Analysis’ group).
Now, to find out your Standard Error and other Statistical metrics, do the following:
- Click on the Data Analysis tool under the Data tab. This will open the Analysis Tools dialog box.
- Select “Descriptive Statistics” from the list on the left of the dialog box and click OK.
- Enter the location of the range of cells that contain your sample data into the “Input Range” box. You can also choose to drag and select the range of cells that you need too. If you have data for more than one sample arranged in adjacent columns, you can select the data in all the columns. You will get your results separately for each column.
- If your data has column headers, check the “Labels in first row” box.
- Select where you want your results to be displayed. It is safer to select “New Worksheet”. This will ensure that the details get displayed on a newly created worksheet, and will not disturb any data on your current worksheet.
- Select the checkbox next to “Summary Statistics” and click OK.
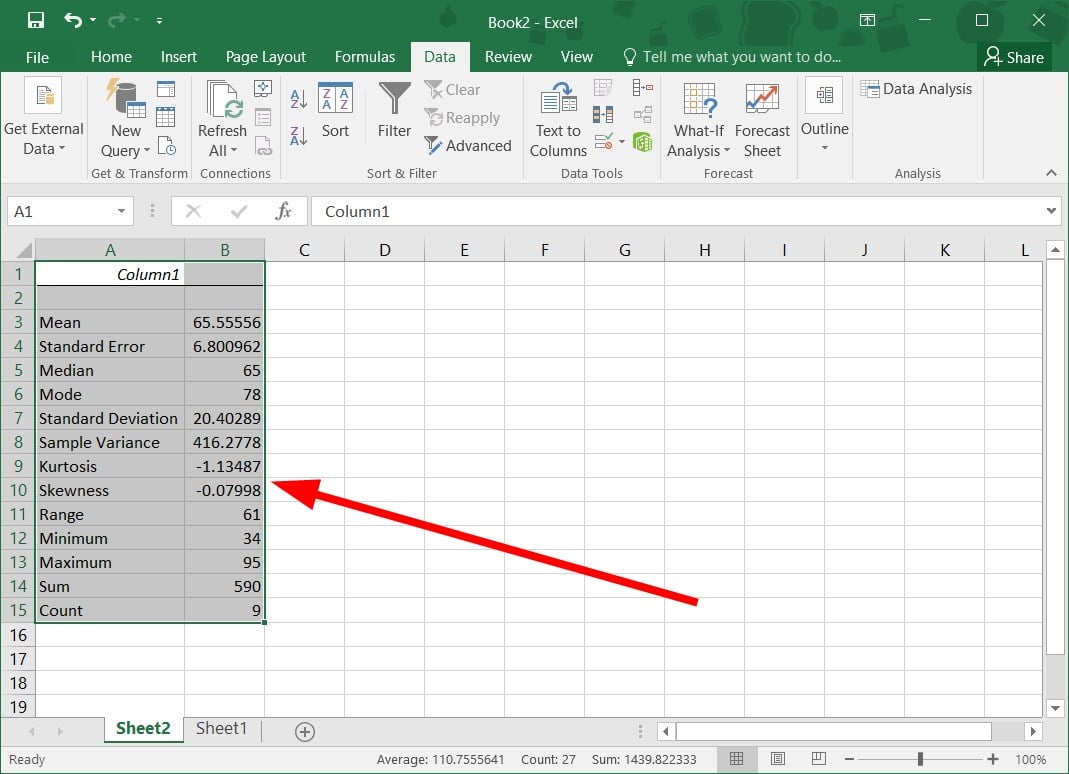
This will display all your analytical metrics in a new worksheet.
These metrics will also include the Standard Error for your selected sample data. If you had selected multiple data sets in multiple columns, you will get analytics for each column separately.
Conclusion
In this article, we discussed two ways in which you can find the Standard error for your sample data.
You can either create a formula to calculate it or use a data analytics tool, like the Data Analysis Toolpak that comes with Excel.
Either way, you will be able to use the Standard error information to analyze your sample data for further processing.
Hope you found this Excel tutorial useful!
Other Excel tutorials you may find useful:
- How to Convert Decimal to Fraction in Excel
- How to Square a Number in Excel
- How to Subtract Multiple Cells from One Cell in Excel
- How to Find Range in Excel
- How to Find Outliers in Excel
- How to Calculate IRR with Excel
- How to Calculate NPV in Excel (Net Present Value)
- How to Calculate Confidence Interval in Excel
- How to Get the p-Value in Excel?
- How to Find Z-score in Excel?
- How to Calculate Percentage Difference in Excel
- Calculate the Coefficient of Variation in Excel
- How to Calculate Mean Squared Error (MSE) in Excel?
If you are interested in statistics, mathematics, or economics, you should learn how to find the standard error in Excel. The standard error indicates the differences between the population mean and the true mean. It shows how much a sampling distribution represents the true population.
Like other mathematical measures of statistics, the standard error has a mathematical formula. However, you can find it quickly and easily by using the built-in function in Excel. In this article, we will provide a step-by-step analysis of how to find a standard error in Excel.

Find Your Bootcamp Match
- Career Karma matches you with top tech bootcamps
- Access exclusive scholarships and prep courses
Select your interest
First name
Last name
Phone number
By continuing you agree to our Terms of Service and Privacy Policy, and you consent to receive offers and opportunities from Career Karma by telephone, text message, and email.
What Is a Standard Error in Excel?
A standard error in Excel is a mathematical value that describes the variability of the distribution within a list of values. It is also known as the standard error of the mean or standard deviation of the mean. It shows how much the sampling distribution represents the distribution. It is a useful tool in econometrics for performing regression, hypothesis testing, and inferential statistics calculations. You need to use data from samples within the entire population to make an analysis. Standard errors help analyze how well the sample defines the whole population.
Examine this example. In a sample of 300 students, the mean math SAT score is 600. In this case, the sampling distribution is 300 students and the entire population is all the test-takers in the country. The standard error of the sample distribution will describe how much the mean score of 600 will vary from other mean exam scores of equal sample size. A large difference means that the sample does not match the true population.
Why Learning How to Find a Standard Error in Excel Is Useful
- It helps people understand larger populations. The standard error is incredibly useful to understand how well the small samples represent the entire population. A high standard error indicates that your sample does not effectively represent the population. A low standard error shows that the sample mean is close to the population mean and is representative of the population.
- It forms the basis of confidence intervals. A confidence interval is the likelihood that the population parameter will be close to a certain set of values around the mean. The standard error is employed in inferential statistics to construct the confidence interval.
- It helps to find the precision of a population parameter. The standard error of a normal distribution can be applied to the precision formula to calculate the precision of a population parameter.
How to Find a Standard Error in Excel: A Step-By-Step Guide
Step 1: Enter Your Data
The first step is to enter your data in Excel software. You should group the data into the same rows or columns. We recommend that you place your data together to make it easier to apply formulas to it. This way, you can easily highlight the range of cells instead of selecting each value individually.
Step 2: Calculate the Standard Deviation
The standard deviation is the deviation of the sample from the true mean within the same sample. Since the standard error formula is the sample standard deviation divided by the square root of the number of elements in the sample, you have to calculate the standard deviation first. You can do this with the standard deviation function, otherwise known as the STDEV function.
Click on a blank cell and input the function syntax “=STDEV(“. Then highlight the range of cells of your data set and close the bracket with a corresponding “)”. Press the ENTER button and you will have your standard deviation value in the blank cell.
Step 3: Count the Elements in the Data Set
The other important variable in the standard error formula is the number of elements in your data set. Microsoft Excel has a statistical function that automatically counts the number of values in rows or columns. It is called the COUNT function.
Click on the cell where you want your COUNT value to appear. Then press “=COUNT(’’ and highlight the cell range you want to count and close the bracket with a “)”. Press the ENTER value and the number of values will show in the individual cell you selected.
Step 4: Calculate the Square Root of the Count Result Cell
The next step is to calculate the square roots of the number of values. You can get the square root by using the square root function, shown in Excel as SQRT().
Choose a blank cell where you want the square root of the number of values to be displayed and input the “=SQRT(’’ function syntax. Then click the cell counting the number of values, followed by “)” to close the bracket. Press the ENTER button and the result of the square root of the number of values will show immediately.
Step 5: Calculate the Standard Error
Now we have all the important parts of the standard error formula. You can calculate the standard error by dividing the standard deviation by the square root of the number of values.
Select a blank cell where you want your standard error result to be displayed and input “=,” then click the cell containing the standard deviation value, followed by a “/” and click the cell containing the square root of the number of values. Press ENTER and your standard error result will appear immediately.
How to Find a Standard Error in Excel at Once
You can also use the data analysis tools to find the standard error at once. However, you will have to install the Excel Data Analysis ToolPak. Go to ‘’File’’ and click “ Options.” A new window will open, then click “Add-ins.” Select the Analysis ToolPak option and install it.
Go back to your data set and click on the data menu. You will find “Data analysis” on the right side of the screen. Click it and a new window will open. Pick “Descriptive statistics” and highlight the data set in the input range.
Select the cell range between columns or rows depending on where you arranged your data set. Then press ENTER. A table will appear containing the standard error, mean, median, mode, standard deviation, range, kurtosis, skewness, and sample variance.
Benefits of Finding a Standard Error in Excel
- It is easier to organize data. Excel presents and organizes data in an easy-to-read format, allowing you to sort and analyze raw information more effectively. This provides a better picture of the sample data sets.
- It increases productivity. Excel is a handy tool for speeding up statistical calculations. You can find your standard error results within seconds. With an advanced Excel data analysis function, you can seamlessly perform complex calculations.
- Excel eliminates the need for manual calculation. You don’t need to manually calculate each variable to complete the standard error calculation. The mathematical functions in Excel handle the entire calculations.
Importance of Learning How to Use Excel Sheets
Excel is one of the widely used spreadsheet software applications for data analysis and data visualization. It has become an industry standard to store and manage huge amounts of data. Working knowledge of Excel sheets can improve your employability as there are many jobs that use Excelacross many industries.
How to Find a Standard Error in Excel FAQ
How do you calculate standard error in Excel 2021?
You can calculate the standard error of a normal distribution in Excel 2021 by calculating the standard deviation, then calculating the square root of the number of elements in the data set, and finally dividing the standard deviation by the square root. You can also attend Excel coding bootcamps to learn how to calculate a standard error in Excel.
What is the standard error of mean in Excel?
The standard error of the mean is the measure of the sample variability from the total population. You can get it by dividing the standard deviation by the square root of the number of variables.
Is standard error the same as standard deviation?
Standard error values and standard deviation values are not the same. Both standard error and standard deviation are measures of variability. However, the standard error describes the variability from sample to sample in a population. While the standard deviation estimates the variability within a sample from the general population.
Why do we calculate standard error?
The standard error allows us to calculate a sample that is representative of the entire population. We can reduce the standard error statistic, and the overall margins of error, by using a larger sample size.
In this lesson, we are going to learn how to find standard error of the mean in Excel, SPSS, and R with step-by-step examples and clear explanations.
We are going to touch briefly on what standard error is, the equation for standard error, and its use in statistical research.
You will be able to download the sample files used in this lesson and follow along. Here are the main learning outcomes you expect to get once completing this lesson:
Learning Outcomes
- Know what the standard error of the mean is as well as the standard error equation.
- Learn how to calculate the standard error of the mean in Excel.
- Learn how to compute standard error in SPSS.
- Learn how to find standard error in R.
Please note that the terms standard error and estimated standard error of the mean are used interchangeably in statistics. However, they point exactly to the same thing.
Without further ado, let’s get started.
In an ideal world, researchers would have superpowers to survey an entire population without the need of dealing with samples. But we know that’s not the case.
In most cases, we collect data by sampling the population we investigate. If we take multiple samples of the same population we will observe that they are slightly different.
For instance, the mean of each sample will be different from another as each sample likely contains different members of the same population.
So how do we know if sample data represent a whole population?
Say hello to the standard error of the mean or simply, standard error. And here are the notations used by various authors in the literature:

The standard error is used to determine how close the mean of a sample taken from a population is compared to the average value of the true population.
A lower standard error value shows that the sample means have a close distribution around the population mean therefore more representative of the true population.
In contrast, a higher standard error value likely shows that the sample is an inaccurate representation of the true population.
The best way to lower a high standard error value is by increasing the sample size. We will do a comparison later in this lesson.
Is also important to use random sampling when collecting the data to avoid sampling bias.
Finally, you should really understand the difference between the standard error of the mean and standard deviation in statistics. The two are often a source of great confusion among students.
How To Find Standard Error of the Mean
The below formula is the equation for the standard error of the mean using the population standard deviation:

Where:
= actual population standard deviation
= mean of x scores
= square root of the sample size
The caveat here is that we need to know the actual population standard deviation to be able to calculate the standard error using the above formula.
Usually, populations are large, and is unlikely we have access to the entire population to calculate the population standard deviation value.
As with most cases in research, sampling a population is a much easy and less costly approach. And luckily enough, there is a way to estimate the standard error of mean using the sample standard deviation too. Hooray! Here is the formula:

Where:
S = sample estimate of the standard deviation
= mean of x scores
= square root of the sample size
You may have noticed that both formulas for the standard error above are quite similar. Indeed they are, the only difference being whether we know the value for population standard deviation or not.
Now that we know the equations for standard error, let’s do some basic math and learn how to calculate standard error by hand.
Example 1: Assuming we know that the actual standard deviation of a population consisting of students taking their final exam is 7. We also took a random sample of 100 respondents from this population. Therefore we have:

Since in this standard error example we know the actual standard deviation value, we will use the first equation for the standard error above, respectively:

After plugging the numbers in the equation we have:

So, how do we interpret the standard error result in this example? It simply means that when we take a random sample of N = 100 from this population, the average difference between sample means and the population mean is 0.70
Example 2: Now, let’s assume we don’t know the population standard deviation of the students taking their final exam in our school. Instead, we know the sample standard deviation (S) which let’s assume is 5. The sample (N) remains unchanged, respectively 100. Therefore we have:

This time we will use the equation for standard sample deviation:

After we insert the numbers we have:

We can interpret this result as the average difference between sample means and the population mean when the sample is randomly selected and N = 100 is 0.50.
The standard error of the mean is a measure of how much difference you expect to get between a sample statistic and the population parameter and the sample means and the population mean when samples are randomly selected and of a given size.
Calculate Standard Error in SPSS
There are numerous ways to find the standard error in SPSS. In this section, we will focus on two methods that require the least amount of clicks :).
If you wish to practice along, download the SPSS dataset used in the following standard error example HERE.
Launch SPSS on your computer, navigate to File → Open → Data, select the file with the .sav extension you download above and press the Open button to import it in SPSS.
(1) Calculate Standard Error of the Mean in SPSS using Explore Analysis
In SPSS top menu, navigate at Analyze → Descriptive Statistics → Explore
On the Explore window, select a variable in the left box and click the “arrow” button to add it to the Dependent List.
Click the OK button to proceed with the analysis.
On the Output window, scroll down to the Descriptive table. On the Mean row, check the Std. Error column to find the standard error value for the respective variable.
In our example, the mean for the System variable is 4.10 and the standard error is 0.081.
This standard error value is a fairly low one meaning that the sample means analyzed are closely distributed around the population mean. In other words, our sample is representative of the population from where was taken.
If the standard error of the mean in your analysis is high, increasing the sample size through random selection will likely decrease the standard error value.
For instance, if your sample size is N = 50, you could increase it to N = 100 or more to lower the standard error, as seen in the side-by-side comparison below.
Pay attention to the mean and standard error of the mean in both figures.
(2) Find Standard Error on the Mean in SPSS using Frequency Analysis
Another way of calculating standard error in SPSS is using the Frequency analysis. In SPSS, navigate to Analysis → Descriptive Statistics → Frequencies
On the Frequencies window, add the variable of interest from the left box to the Variable(s). Uncheck the Display frequency table check-box and click the Statistics button.
On the Statistics window, make sure the S.E. mean check-box is selected, and press the Continue button.
Click on the OK in the Frequencies window to proceed with the standard error analysis.
The standard error value will be shown in the Std. Error of Mean row of the Statistics table
Standard Error Calculation in Excel
To find the standard error of the mean in Excel, all we need to do is to translate the equation for standard error respectively standard error = standard deviation / square root of the total number of samples N to Excel formula. First, download the Excel dataset used in this example HERE.
- On your Excel data set, click on an empty cell anywhere on your datasheet
2. Copy the standard error Excel formula below into the Insert Function field in Excel.
=STDEV(sampling range)/SQRT(COUNT(sampling range))3. Replace the “sampling range” in the standard error Excel formula with the actual range of cells you want to include in your analysis.
Once your selection is done, hit the ENTER key to complete the analysis.
Excel will show the standard error result in the respective cell as seen in the capture below.
Standard Error Calculation In R
Finally, let’s have a look at which function we can use to find the standard error of the mean in R.
As we discussed earlier, the standard error of the mean is just the standard deviation divided by the square root of the sample size.
If you want to practice the standard error in R analysis along, download the Excel dataset used in this guide HERE.
Launch RStudio on your computer. On the R top menu, navigate to File → Import Dataset → From Excel.
On the Import Excel Data in R window, click on Browse and select the dataset.xlsx file you download above. Click Open than the Import button to finish importing the Excel dataset in R.
NOTE: R might require certain libraries to be able to import data from Excel files (.xlsx, .csv, etc.). If prompted, allow RStudio to automatically install the required dependencies.
(1) Find Standard Error in R using the Standard Error Formula
The first step is to translate the equation for standard error of the mean to a new function(x) in R. Let’s call this function, e.g., stderr or any other name you want.
Type this function in the Console window in R then press ENTER.
stderr <- function(x) sd(x)/sqrt(length(x))Next, let’s calculate the standard error of the mean for the age column in our dataset.
To do so, we will basically invoke the function we created and specify the dataset file and column we want to compute the standard deviation in R using the following syntax:
stderr(dataset$age)Where:
stderr = function for standard deviation formula in R
dataset = the dataset file we imported in R
age = the column (variable) we want to find the standard deviation of the mean value.
The standard deviation for the age variable in our dataset is 0.06 as seen in the capture below:
(2) Find Standard Error in R using Plotrix library
This method uses the std.error() function in the Plotrix package in R. First we need to install the Plotrix library by typing the following command in the Console window in R:
install.package('plotrix')Next, we need to call the Plotrix library in R using the following command:
library('plotrix')Finally, we can use the std.error function to calculate the standard error of the mean for the system variable in our dataset.
std.error(dataset$system)Wrapping Up
Standard error of the mean measures the difference between the sample means compared with the mean of the real population. In other words, it tells us if our sample is representative or not for the population from where was taken.
If the sample analysis shows a high standard error, the best way to lower it is by increasing the sample size using random data collection.
Finally, if you have any suggestions to improve this post further or if you need help with your research paper, don’t hesitate to contact me.
Cite this article on your website or research paper:
APAMLAHarvardVancouverChicagoIEEE
Uedufy (February 9, 2023) How To Find Standard Error Of The Mean In Excel, SPSS, R. Retrieved from https://uedufy.com/how-to-find-standard-error-of-the-mean-in-excel-spss-r/.
«How To Find Standard Error Of The Mean In Excel, SPSS, R.» Uedufy — February 9, 2023, https://uedufy.com/how-to-find-standard-error-of-the-mean-in-excel-spss-r/
Uedufy March 15, 2022 How To Find Standard Error Of The Mean In Excel, SPSS, R., viewed February 9, 2023,<https://uedufy.com/how-to-find-standard-error-of-the-mean-in-excel-spss-r/>
Uedufy — How To Find Standard Error Of The Mean In Excel, SPSS, R. [Internet]. [Accessed February 9, 2023]. Available from: https://uedufy.com/how-to-find-standard-error-of-the-mean-in-excel-spss-r/
«How To Find Standard Error Of The Mean In Excel, SPSS, R.» Uedufy — Accessed February 9, 2023. https://uedufy.com/how-to-find-standard-error-of-the-mean-in-excel-spss-r/
«How To Find Standard Error Of The Mean In Excel, SPSS, R.» Uedufy [Online]. Available: https://uedufy.com/how-to-find-standard-error-of-the-mean-in-excel-spss-r/. [Accessed: February 9, 2023]
References
Field, A., Miles, J., & Field, Z. (2012). Discovering statistics using R. SAGE Publications.
Field, A. (2013). Discovering statistics using IBM SPSS statistics (4th ed.). SAGE Publications.
McNeil, E. (2020). Data management and visualization using R.– Songkhla: Epidemiology Unit, Faculty of Medicine, Prince of Songkla University, 2020.
Here are a couple of ways to calculate standard error quickly
by Sagar Naresh
Sagar is a web developer and technology journalist. Currently associated with WindowsReport and SamMobile. When not writing, he is either at the gym sweating it out or playing… read more
Published on December 16, 2022
Reviewed by
Alex Serban
After moving away from the corporate work-style, Alex has found rewards in a lifestyle of constant analysis, team coordination and pestering his colleagues. Holding an MCSA Windows Server… read more
- Standard error lets you understand the variation between the population mean and the sample mean.
- You can use the general formula method to calculate the standard error.
- Else, you may check out the second method which is quite easy to calculate the standard error.
XINSTALL BY CLICKING THE DOWNLOAD FILE
This software will repair common computer errors, protect you from file loss, malware, hardware failure and optimize your PC for maximum performance. Fix PC issues and remove viruses now in 3 easy steps:
- Download Restoro PC Repair Tool that comes with Patented Technologies (patent available here).
- Click Start Scan to find Windows issues that could be causing PC problems.
- Click Repair All to fix issues affecting your computer’s security and performance
- Restoro has been downloaded by 0 readers this month.
If you are working with a large dataset then knowing its standard deviation comes in handy as it will let you know the variability in the given dataset. Basically, you get to see the degree of asymmetry in your dataset and how much the data deviates from its mean value.
You can also calculate standard error in MS Excel. This will allow you to know how accurate a sample mean is in terms of the true population mean. Here, we will give you a guide on how to calculate standard error in Excel quickly. Let us get right into it.
Why is calculating standard error important in Excel?
The standard deviation allows you to understand the variation in your sample. There are two varieties of standard deviation:
- The standard deviation of a sample: In this, you get to calculate the standard error of a certain dataset or a selected sample of data. For example, you have a chart of the marks of all students in a class. Then you can use the standard deviation of a sample to know the deviation in the marks.
- The standard deviation of a population: In this, you calculate the standard error of all entries in a table. In the above example, you can use the standard deviation of a population to know the deviation for all students.
On the other hand, a standard error lets you know the variability across the samples of the population. Using standard error you understand how a sample’s mean is accurate in terms of the true population mean.
So, to understand standard error simply remember that a standard error is the standard deviation from the population mean. It can be calculated by dividing the standard deviation of a sample by the square root of the sample size.
How to calculate standard error or deviation in MS Excel quickly?
1. Use the formula
- Create a sample data or open your workbook.
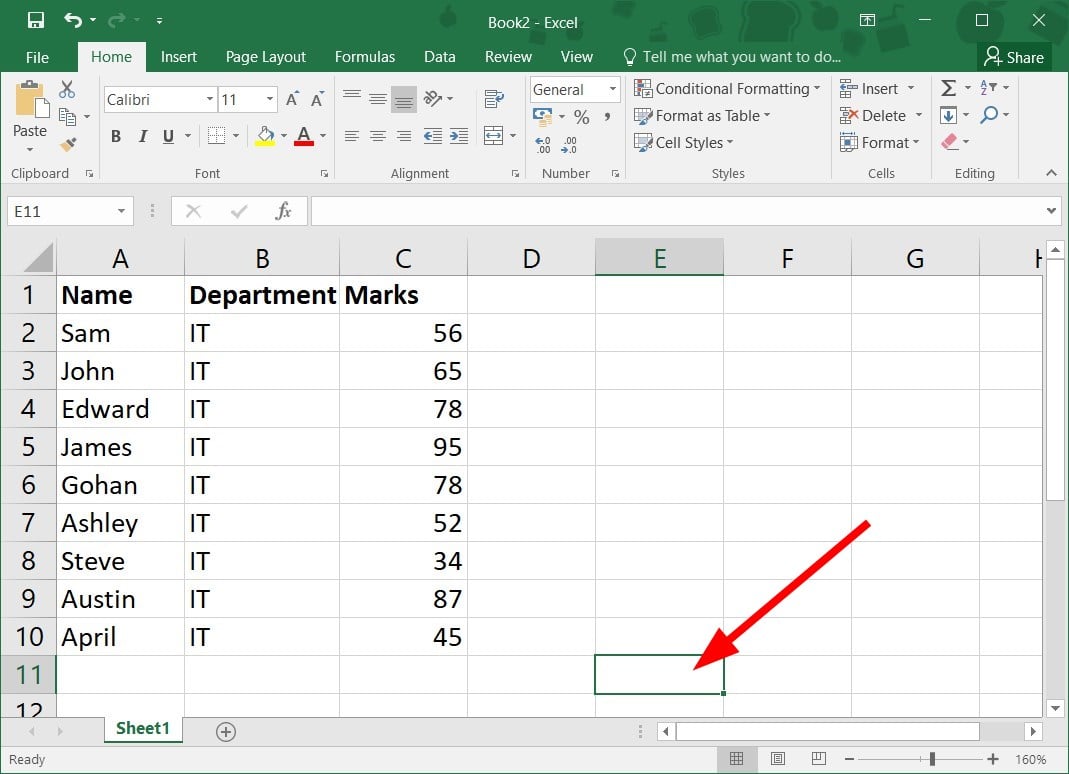
- Click on a cell where you would like your standard error to appear.
- Click on the formula bar next to the fx symbol.
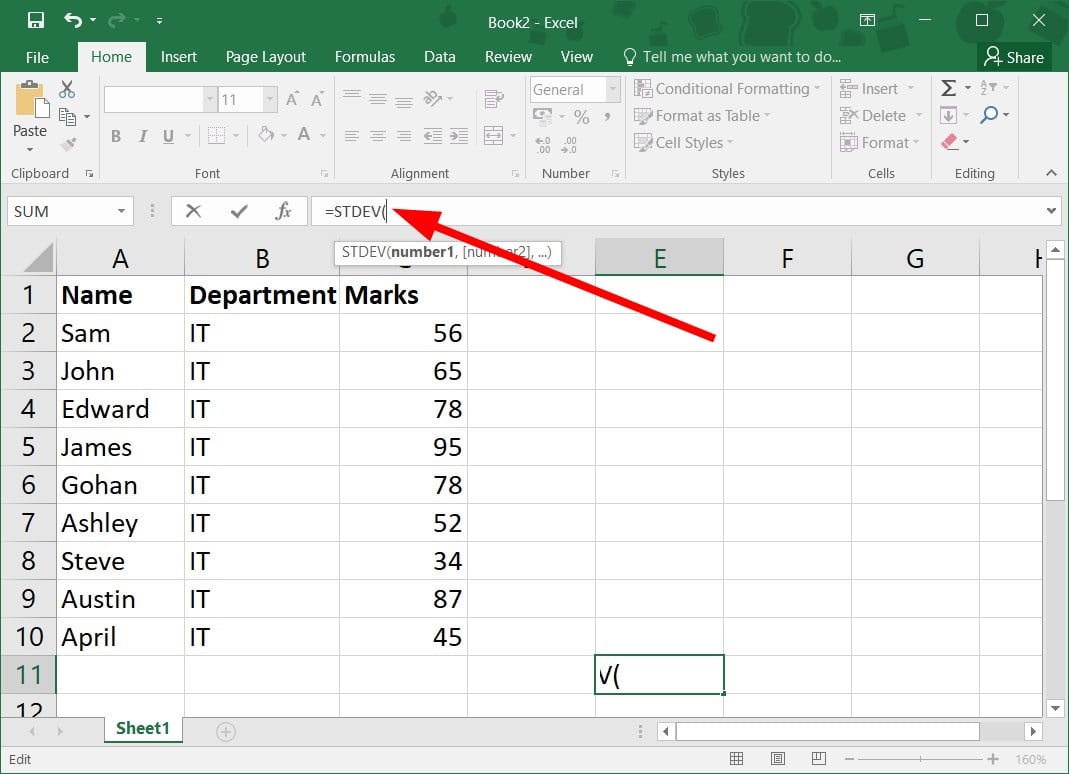
- Type the below formula in the formula bar.
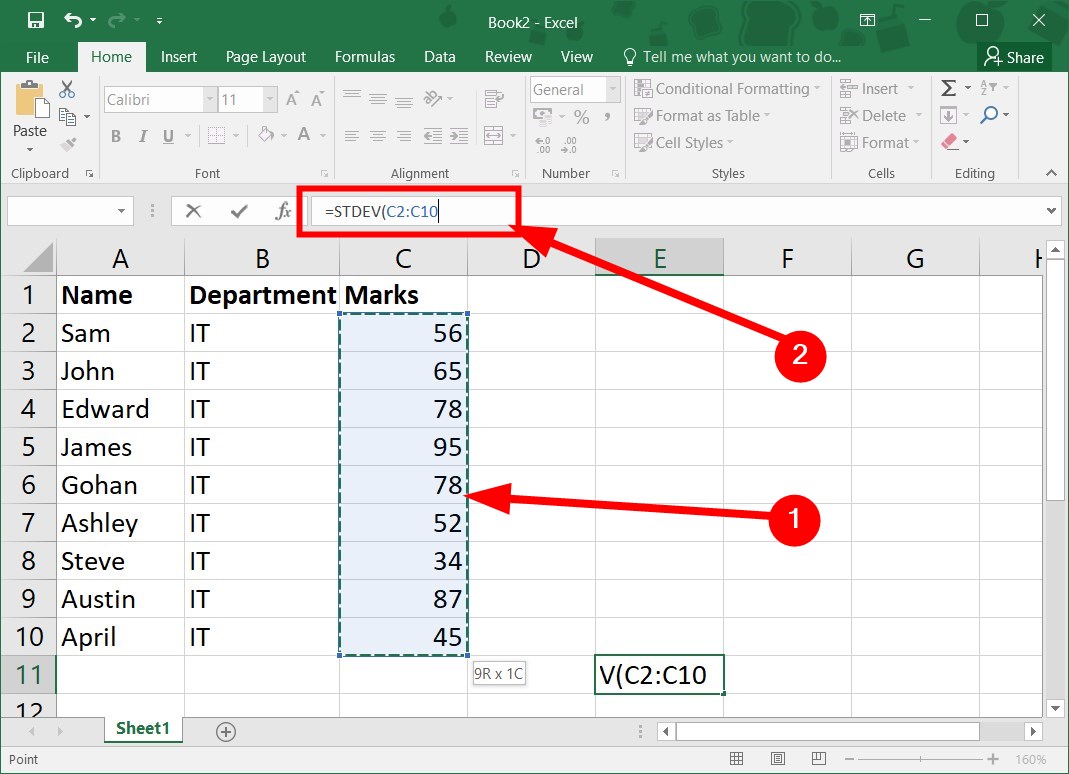
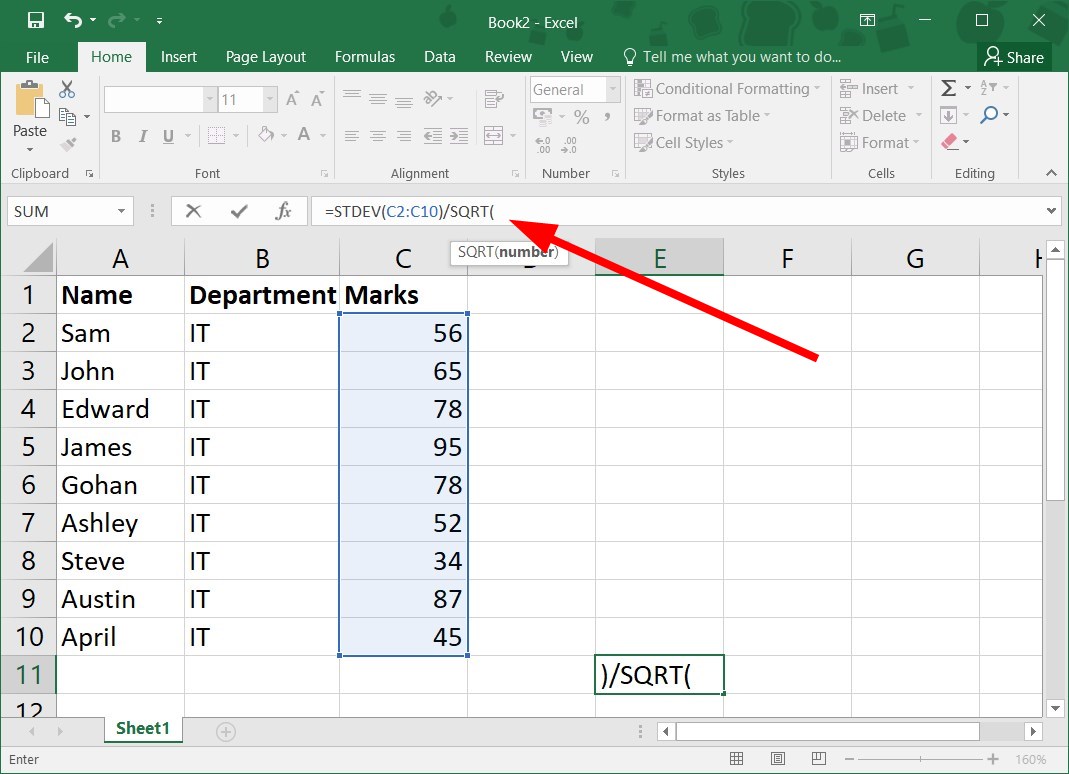
=STDEV( - Drag and select the range of cells in your sample data. For example, in our case, it would become
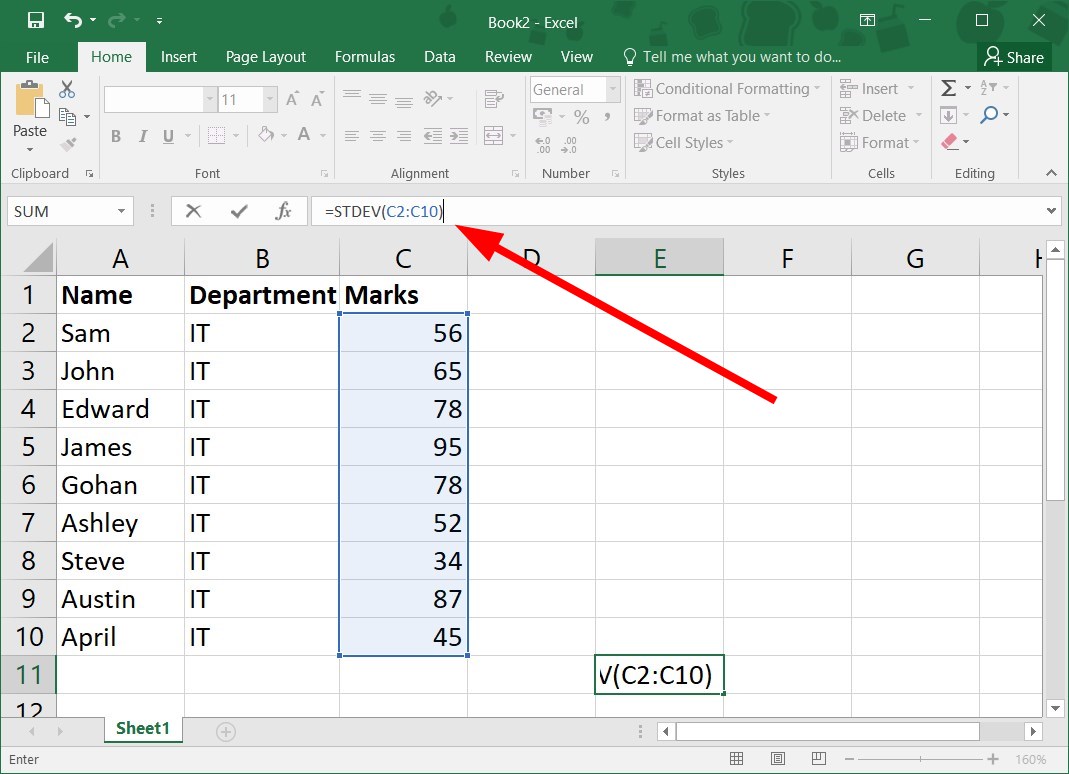
=STDEV(C2:C10 - Close the bracket for the formula.
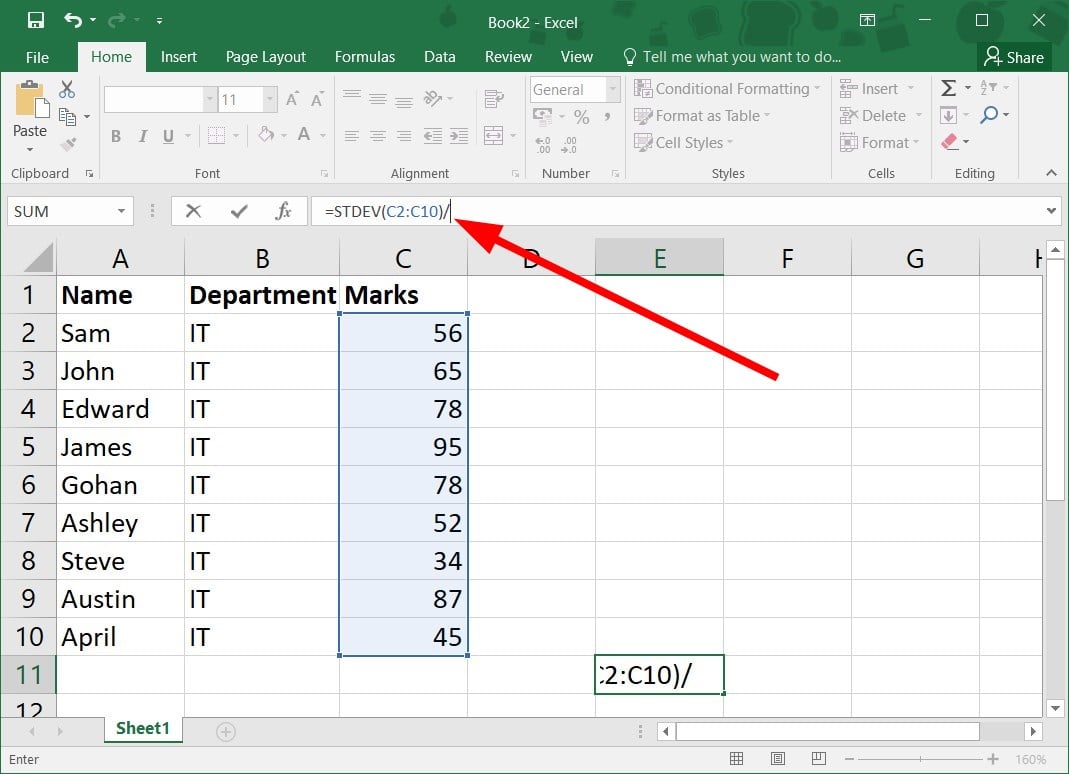
=STDEV(C2:C10) - Add / symbol to the STDEV formula.
=STDEV(C2:C10)/ - Apply the square root formula to the STDEV formula.
=STDEV(C2:C10)/SQRT( - Use the COUNT function with the STDEV formula.
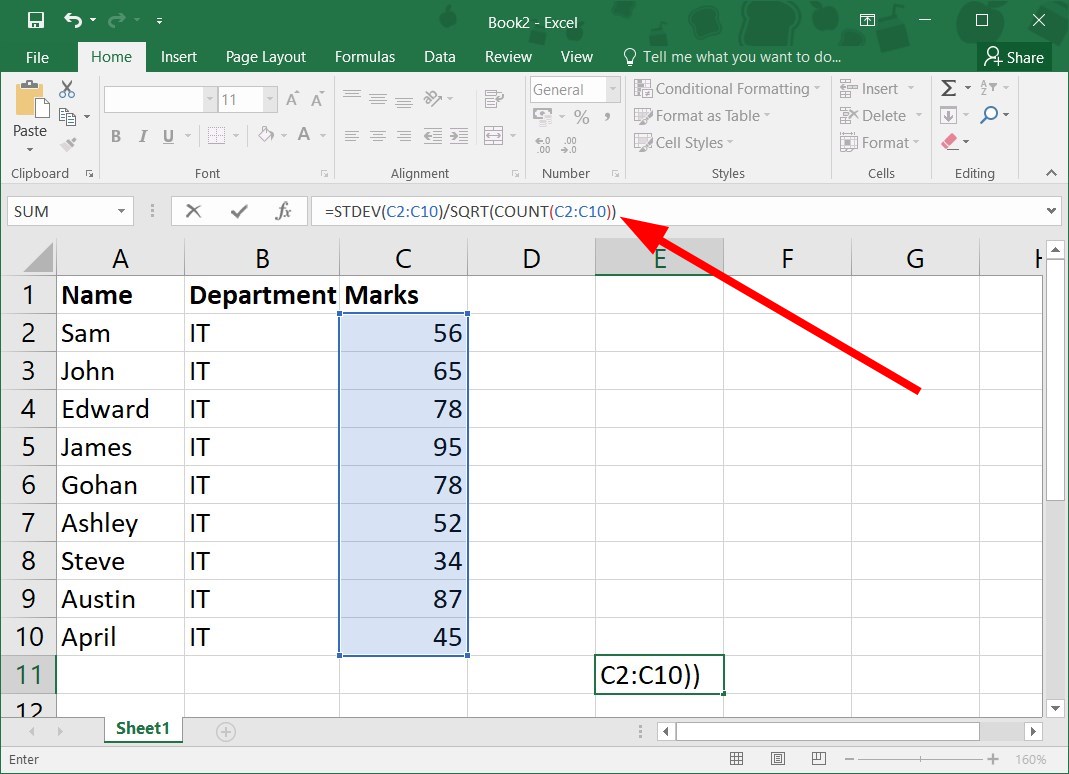
=STDEV(C2:C10)/SQRT(COUNT( - Drag the range of cells that are part of your sample data. Close the SQRT bracket.
=STDEV(C2:C10)/SQRT(COUNT(C2:C10)) - Press Enter to get the standard error.
2. Use Data Analysis ToolPak
- Open your workbook.
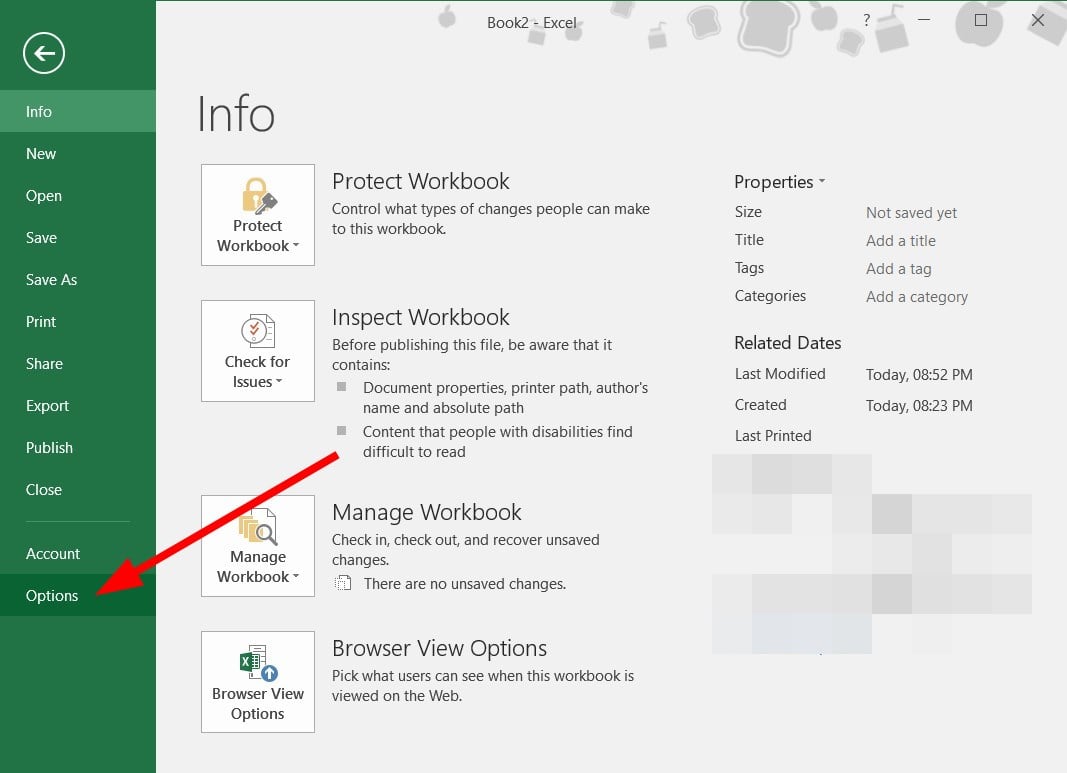
- Click on File.
- Select Options from the left side pane.
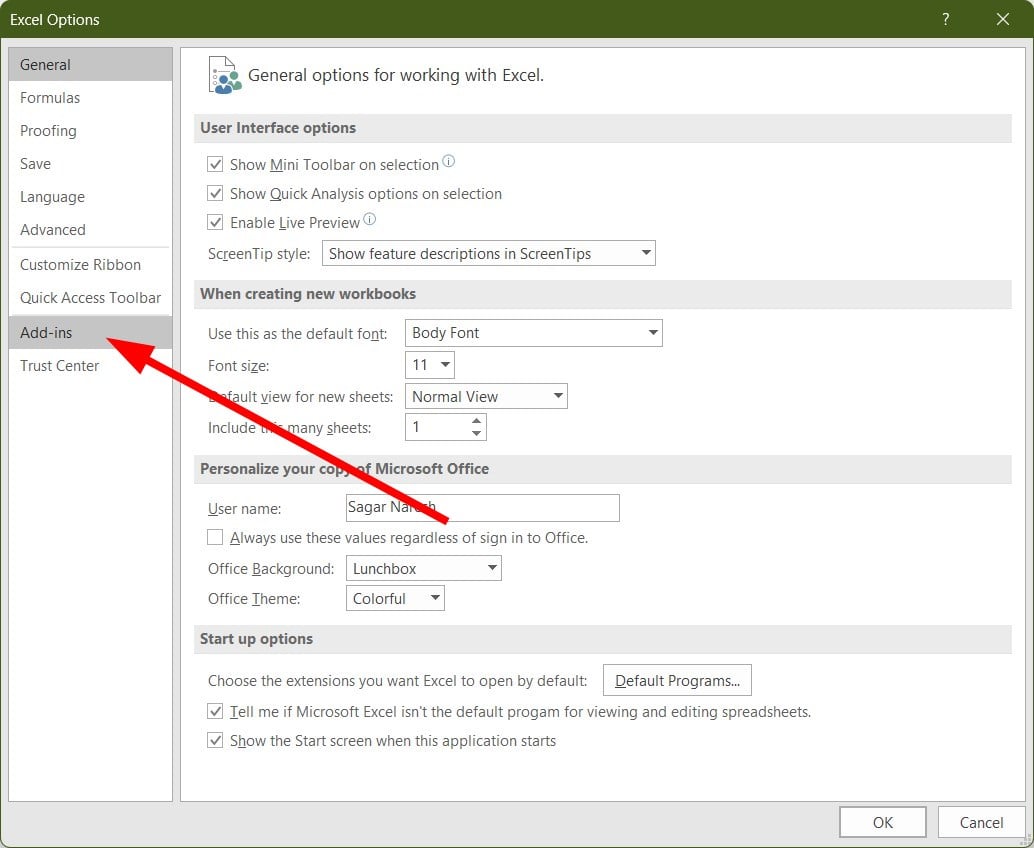
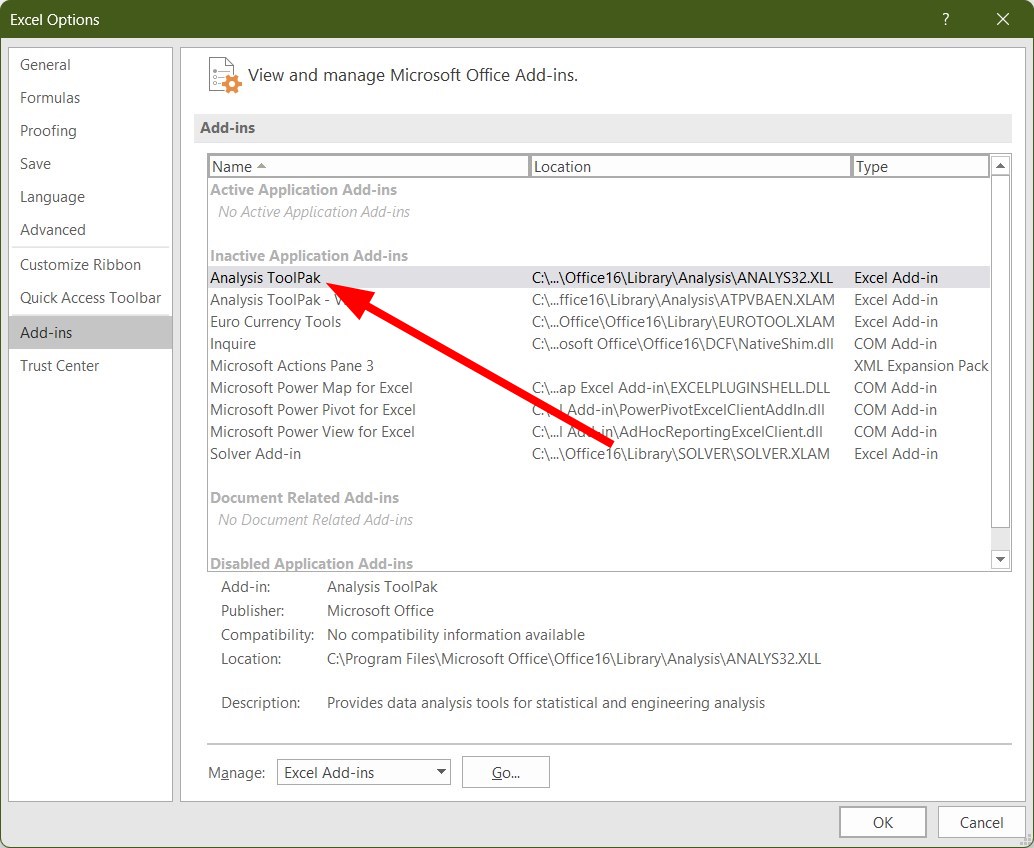
- Select Add-ins in the Options window.
- Select Analysis ToolPaK.
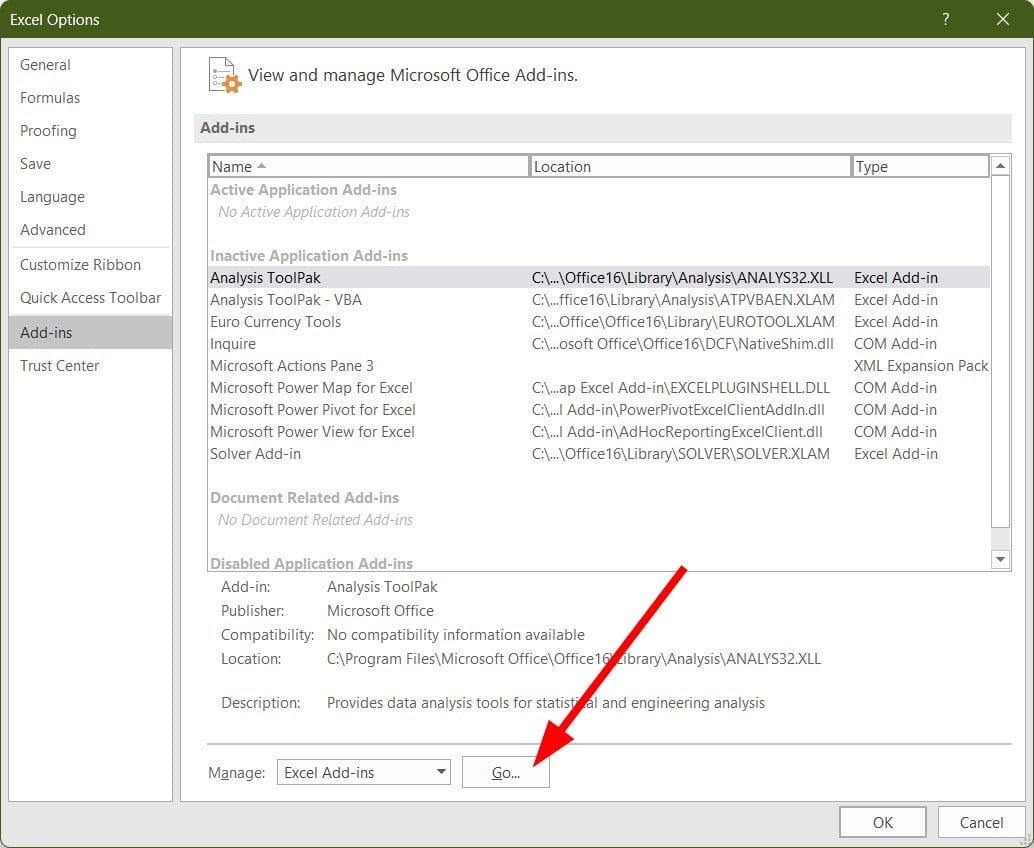
- Click the Go button at the bottom.
- Check the box for Analysis ToolPak and hit OK.
- Click on the Data tab.
- The Data Analysis Toolpak will be added to your Excel toolbar.
- Click on the Data Analysis button.
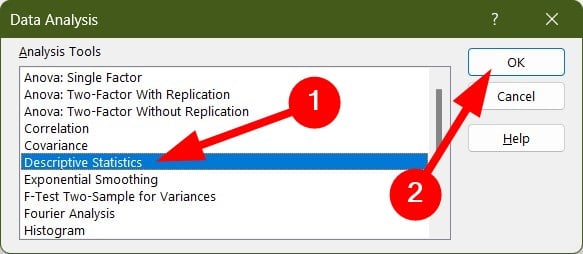
- Select Descriptive Statistics and click OK.
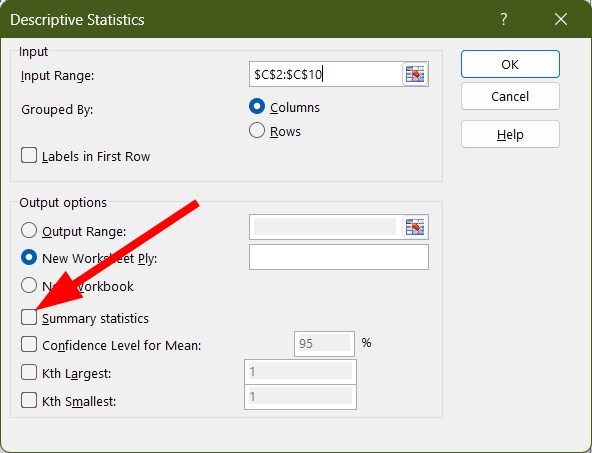
- Select the range of cells from your sample.
- If your data has column headers then choose Labels in first row option.
- Under Output options, select New Worksheet to get the result in a new worksheet in the same workbook, or select New Workbook to get the result in a fresh workbook.
- Check the Summary statistics option.
- Click OK.
- You will get the result and you will see the Standard Error.
Some PC issues are hard to tackle, especially when it comes to corrupted repositories or missing Windows files. If you are having troubles fixing an error, your system may be partially broken.
We recommend installing Restoro, a tool that will scan your machine and identify what the fault is.
Click here to download and start repairing.
That is it from us in this guide on how you can calculate standard error in MS Excel quickly.
- Microsoft Excel is Waiting for Another Application to Complete OLE Action
- FIX: Excel file could not be accessed
- FIX: Excel File isn’t Sending & Attaching to Outlook Email
- FIX: “Cannot be accessed. The file may be corrupted” Excel
- How do I Fix “There are one or more circular references” Excel
If you are having issues opening or running MS Excel then we would suggest you check out our dedicated guide to resolving it in no time.
You can also refer to our guide which will help you with how you can fix the problem if the Excel toolbar is missing. We also have a guide that you can check out and learn how you can open multiple Excel files at once.
If you wish to learn how you can import data from PDF to MS Excel then you can check out our dedicated guide on it. For users having trouble inserting cells in MS Excel, they can check out our guide which lists some of the most effective solutions to resolve the problem.
Let us know in the comments below, which one of the above two solutions you use to calculate standard error in Excel.
Still having issues? Fix them with this tool:
SPONSORED
If the advices above haven’t solved your issue, your PC may experience deeper Windows problems. We recommend downloading this PC Repair tool (rated Great on TrustPilot.com) to easily address them. After installation, simply click the Start Scan button and then press on Repair All.


