Ошибки на интерфейсах есть двух разновидностей: ошибки входа и ошибки вывода.
Ошибки входа бывают следующие:
• Errors: Суммарное количество отмен входящих кадров и ошибок FCS.
• Drops: Количество пакетов, которые дропнул диспетчер ввода-вывода пакетов на ASIC’е. Если интерфейс перегружен, этот счётчик увеличивается на единицу каждрый раз, когда RED дропает пакет.
• Framing errors: Количество пакетов, полученных с неверной контрольной суммой (FCS).
• Runts: «Карлики».
• Policed discards: Количество отброшенных пакетов, так как они были не распознаны или не подпадали под выборку. Обычно, это поле показывает протоколы, которые не обрабатывает JUNOS
• L3 incompletes: Количество отброшенных пакетов с битыми L3-заголовками. Например, поле кадра «destination IP» меньше 32-х бит.
• L2 channel errors: Количество событий, когда конфигурация не смогла назначить логический интерфейс для входящего пакета.
• L2 mismatch timeouts: Количество искаженных или мелких пакетов, которые не смогли быть прочитаны.
• FIFO errors: Количество FIFO-ошибок на входе, о которых сообщил ASIC на контроллере интерфейса.
!!! Это значение должно быть строго НОЛЬ. Ненулевое значение указывает на аппаратный сбой контроллера.
• Resource errors: Суммарное количество дропнутых пакетов.
Ошибки вывода бывают следующие:
• Carrier transitions: Количество переключений интерфейса из состояния «выкл» в состояние «вкл». В норме вещей, эта цифра растёт ОЧЕНЬ медленно (по количеству выдёргиваний патч-кордов, отключений «ответного» устройства или перегрызаний кабеля крысами). Если это число растёт быстро, то у вас «флапает» интерфейс по причине некачественного кабеля, плохого контакта или аппаратного сбоя.
• Errors: Суммарное количество отмен исходящих кадров и ошибок FCS.
• Drops: Количество исходящих пакетов, которые дропнул диспетчер ввода-вывода пакетов на ASIC’е. Если интерфейс перегружен, этот счётчик увеличивается на единицу каждрый раз, когда RED дропает пакет.
• Collisions: Количество Ethernet-коллизий. Важное уточнение: интерфейс Gigabit Ethernet поддерживает работу ТОЛЬКО в режиме «full-duplex»! Соответственно, это для такого интерфейса это число должно ВСЕГДА равняться нулю. Если вы видите ненулевое значение — у вас аппаратный сбой интерфейса или баг в софте.
• Aged packets: Количество пакетов, которые оставались в оперативной памяти маршрутизатора слишком долго и были отброшены. В норме вещей, это число должно быть ВСЕГДА равно нулю. Ненулевое значение указывает на аппаратный сбой или баги в софте.
• FIFO errors: Количество FIFO-ошибок на выходе, о которых сообщил ASIC на контроллере интерфейса.
!!! Это значение должно быть строго НОЛЬ. Ненулевое значение указывает на аппаратный сбой контроллера.
• HS link CRC errors: Количество ошибок в высокоскоростных линиях внутренней связи между ASIC’ами внутри роутера.
• MTU errors: Количество пакетов, чей размер привысил MTU на интерфейсе.
• Resource errors: Суммарное количество дропнутых пакетов.
_
Table of Contents
Анализ проблемы с pppoe
В одном офисе перестал работать pppoe канал в интернет.
Со стороны провайдера было видно srx, но не проходила аутентификация.
При установлении pppoe соединения маршрутизаторы общаются по протоколу LCP — Link Control Protocol.
Что бы разобраться в проблеме надо посмотреть обмен LCP сообщениями.
Смотрим трафик на интерфейсе к которому подключен провайдер.
root@srx> monitor traffic interface pp0.0 extensive count 100
Начало новой сессии, srx послылает запрос на согласование (Conf-Request) параметров (опций) подключения.
18:03:52.248235 Out
        ...
        -----original packet-----
        54:e0:32:00:00:01 > 00:1e:67:00:00:02, ethertype PPPoE S (0x8864), length 36: PPPoE  [ses 37713]LCP (0xc021), length 16: LCP, Conf-Request (0x01), id 70, length 16
        encoded length 14 (=Option(s) length 10)
        0x0000: c021 0146 000e
          MRU Option (0x01), length 4: 1492
            0x0000: 05d4
          Magic-Num Option (0x05), length 6: 0x5665bd0c
            0x0000: 5665 bd0c
Провайдер согласился с предложенными значениям параметров (Conf-Ack).
18:03:52.268010  In
        ...
        -----original packet-----
        00:1e:67:00:00:02 > 54:e0:32:00:00:01, ethertype PPPoE S (0x8864), length 60: PPPoE  [ses 37713]LCP (0xc021), length 16: LCP, Conf-Ack (0x02), id 70, length 16
        encoded length 14 (=Option(s) length 10)
        0x0000: c021 0246 000e
          MRU Option (0x01), length 4: 1492
            0x0000: 05d4
          Magic-Num Option (0x05), length 6: 0x5665bd0c
            0x0000: 5665 bd0c
Провайдер предложил следующую пачку опций, в т.ч. и метот аутентификации — PAP (Auth-Prot Option).
18:03:54.132155  In
        ...
        -----original packet-----
        00:1e:67:00:00:02 > 54:e0:32:00:00:01, ethertype PPPoE S (0x8864), length 60: PPPoE  [ses 37713]LCP (0xc021), length 37: LCP, Conf-Request (0x01), id 2, length 37
        encoded length 35 (=Option(s) length 31)
        0x0000: c021 0102 0023
          PFC Option (0x07), length 2:
          MRU Option (0x01), length 4: 1492
            0x0000: 05d4
          Magic-Num Option (0x05), length 6: 0x2840ee38
            0x0000: 2840 ee38
          Auth-Prot Option (0x03), length 4: PAP
            0x0000: c023
          MRRU Option (0x11), length 4: 2048
            0x0000: 0800
          12-Bit seq # Option (0x12), length 2:
          End-Disc Option (0x13), length 9: MAC 00:1e:67:00:00:03
            0x0000: 0300 1e67 0278 27
SRX не согласился (Conf-Reject) с предложенными провайдером значениями папаметров, и послал список неугодных опций.
18:03:54.132528 Out
        ...
        -----original packet-----
        54:e0:32:00:00:01 > 00:1e:67:00:00:02, ethertype PPPoE S (0x8864), length 43: PPPoE  [ses 37713]LCP (0xc021), length 23: LCP, Conf-Reject (0x04), id 2, length 23
        encoded length 21 (=Option(s) length 17)
        0x0000: c021 0402 0015
          PFC Option (0x07), length 2:
          MRRU Option (0x11), length 4: 2048
            0x0000: 0800
          12-Bit seq # Option (0x12), length 2:
          End-Disc Option (0x13), length 9: MAC 00:1e:67:00:00:03
            0x0000: 0300 1e67 0278 27
Провайдер еще раз предлагает метот аутентификации PAP (Auth-Prot Option)
18:03:54.134273  In
        ...
        -----original packet-----
        00:1e:67:00:00:02 > 54:e0:32:00:00:01, ethertype PPPoE S (0x8864), length 60: PPPoE  [ses 37713]LCP (0xc021), length 20: LCP, Conf-Request (0x01), id 3, length 20
        encoded length 18 (=Option(s) length 14)
        0x0000: c021 0103 0012
          MRU Option (0x01), length 4: 1492
            0x0000: 05d4
          Magic-Num Option (0x05), length 6: 0x2840ee38
            0x0000: 2840 ee38
          Auth-Prot Option (0x03), length 4: PAP
            0x0000: c023
SRX поправляет и предлагает CHAP (Auth-Prot Option).
18:03:54.134654 Out
        ...
        -----original packet-----
        54:e0:32:00:00:01 > 00:1e:67:00:00:02, ethertype PPPoE S (0x8864), length 31: PPPoE  [ses 37713]LCP (0xc021), length 11: LCP, Conf-Nack (0x03), id 3, length 11
        encoded length 9 (=Option(s) length 5)
        0x0000: c021 0303 0009
          Auth-Prot Option (0x03), length 5: CHAP, MD5
            0x0000: c223 05
Последние два сообщения еще раз десять ходят в обе стороны и потом согласование параметров начинается заново.
После осозная проблемы связались с провайдером и попросили переделать аутентификацию на CHAP.
TCP-RST в настройках зоны безопасности
tcp-rst — Send RST for NON-SYN packet not matching TCP session
[edit]
root@bluebox# set security zones security-zone TRUST ?
Possible completions:
  <[Enter]>            Execute this command
> address-book         Address book entries
  application-tracking  Enable Application tracking support for this zone
+ apply-groups         Groups from which to inherit configuration data
+ apply-groups-except  Don't inherit configuration data from these groups
  description          Text description of zone
> host-inbound-traffic  Allowed system services & protocols
> interfaces           Interfaces that are part of this zone
  screen               Name of ids option object applied to the zone
  tcp-rst              Send RST for NON-SYN packet not matching TCP session
  |                    Pipe through a command
Посмотреть тип железа и серийник
show chassis hardware
[edit security utm]
root@msk-02-srx2# run show chassis hardware
Hardware inventory:
Item             Version  Part number  Serial number     Description
Chassis                                AU3911AF0XXX      SRX100H
Routing Engine   REV 18   750-021773   AT3911AF0XXX      RE-SRX100H
FPC 0                                                    FPC
  PIC 0                                                  8x FE Base PIC
Power Supply 0
dhcp helper
[edit]
admin@nsk-01-srx2# show forwarding-options
...
helpers {
    bootp {
        server 192.168.10.22;
        server 192.168.9.12;
        vpn;
        interface {
            vlan.502;
            vlan.504;
            vlan.501;
            vlan.506;
        }
    }
}
host inbound traffic — bootp, dhcp
[edit security zones security-zone trust]
admin@msk-04-srx1# show
interfaces {
    vlan.501 {
        host-inbound-traffic {
            system-services {
                ping;
                traceroute;
                ssh;
                dhcp;
            }
        }
    }
    vlan.502 {
        host-inbound-traffic {
            system-services {
                ping;
                traceroute;
                bootp;
            }
        }
    }
bootp — надо использовать когда на srx настроен dhcp хелпер ([edit forwarding-options helpers bootp]).
dhcp — надо использовать когда на самом srx настроен dhcp сервер.
Juniper open dns server
name-server {
    208.67.222.222;
    208.67.220.220;
}
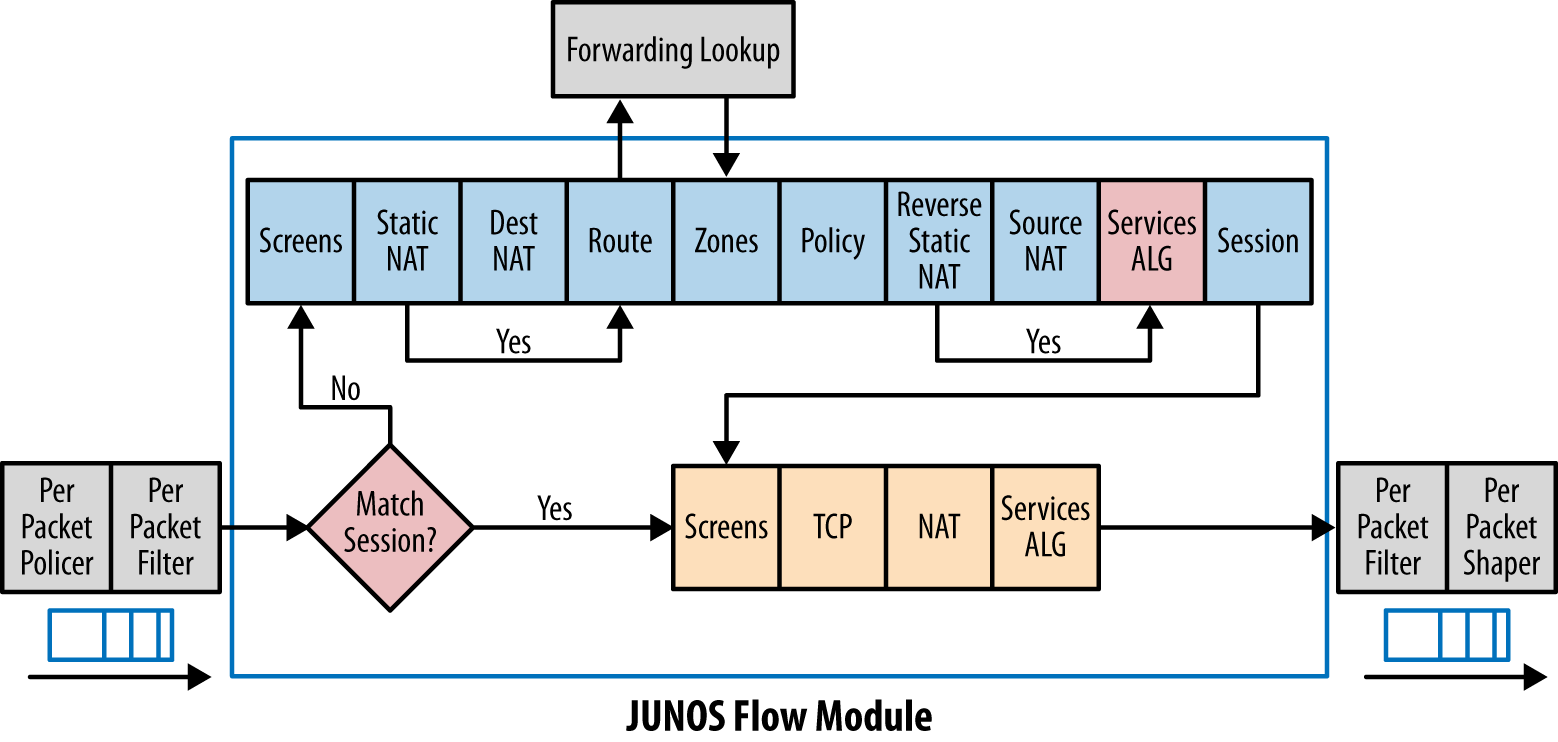
Схема прохождения пакета через srx
Подрезать скорость
Скрыть часть конфига
Что бы скрыть часть конфига надо уровнем ниже дать скрытую команду “apply-flags omit”.
[edit firewall]
admin@srx2# set family inet filter TEST apply-flags omit

[edit firewall]
admin@srx2# show
...
    filter TEST { /* OMITTED */ };
}
...
Что бы посмотреть надо через пайп дать команду “display omit”
[edit firewall]
admin@srx2# show | display omit
...
   filter TEST {
        apply-flags omit;
        term DENY-ANY {
            then {
                discard;
            }
        }
    }
...
Задать shell при логине пользователя
Что бы при логине обычный пользователь попадал не в консоль CLI, а сразу в unix-шелл надо дать скрытую команду “shell sh” (UNIX Bourne shell) или “shell csh” (UNIX C shell).
Заход сразу в шелл можно использовать когда надо вытащить логи srx которые не попадают в syslog.
{primary:node0}[edit system login user scp]
root@srxmaster# show
apply-flags omit;
uid 2000;
class super-user;
shell sh;
authentication {
    encrypted-password "XXX"; ## SECRET-DATA
}
Ошибка комита при достижении максимального количества зон безопасности на srx100
root@srx100B# commit check
error: zone quota exceeded (usage 11 > max 10)
error: configuration check-out failed
Ошибки на физическом интерфейсе
Carrier transitions
Вывод “show interface”:
Input errors:
 Errors: 0, Drops: 0, Framing errors: 0, Runts: 0, Policed discards: 0, L3 incompletes: 0, L2 channel errors: 0, L2 mismatch timeouts: 0, FIFO errors: 0, Resource errors: 0

Output errors:
 Carrier transitions: 5, Errors: 0, Drops: 0, Collisions: 0, Aged packets: 0, FIFO errors: 0, HS link CRC errors: 0, MTU errors: 0, Resource errors: 0
Carrier transitions just mean the link has flapped. See the exact description from Juniper:
Carrier transitions—Number of times the interface has gone from down
to up. This number does not normally increment quickly,increasing only when the cable is unplugged, the far-end system is
powered down and then up, or another problem occurs. If the number
of carrier transitions increments quickly (perhaps once every 10 seconds),
the cable, the far-end system, or the PIC or PIM is malfunctioning.
You would need to do basic troubleshooting to find out why the link is flapping. Those steps would be different >if it was a telco circuit or an P2P ethernet cable.
Framing errors
KB27597
Вывод “show interface”:
Input errors:
 Errors: 468, Drops: 0, Framing errors: 468, Runts: 0, Policed discards: 71, L3 incompletes: 0, L2 channel errors: 0, L2 mismatch timeouts: 0, FIFO errors: 0, Resource errors: 0
KB27597
Framing errors — это ошибка в контрольнной сумме пришедшего на интерфейс пакета, пакет “бьется” и контрольные суммы отправленного и полученно пакета не совпадают.
Решение проблемы с Framing errors заключается в:
-
проверить, что с обоих концов правильно настроены скорость и дуплекс порта.
-
поменять патч-корд
-
поменять порт оборудования
Policed discards
Policed discards — дропаются служебные пакеты протоков которык нет в “security interface host-inbound-traffic protocols”.
При случае проверить с ospf.
“Frames that the incoming packet match code discarded because they were not recognized or of interest. Usually, this field reports protocols that the JUNOS software does not handle, such as CDP.”
Скорость создания сессий.
KB23428
CLI
 root@srx2> show security monitoring fpc ?
 Possible completions:
   <fpc-slot>           FPC slot number (0..0)
 root@srx2> show security monitoring fpc 0 ?
 Possible completions:
   <[Enter]>            Execute this command
   |                    Pipe through a command
 admin@msk-01-srx2> show security monitoring fpc 0
 FPC 0
   PIC 0
     CPU utilization          :    3 %
     Memory utilization       :   57 %
     Current flow session     :  469
     Current flow session IPv4:  469
     Current flow session IPv6:    0
     Max flow session         : 524288
Total Session Creation Per Second (for last 96 seconds on average):   15
IPv4  Session Creation Per Second (for last 96 seconds on average):   15
IPv6  Session Creation Per Second (for last 96 seconds on average):    0
SNMP OID
root@srx2> show snmp mib walk .1.3.6.1.4.1.2636.3.39.1.12.1.4.1.5
jnxJsNodeSessionCreationPerSecond.0 = 15
Когда два srx работают в режиме кластера в выводе появится строка “jnxJsNodeSessionCreationPerSecond.1 = ”
root@srx2> show snmp mib walk .1.3.6.1.4.1.2636.3.39.1.12.1.4.1
jnxJsClusterMonitoringNodeIndex.0 = 0
jnxJsClusterMonitoringNodeDescr.0 = single
jnxJsNodeCurrentTotalSession.0 = 485
jnxJsNodeMaxTotalSession.0 = 0
jnxJsNodeSessionCreationPerSecond.0 = 15
jnxJsNodeSessCreationPerSecIPv4.0 = 15
jnxJsNodeSessCreationPerSecIPv6.0 = 0
jnxJsNodeCurrentTotalSessIPv4.0 = 485
jnxJsNodeCurrentTotalSessIPv6.0 = 0
Бэкап и восстановление конфигурации
Часто возникает задача синхронизировать конфиги основного и резервного srx.
Пока опустим момент как мы оба srx ставим в сеть.
Идея:
-
с основного srx1 по ssh скачиваем текущий конфиг juniper.conf.gz
-
переименовываем juniper.conf.gz в juniper.conf.new.gz
-
закачиваем на резервный srx2 конфиг juniper.conf.new.gz
-
на srx2 накатываем новый конфиг
Скачиваем текущий конфиг
# scp root@10.13.1.254:/config/juniper.conf.gz ./
Password:
juniper.conf.gz                    100%   11KB  10.7KB/s   00:00
переименовываем
# mv juniper.conf.gz juniper.conf.new.gz
закачиваем на резервный srx2
# scp juniper.conf.new.gz root@10.13.1.254:/config/
Password:
накатываем новый конфиг
[edit]
admin@srx2# load override /config/juniper.conf.new.gz
Потом проверяем его, меняем где надо адреса на интерфесах и название и комитим.
MOTD
Message of the day
admin@srx2# set system login message “Privet Serega! NE PEREGRUZHAI srx! Lozhis` spat`![]() WBR EKS and Levin.”
WBR EKS and Levin.”
Залить текущий junos на бэкапный раздел
root@srx-master> request system snapshot slice alternate
node0:
Formatting alternate root (/dev/ad0s1a)…
Copying ‘/dev/ad0s2a’ to ‘/dev/ad0s1a’ .. (this may take a few minutes)
The following filesystems were archived: /
node1:
Formatting alternate root (/dev/ad0s2a)…
Copying ‘/dev/ad0s1a’ to ‘/dev/ad0s2a’ .. (this may take a few minutes)
The following filesystems were
На кластере можно дать команду только на активной ноде.
Перенести кусок конфигурации с одного srx на другой
Будем переносить записи в address book.
Отображаем конфирацию в set стиле
 [edit security address-book UNTRUST-BOOK]
 root@srx-old# show | display set
 set security address-book UNTRUST-BOOK address perevod-korona.ru dns-name perevod-korona.ru ipv4-only
 set security address-book UNTRUST-BOOK address wupos.westernunion.com dns-name wupos.westernunion.com ipv4-only
...
Подгружаем конфигурацию
У команды load есть ключ relative который подкружает set не от корня конфигуации, а от текущего места.
{primary:node1}[edit security address-book]
root@srx-new# load set terminal
[Type ^D at a new line to end input]
set security address-book UNTRUST-BOOK address perevod-korona.ru dns-name perevod-korona.ru ipv4-only
set security address-book UNTRUST-BOOK address wupos.westernunion.com dns-name wupos.westernunion.com ipv4-only
...
^D
Нюансы
Если сразу переносить много конфига, то RE возможно будет не успевать его отрабатывать и будут появляться ошибки вида — “terminal:2:(4) syntax error: address”.
Проблема описана в KB15472. Как решить в линуксовом терминале пока не придумал.
Если сидеть на srx через череp minicom, то заливаться будет без ошибок — скорость соединения маленькая.
Обновить софт в srx
 root> request system software add ?
 Possible completions:
   <package-name>       URL or pathname of package
   best-effort-load     Load succeeds if at least one statement is valid
   delay-restart        Don't restart processes
   no-copy              Don't save copies of package files
   no-validate          Don't check compatibility with current configuration
   partition            Format and re-partition the media before installation
   reboot               Reboot system after adding package
   unlink               Remove the package after successful installation
   validate             Check compatibility with current configuration

root> request system software add no-copy http://192.168.10.12/junos/junos-srxsme-12.1X47-D25.4-domestic.tgz
KB25265
http://kb.juniper.net/InfoCenter/index?page=content&id=KB25265
Проблема.
 root@srx> ping ocsp.comodoca.com
 PING6(56=40+8+8 bytes) :: --> 2a02:1788:2fd::b2ff:5301
 ping: sendmsg: No route to host
 ping6: wrote ocsp.comodoca.com 16 chars, ret=-1
 ^C
 --- ocsp.comodoca.com ping6 statistics ---
 1 packets transmitted, 0 packets received, 100% packet loss
Решение.
root@srx> ping ocsp.comodoca.com inet
 PING ocsp.comodoca.com (178.255.83.1): 56 data bytes
 64 bytes from 178.255.83.1: icmp_seq=0 ttl=57 time=79.415 ms
 ^C
 --- ocsp.comodoca.com ping statistics ---
 1 packets transmitted, 1 packets received, 0% packet loss
 round-trip min/avg/max/stddev = 79.415/79.415/79.415/0.000 ms
Записать вывод команды в файл
root@srx> show services application-identification application detail | save ai-app-detail
Файл запишется в домашнюю директорию пользователя.
Истекли лицензии appid-sig и idp-sig
 root@srx> show system license
 License usage:
                                  Licenses     Licenses    Licenses    Expiry
   Feature name                       used    installed      needed
   av_key_kaspersky_engine               1            0           1    28 days
   dynamic-vpn                           0            2           0    permanent
   ax411-wlan-ap                         0            2           0    permanent
   appid-sig                             1            0           1    invalid
         - APPID Signature
Все ранее настроенные политики продолждают работать.
Нельзя обновить сигнатуры и верме комита увеличилось секунд на 40.
 root@srx# commit
 [edit security idp idp-policy Recommended rulebase-ips rule 1 match attacks]
   'predefined-attack-groups "[Recommended]IP - Critical"'
     Security Package is being used, however license is not valid/has expired. This may be in violation of policy.
 commit complete
Смысл maximum-transactions в настройках вложенных приложений (nested applications)
 nested-application my:XAKEP-SSL {
     type XAKEP;
     protocol SSL;
     signature NestedApplication:XAKEP-SSL {
         member m01 {
             context ssl-server-name;
             pattern xakep.ru;
             direction client-to-server;
         }
         maximum-transactions 1;
     }
 }
maximum-transactions — максимальное количество совпадений с “подписью” при при достижении которого считается, что это именно это приложение.
Посмотреть список и детальную информацию по типам приложений с которыми работает AppFW и IDP на srx
 root@srx> show services application-identification application summary
 Application(s): 800
 Nested Application(s): 981
   Applications                                 Disabled         ID      Order
   junos:ZENGUARD-SSL                            No               1987    33799
   junos:FACEBOOK-TIMELINE                       No               1986    33793
   junos:FACEBOOK-STATUS-UPDATE                  No               1985    33794
   junos:GOLFZON-MEMBERS-SSL                     No               1984    33792
   junos:AFREECA-HTTP-STREAM                     No               1982    33790
....

root@srx> show services application-identification application summary | match HTTP
  junos:AFREECA-HTTP-STREAM                     No               1982    33790
  junos:WECHAT-HTTP                             No               1932    33751
  junos:SSH-OVER-HTTP                           No               1907    33586
  junos:YAHOO-FINANCE-HTTP                      No               1896    33722
  junos:AIM-HTTP-API                            No               1865    33700
  junos:ALIWANGWANG-HTTP                        No               1863    33704
  junos:BAIDU-HI-HTTP                           No               1859    33703
  junos:GROOVE-HTTP                             No               1264    33669
...

 root@srx> show services application-identification application detail junos:YAHOO-FINANCE-HTTP
 Application Name: junos:YAHOO-FINANCE-HTTP
 Application type: YAHOO-FINANCE-HTTP
 Description: This signature detects Yahoo! finance, a site from Yahoo! that provides financial news and information.
 Application ID: 1896
 Disabled: No
 Number of Parent Group(s): 1
 Application Groups:
     junos:web:finance
 Application Tags:
     characteristic        : Bandwidth Consumer
     characteristic        : Loss of Productivity
     risk                  : 2
     subcategory           : Finance
     category              : Web
 Signature NestedApplication:YAHOO-FINANCE-HTTP
     Layer-7 Protocol: HTTP
     Chain Order: no
     Maximum Transactions: 1
     Order: 33722
     Member(s): 1
         Member 0
             Context: http-header-host
             Pattern: (.*.)?finance.yahoo.com
             Direction: CTS
Посмотреть настройки стантардных junos application
root> show configuration groups junos-defaults applications
Посмотреть кто залогинился
root> show system users no-resolve
  5:38PM  up 28 days,  2:04, 4 users, load averages: 0.10, 0.06, 0.04
 USER     TTY      FROM                              LOGIN@  IDLE WHAT
 root     p0                                                          3:17PM   2:04 cli
 root     p1                                                          3:03PM     55 cli
 root     p2                                                          4:21PM     56 cli
 root     p3                                                          5:31PM      - cli
Поставить таймаут на ssh/telnet сессию
root> set cli idle-timeout 60
 Idle timeout set to 60 minutes

 root> show cli
 CLI complete-on-space set to on
CLI idle-timeout set to 60 minutes
 CLI restart-on-upgrade set to on
 CLI screen-length set to 55
 CLI screen-width set to 207
 CLI terminal is 'xterm'
 CLI is operating in enhanced mode
 CLI timestamp disabled
 CLI working directory is '/cf/root'
Передернуть руками ноду в кластере
root> request chassis cluster failover redundancy-group [0|1] node [0|1]
Увести RG0 на node1:
root> request chassis cluster failover redundancy-group 0 node 1
После этого приоритет node1 для RG0 станет равным 255.
Что бы привести приоритет в соответствие со штатными настройками надо дать комануду:
root> request chassis cluster failover reset redundancy-group 0
После этого, в зависимости от настройки “Preempt”, RG0 останется или на node1 или вернется на node0.
Сброс конфигурации junos
 [edit]
 root# load factory-default
 warning: activating factory configuration
Посмотреть загрузку cpu
Routing Engine
 user@srx> show chassis routing-engine
 Routing Engine status:
     Temperature                 57 degrees C / 134 degrees F
     Total memory              1024 MB Max   655 MB used ( 64 percent)
       Control plane memory     544 MB Max   457 MB used ( 84 percent)
       Data plane memory        480 MB Max   202 MB used ( 42 percent)
     CPU utilization:
       User                       4 percent
       Background                 0 percent
       Kernel                    10 percent
       Interrupt                  0 percent
       Idle                      85 percent
     Model
     Serial ID
     Start time                     2015-02-04 19:03:18 GMT-3
     Uptime                         26 minutes, 6 seconds
     Last reboot reason             0x200:normal shutdown
     Load averages:                 1 minute   5 minute  15 minute
                                        0.07       0.17       0.61
Forwarding Plane
Смотреть “Real-time threads CPU utilization”
 user@srx> show chassis forwarding
 FWDD status:
   State                                 Online
   Microkernel CPU utilization        14 percent
   Real-time threads CPU utilization   0 percent
   Heap utilization                   42 percent
   Buffer utilization                  1 percent
   Uptime:                               22 minutes, 39 seconds
19. Ошщибка комита при достижении максимального количества зон безопасности.
root@srx100B# commit check
error: zone quota exceeded (usage 11 > max 10)
error: configuration check-out failed
18. Ошибки на физическом интерфейсе.
http://networking.ringofsaturn.com/Routers/junipershowint.php
Input errors:
Errors: 0, Drops: 0, Framing errors: 0, Runts: 0, Policed discards: 0, L3 incompletes: 0, L2 channel errors: 0, L2 mismatch timeouts: 0, FIFO errors: 0, Resource errors: 0
Output errors:
Carrier transitions: 5, Errors: 0, Drops: 0, Collisions: 0, Aged packets: 0, FIFO errors: 0, HS link CRC errors: 0, MTU errors: 0, Resource errors: 0
Carrier transitions:
«Carrier transitions just mean the link has flapped. See the exact description from Juniper
Carrier transitions—Number of times the interface has gone from down
to up. This number does not normally increment quickly,
increasing only when the cable is unplugged, the far-end system is
powered down and then up, or another problem occurs. If the number
of carrier transitions increments quickly (perhaps once every 10 seconds),
the cable, the far-end system, or the PIC or PIM is malfunctioning.
You would need to do basic troubleshooting to find out why the link
is flapping. Those steps would be different if it was a telco circuit or
an P2P ethernet cable.»
Input errors:
Errors: 468, Drops: 0, Framing errors: 468, Runts: 0, Policed discards: 71, L3 incompletes: 0, L2 channel errors: 0, L2 mismatch timeouts: 0, FIFO errors: 0, Resource errors: 0
Framing errors:
KB27597
Это ошибка в контрольнной сумме пришедшего на интерфейс пакета, пакет «бьется» и
контрольные суммы отправленного и полученно пакета не совпадают.
Решение проблемы с Framing errors заключается в:
— проверить, что с обоих концов правильно настроены скорость и дуплекс порта.
— поменять патч-корд
— поменять порт оборудования
Policed discards: 71
Дропаются протоколы которык не в «security interface host-inbound-traffic protocols». При случае проверить с ospf.
«Frames that the incoming packet match code
discarded because they were not recognized or of interest. Usually,
this field reports protocols that the JUNOS software does not
handle, such as CDP.»
17. Скорость создания сессий.
KB23428
root@srx2> show security monitoring fpc ?
Possible completions:
<fpc-slot> FPC slot number (0..0)
root@srx2> show security monitoring fpc 0 ?
Possible completions:
<[Enter]> Execute this command
| Pipe through a command
admin@msk-01-srx2> show security monitoring fpc 0
FPC 0
PIC 0
CPU utilization : 3 %
Memory utilization : 57 %
Current flow session : 469
Current flow session IPv4: 469
Current flow session IPv6: 0
Max flow session : 524288
Total Session Creation Per Second (for last 96 seconds on average): 15
IPv4 Session Creation Per Second (for last 96 seconds on average): 15
IPv6 Session Creation Per Second (for last 96 seconds on average): 0
SNMP OID
root@srx2> show snmp mib walk .1.3.6.1.4.1.2636.3.39.1.12.1.4.1.5
jnxJsNodeSessionCreationPerSecond.0 = 15
Когда два srx работают в режиме кластера в выводе появится строка «jnxJsNodeSessionCreationPerSecond.1 = «
root@srx2> show snmp mib walk .1.3.6.1.4.1.2636.3.39.1.12.1.4.1
jnxJsClusterMonitoringNodeIndex.0 = 0
jnxJsClusterMonitoringNodeDescr.0 = single
jnxJsNodeCurrentTotalSession.0 = 485
jnxJsNodeMaxTotalSession.0 = 0
jnxJsNodeSessionCreationPerSecond.0 = 15
jnxJsNodeSessCreationPerSecIPv4.0 = 15
jnxJsNodeSessCreationPerSecIPv6.0 = 0
jnxJsNodeCurrentTotalSessIPv4.0 = 485
jnxJsNodeCurrentTotalSessIPv6.0 = 0
16. MOTD
Message of the day
set system login message «Privet Serega! NE PEREGRUZHAI srx! Lozhis` spat`=) WBR EKS and Levin.»
15. Залить текущий junos на бэкапный раздел.
root@srx-master> request system snapshot slice alternate
node0:
—————————————————————————
Formatting alternate root (/dev/ad0s1a)…
Copying ‘/dev/ad0s2a’ to ‘/dev/ad0s1a’ .. (this may take a few minutes)
The following filesystems were archived: /
node1:
—————————————————————————
Formatting alternate root (/dev/ad0s2a)…
Copying ‘/dev/ad0s1a’ to ‘/dev/ad0s2a’ .. (this may take a few minutes)
The following filesystems were
На кластере можно дать команду только на активной ноде.
14. Перенести кусок конфигурации с одного srx на другой.
Будем переносить записи в address book.
Отображаем конфирацию в set стиле.
[edit security address-book UNTRUST-BOOK]
root@srx-old# show | display set
set security address-book UNTRUST-BOOK address perevod-korona.ru dns-name perevod-korona.ru ipv4-only
set security address-book UNTRUST-BOOK address wupos.westernunion.com dns-name wupos.westernunion.com ipv4-only
…
Подгружаем конфигурацию.
У команды load есть ключ relative который подкружает set не от корня конфигуации, а от текущего места.
{primary:node1}[edit security address-book]
root@srx-new# load set terminal
[Type ^D at a new line to end input]
set security address-book UNTRUST-BOOK address perevod-korona.ru dns-name perevod-korona.ru ipv4-only
set security address-book UNTRUST-BOOK address wupos.westernunion.com dns-name wupos.westernunion.com ipv4-only
…
^D
Нюансы.
Если сразу переносить много конфига, то RE возможно будет не успевать его отрабатывать и будут появляться ошибки вида — «terminal:2:(4) syntax error: address».
Проблема описана в KB15472. Как решить в линуксовом терминале пока не придумал.
Если сидеть на srx через череp minicom, то заливаться будет без ошибок — скорость соединения маленькая.
13. Обновить софт в srx
root> request system software add ?
Possible completions:
<package-name> URL or pathname of package
best-effort-load Load succeeds if at least one statement is valid
delay-restart Don’t restart processes
no-copy Don’t save copies of package files
no-validate Don’t check compatibility with current configuration
partition Format and re-partition the media before installation
reboot Reboot system after adding package
unlink Remove the package after successful installation
validate Check compatibility with current configuration
root> request system software add no-copy http://192.168.10.12/junos/junos-srxsme-12.1X47-D25.4-domestic.tgz
12. KB25265
http://kb.juniper.net/InfoCenter/index?page=content&id=KB25265
root@srx> ping ocsp.comodoca.com
PING6(56=40+8+8 bytes) :: —> 2a02:1788:2fd::b2ff:5301
ping: sendmsg: No route to host
ping6: wrote ocsp.comodoca.com 16 chars, ret=-1
^C
— ocsp.comodoca.com ping6 statistics —
1 packets transmitted, 0 packets received, 100% packet loss
root@srx> ping ocsp.comodoca.com inet
PING ocsp.comodoca.com (178.255.83.1): 56 data bytes
64 bytes from 178.255.83.1: icmp_seq=0 ttl=57 time=79.415 ms
^C
— ocsp.comodoca.com ping statistics —
1 packets transmitted, 1 packets received, 0% packet loss
round-trip min/avg/max/stddev = 79.415/79.415/79.415/0.000 ms
11. Записать вывод команды в файл.
root@srx> show services application-identification application detail | save ai-app-detail
Файл запишется в домашнюю директорию пользователя.
10. Истекли лицензии appid-sig и idp-sig.
root@srx> show system license
License usage:
Licenses Licenses Licenses Expiry
Feature name used installed needed
av_key_kaspersky_engine 1 0 1 28 days
dynamic-vpn 0 2 0 permanent
ax411-wlan-ap 0 2 0 permanent
appid-sig 1 0 1 invalid
— APPID Signature
Все ранее настроенные политики продолждают работать.
Нельзя обновить сигнатуры и верме комита увеличилось секунд на 40.
root@srx# commit
[edit security idp idp-policy Recommended rulebase-ips rule 1 match attacks]
‘predefined-attack-groups «[Recommended]IP — Critical»‘
Security Package is being used, however license is not valid/has expired. This may be in violation of policy.
commit complete
9. Смысл maximum-transactions в настройках вложенных приложений (nested applications).
nested-application my:XAKEP-SSL {
type XAKEP;
protocol SSL;
signature NestedApplication:XAKEP-SSL {
member m01 {
context ssl-server-name;
pattern xakep.ru;
direction client-to-server;
}
maximum-transactions 1;
}
}
maximum-transactions — максимальное количество совпадений с «подписью» при при достижении которого считается, что это именно это приложение.
8. Посмотеть список и детальную информацию по типам приложений с которыми работает AppFW и IDP на srx.
root@srx> show services application-identification application summary
Application(s): 800
Nested Application(s): 981
Applications Disabled ID Order
junos:ZENGUARD-SSL No 1987 33799
junos:FACEBOOK-TIMELINE No 1986 33793
junos:FACEBOOK-STATUS-UPDATE No 1985 33794
junos:GOLFZON-MEMBERS-SSL No 1984 33792
junos:AFREECA-HTTP-STREAM No 1982 33790
….
root@srx> show services application-identification application summary | match HTTP
junos:AFREECA-HTTP-STREAM No 1982 33790
junos:WECHAT-HTTP No 1932 33751
junos:SSH-OVER-HTTP No 1907 33586
junos:YAHOO-FINANCE-HTTP No 1896 33722
junos:AIM-HTTP-API No 1865 33700
junos:ALIWANGWANG-HTTP No 1863 33704
junos:BAIDU-HI-HTTP No 1859 33703
junos:GROOVE-HTTP No 1264 33669
…
root@srx> show services application-identification application detail junos:YAHOO-FINANCE-HTTP
Application Name: junos:YAHOO-FINANCE-HTTP
Application type: YAHOO-FINANCE-HTTP
Description: This signature detects Yahoo! finance, a site from Yahoo! that provides financial news and information.
Application ID: 1896
Disabled: No
Number of Parent Group(s): 1
Application Groups:
junos:web:finance
Application Tags:
characteristic : Bandwidth Consumer
characteristic : Loss of Productivity
risk : 2
subcategory : Finance
category : Web
Signature NestedApplication:YAHOO-FINANCE-HTTP
Layer-7 Protocol: HTTP
Chain Order: no
Maximum Transactions: 1
Order: 33722
Member(s): 1
Member 0
Context: http-header-host
Pattern: (.*.)?finance.yahoo.com
Direction: CTS
7. Посмотреть настройки стантардных junos application
root> show configuration groups junos-defaults applications
6. Посмотреть кто залогинился.
root> show system users no-resolve
5:38PM up 28 days, 2:04, 4 users, load averages: 0.10, 0.06, 0.04
USER TTY FROM LOGIN@ IDLE WHAT
root p0 3:17PM 2:04 cli
root p1 3:03PM 55 cli
root p2 4:21PM 56 cli
root p3 5:31PM — cli
5. Поставить таймаут на ssh/telnet сессию.
root> set cli idle-timeout 60
Idle timeout set to 60 minutes
root> show cli
CLI complete-on-space set to on
CLI idle-timeout set to 60 minutes
CLI restart-on-upgrade set to on
CLI screen-length set to 55
CLI screen-width set to 207
CLI terminal is ‘xterm’
CLI is operating in enhanced mode
CLI timestamp disabled
CLI working directory is ‘/cf/root’
4. Передернуть руками ноду в кластере.
root> request chassis cluster failover redundancy-group [0|1] node [0|1]
Увести RG0 на node1
root> request chassis cluster failover redundancy-group 0 node 1
После этого приоритет node1 для RG0 станет равным 255.
Что бы привести приоритет в соответствие с настройками надо дать комануду:
root> request chassis cluster failover reset redundancy-group 0
После этого, в зависимости от настройки «Preempt», RG0 останется или на node1 или вернется на node0.
3. Сброс конфигурации junos.
[edit]
root# load factory-default
warning: activating factory configuration
[edit]
root# set system root-authentication plain-text-password
New password:
Retype new password:
[edit]
root# commit
commit complete
2. Сброс пароля для root.
— Подключиться консолью к маршрутизатору и включить его.
Дождаться «Hit [Enter] to boot immediately, or space bar for command prompt.»
и нажать пробел. Появится приглашение «loader>».
— Загрузиться в single mode.
loader> boot -s
Kernel entry at 0x801000d8 …
Дождаться «Enter full pathname of shell or ‘recovery’ for root password recovery or RETURN for /bin/sh:» и ввести команду «recovery». Ждем приглашения «root>».
NOTE: Once in the CLI, you will need to enter configuration mode using
NOTE: the ‘configure’ command to make any required changes. For example,
NOTE: to reset the root password, type:
NOTE: configure
NOTE: set system root-authentication plain-text-password
NOTE: (enter the new password when asked)
NOTE: commit
NOTE: exit
NOTE: exit
NOTE: When you exit the CLI, you will be asked if you want to reboot
NOTE: the system
Starting CLI …
root>
— Задаем новый пароль root, применяем конфигурацию и перезагружаемся.
root> configure
Entering configuration mode
root# set system root-authentication plain-text-password
New password:
Retype new password:
[edit]
root# commit
commit complete
[edit]
root# exit
Exiting configuration mode
root> request system reboot
Reboot the system ? [yes,no] (no) yes
Shutdown NOW!
—
Подробное описание процедуры:
http://www.juniper.net/documentation/en_US/junos13.3/topics/task/configuration/authentication-root-password-recovering.html
1. Посмотреть загрузку cpu.
user@srx> show chassis routing-engine
Routing Engine status:
Temperature 57 degrees C / 134 degrees F
Total memory 1024 MB Max 655 MB used ( 64 percent)
Control plane memory 544 MB Max 457 MB used ( 84 percent)
Data plane memory 480 MB Max 202 MB used ( 42 percent)
CPU utilization:
User 4 percent
Background 0 percent
Kernel 10 percent
Interrupt 0 percent
Idle 85 percent
Model
Serial ID
Start time 2015-02-04 19:03:18 GMT-3
Uptime 26 minutes, 6 seconds
Last reboot reason 0x200:normal shutdown
Load averages: 1 minute 5 minute 15 minute
0.07 0.17 0.61
user@srx> show chassis forwarding
FWDD status:
State Online
Microkernel CPU utilization 14 percent
Real-time threads CPU utilization 0 percent
Heap utilization 42 percent
Buffer utilization 1 percent
Uptime: 22 minutes, 39 seconds
- Minimize periodic broadcast traffic (such as routing and SAP updates) by using access lists or by other means. For example, to increase the delay between SAP updates, use the ipx sap-interval interface configuration command.
- Increase the output hold queue size in small increments (for instance, 25 percent), using the hold-queue out interface configuration command.
- On affected interfaces, turn off fast switching for heavily used protocols. For example, to turn off IP fast switching, enter the no ip route-cache interface configuration command. For the command syntax for other protocols, consult the Cisco IOS configuration guides and command references.
- Implement priority queuing on slower serial links by configuring priority lists. For information on configuring priority lists, see the Cisco IOS configuration guides and command references.
Note: Output drops are acceptable under certain conditions. For instance, if a link is known to be overused (with no way to remedy the situation), it is often preferable to drop packets than to hold them. This is true for protocols that support flow control and can retransmit data (such as TCP/IP and Novell IPX). However, some protocols, such as DECnet and local-area transport are sensitive to dropped packets and accommodate retransmission poorly, if at all.
Serial Lines: Increasing Input Drops on Serial Link
Input drops appear in the output of the show interfaces serial EXEC command (see Figure 15-1) when too many packets from that interface are still being processed in the system.
Symptom: An increasing number of input drops on serial link.
Table 15-3: Serial Lines: Increasing Input Drops on Serial Link — This table outlines the possible problem that may cause this symptom and suggests solutions.
Note: Input drop problems are typically seen when traffic is being routed between faster interfaces (such as Ethernet, Token Ring, and FDDI) and serial interfaces. When traffic is light, there is no problem. As traffic rates increase, backups start occurring. Routers drop packets during these congested periods.
- Increase the output queue size on common destination interfaces for the interface that is dropping packets. Use the hold-queue out interface configuration command. Increase these queues by small increments (for instance, 25percent) until you no longer see drops in the show interfaces output. The default output hold queue limit is 100 packets.
- Reduce the input queue size, using the hold-queue in interface configuration command, to force input drops to become output drops. Output drops have less impact on the performance of the router than do input drops. The default input hold queue is 75 packets.
| Possible Problem | Solution |
|---|---|
| Input rate exceeds the capacity of the router or input queues exceed the size of output queues |
Serial Lines: Increasing Input Errors in Excess of One Percent of Total Interface Traffic
If input errors appear in the show interfaces serial output (see Figure 15-1), there are several possible sources of those errors. The most likely sources are summarized in Table 15-4.
Note: Any input error value for cyclic redundancy check (CRC) errors, framing errors, or aborts above one percent of the total interface traffic suggests some kind of link problem that should be isolated and repaired.
Symptom: An increasing number of input errors in excess of one percent of total interface traffic.
Table 15-4: Serial Lines: Increasing Input Errors in Excess of One Percent of Total Interface Traffic
Note: Cisco strongly recommends not using data converters when you are connecting a router to a WAN or serial network.
- Use a serial analyzer to isolate the source of the input errors. If you detect errors, it is likely that there is a hardware problem or a clock mismatch in a device that is external to the router.
- Use the loopback and ping tests to isolate the specific problem source. For more information, see sections «Using the trace Command» and «CSU and DSU Loopback Tests,» later in this chapter.
- Look for patterns. For example, if errors occur at a consistent interval, they could be related to a periodic function such as the sending of routing updates.
| Possible Problem | Solution |
|---|---|
The following problems can result in this symptom:
|
Serial Lines: Troubleshooting Serial Line Input Errors
Table 15-5: This table describes the various types of input errors displayed by the show interfaces serial command (see Figure 15-1), possible problems that may be causing the errors and the solutions to those problems.
| Input Error Type (Field Name) | Possible Problem | Solution |
|---|---|---|
| CRC errors (CRC) | CRC errors occur when the CRC calculation does not pass-indicating that data is corrupted-for one of the following reasons:
|
|
| Framing errors (frame) | A framing error occurs when a packet does not end on an 8-bit byte boundary for one of the following reasons:
|
|
| Aborted transmission (abort) | Aborts indicate an illegal sequence of one bits (more than seven in a row). The following are possible reasons for this occurrence:
|
|
Serial Lines: Increasing Interface Resets on Serial Link
Interface resets that appear in the output of the show interfaces serial EXEC command (see Figure 15-1) are the result of missed keep-alive packets.
Symptom: An increasing number of interface resets on serial link.
Table 15-6: This table outlines the possible problems that may cause this symptom and suggests solutions.
| Possible Problem | Solution |
|---|---|
The following problems can result in this symptom:
|
When interface resets are occurring, examine other fields of the show interfaces serial command output to determine the source of the problem. Assuming that an increase in interface resets is being recorded, examine the following fields:
|
Serial Lines: Increasing Carrier Transitions Count on Serial Link
Carrier transitions appear in the output of the show interfaces serial EXEC command whenever there is an interruption in the carrier signal (such as an interface reset at the remote end of a link).
Symptom: An increasing number of carrier transitions count on serial link.
Table 15-7 outlines the possible problems that may cause this symptom and suggests solutions.
Table 15-7: Serial Lines: Increasing Carrier Transitions Count on Serial Link
| Possible Problem | Solution |
|---|---|
The following problems can result in this symptom:
|
|
Using the show controllers Command
The show controllers EXEC command is another important diagnostic tool when troubleshooting serial lines. The command syntax varies depending on the platform:
For serial interfaces on Cisco 7000 series routers, use the show controllers cbus EXEC command.
For Cisco access products, use the show controllers EXEC command.
For the AGS, CGS, and MGS, use the show controllers mci EXEC command.
Figure 15-2 shows the output from the show controllers cbus EXEC command. This command is used on Cisco 7000 series routers with the Fast Serial Interface Processor (FSIP) card. Check the command output to make certain that the cable to the channel service unit/digital service unit (CSU/DSU) is attached to the proper interface. You can also check the microcode version to see if it is current.
Figure 15-2: show controllers cbus Command Output
On access products such as the Cisco 2000, Cisco 2500, Cisco 3000, and Cisco 4000 series access servers and routers, use the show controllers EXEC command. Figure 15-3 shows the show controllers command output from the Basic Rate Interface (BRI) and serial interfaces on a Cisco 2503 access server. (Note that some output is not shown.)
The show controllers output indicates the state of the interface channels and whether a cable is attached to the interface. In Figure 15-3, serial interface 0 has an RS-232 DTE cable attached. Serial interface 1 has no cable attached.
Figure 15-4 shows the output of the show controllers mci command. This command is used on AGS, CGS, and MGS routers only. If the electrical interface is displayed as UNKNOWN (instead of V.35, EIA/TIA-449, or some other electrical interface type), an improperly connected cable is the likely problem. A bad applique or a problem with the internal wiring of the card is also possible. If the electrical interface is unknown, the corresponding display for the show interfaces serial EXEC command will show that the interface and line protocol are down.
Figure 15-3: show controllers Command Output
Figure 15-4: show controllers mci Command Output
Using debug Commands
The output of the various debug privileged EXEC commands provides diagnostic information relating to protocol status and network activity for many internetworking events.
 Caution: Because debugging output is assigned a high priority in the CPU process, it can render the system unusable. For this reason, use debug commands only to troubleshoot specific problems or during troubleshooting sessions with Cisco technical support staff. Moreover, it is best to use debug commands during periods of low network traffic and fewer users. Debugging during these periods decreases the likelihood that increased debug command processing overhead will affect system use. When you finish using a debug command, remember to disable it with its specific no debug command or with the no debug all command.
The following debug commands are useful when troubleshooting serial and WAN problems. More information about the function and output of each of these commands is provided in the Debug Command Reference publication:
debug serial interface— Verifies whether HDLC keepalive packets are incrementing. If they are not, a possible timing problem exists on the interface card or in the network.
debug x25 events— Detects X.25 events, such as the opening and closing of switched virtual circuits (SVCs). The resulting «cause and diagnostic» information is included with the event report.
debug lapb— Outputs Link Access Procedure, Balanced (LAPB) or Level 2 X.25 information.
debug arp— Indicates whether the router is sending information about or learning about routers (with ARP packets) on the other side of the WAN cloud. Use this command when some nodes on a TCP/IP network are responding but others are not.
debug frame-relay lmi— Obtains Local Management Interface (LMI) information useful for determining if a Frame Relay switch and a router are sending and receiving LMI packets.
debug frame-relay events— Determines if exchanges are occurring between a router and a Frame Relay switch.
debug ppp negotiation— Shows Point-to-Point Protocol (PPP) packets transmitted during PPP startup, where PPP options are negotiated.
debug ppp packet— Shows PPP packets being sent and received. This command displays low-level packet dumps.
debug ppp errors— Shows PPP errors (such as illegal or malformed frames) associated with PPP connection negotiation and operation.
debug ppp chap— Shows PPP Challenge Handshake Authentication Protocol (CHAP) and Password Authentication Protocol (PAP) packet exchanges.
debug serial packet— Shows Switched Multimegabit Data Service (SMDS) packets being sent and received. This display also prints error messages to indicate why a packet was not sent or was received erroneously. For SMDS, the command dumps the entire SMDS header and some payload data when an SMDS packet is transmitted or received.
Using Extended ping Tests
The ping command is a useful test available on Cisco internetworking devices as well as on many host systems. In TCP/IP, this diagnostic tool is also known as an Internet Control Message Protocol (ICMP) Echo Request.
Note: The ping command is particularly useful when high levels of input errors are being registered in the show interfaces serial display. See Figure 15-1.
Cisco internetworking devices provide a mechanism to automate the sending of many ping packets in sequence. Figure 15-5 illustrates the menu used to specify extended ping options. This example specifies 20 successive pings. However, when testing the components on your serial line, you should specify a much larger number, such as 1000 pings.
Figure 15-5: Extended ping Specification Menu
Performing Ping Tests
In general, perform serial line ping tests as follows:
Put the CSU or DSU into local loopback mode.
Configure the extended ping command to send different data patterns and packet sizes. Figure 15-6 and Figure 15-7 illustrate two useful ping tests, an all-zeros (1500-byte) ping and an all-ones (1500-byte) ping, respectively.
Examine the show interfaces serial command output (see Figure 15-1) and determine whether input errors have increased. If input errors have not increased, the local hardware (DSU, cable, router interface card) is probably in good condition.
Assuming that this test sequence was prompted by the appearance of a large number of CRC and framing errors, a clocking problem is likely. Check the CSU or DSU for a timing problem. See the section «Troubleshooting Clocking Problems,» later in this chapter.
If you determine that the clocking configuration is correct and is operating properly, put the CSU or DSU into remote loopback mode.
Repeat the ping test and look for changes in the input error statistics.
If input errors increase, there is either a problem in the serial line or on the CSU/DSU. Contact the WAN service provider and swap the CSU or DSU. If problems persist, contact your technical support representative.
Figure 15-6: ALl-Zeros 1500-Byte ping Test
Figure 15-7 All-Ones 1500-Byte ping Test
Troubleshooting Clocking Problems
Clocking conflicts in serial connections can lead either to chronic loss of connection service or to degraded performance. This section discusses the important aspects of clocking problems: clocking problem causes, detecting clocking problems, isolating clocking problems, and clocking problem solutions.
Clocking Overview
The CSU/DSU derives the data clock from the data that passes through it. In order to recover the clock, the CSU/DSU hardware must receive at least one 1-bit value for every 8 bits of data that pass through it; this is known as ones density. Maintaining ones density allows the hardware to recover the data clock reliably.
Newer T1 implementations commonly use Extended Superframe Format (ESF) framing with binary eight-zero substitution (B8ZS) coding. B8ZS provides a scheme by which a special code is substituted whenever eight consecutive zeros are sent through the serial link. This code is then interpreted at the remote end of the connection. This technique guarantees ones density independent of the data stream.
Older T1 implementations use D4-also known as Superframe Format (SF) framing and Alternate Mark Inversion (AMI) coding. AMI does not utilize a coding scheme like B8ZS. This restricts the type of data that can be transmitted because ones density is not maintained independent of the data stream.
Another important element in serial communications is serial clock transmit external (SCTE) terminal timing. SCTE is the clock echoed back from the data terminal equipment (DTE) device (for example, a router) to the data communications equipment (DCE) device (for example, the CSU/DSU).
When the DCE device uses SCTE instead of its internal clock to sample data from the DTE, it is better able to sample the data without error even if there is a phase shift in the cable between the CSU/DSU and the router. Using SCTE is highly recommended for serial transmissions faster than 64 kbps. If your CSU/DSU does not support SCTE, see the section «Inverting the Transmit Clock,» later in this chapter.
Clocking Problem Causes
In general, clocking problems in serial WAN interconnections can be attributed to one of the following causes:
Incorrect DSU configuration
Incorrect CSU configuration
Cables out of specification-that is, longer than 50 feet (15.24 meters) or unshielded
Noisy or poor patch panel connections
Several cables connected together in a row
Detecting Clocking Problems
To detect clocking conflicts on a serial interface, look for input errors as follows:
Use the show interfaces serial EXEC command on the routers at both ends of the link.
Examine the command output for CRC, framing errors, and aborts.
If either of these steps indicates errors exceeding an approximate range of 0.5 percent 2.0 percent of traffic on the interface, clocking problems are likely to exist somewhere in the WAN.
Isolate the source of the clocking conflicts as outlined in the following section, «Isolating Clocking Problems.»
Bypass or repair any faulty patch panels.
Isolating Clocking Problems
After you determine that clocking conflicts are the most likely cause of input errors, the following procedure will help you isolate the source of those errors:
Perform a series of ping tests and loopback tests (both local and remote), as described in the section «CSU and DSU Loopback Tests,» earlier in this chapter.
Determine the end of the connection that is the source of the problem, or if the problem is in the line. In local loopback mode, run different patterns and sizes in the ping tests (for example, use 1500-byte datagrams). Using a single pattern and packet size may not force errors to materialize, particularly when a serial cable to the router or CSU/DSU is the problem.
Use the show interfaces serial EXEC command and determine if input errors counts are increasing and where they are accumulating.
If input errors are accumulating on both ends of the connection, clocking of the CSU is the most likely problem.
If only one end is experiencing input errors, there is probably a DSU clocking or cabling problem.
Aborts on one end suggests that the other end is sending bad information or that there is a line problem.
Note: Always refer to the show interfaces serial command output (see Figure 15-1) and log any changes in error counts or note if the error count does not change.
Clocking Problem Solutions
Table 15-8 Serial Lines: Clocking Problems and Solutions: This table outlines suggested remedies for clocking problems, based on the source of the problem.
| Possible Problem | Solution |
|---|---|
| Incorrect CSU configuration |
|
| Incorrect DSU configuration |
|
| Cable to router is out of specification | If the cable is longer than 50 feet (15.24 meters), use a shorter cable. If the cable is unshielded, replace it with shielded cable. |
Inverting the Transmit Clock
If you are attempting serial connections at speeds greater than 64 kbps with a CSU/DSU that does not support SCTE, you may have to invert the transmit clock on the router. Inverting the transmit clock compensates for phase shifts between the data and clock signals.
The specific command used to invert the transmit clock varies between platforms. On a Cisco 7000 series router, enter the invert-transmit-clock interface configuration command. For Cisco 4000 series routers, use the dte-invert-txc interface configuration command.
To ensure that you are using the correct command syntax for your router, refer to the user guide for your router or access server and to the Cisco IOS configuration guides and command references.
Note: On older platforms, inverting the transmit clock may require that you move a physical jumper.
Adjusting Buffers
Excessively high bandwidth utilization (over 70percent) results in reduced overall performance and can cause intermittent failures. For example, DECnet file transmissions may be failing due to packets being dropped somewhere in the network.
If the situation is bad enough, you must increase the bandwidth of the link. However, increasing the bandwidth may not be necessary or immediately practical. One way to resolve marginal serial line overutilization problems is to control how the router uses data buffers.
Caution: In general, do not adjust system buffers unless you are working closely with a Cisco technical support representative. You can severely affect the performance of your hardware and your network if you incorrectly adjust the system buffers on your router.
Use one of the following three options to control how buffers are used:
Adjust parameters associated with system buffers
Specify the number of packets held in input or output queues (hold queues)
Prioritize how traffic is queued for transmission (priority output queuing)
The configuration commands associated with these options are described in the Cisco IOS configuration guides and command references.
The following section focuses on identifying situations in which these options are likely to apply and defining how you can use these options to help resolve connectivity and performance problems in serial/WAN interconnections.
Tuning System Buffers
There are two general buffer types on Cisco routers: hardware buffers and system buffers. Only the system buffers are directly configurable by system administrators. The hardware buffers are specifically used as the receive and transmit buffers associated with each interface and (in the absence of any special configuration) are dynamically managed by the system software itself.
The system buffers are associated with the main system memory and are allocated to different-size memory blocks. A useful command for determining the status of your system buffers is the show buffers EXEC command. Figure 15-8 shows the output from the show buffers command.
Figure 15-8 show buffers Command Output
In the show buffers output:
total— Identifies the total number of buffers in the pool, including used and unused buffers.
permanent— Identifies the permanent number of allocated buffers in the pool. These buffers are always in the pool and cannot be trimmed away.
in free list— Identifies the number of buffers currently in the pool that are available for use.
min— Identifies the minimum number of buffers that the Route Processor (RP) should attempt to keep in the free list:
The min parameter is used to anticipate demand for buffers from the pool at any given time.
If the number of buffers in the free list falls below the min value, the RP attempts to create more buffers for that pool.
max allowed— Identifies the maximum number of buffers allowed in the free list:
The max allowed parameter prevents a pool from monopolizing buffers that it doesn’t need anymore and frees this memory back to the system for further use.
If the number of buffers in the free list is greater than the max allowed value, the RP should attempt to trim buffers from the pool.
hits— Identifies the number of buffers that have been requested from the pool. The hits counter provides a mechanism for determining which pool must meet the highest demand for buffers.
misses— Identifies the number of times a buffer has been requested and the RP detected that additional buffers were required. (In other words, the number of buffers in the free list has dropped below min.) The misses counter represents the number of times the RP has been forced to create additional buffers.
trims— Identifies the number of buffers that the RP has trimmed from the pool when the number of buffers in the free list exceeded the number of max allowed buffers.
created— Identifies the number of buffers that have been created in the pool. The RP creates buffers when demand for buffers has increased until the number of buffers in the free list is less than min buffers and/or a miss occurs because of zero buffers in the free list.
failures— Identifies the number of failures to grant a buffer to a requester even after attempting to create an additional buffer. The number of failures represents the number of packets that have been dropped due to buffer shortage.
no memory— Identifies the number of failures caused by insufficient memory to create additional buffers.
The show buffers command output in Figure 15-8 indicates high numbers in the trims and created fields for large buffers. If you are receiving high numbers in these fields, you can increase your serial link performance by increasing the max free value configured for your system buffers. trims identifies the number of buffers that the RP has trimmed from the pool when the number of buffers in free list exceeded the number of max allowed buffers.
Use the buffers max free number global configuration command to increase the number of free system buffers. The value you configure should be approximately 150 percent of the figure indicated in the total field of the show buffers command output. Repeat this process until the show buffers output no longer indicates trims and created buffers.
If the show buffers command output shows a large number of failures in the (no memory) field (see the last line of output in Figure 15-8), you must reduce the usage of the system buffers or increase the amount of shared or main memory (physical RAM) on the router. Call your technical support representative for assistance.
Implementing Hold Queue Limits
Hold queues are buffers used by each router interface to store outgoing or incoming packets. Use the hold-queue interface configuration command to increase the number of data packets queued before the router will drop packets. Increase these queues by small increments (for instance, 25 percent) until you no longer see drops in the show interfaces output. The default output hold queue limit is 100 packets.
Note: The hold-queue command is used for process-switched packets and periodic updates generated by the router.
Use the hold-queue command to prevent packets from being dropped and to improve serial-link performance under the following conditions:
You have an application that cannot tolerate drops and the protocol is able to tolerate longer delays. DECnet is an example of a protocol that meets both criteria. Local-area transport (LAT) does not because it does not tolerate delays.
The interface is very slow. Bandwidth is low or anticipated utilization is likely to sporadically exceed available bandwidth.
Note: When you increase the number specified for an output hold queue, you may need to increase the number of system buffers. The value used depends on the size of the packets associated with the traffic anticipated for the network.
Using Priority Queuing to Reduce Bottlenecks
Priority queuing is a list-based control mechanism that allows traffic to be prioritized on an interface-by-interface basis. Priority queuing involves two steps:
Create a priority list by protocol type and level of priority.
Assign the priority list to a specific interface.
Both of these steps use versions of the priority-list global configuration command. In addition, further traffic control can be applied by referencing access-list global configuration commands from priority-list specifications. For examples of defining priority lists and for details about command syntax associated with priority queuing, refer to the Cisco IOS configuration guides and command references.
Note: Priority queuing automatically creates four hold queues of varying size. This overrides any hold queue specification included in your configuration.
Use priority queuing to prevent packets from being dropped and to improve serial link performance under the following conditions:
When the interface is slow, there is a variety of traffic types being transmitted, and you want to improve terminal traffic performance.
If you have a serial link that is intermittently experiencing very heavy loads (such as file transfers occurring at specific times) priority queuing will help select which types of traffic should be discarded at high traffic periods.
In general, start with the default number of queues when implementing priority queues. After enabling priority queuing, monitor output drops with the show interfaces serial EXEC command. If you notice that output drops are occurring in the traffic queue you have specified to be high priority, increase the number of packets that can be queued (using the queue-limit keyword option of the priority-list global configuration command). The default queue-limit arguments are 20 packets for the high-priority queue, 40 for medium, 60 for normal, and 80 for low.
Note: When bridging Digital Equipment Corporation (DEC) LAT traffic, the router must drop very few packets, or LAT sessions can terminate unexpectedly. A high-priority queue depth of about 100 (specified with the queue-limit keyword) is a typical working value when your router is dropping output packets and the serial lines are subjected to about 50 percent bandwidth utilization. If the router is dropping packets and is at 100 percent utilization, you need another line.
Another tool to relieve congestion when bridging DEC LAT is LAT compression. You can implement LAT compression with the interface configuration command bridge-group group lat-compression.
Special Serial Line Tests
In addition to the basic diagnostic capabilities available on routers, a variety of supplemental tools and techniques can be used to determine the conditions of cables, switching equipment, modems, hosts, and remote internetworking hardware. For more information, consult the documentation for your CSU, DSU, serial analyzer, or other equipment.
CSU and DSU Loopback Tests
If the output of the show interfaces serial EXEC command indicates that the serial line is up but the line protocol is down, use the CSU/DSU loopback tests to determine the source of the problem. Perform the local loop test first, and then the remote test. Figure 15-9 illustrates the basic topology of the CSU/DSU local and remote loopback tests.
Figure 15-9: CSU/DSU Local and Remote Loopback Tests
Note: These tests are generic in nature and assume attachment of the internetworking system to a CSU or DSU. However, the tests are essentially the same for attachment to a multiplexer with built-in CSU/DSU functionality. Because there is no concept of a loopback in X.25 or Frame Relay packet-switched network (PSN) environments, loopback tests do not apply to X.25 and Frame Relay networks.
CSU and DSU Local Loopback Tests for HDLC or PPP Links
Listed below is a general procedure for performing loopback tests in conjunction with built-in system diagnostic capabilities:
Place the CSU/DSU in local loop mode (refer to your vendor documentation). In local loop mode, the use of the line clock (from the T1 service) is terminated, and the DSU is forced to use the local clock.
Use the show interfaces serial EXEC command to determine if the line status changes from «line protocol is down» to «line protocol is up (looped),» or if it remains down.
If the line protocol comes up when the CSU or DSU is in local loopback mode, this suggests that the problem is occurring on the remote end of the serial connection. If the status line does not change state, there is a possible problem in the router, connecting cable, or CSU/DSU.
If the problem appears to be local, use the debug serial interface privileged EXEC command.
Take the CSU/DSU out of local loop mode. When the line protocol is down, the debug serial interface command output will indicate that keepalive counters are not incrementing.
Place the CSU/DSU in local loop mode again. This should cause the keepalive packets to begin to increment. Specifically, the values for mineseen and yourseen keepalives will increment every 10 seconds. This information will appear in the debug serial interface output.
If the keepalives do not increment, there may be a timing problem on the interface card or on the network. For information on correcting timing problems, see the section «Troubleshooting Clocking Problems,» earlier in this chapter.
If the keepalives do not increment, there may be a timing problem on the interface card or on the network. For information on correcting timing problems, see the section «Troubleshooting Clocking Problems,» earlier in this chapter.
Check the local router, CSU/DSU hardware, and any attached cables. Make certain that the cables are within the recommended lengths-no more than 50 feet (15.24 meters) or 25 feet (7.62 meters) for a T1 link. Make certain the cables are attached to the proper ports. Swap faulty equipment as necessary.
Figure 15-10 shows the output from the debug serial interface command for an HDLC serial connection, with missed keepalives causing the line to go down and the interface to reset.
Figure 15-10: debug serial interface Command Output
CSU and DSU Remote Loopback Tests for HDLC or PPP Links
If you determine that the local hardware is functioning properly but you still encounter problems when attempting to establish connections over the serial link, try using the remote loopback test to isolate the problem cause.
Note: This remote loopback test assumes that HDLC encapsulation is being used and that the preceding local loop test was performed immediately before this test.
The following steps are required to perform loopback testing:The following steps are required to perform loopback testing:
Put the remote CSU or DSU into remote loopback mode (refer to the vendor documentation).
Using the show interfaces serial EXEC command, determine if the line protocol remains up with the status line indicating «Serial x is up, line protocol is up (looped),» or if it goes down with the status line indicating «line protocol is down.»
If the line protocol remains up (looped), the problem is probably at the remote end of the serial connection (between the remote CSU/DSU and the remote router). Perform both local and remote tests at the remote end to isolate the problem source.
If the line status changes to «line protocol is down» when remote loopback mode is activated, make sure that ones density is being properly maintained. The CSU/DSU must be configured to use the same framing and coding schemes used by the leased-line or other carrier service (for example, ESF and B8ZS).
If problems persist, contact your WAN network manager or the WAN service organization.
Detailed Information on the show interfaces serial Command
The following sub-sections cover the show interfaces serial command’s parameters, syntax description, sample output display, and field descriptions.
show interfaces serial Parameters
To display information about a serial interface, use the show interfaces serial privileged EXEC command:
Syntax Description
number-Optional. Port number.
accounting-Optional. Displays the number of packets of each protocol type that have been sent through the interface.
:channel-group -Optional. On the Cisco 4000 series with an NPM or a Cisco 7500 series with a MIP, specifies the T1 channel-group number in the range of 0 to 23, defined with the channel-group controller configuration command.
slot -Refers to the appropriate hardware manual for slot information.
port -Refers to the appropriate hardware manual for port information.
port-adapter -Refers to the appropriate hardware manual for information about port adapter compatibility.
:t1-channel -Optional. For the CT3IP, the T1 channel is a number between 1 and 28.
T1 channels on the CT3IP are numbered 1 to 28 rather than the more traditional zero-based scheme (0 to 27) used with other Cisco products. This is to ensure consistency with Telco numbering schemes for T1 channels within channelized T3 equipment.
crb-Optional. Shows interface routing and bridging information.
Command Mode
Usage Guidelines
This command first appeared in Cisco IOS Release 10.0 for the Cisco 4000 series. It first appeared in Cisco IOS Release 11.0 for the Cisco 7000 series, and it was modified in Cisco IOS Release 11.3 to include the CT3IP.
Sample Displays
The following is sample output from the show interfaces command for a synchronous serial interface:
Field Description
Table 15-9: show interfaces serial Field Descriptions — this table describes significant fields shown in the output.
| Field | Description |
|---|---|
| Serial. is . is administratively down | Indicates whether the interface hardware is currently active (carrier detect is present) or whether it has been taken down by an administrator. |
| line protocol is | Indicates whether the software processes that handle the line protocol consider the line usable (that is, keepalives are successful) or whether it has been taken down by an administrator. |
| line protocol is | Indicates whether the software processes that handle the line protocol consider the line usable (that is, keepalives are successful) or whether it has been taken down by an administrator. |
| Hardware is | Specifies the hardware type. |
| Internet address is | Specifies the internet address and subnet mask. |
| MTU | Maximum transmission unit of the interface. |
| BW | Indicates the value of the bandwidth parameter that has been configured for the interface (in kilobits per second). The bandwidth parameter is used to compute IGRP metrics only. If the interface is attached to a serial line with a line speed that does not match the default (1536 or 1544 for T1 and 56 for a standard synchronous serial line), use the bandwidth command to specify the correct line speed for this serial line. |
| DLY | Delay of the interface in microseconds. |
| rely | Reliability of the interface as a fraction of 255 (255/255 is 100 percent reliability), calculated as an exponential average over five minutes. |
| load | Reliability of the interface as a fraction of 255 (255/255 is 100 percent reliability), calculated as an exponential average over five minutes. |
| Encapsulation | Encapsulation method assigned to the interface. |
| loopback | Indicates whether loopback is set. |
| keepalive | Indicates whether keepalives are set. |
| Last input | Number of hours, minutes, and seconds since the last packet was successfully received by an interface. Useful for knowing when a dead interface failed. |
| Last output | Number of hours, minutes, and seconds since the last packet was successfully transmitted by an interface.Number of hours, minutes, and seconds since the last packet was successfully transmitted by an interface. |
| output hang | Number of hours, minutes, and seconds (or never) since the interface was last reset because of a transmission that took too long. When the number of hours in any of the last fields exceeds 24, the number of days and hours is printed. If that field overflows, asterisks are printed. |
| Output queue, drops input queue, drops | Number of packets in output and input queues. Each number is followed by a slash, the maximum size of the queue, and the number of packets because the queue is full. |
| 5 minute input rate 5 minute output rate | Average number of bits and packets transmitted per second in the past five minutes. The five-minute input and output rates should be used only as an approximation of traffic per second during a given five-minute period. These rates are exponentially weighted averages with a time constant of five minutes. A period of four time constants must pass before the average will be within 2 percent of the instantaneous rate of a uniform stream of traffic over that period. |
| packets input | Total number of error-free packets received by the system. |
| bytes | Total number of bytes, including data and MAC encapsulation, in the error-free packets received by the system. |
| no buffer | Number of received packets discarded because there was no buffer space in the main system. Compare with ignored count. Broadcast storms on Ethernet networks and bursts of noise on serial lines are often responsible for no input buffer events. |
| Received. broadcasts | Total number of broadcast or multicast packets received by the interface. |
| runts | Number of packets that are discarded because they are smaller than the medium’s minimum packet size. |
| giants | Number of packets that are discarded because they exceed the medium’s maximum packet size. |
| input errors | Total number of no buffer, runts, giants, CRCs, frame, overrun, ignored, and abort counts. Other input-related errors can also increment the count, so this sum may not balance with the other counts. |
| CRC | Cyclic redundancy check generated by the originating station or far-end device does not match the checksum calculated from the data received. On a serial link, CRCs usually indicate noise, gain hits, or other transmission problems on the data link. |
| frame | Number of packets received incorrectly having a CRC error and a noninteger number of octets. On a serial line, this is usually the result of noise or other transmission problems. |
| overrun | Number of times the serial receiver hardware was unable to hand received data to a hardware buffer because the input rate exceeded the receiver’s ability to handle the data. |
| ignored | Number of received packets ignored by the interface because the interface hardware ran low on internal buffers. Broadcast storms and bursts of noise can cause the ignored count to be increased. |
| abort | Illegal sequence of one bits on a serial interface. This usually indicates a clocking problem between the serial interface and the data link equipment. |
| carrier transitions | Number of times the carrier detect signal of a serial interface has changed state. For example, if data carrier detect (DCD) goes down and comes up, the carrier transition counter will increment two times. Indicates modem or line problems if the carrier detect line is changing state often. |
| packets output | Total number of messages transmitted by the system. |
| bytes output | Total number of bytes, including data and MAC encapsulation, transmitted by the system. |
| underruns | Number of times that the transmitter has been running faster than the router can handle. This may never be reported on some interfaces. |
| output errors | Sum of all errors that prevented the final transmission of datagrams out of the interface being examined. Note that this may not balance with the sum of the enumerated output errors because some datagrams can have more than one error, and others can have errors that do not fall into any of the specifically tabulated categories. |
| collisions | Number of messages retransmitted due to an Ethernet collision. This usually is the result of an overextended LAN (that is, Ethernet or transceiver cable too long, more than two repeaters between stations, or too many cascaded multiport transceivers). Some collisions are normal. However, if your collision rate climbs to around 4 percent or 5 percent, you should consider verifying that there is no faulty equipment on the segment and/or moving some existing stations to a new segment. A packet that collides is counted only once in output packets. |
| interface resets | Number of times an interface has been completely reset. This can happen if packets queued for transmission were not sent within several seconds’ time. On a serial line, this can be caused by a malfunctioning modem that is not supplying the transmit clock signal, or by a cable problem. If the system notices that the carrier detect line of a serial interface is up but the line protocol is down, it periodically resets the interface in an effort to restart it. Interface resets can also occur when an interface is looped back or shut down. |
| restarts | Number of times the controller was restarted because of errors. |
| alarm indications, remote alarms, rx LOF, rx LOS | Number of CSU/DSU alarms, and number of occurrences of receive loss of frame and receive loss of signal. |
| BER inactive, NELR inactive, FELR inactive | Status of G.703-E1 counters for bit error rate (BER) alarm, near-end loop remote (NELR), and far-end loop remote (FELR). Note that you cannot set the NELR or FELR. |
Troubleshooting T1
This section describes the techniques and procedures for troubleshooting T1 circuits for dial-in customers.
Troubleshooting Using the show controller t1 Command
This command displays the controller status that is specific to the controller hardware. The information displayed is generally useful for diagnostic tasks performed by technical support personnel only.
The NMP (Network Management Processor) or MIP (MultiChannel Interface Processor) can query the port adapters to determine their current status. Issue a show controller t1 command to display statistics about the T1 link.
If you specify a slot and port number, statistics for each 15-minute period will be displayed. The show controller t1 EXEC command provides information to logically troubleshoot physical layer and data link layer problems. This section describes how to logically troubleshoot using the show controller t1 command.
Most T1 errors are caused by misconfigured lines. Ensure that linecoding, framing and clock source are configured according to what the service provider recommends.
show controller t1 Conditions
The T1 controller can be in one of the following three states.
Источник
Adblock
detector
Network Management and Monitoring Feature Guide for EX9200 Switches
show interfaces extensive (10-Gigabit Ethernet, DWDM OTN PIC)
140
Destination slot: 1
CoS information:
CoS transmit queue
0 best-effort
3 network-control
user@host> show interfaces ge-7/0/0 extensive
Physical interface: ge-7/0/0, Enabled, Physical link is Down
Interface index: 143, SNMP ifIndex: 508, Generation: 208
Link-level type: Ethernet, MTU: 1514, Speed: 10Gbps, BPDU Error: None,
MAC-REWRITE Error: None, Loopback: Disabled, Source filtering: Disabled,
Flow control: Enabled
Device flags
: Present Running Down
Interface flags: Hardware-Down SNMP-Traps Internal: 0x4000
Link flags
: None
Wavelength
: 1550.12 nm, Frequency: 193.40 THz
CoS queues
: 8 supported, 8 maximum usable queues
Hold-times
: Up 0 ms, Down 0 ms
Current address: 00:00:5e:00:53:72, Hardware address: 00:00:5e:00:53:72
Last flapped
: 2011-04-20 15:48:54 PDT (18:39:49 ago)
Statistics last cleared: Never
Traffic statistics:
Input
bytes
:
Output bytes
:
Input
packets:
Output packets:
IPv6 transit statistics:
Input
bytes
:
Output bytes
:
Input
packets:
Output packets:
Input errors:
Errors: 0, Drops: 0, Framing errors: 0, Runts: 0, Policed discards: 0,
L3 incompletes: 0, L2 channel errors: 0, L2 mismatch timeouts: 0,
FIFO errors: 0, Resource errors: 0
Output errors:
Carrier transitions: 2, Errors: 0, Drops: 0, Collisions: 0, Aged packets: 0,
FIFO errors: 0, HS link CRC errors: 0, MTU errors: 0, Resource errors: 0
Egress queues: 8 supported, 4 in use
Queue counters:
0 best-effort
1 expedited-fo
2 assured-forw
3 network-cont
Queue number:
0
1
2
3
Active alarms
: LINK
Active defects : LINK
MAC statistics:
Total octets
Total packets
Bandwidth
%
bps
%
95
950000000
95
5
50000000
5
0
0
0
0
0
0
0
0
Queued packets
Transmitted packets
0
0
0
Mapped forwarding classes
best-effort
expedited-forwarding
assured-forwarding
network-control
Receive
0
0
Buffer
Priority
bytes
0
low
0
low
0 bps
0 bps
0 pps
Dropped packets
0
0
0
Transmit
0
0
Copyright © 2016, Juniper Networks, Inc.
Limit
none
none
0
0
0
Contents
Introduction
This chapter presents general troubleshooting information and a discussion of tools and techniques for troubleshooting serial connections. The chapter consists of the following sections:
-
Troubleshooting Using the show interfaces serial Command
-
Using the show controllers Command
-
Using debug Commands
-
Using Extended ping Tests
-
Troubleshooting Clocking Problems
-
Adjusting Buffers
-
Special Serial Line Tests
-
Detailed Information on the show interfaces serial Command
-
Troubleshooting T1 Problems
-
Troubleshooting E1 Problems
Prerequisites
Requirements
Readers of this document should be knowledgeable of the following definitions.
-
DTE = data terminal equipment
-
CD = Carrier Detect
-
CSU = channel service unit
-
DSU = digital service unit
-
SCTE = serial clock transmit external
-
DCE = data circuit-terminating equipment
-
CTS = clear-to-send
-
DSR = data-set ready
-
SAP = Service Advertising Protocol
-
IPX = Internetwork Packet Exchange
-
FDDI = Fiber Distributed Data Interface
-
ESF = Extended Superframe Format
-
B8ZS = binary eight-zero substitution
-
LBO = Line Build Out
Components Used
This document is not restricted to specific software and hardware versions.
The information presented in this document was created from devices in a specific lab environment. All of the devices used in this document started with a cleared (default) configuration. If you are working in a live network, ensure that you understand the potential impact of any command before using it.
Conventions
For more information on document conventions, see the Cisco Technical Tips Conventions.
Troubleshooting Using the show interfaces serial Command
The output of the show interfaces serial EXEC command displays information specific to serial interfaces. Figure 15-1 shows the output of the show interfaces serial EXEC command for a High-Level Data Link Control (HDLC) serial interface.
This section describes how to use the show interfaces serial command to diagnose serial line connectivity problems in a wide area network (WAN) environment. The following sections describe some of the important fields of the command output.
Other fields shown in the display are described in detail in the section «Detailed Information on the show interfaces serial Command,» later in this chapter.
Serial Lines: show interfaces serial Status Line Conditions
You can identify five possible problem states in the interface status line of the show interfaces serial display (see Figure 15-1):
-
Serial x is down, line protocol is down
-
Serial x is up, line protocol is down
-
Serial x is up, line protocol is up (looped)
-
Serial x is up, line protocol is down (disabled)
-
Serial x is administratively down, line protocol is down
Figure 15-1 Output of the HDLC show interface serial Command
Table 15-1: Serial Lines: show interfaces serial Status Line Conditions — This table shows the interface status conditions, possible problems associated with the conditions, and solutions to those problems.
| Status Line Condition | Possible Problem | Solution |
|---|---|---|
| Serial x is up, line protocol is up | This is the proper status line condition. No action required. | |
| Serial x is down, line protocol is down (DTE mode) |
|
|
| Serial x is up, line protocol is down (DTE mode) |
|
|
| Serial x is up, line protocol is down (DCE mode) |
|
|
| Serial x is up, line protocol is up (looped) | A loop exists in the circuit. The sequence number in the keepalive packet changes to a random number when a loop is initially detected. If the same random number is returned over the link, a loop exists. |
|
| Serial x is up, line protocol is down (disabled) |
|
|
| Serial x is administratively down, line protocol is down |
|
|
Serial Lines: Increasing Output Drops on Serial Link
Output drops appear in the output of the show interfaces serial command (see Figure 15-1) when the system is attempting to hand off a packet to a transmit buffer but no buffers are available.
Symptom: An increasing number of output drops on serial link.
Table 15-2 Serial Lines: Increasing Output Drops on Serial Link — This table outlines the possible problem that may cause this symptom and suggests solutions.
| Possible Problem | Solution |
|---|---|
| Input rate to serial interface exceeds bandwidth available on serial link |
Note: Output drops are acceptable under certain conditions. For instance, if a link is known to be overused (with no way to remedy the situation), it is often preferable to drop packets than to hold them. This is true for protocols that support flow control and can retransmit data (such as TCP/IP and Novell IPX). However, some protocols, such as DECnet and local-area transport are sensitive to dropped packets and accommodate retransmission poorly, if at all. |
Serial Lines: Increasing Input Drops on Serial Link
Input drops appear in the output of the show interfaces serial EXEC command (see Figure 15-1) when too many packets from that interface are still being processed in the system.
Symptom: An increasing number of input drops on serial link.
Table 15-3: Serial Lines: Increasing Input Drops on Serial Link — This table outlines the possible problem that may cause this symptom and suggests solutions.
| Possible Problem | Solution |
|---|---|
| Input rate exceeds the capacity of the router or input queues exceed the size of output queues |
Note: Input drop problems are typically seen when traffic is being routed between faster interfaces (such as Ethernet, Token Ring, and FDDI) and serial interfaces. When traffic is light, there is no problem. As traffic rates increase, backups start occurring. Routers drop packets during these congested periods.
|
Serial Lines: Increasing Input Errors in Excess of One Percent of Total Interface Traffic
If input errors appear in the show interfaces serial output (see Figure 15-1), there are several possible sources of those errors. The most likely sources are summarized in Table 15-4.
Note: Any input error value for cyclic redundancy check (CRC) errors, framing errors, or aborts above one percent of the total interface traffic suggests some kind of link problem that should be isolated and repaired.
Symptom: An increasing number of input errors in excess of one percent of total interface traffic.
Table 15-4: Serial Lines: Increasing Input Errors in Excess of One Percent of Total Interface Traffic
| Possible Problem | Solution |
|---|---|
The following problems can result in this symptom:
|
Note: Cisco strongly recommends not using data converters when you are connecting a router to a WAN or serial network.
|
Serial Lines: Troubleshooting Serial Line Input Errors
Table 15-5: This table describes the various types of input errors displayed by the show interfaces serial command (see Figure 15-1), possible problems that may be causing the errors and the solutions to those problems.
| Input Error Type (Field Name) | Possible Problem | Solution |
|---|---|---|
| CRC errors (CRC) | CRC errors occur when the CRC calculation does not pass-indicating that data is corrupted-for one of the following reasons:
|
|
| Framing errors (frame) | A framing error occurs when a packet does not end on an 8-bit byte boundary for one of the following reasons:
|
|
| Aborted transmission (abort) | Aborts indicate an illegal sequence of one bits (more than seven in a row). The following are possible reasons for this occurrence:
|
|
Serial Lines: Increasing Interface Resets on Serial Link
Interface resets that appear in the output of the show interfaces serial EXEC command (see Figure 15-1) are the result of missed keep-alive packets.
Symptom: An increasing number of interface resets on serial link.
Table 15-6: This table outlines the possible problems that may cause this symptom and suggests solutions.
| Possible Problem | Solution |
|---|---|
The following problems can result in this symptom:
|
When interface resets are occurring, examine other fields of the show interfaces serial command output to determine the source of the problem. Assuming that an increase in interface resets is being recorded, examine the following fields:
|
Serial Lines: Increasing Carrier Transitions Count on Serial Link
Carrier transitions appear in the output of the show interfaces serial EXEC command whenever there is an interruption in the carrier signal (such as an interface reset at the remote end of a link).
Symptom: An increasing number of carrier transitions count on serial link.
Table 15-7 outlines the possible problems that may cause this symptom and suggests solutions.
Table 15-7: Serial Lines: Increasing Carrier Transitions Count on Serial Link
| Possible Problem | Solution |
|---|---|
The following problems can result in this symptom:
|
|
Using the show controllers Command
The show controllers EXEC command is another important diagnostic tool when troubleshooting serial lines. The command syntax varies depending on the platform:
-
For serial interfaces on Cisco 7000 series routers, use the show controllers cbus EXEC command.
-
For Cisco access products, use the show controllers EXEC command.
-
For the AGS, CGS, and MGS, use the show controllers mci EXEC command.
Figure 15-2 shows the output from the show controllers cbus EXEC command. This command is used on Cisco 7000 series routers with the Fast Serial Interface Processor (FSIP) card. Check the command output to make certain that the cable to the channel service unit/digital service unit (CSU/DSU) is attached to the proper interface. You can also check the microcode version to see if it is current.
Figure 15-2: show controllers cbus Command Output
On access products such as the Cisco 2000, Cisco 2500, Cisco 3000, and Cisco 4000 series access servers and routers, use the show controllers EXEC command. Figure 15-3 shows the show controllers command output from the Basic Rate Interface (BRI) and serial interfaces on a Cisco 2503 access server. (Note that some output is not shown.)
The show controllers output indicates the state of the interface channels and whether a cable is attached to the interface. In Figure 15-3, serial interface 0 has an RS-232 DTE cable attached. Serial interface 1 has no cable attached.
Figure 15-4 shows the output of the show controllers mci command. This command is used on AGS, CGS, and MGS routers only. If the electrical interface is displayed as UNKNOWN (instead of V.35, EIA/TIA-449, or some other electrical interface type), an improperly connected cable is the likely problem. A bad applique or a problem with the internal wiring of the card is also possible. If the electrical interface is unknown, the corresponding display for the show interfaces serial EXEC command will show that the interface and line protocol are down.
Figure 15-3: show controllers Command Output
Figure 15-4: show controllers mci Command Output
Using debug Commands
The output of the various debug privileged EXEC commands provides diagnostic information relating to protocol status and network activity for many internetworking events.
Caution: Because debugging output is assigned a high priority in the CPU process, it can render the system unusable. For this reason, use debug commands only to troubleshoot specific problems or during troubleshooting sessions with Cisco technical support staff. Moreover, it is best to use debug commands during periods of low network traffic and fewer users. Debugging during these periods decreases the likelihood that increased debug command processing overhead will affect system use. When you finish using a debug command, remember to disable it with its specific no debug command or with the no debug all command.
The following debug commands are useful when troubleshooting serial and WAN problems. More information about the function and output of each of these commands is provided in the Debug Command Reference publication:
-
debug serial interface— Verifies whether HDLC keepalive packets are incrementing. If they are not, a possible timing problem exists on the interface card or in the network.
-
debug x25 events— Detects X.25 events, such as the opening and closing of switched virtual circuits (SVCs). The resulting «cause and diagnostic» information is included with the event report.
-
debug lapb— Outputs Link Access Procedure, Balanced (LAPB) or Level 2 X.25 information.
-
debug arp— Indicates whether the router is sending information about or learning about routers (with ARP packets) on the other side of the WAN cloud. Use this command when some nodes on a TCP/IP network are responding but others are not.
-
debug frame-relay lmi— Obtains Local Management Interface (LMI) information useful for determining if a Frame Relay switch and a router are sending and receiving LMI packets.
-
debug frame-relay events— Determines if exchanges are occurring between a router and a Frame Relay switch.
-
debug ppp negotiation— Shows Point-to-Point Protocol (PPP) packets transmitted during PPP startup, where PPP options are negotiated.
-
debug ppp packet— Shows PPP packets being sent and received. This command displays low-level packet dumps.
-
debug ppp errors— Shows PPP errors (such as illegal or malformed frames) associated with PPP connection negotiation and operation.
-
debug ppp chap— Shows PPP Challenge Handshake Authentication Protocol (CHAP) and Password Authentication Protocol (PAP) packet exchanges.
-
debug serial packet— Shows Switched Multimegabit Data Service (SMDS) packets being sent and received. This display also prints error messages to indicate why a packet was not sent or was received erroneously. For SMDS, the command dumps the entire SMDS header and some payload data when an SMDS packet is transmitted or received.
Using Extended ping Tests
The ping command is a useful test available on Cisco internetworking devices as well as on many host systems. In TCP/IP, this diagnostic tool is also known as an Internet Control Message Protocol (ICMP) Echo Request.
Note: The ping command is particularly useful when high levels of input errors are being registered in the show interfaces serial display. See Figure 15-1.
Cisco internetworking devices provide a mechanism to automate the sending of many ping packets in sequence. Figure 15-5 illustrates the menu used to specify extended ping options. This example specifies 20 successive pings. However, when testing the components on your serial line, you should specify a much larger number, such as 1000 pings.
Figure 15-5: Extended ping Specification Menu
Performing Ping Tests
In general, perform serial line ping tests as follows:
-
Put the CSU or DSU into local loopback mode.
-
Configure the extended ping command to send different data patterns and packet sizes. Figure 15-6 and Figure 15-7 illustrate two useful ping tests, an all-zeros (1500-byte) ping and an all-ones (1500-byte) ping, respectively.
-
Examine the show interfaces serial command output (see Figure 15-1) and determine whether input errors have increased. If input errors have not increased, the local hardware (DSU, cable, router interface card) is probably in good condition.
Assuming that this test sequence was prompted by the appearance of a large number of CRC and framing errors, a clocking problem is likely. Check the CSU or DSU for a timing problem. See the section «Troubleshooting Clocking Problems,» later in this chapter.
-
If you determine that the clocking configuration is correct and is operating properly, put the CSU or DSU into remote loopback mode.
-
Repeat the ping test and look for changes in the input error statistics.
-
If input errors increase, there is either a problem in the serial line or on the CSU/DSU. Contact the WAN service provider and swap the CSU or DSU. If problems persist, contact your technical support representative.
Figure 15-6: ALl-Zeros 1500-Byte ping Test
Figure 15-7 All-Ones 1500-Byte ping Test
Troubleshooting Clocking Problems
Clocking conflicts in serial connections can lead either to chronic loss of connection service or to degraded performance. This section discusses the important aspects of clocking problems: clocking problem causes, detecting clocking problems, isolating clocking problems, and clocking problem solutions.
Clocking Overview
The CSU/DSU derives the data clock from the data that passes through it. In order to recover the clock, the CSU/DSU hardware must receive at least one 1-bit value for every 8 bits of data that pass through it; this is known as ones density. Maintaining ones density allows the hardware to recover the data clock reliably.
Newer T1 implementations commonly use Extended Superframe Format (ESF) framing with binary eight-zero substitution (B8ZS) coding. B8ZS provides a scheme by which a special code is substituted whenever eight consecutive zeros are sent through the serial link. This code is then interpreted at the remote end of the connection. This technique guarantees ones density independent of the data stream.
Older T1 implementations use D4-also known as Superframe Format (SF) framing and Alternate Mark Inversion (AMI) coding. AMI does not utilize a coding scheme like B8ZS. This restricts the type of data that can be transmitted because ones density is not maintained independent of the data stream.
Another important element in serial communications is serial clock transmit external (SCTE) terminal timing. SCTE is the clock echoed back from the data terminal equipment (DTE) device (for example, a router) to the data communications equipment (DCE) device (for example, the CSU/DSU).
When the DCE device uses SCTE instead of its internal clock to sample data from the DTE, it is better able to sample the data without error even if there is a phase shift in the cable between the CSU/DSU and the router. Using SCTE is highly recommended for serial transmissions faster than 64 kbps. If your CSU/DSU does not support SCTE, see the section «Inverting the Transmit Clock,» later in this chapter.
Clocking Problem Causes
In general, clocking problems in serial WAN interconnections can be attributed to one of the following causes:
-
Incorrect DSU configuration
-
Incorrect CSU configuration
-
Cables out of specification-that is, longer than 50 feet (15.24 meters) or unshielded
-
Noisy or poor patch panel connections
-
Several cables connected together in a row
Detecting Clocking Problems
To detect clocking conflicts on a serial interface, look for input errors as follows:
-
Use the show interfaces serial EXEC command on the routers at both ends of the link.
-
Examine the command output for CRC, framing errors, and aborts.
-
If either of these steps indicates errors exceeding an approximate range of 0.5 percent 2.0 percent of traffic on the interface, clocking problems are likely to exist somewhere in the WAN.
-
Isolate the source of the clocking conflicts as outlined in the following section, «Isolating Clocking Problems.»
-
Bypass or repair any faulty patch panels.
Isolating Clocking Problems
After you determine that clocking conflicts are the most likely cause of input errors, the following procedure will help you isolate the source of those errors:
-
Perform a series of ping tests and loopback tests (both local and remote), as described in the section «CSU and DSU Loopback Tests,» earlier in this chapter.
-
Determine the end of the connection that is the source of the problem, or if the problem is in the line. In local loopback mode, run different patterns and sizes in the ping tests (for example, use 1500-byte datagrams). Using a single pattern and packet size may not force errors to materialize, particularly when a serial cable to the router or CSU/DSU is the problem.
-
Use the show interfaces serial EXEC command and determine if input errors counts are increasing and where they are accumulating.
If input errors are accumulating on both ends of the connection, clocking of the CSU is the most likely problem.
If only one end is experiencing input errors, there is probably a DSU clocking or cabling problem.
Aborts on one end suggests that the other end is sending bad information or that there is a line problem.
Note: Always refer to the show interfaces serial command output (see Figure 15-1) and log any changes in error counts or note if the error count does not change.
Clocking Problem Solutions
Table 15-8 Serial Lines: Clocking Problems and Solutions: This table outlines suggested remedies for clocking problems, based on the source of the problem.
| Possible Problem | Solution |
|---|---|
| Incorrect CSU configuration |
|
| Incorrect DSU configuration |
|
| Cable to router is out of specification | If the cable is longer than 50 feet (15.24 meters), use a shorter cable. If the cable is unshielded, replace it with shielded cable. |
Inverting the Transmit Clock
If you are attempting serial connections at speeds greater than 64 kbps with a CSU/DSU that does not support SCTE, you may have to invert the transmit clock on the router. Inverting the transmit clock compensates for phase shifts between the data and clock signals.
The specific command used to invert the transmit clock varies between platforms. On a Cisco 7000 series router, enter the invert-transmit-clock interface configuration command. For Cisco 4000 series routers, use the dte-invert-txc interface configuration command.
To ensure that you are using the correct command syntax for your router, refer to the user guide for your router or access server and to the Cisco IOS configuration guides and command references.
Note: On older platforms, inverting the transmit clock may require that you move a physical jumper.
Adjusting Buffers
Excessively high bandwidth utilization (over 70percent) results in reduced overall performance and can cause intermittent failures. For example, DECnet file transmissions may be failing due to packets being dropped somewhere in the network.
If the situation is bad enough, you must increase the bandwidth of the link. However, increasing the bandwidth may not be necessary or immediately practical. One way to resolve marginal serial line overutilization problems is to control how the router uses data buffers.
Caution: In general, do not adjust system buffers unless you are working closely with a Cisco technical support representative. You can severely affect the performance of your hardware and your network if you incorrectly adjust the system buffers on your router.
Use one of the following three options to control how buffers are used:
-
Adjust parameters associated with system buffers
-
Specify the number of packets held in input or output queues (hold queues)
-
Prioritize how traffic is queued for transmission (priority output queuing)
The configuration commands associated with these options are described in the Cisco IOS configuration guides and command references.
The following section focuses on identifying situations in which these options are likely to apply and defining how you can use these options to help resolve connectivity and performance problems in serial/WAN interconnections.
Tuning System Buffers
There are two general buffer types on Cisco routers: hardware buffers and system buffers. Only the system buffers are directly configurable by system administrators. The hardware buffers are specifically used as the receive and transmit buffers associated with each interface and (in the absence of any special configuration) are dynamically managed by the system software itself.
The system buffers are associated with the main system memory and are allocated to different-size memory blocks. A useful command for determining the status of your system buffers is the show buffers EXEC command. Figure 15-8 shows the output from the show buffers command.
Figure 15-8 show buffers Command Output
In the show buffers output:
-
total— Identifies the total number of buffers in the pool, including used and unused buffers.
-
permanent— Identifies the permanent number of allocated buffers in the pool. These buffers are always in the pool and cannot be trimmed away.
-
in free list— Identifies the number of buffers currently in the pool that are available for use.
-
min— Identifies the minimum number of buffers that the Route Processor (RP) should attempt to keep in the free list:
-
The min parameter is used to anticipate demand for buffers from the pool at any given time.
-
If the number of buffers in the free list falls below the min value, the RP attempts to create more buffers for that pool.
-
-
max allowed— Identifies the maximum number of buffers allowed in the free list:
-
The max allowed parameter prevents a pool from monopolizing buffers that it doesn’t need anymore and frees this memory back to the system for further use.
-
If the number of buffers in the free list is greater than the max allowed value, the RP should attempt to trim buffers from the pool.
-
-
hits— Identifies the number of buffers that have been requested from the pool. The hits counter provides a mechanism for determining which pool must meet the highest demand for buffers.
-
misses— Identifies the number of times a buffer has been requested and the RP detected that additional buffers were required. (In other words, the number of buffers in the free list has dropped below min.) The misses counter represents the number of times the RP has been forced to create additional buffers.
-
trims— Identifies the number of buffers that the RP has trimmed from the pool when the number of buffers in the free list exceeded the number of max allowed buffers.
-
created— Identifies the number of buffers that have been created in the pool. The RP creates buffers when demand for buffers has increased until the number of buffers in the free list is less than min buffers and/or a miss occurs because of zero buffers in the free list.
-
failures— Identifies the number of failures to grant a buffer to a requester even after attempting to create an additional buffer. The number of failures represents the number of packets that have been dropped due to buffer shortage.
-
no memory— Identifies the number of failures caused by insufficient memory to create additional buffers.
The show buffers command output in Figure 15-8 indicates high numbers in the trims and created fields for large buffers. If you are receiving high numbers in these fields, you can increase your serial link performance by increasing the max free value configured for your system buffers. trims identifies the number of buffers that the RP has trimmed from the pool when the number of buffers in free list exceeded the number of max allowed buffers.
Use the buffers max free number global configuration command to increase the number of free system buffers. The value you configure should be approximately 150 percent of the figure indicated in the total field of the show buffers command output. Repeat this process until the show buffers output no longer indicates trims and created buffers.
If the show buffers command output shows a large number of failures in the (no memory) field (see the last line of output in Figure 15-8), you must reduce the usage of the system buffers or increase the amount of shared or main memory (physical RAM) on the router. Call your technical support representative for assistance.
Implementing Hold Queue Limits
Hold queues are buffers used by each router interface to store outgoing or incoming packets. Use the hold-queue interface configuration command to increase the number of data packets queued before the router will drop packets. Increase these queues by small increments (for instance, 25 percent) until you no longer see drops in the show interfaces output. The default output hold queue limit is 100 packets.
Note: The hold-queue command is used for process-switched packets and periodic updates generated by the router.
Use the hold-queue command to prevent packets from being dropped and to improve serial-link performance under the following conditions:
-
You have an application that cannot tolerate drops and the protocol is able to tolerate longer delays. DECnet is an example of a protocol that meets both criteria. Local-area transport (LAT) does not because it does not tolerate delays.
-
The interface is very slow. Bandwidth is low or anticipated utilization is likely to sporadically exceed available bandwidth.
Note: When you increase the number specified for an output hold queue, you may need to increase the number of system buffers. The value used depends on the size of the packets associated with the traffic anticipated for the network.
Using Priority Queuing to Reduce Bottlenecks
Priority queuing is a list-based control mechanism that allows traffic to be prioritized on an interface-by-interface basis. Priority queuing involves two steps:
-
Create a priority list by protocol type and level of priority.
-
Assign the priority list to a specific interface.
Both of these steps use versions of the priority-list global configuration command. In addition, further traffic control can be applied by referencing access-list global configuration commands from priority-list specifications. For examples of defining priority lists and for details about command syntax associated with priority queuing, refer to the Cisco IOS configuration guides and command references.
Note: Priority queuing automatically creates four hold queues of varying size. This overrides any hold queue specification included in your configuration.
Use priority queuing to prevent packets from being dropped and to improve serial link performance under the following conditions:
-
When the interface is slow, there is a variety of traffic types being transmitted, and you want to improve terminal traffic performance.
-
If you have a serial link that is intermittently experiencing very heavy loads (such as file transfers occurring at specific times) priority queuing will help select which types of traffic should be discarded at high traffic periods.
In general, start with the default number of queues when implementing priority queues. After enabling priority queuing, monitor output drops with the show interfaces serial EXEC command. If you notice that output drops are occurring in the traffic queue you have specified to be high priority, increase the number of packets that can be queued (using the queue-limit keyword option of the priority-list global configuration command). The default queue-limit arguments are 20 packets for the high-priority queue, 40 for medium, 60 for normal, and 80 for low.
Note: When bridging Digital Equipment Corporation (DEC) LAT traffic, the router must drop very few packets, or LAT sessions can terminate unexpectedly. A high-priority queue depth of about 100 (specified with the queue-limit keyword) is a typical working value when your router is dropping output packets and the serial lines are subjected to about 50 percent bandwidth utilization. If the router is dropping packets and is at 100 percent utilization, you need another line.
Another tool to relieve congestion when bridging DEC LAT is LAT compression. You can implement LAT compression with the interface configuration command bridge-group group lat-compression.
Special Serial Line Tests
In addition to the basic diagnostic capabilities available on routers, a variety of supplemental tools and techniques can be used to determine the conditions of cables, switching equipment, modems, hosts, and remote internetworking hardware. For more information, consult the documentation for your CSU, DSU, serial analyzer, or other equipment.
CSU and DSU Loopback Tests
If the output of the show interfaces serial EXEC command indicates that the serial line is up but the line protocol is down, use the CSU/DSU loopback tests to determine the source of the problem. Perform the local loop test first, and then the remote test. Figure 15-9 illustrates the basic topology of the CSU/DSU local and remote loopback tests.
Figure 15-9: CSU/DSU Local and Remote Loopback Tests
Note: These tests are generic in nature and assume attachment of the internetworking system to a CSU or DSU. However, the tests are essentially the same for attachment to a multiplexer with built-in CSU/DSU functionality. Because there is no concept of a loopback in X.25 or Frame Relay packet-switched network (PSN) environments, loopback tests do not apply to X.25 and Frame Relay networks.
CSU and DSU Local Loopback Tests for HDLC or PPP Links
Listed below is a general procedure for performing loopback tests in conjunction with built-in system diagnostic capabilities:
-
Place the CSU/DSU in local loop mode (refer to your vendor documentation). In local loop mode, the use of the line clock (from the T1 service) is terminated, and the DSU is forced to use the local clock.
-
Use the show interfaces serial EXEC command to determine if the line status changes from «line protocol is down» to «line protocol is up (looped),» or if it remains down.
-
If the line protocol comes up when the CSU or DSU is in local loopback mode, this suggests that the problem is occurring on the remote end of the serial connection. If the status line does not change state, there is a possible problem in the router, connecting cable, or CSU/DSU.
-
If the problem appears to be local, use the debug serial interface privileged EXEC command.
-
Take the CSU/DSU out of local loop mode. When the line protocol is down, the debug serial interface command output will indicate that keepalive counters are not incrementing.
-
Place the CSU/DSU in local loop mode again. This should cause the keepalive packets to begin to increment. Specifically, the values for mineseen and yourseen keepalives will increment every 10 seconds. This information will appear in the debug serial interface output.
If the keepalives do not increment, there may be a timing problem on the interface card or on the network. For information on correcting timing problems, see the section «Troubleshooting Clocking Problems,» earlier in this chapter.
If the keepalives do not increment, there may be a timing problem on the interface card or on the network. For information on correcting timing problems, see the section «Troubleshooting Clocking Problems,» earlier in this chapter.
-
Check the local router, CSU/DSU hardware, and any attached cables. Make certain that the cables are within the recommended lengths-no more than 50 feet (15.24 meters) or 25 feet (7.62 meters) for a T1 link. Make certain the cables are attached to the proper ports. Swap faulty equipment as necessary.
Figure 15-10 shows the output from the debug serial interface command for an HDLC serial connection, with missed keepalives causing the line to go down and the interface to reset.
Figure 15-10: debug serial interface Command Output
CSU and DSU Remote Loopback Tests for HDLC or PPP Links
If you determine that the local hardware is functioning properly but you still encounter problems when attempting to establish connections over the serial link, try using the remote loopback test to isolate the problem cause.
Note: This remote loopback test assumes that HDLC encapsulation is being used and that the preceding local loop test was performed immediately before this test.
The following steps are required to perform loopback testing:The following steps are required to perform loopback testing:
-
Put the remote CSU or DSU into remote loopback mode (refer to the vendor documentation).
-
Using the show interfaces serial EXEC command, determine if the line protocol remains up with the status line indicating «Serial x is up, line protocol is up (looped),» or if it goes down with the status line indicating «line protocol is down.»
-
If the line protocol remains up (looped), the problem is probably at the remote end of the serial connection (between the remote CSU/DSU and the remote router). Perform both local and remote tests at the remote end to isolate the problem source.
-
If the line status changes to «line protocol is down» when remote loopback mode is activated, make sure that ones density is being properly maintained. The CSU/DSU must be configured to use the same framing and coding schemes used by the leased-line or other carrier service (for example, ESF and B8ZS).
-
If problems persist, contact your WAN network manager or the WAN service organization.
Detailed Information on the show interfaces serial Command
The following sub-sections cover the show interfaces serial command’s parameters, syntax description, sample output display, and field descriptions.
show interfaces serial Parameters
To display information about a serial interface, use the show interfaces serial privileged EXEC command:
show interfaces serial [number] [accounting]
show interfaces serial [number [:channel-group] [accounting] (Cisco 4000 series)
show interfaces serial [slot | port [:channel-group]] [accounting] (Cisco 7500 series)
show interfaces serial [type slot | port-adapter | port] [serial]
(ports on VIP cards in the Cisco 7500 series)
show interfaces serial [type slot | port-adapter | port] [:t1-channel] [accounting | crb]
(CT3IP in Cisco 7500 series)
Syntax Description
-
number-Optional. Port number.
-
accounting-Optional. Displays the number of packets of each protocol type that have been sent through the interface.
-
:channel-group -Optional. On the Cisco 4000 series with an NPM or a Cisco 7500 series with a MIP, specifies the T1 channel-group number in the range of 0 to 23, defined with the channel-group controller configuration command.
-
slot -Refers to the appropriate hardware manual for slot information.
-
port -Refers to the appropriate hardware manual for port information.
-
port-adapter -Refers to the appropriate hardware manual for information about port adapter compatibility.
-
:t1-channel -Optional. For the CT3IP, the T1 channel is a number between 1 and 28.
-
T1 channels on the CT3IP are numbered 1 to 28 rather than the more traditional zero-based scheme (0 to 27) used with other Cisco products. This is to ensure consistency with Telco numbering schemes for T1 channels within channelized T3 equipment.
-
crb-Optional. Shows interface routing and bridging information.
Command Mode
Privileged EXEC
Usage Guidelines
This command first appeared in Cisco IOS Release 10.0 for the Cisco 4000 series. It first appeared in Cisco IOS Release 11.0 for the Cisco 7000 series, and it was modified in Cisco IOS Release 11.3 to include the CT3IP.
Sample Displays
The following is sample output from the show interfaces command for a synchronous serial interface:
Router# show interfaces serial
Serial 0 is up, line protocol is up
   Hardware is MCI Serial
   Internet address is 150.136.190.203, subnet mask is 255.255.255.0
   MTU 1500 bytes, BW 1544 Kbit, DLY 20000 usec, rely 255/255, load 1/255
   Encapsulation HDLC, loopback not set, keepalive set (10 sec)
   Last input 0:00:07, output 0:00:00, output hang never
   Output queue 0/40, 0 drops; input queue 0/75, 0 drops
   Five minute input rate 0 bits/sec, 0 packets/sec
   Five minute output rate 0 bits/sec, 0 packets/sec
       16263 packets input, 1347238 bytes, 0 no buffer
       Received 13983 broadcasts, 0 runts, 0 giants
       2 input errors, 0 CRC, 0 frame, 0 overrun, 0 ignored, 2 abort
1 carrier transitions
     22146 packets output, 2383680 bytes, 0 underruns
     0 output errors, 0 collisions, 2 interface resets, 0 restarts
Field Description
Table 15-9: show interfaces serial Field Descriptions — this table describes significant fields shown in the output.
| Field | Description |
|---|---|
| Serial…is {up | down}…is administratively down | Indicates whether the interface hardware is currently active (carrier detect is present) or whether it has been taken down by an administrator. |
| line protocol is {up | down} | Indicates whether the software processes that handle the line protocol consider the line usable (that is, keepalives are successful) or whether it has been taken down by an administrator. |
| line protocol is {up | down} | Indicates whether the software processes that handle the line protocol consider the line usable (that is, keepalives are successful) or whether it has been taken down by an administrator. |
| Hardware is | Specifies the hardware type. |
| Internet address is | Specifies the internet address and subnet mask. |
| MTU | Maximum transmission unit of the interface. |
| BW | Indicates the value of the bandwidth parameter that has been configured for the interface (in kilobits per second). The bandwidth parameter is used to compute IGRP metrics only. If the interface is attached to a serial line with a line speed that does not match the default (1536 or 1544 for T1 and 56 for a standard synchronous serial line), use the bandwidth command to specify the correct line speed for this serial line. |
| DLY | Delay of the interface in microseconds. |
| rely | Reliability of the interface as a fraction of 255 (255/255 is 100 percent reliability), calculated as an exponential average over five minutes. |
| load | Reliability of the interface as a fraction of 255 (255/255 is 100 percent reliability), calculated as an exponential average over five minutes. |
| Encapsulation | Encapsulation method assigned to the interface. |
| loopback | Indicates whether loopback is set. |
| keepalive | Indicates whether keepalives are set. |
| Last input | Number of hours, minutes, and seconds since the last packet was successfully received by an interface. Useful for knowing when a dead interface failed. |
| Last output | Number of hours, minutes, and seconds since the last packet was successfully transmitted by an interface.Number of hours, minutes, and seconds since the last packet was successfully transmitted by an interface. |
| output hang | Number of hours, minutes, and seconds (or never) since the interface was last reset because of a transmission that took too long. When the number of hours in any of the last fields exceeds 24, the number of days and hours is printed. If that field overflows, asterisks are printed. |
| Output queue, drops input queue, drops | Number of packets in output and input queues. Each number is followed by a slash, the maximum size of the queue, and the number of packets because the queue is full. |
| 5 minute input rate 5 minute output rate | Average number of bits and packets transmitted per second in the past five minutes. The five-minute input and output rates should be used only as an approximation of traffic per second during a given five-minute period. These rates are exponentially weighted averages with a time constant of five minutes. A period of four time constants must pass before the average will be within 2 percent of the instantaneous rate of a uniform stream of traffic over that period. |
| packets input | Total number of error-free packets received by the system. |
| bytes | Total number of bytes, including data and MAC encapsulation, in the error-free packets received by the system. |
| no buffer | Number of received packets discarded because there was no buffer space in the main system. Compare with ignored count. Broadcast storms on Ethernet networks and bursts of noise on serial lines are often responsible for no input buffer events. |
| Received… broadcasts | Total number of broadcast or multicast packets received by the interface. |
| runts | Number of packets that are discarded because they are smaller than the medium’s minimum packet size. |
| giants | Number of packets that are discarded because they exceed the medium’s maximum packet size. |
| input errors | Total number of no buffer, runts, giants, CRCs, frame, overrun, ignored, and abort counts. Other input-related errors can also increment the count, so this sum may not balance with the other counts. |
| CRC | Cyclic redundancy check generated by the originating station or far-end device does not match the checksum calculated from the data received. On a serial link, CRCs usually indicate noise, gain hits, or other transmission problems on the data link. |
| frame | Number of packets received incorrectly having a CRC error and a noninteger number of octets. On a serial line, this is usually the result of noise or other transmission problems. |
| overrun | Number of times the serial receiver hardware was unable to hand received data to a hardware buffer because the input rate exceeded the receiver’s ability to handle the data. |
| ignored | Number of received packets ignored by the interface because the interface hardware ran low on internal buffers. Broadcast storms and bursts of noise can cause the ignored count to be increased. |
| abort | Illegal sequence of one bits on a serial interface. This usually indicates a clocking problem between the serial interface and the data link equipment. |
| carrier transitions | Number of times the carrier detect signal of a serial interface has changed state. For example, if data carrier detect (DCD) goes down and comes up, the carrier transition counter will increment two times. Indicates modem or line problems if the carrier detect line is changing state often. |
| packets output | Total number of messages transmitted by the system. |
| bytes output | Total number of bytes, including data and MAC encapsulation, transmitted by the system. |
| underruns | Number of times that the transmitter has been running faster than the router can handle. This may never be reported on some interfaces. |
| output errors | Sum of all errors that prevented the final transmission of datagrams out of the interface being examined. Note that this may not balance with the sum of the enumerated output errors because some datagrams can have more than one error, and others can have errors that do not fall into any of the specifically tabulated categories. |
| collisions | Number of messages retransmitted due to an Ethernet collision. This usually is the result of an overextended LAN (that is, Ethernet or transceiver cable too long, more than two repeaters between stations, or too many cascaded multiport transceivers). Some collisions are normal. However, if your collision rate climbs to around 4 percent or 5 percent, you should consider verifying that there is no faulty equipment on the segment and/or moving some existing stations to a new segment. A packet that collides is counted only once in output packets. |
| interface resets | Number of times an interface has been completely reset. This can happen if packets queued for transmission were not sent within several seconds’ time. On a serial line, this can be caused by a malfunctioning modem that is not supplying the transmit clock signal, or by a cable problem. If the system notices that the carrier detect line of a serial interface is up but the line protocol is down, it periodically resets the interface in an effort to restart it. Interface resets can also occur when an interface is looped back or shut down. |
| restarts | Number of times the controller was restarted because of errors. |
| alarm indications, remote alarms, rx LOF, rx LOS | Number of CSU/DSU alarms, and number of occurrences of receive loss of frame and receive loss of signal. |
| BER inactive, NELR inactive, FELR inactive | Status of G.703-E1 counters for bit error rate (BER) alarm, near-end loop remote (NELR), and far-end loop remote (FELR). Note that you cannot set the NELR or FELR. |
Troubleshooting T1
This section describes the techniques and procedures for troubleshooting T1 circuits for dial-in customers.
Troubleshooting Using the show controller t1 Command
This command displays the controller status that is specific to the controller hardware. The information displayed is generally useful for diagnostic tasks performed by technical support personnel only.
The NMP (Network Management Processor) or MIP (MultiChannel Interface Processor) can query the port adapters to determine their current status. Issue a show controller t1 command to display statistics about the T1 link.
If you specify a slot and port number, statistics for each 15-minute period will be displayed. The show controller t1 EXEC command provides information to logically troubleshoot physical layer and data link layer problems. This section describes how to logically troubleshoot using the show controller t1 command.
Most T1 errors are caused by misconfigured lines. Ensure that linecoding, framing and clock source are configured according to what the service provider recommends.
show controller t1 Conditions
The T1 controller can be in one of the following three states.
-
Administratively down
-
Down
-
Up
Is the T1 Controller Administratively Down?
The controller is administratively down when it has been manually shut down. You should restart the controller to correct this error.
-
Enter enable mode.
maui-nas-03>en
Password:
maui-nas-03#
-
Enter global configuration mode.
maui-nas-03#configure terminal
Enter configuration commands, one per line. End with CNTL/Z.
maui-nas-03(config)#
-
Enter controller configuration mode.
maui-nas-03(config)#controller t1 0
maui-nas-03(config-controlle)#
-
Restart controller.
maui-nas-03(config-controlle)#shutdown
maui-nas-03(config-controlle)#no shutdown
Is the Line Up?
If the T1 controller and line are not up, check to see if one of the following messages appears in the show controller t1 EXEC output:
-
Receiver has loss of frame
-
Receiver has loss of signal
If T1 Receiver Has Loss of Frame:
Follow these steps if T1 Receiver Has Loss of Frame:
-
Check to see if the framing format configured on the port matches the framing format of the line. You can check the framing format of the controller from the running configuration or the show controller t1 command output.
To change the framing format use the framing {SF | ESF} command in the controller configuration mode as shown below:
maui-nas-03#configure terminal
Enter configuration commands, one per line. End with CNTL/Z.
maui-nas-03(config)#controller t1 0
maui-nas-03(config-controlle)#framing esf
-
Try the other framing format to see if the alarm clears.
-
Change the line buildout setting using the cablelength {long | short} command.
Line build out (LBO) compensates for the loss in decibels based on the distance from the device to the first repeater in the circuit. A longer distance from the device to the repeater requires that the signal strength on the circuit be boosted to compensate for loss over that distance.
Consult your service provider and the Cisco IOSÒ Command Reference for details on buildout settings.
If this does not fix the problem, proceed to the «If T1 Receiver Has Loss of Signal» section below.
If T1 Receiver Has Loss of Signal:
Follow these steps if T1 Receiver Has Loss of Signal:
-
Make sure that the cable between the interface port and the T1 service provider’s equipment (or T1 terminal equipment) is connected correctly. Check to see if the cable is hooked up to the correct ports. Correct the cable connections if necessary.
-
Check cable integrity. Look for breaks or other physical abnormalities in the cable. Ensure that the pinouts are set correctly. If necessary, replace the cable.
-
Check the cable connectors. A reversal of the transmit and receive pairs or an open receive pair can cause errors. Set the receive pair to lines 1 & 2. Set the transmit pair to lines 4 & 5.
The pins on a RJ-45 jack are numbered from 1 through 8. Pin 1 is the leftmost pin when looking at the jack with the metal pins facing you. Refer to the figure below.
Figure 15-10: RJ-45 Cable

-
Try using a rollover cable.
Run the show controller t1 EXEC command after each step to check if the controller exhibits any errors.
Check to see if the line is in loopback mode from the show controller t1 output. A line should be in loopback mode only for testing purposes.
To turn off loopback, use the no loopback command in the controller configuration mode as shown below:
maui-nas-03(config-controlle)#no loopback
If the Controller Displays Any Alarms:
Check the show controller command output to see if there are alarms displayed by the controller.
We will now discuss various alarms and the procedure necessary to correct them.
Receive (RX) Alarm Indication Signal (AIS) (Blue):
A received Alarm Indication Signal (AIS) means there is an alarm occurring on the line upstream of the equipment connected to the port.
-
Check to see if the framing format configured on the port matches the framing format of the line. If not, change the framing format on the controller to match that of the line.
-
Contact your service provider to check for mis-configuration within the Telco.
Receive (Rx) Remote Alarm Indication (RAI) (Yellow):
A received RAI means that the far-end equipment has a problem with the signal it is receiving from its upstream equipment.
-
Insert an external loopback cable into the port. To create a loopback plug refer to the section «Creating a Loopback Plug,» later in the chapter.
-
Check to see if there are any alarms. If you do not see any alarms, then the local hardware is probably in good condition. In that case:
-
Check the cabling. See the section «If T1 Receiver Has Loss of Signal» for more information.
-
Check the settings at the remote end and verify that they match your port settings.
-
If the problem persists, contact your service provider.
-
-
Remove the loopback plug and reconnect your T1 line.
-
Check the cabling. See the section «If T1 Receiver Has Loss of Signal» for more information.
-
Power-cycle the router.
-
Connect the T1 line to a different port. Configure the port with the same settings as that of the line. If the problem does not persist, then the fault lies with the one port:
-
Reconnect the T1 line to the original port.
-
Proceed to the «Troubleshooting T1 Error Events» section.
If the problem persists, then:
-
-
Perform a hardware loop test as described in the section «Performing Hardware Loopback Plug Test.»
-
Replace the T1 controller card.
-
Proceed to the «Troubleshooting T1 Error Events» section.
Transmitter Sending Remote Alarm (Red):
A Red alarm is declared when the CSU cannot synchronize with the framing pattern on the T1 line.
-
Check to see if the framing format configured on the port matches the framing format of the line. If not change the framing format on the controller to match that of the line.
-
Check the settings at the remote end and verify that they match your port settings.
-
Contact your service provider.
Transmit(Tx) Remote Alarm Indication (RAI) (Yellow):
A transmitted RAI at the interface indicates that the interface has a problem with the signal it is receiving from the far-end equipment.
-
Check the settings at the remote end and verify that they match your port settings.
-
A transmit RAI should be accompanied by some other alarm that indicates the nature of the problem the T1 port/card is having with the signal from the far-end equipment.
Troubleshoot that condition to resolve the transmit RAI.
Transmit(Tx) AIS (Blue):
Follow the steps below to correct the Transmit (Tx) AIS (Blue).
-
Check to see if the framing format configured on the port matches the framing format of the line. If not, correct the mismatch.
-
Power-cycle the router.
-
Connect the T1 line to a different port. Configure the port with the same settings as that of the line.
-
Perform a hardware loop test as described in the section «Performing Hardware Loopback Plug Test.»
-
Replace the T1 controller card.
-
Proceed to the «Troubleshooting T1 Error Events» section.
Troubleshooting T1 Error Events
The show controller t1 EXEC command provides error messages that can be used to troubleshoot problems. We will now discuss several error messages and how to correct the errors.
To see if the error counters are increasing, execute the show controller t1 command repeatedly. Note the values of the counters for the current interval.
Consult your service provider for framing and linecoding settings. A good rule of thumb is to use B8ZS linecoding with ESF framing and AMI linecoding with SF framing.
Slip Secs Counter is increasing:
The presence of slips on a T1 line indicates a clocking problem. The T1 provider (Telco) will provide the clocking to which the Customer Premises Equipment (CPE) should be synchronized.
-
Verify that the clock source is derived from the network. This can be ascertained by looking for Clock Source is Line Primary.
Note: If there are multiple T1s into an access server, only one can be the primary, while the other T1s derive the clock from the primary. In that case verify that the T1 line designated as the primary clock source is configured correctly.
-
Set the T1 clock source correctly from the controller configuration mode.
maui-nas-03(config-controlle)#clock source line primary
Framing Loss Seconds Counter is Increasing:
Follow these steps when the Framing Loss Seconds Counter is Increasing.
-
Check to see if the framing format configured on the port matches the framing format of the line. You can check this by looking for the Framing is {ESF|SF} in the show controller t1 output.
-
To change the framing format use the framing {SF | ESF} command in the controller configuration mode as shown below:
maui-nas-03(config-controlle)#framing esf
-
Change the line buildout using the cablelength {long | short} command.
Consult your service provider and the Cisco IOSÒ Command Reference for details on buildout settings.
Line Code Violations are increasing:
Follow these steps when Line Code Violations are increasing.
-
Check to see if the linecoding configured on the port matches the framing format of the line. You can check this by looking for the Line Code is {B8ZS|AMI} in the show controller t1 output.
-
To change the linecoding, use the linecode {ami | b8zs} command in the controller configuration mode as shown below:
maui-nas-03(config-controlle)#linecode b8zs
-
Change the line buildout using the cablelength {long | short} command.
Consult your service provider and the Cisco IOS® Command Reference for details on buildout settings.
Verifying that ISDN Switch Type and PRI-Group are Configured Correctly
Use the show running-config command to see if ISDN switch type and the PRI-group timeslots are configured correctly. Contact your service provider for correct values.
To change the ISDN switch type and PRI-group:
maui-nas-03#configure terminal
maui-nas-03(config)#isdn switch-type primary-5ess
maui-nas-03(config)#controller t1 0
maui-nas-03(config-controlle)#pri-group timeslots 1-24
Verifying the Signaling Channel
If the error counters do not increase but the problem persists, verify that the signaling channel is up and configured correctly.
-
Run the show interface serial x:23 command, where x should be replaced by the interface number.
-
Check to see if the interface is up. If the interface is not up, use the no shutdown command to bring the interface up.
maui-nas-03#config terminal
Enter configuration commands, one per line.  End with CNTL/Z.
maui-nas-03(config)#interface serial 0:23
maui-nas-03(config-if)#no shutdown
-
Ensure that encapsulation is PPP. If the interface is not using PPP then use the encapsulation ppp command in the interface configuration mode to correct it.
maui-nas-03(config-if)#encapsulation ppp
-
Check to see if loopback is set. Loopback should be set only for testing purposes. Use the no loopback command to remove loopbacks.
maui-nas-03(config-if)#no loopback
-
Power-cycle the router.
-
If the problem persists, contact your service provider or Cisco TAC
Troubleshooting a PRI
Whenever troubleshooting a PRI, you need to check to see if the T1 is running cleanly on both ends. If Layer 1 problems have been resolved, as described above, consider Layer 2 and Layer 3 problems.
Troubleshooting Using the show isdn status Command
The show isdn status command is used to display a snapshot of all ISDN interfaces. It displays the status of Layers 1, 2 and 3.
-
Verify that Layer 1 is active.
The Layer 1 status should always say ACTIVE unless the T1 is down. If show isdn status indicates that Layer 1 is DEACTIVATED, then there is a problem with the physical connectivity on the T1 line. See the section «Is the T1 Controller T1 Down?»
Also verify that the T1 is not administratively down. Use the no shutdown command to bring the T1 controller up.
-
Check to see if the Layer 2 State is MULTIPLE_FRAME_ESTABLISHED
The desired Layer 2 state is Multiple_Frame_Established, which indicates that we are exchanging layer 2 frames and have finished Layer 2 initialization.
If Layer 2 is not Multiple_Frame_Established , use the show controller t1 EXEC command to diagnose the problem. Refer to the Troubleshooting using the show controller t1 Command section in this chapter.
Since show isdn status is a snapshot of the current status, it is possible that layer 2 is bouncing up and down despite indicating Mulitple_Frame_Established. Use debug isdn q921 to verify that layer 2 is stable.
The debug isdn q921 command displays data link layer (layer 2) access procedures that are taking place at the router on the D-channel.
Ensure that you are configured to view debug messages by using the logging console or terminal monitor command as necessary.
Note: In a production environment, verify that console logging is disabled. Enter the show logging command. If logging is enabled, the access server may intermittently freeze up as soon as the console port gets overloaded with log messages. Enter the no logging console command.
Note: If debug isdn q921 is turned on and you do not receive any debug outputs, place a call or reset the controller to get debug outputs.
-
Verify that Layer 2 is stable.
You should observe the debug outputs for messages indicating that the service is not bouncing up and down. If you see the following types of debug outputs, the line is not stable.
Mar 20 10:06:07.882: %ISDN-6-LAYER2DOWN: Layer 2 for Interface Se0:23, TEI 0
changed to down
Mar 20 10:06:09.882: %LINK-3-UPDOWN: Interface Serial0:23, changed state to down
Mar 20 10:06:21.274: %DSX1-6-CLOCK_CHANGE: Controller 0  clock is now selected
as clock source
Mar 20 10:06:21.702: %ISDN-6-LAYER2UP: Layer 2 for Interface Se0:23, TEI 0 changed
to up
Mar 20 10:06:22.494: %CONTROLLER-5-UPDOWN: Controller T1 0, changed state to up
Mar 20 10:06:24.494: %LINK-3-UPDOWN: Interface Serial0:23, changed state to up
If Layer 2 does not appear to be stable, see «Troubleshooting T1 Error Events,» earlier in this chapter.
-
Verify that you are seeing only SAPI messages in both transmit (TX) and Receive (RX) sides.
Mar 20 10:06:52.505: ISDN Se0:23: TX ->  RRf sapi = 0  tei = 0  nr = 0
Mar 20 10:06:52.505: ISDN Se0:23: RX <-  RRf sapi = 0  tei = 0  nr = 0
Mar 20 10:07:22.505: ISDN Se0:23: TX ->  RRp sapi = 0  tei = 0 nr = 0
Mar 20 10:07:22.509: ISDN Se0:23: RX <-  RRp sapi = 0  tei = 0 nr = 0
Mar 20 10:07:22.509: ISDN Se0:23: TX ->  RRf sapi = 0  tei = 0  nr = 0
Mar 20 10:07:22.509: ISDN Se0:23: RX <-  RRf sapi = 0  tei = 0  nr = 0
-
Verify that you are not seeing SABME messages, which indicates that Layer 2 is trying to reinitialize. This is usually seen when we are transmitting poll requests (RRp) and not getting a response from the switch (RRf) or vice-versa. Below are example of SABME messages.
Mar 20 10:06:21.702: ISDN Se0:23: RX <-  SABMEp sapi = 0  tei = 0
Mar 20 10:06:22.494: ISDN Se0:23: TX ->  SABMEp sapi = 0  tei = 0
If you are seeing SABME messages, use the show running-config command to see if ISDN switch type and the PRI-group timeslots are configured correctly. Contact your service provider for correct values.
To change the ISDN switch type and PRI-group:
maui-nas-03#configure terminal
maui-nas-03(config)#isdn switch-type primary-5ess
maui-nas-03(config)#controller t1 0
maui-nas-03(config-controlle)#pri-group timeslots 1-24
-
Verify that the D-channel is up using the show interfaces serial x:23 command.
If the D-channel is not up, then use no shutdown command to bring it up:
maui-nas-03(config)#interface serial 0:23
maui-nas-03(config-if)#no shutdown
-
Check to see if encapsulation is PPP. If not, use the encapsulation ppp command to set encapsulation.
maui-nas-03(config-if)#encapsulation ppp
-
Check to see if the interface is in loopback mode. For normal operation, the interface should not be in loopback mode.
maui-nas-03(config-if)#no loopback
-
Power-cycle the router.
-
If the problem persists, contact your service provider or the Cisco TAC.
Performing Hardware Loopback Plug Test
The Hardware loopback plug test can be used to test whether the router has any faults. If a router passes a hardware loopback plug test, then the problem exists elsewhere on the line.
Create a Loopback Plug:
Follow these steps to create a loopback plug.
-
Use wire cutters to cut a working RJ-45 or RJ-48 cable so that there are five inches of cable and the connector is attached to it.
-
Strip the wires.
-
Twist together the wires from pins 1 and 4.
-
Twist together the wires from pins 2 and 5.
The pins on a RJ-45/48 jack are numbered from 1 through 8. Pin 1 is the left-most pin when looking at the jack with the metal pins facing you.
Performing the Loopback Plug Test
Follow these steps to perform the loopback plug test.
-
Insert the plug into the T1 port in question.
-
Save your router configuration using the write memory command.
maui-nas-03#write memory
Building configuration...
[OK]
-
Set the encapsulation to HDLC
maui-nas-03#config terminal
Enter configuration commands, one per line.  End with CNTL/Z.
maui-nas-03(config)#interface serial 0
maui-nas-03(config-if)#enc
maui-nas-03(config-if)#encapsulation HDLC
maui-nas-03(config-if)#^Z
-
Use the show running-config command to see if the interface has an IP address.
If the interface does not have an IP address, obtain a unique address and assign it to the interface with a subnet mask of 255.255.255.0.
maui-nas-03(config)#ip address 172.22.53.1 255.255.255.0
-
Clear the interface counters using the clear counters command.
maui-nas-03#clear counters
Clear "show interfaces" counters on all interfaces [confirm]
maui-nas-03#
-
Perform the extended ping test as described in the «Using Extended ping Tests,» section earlier in this chapter.
Troubleshooting E1
This section describes the techniques and procedures for troubleshooting E1 circuits for dial-in customers.
Troubleshooting Using the show controller e1 Command
This command displays the controller status that is specific to the controller hardware. The information displayed is generally useful for diagnostic tasks performed by technical support personnel only.
The NMP or MIP can query the port adapters to determine their current status. Issue a show controller e1 command to display statistics about the E1 link. If you specify a slot and port number, statistics for each 15 minute period will be displayed.
The show controller e1 EXEC command provides information to logically troubleshoot physical layer and data link layer problems. This section describes how to logically troubleshoot using the show controller e1 command.
Most E1 errors are caused by misconfigured lines. Ensure that linecoding, framing, clock source and line termination (balanced or unbalanced) are configured according to what the service provider recommends.
show controller e1 Conditions
The E1 controller can be in one of the following three states.
-
Administratively down
-
Down
-
Up
Is the E1 Controller Administratively Down?
The controller is administratively down when it has been manually shut down. You should restart the controller to correct this error.
-
Enter enable mode.
maui-nas-03>enable
Password:
maui-nas-03#
-
Enter global configuration mode.
maui-nas-03#configure terminal
Enter configuration commands, one per line.  End with CNTL/Z.
maui-nas-03(config)#
-
Enter controller configuration mode.
maui-nas-03(config)#controller e1 0
maui-nas-03(config-controlle)#
-
Restart controller.
maui-nas-03(config-controlle)#shutdown
maui-nas-03(config-controlle)#no shutdown
Is the Line Up?
If the E1 line is not up, check to see that the line configuration is correct and matches the settings of the remote end.
-
Check the framing of the line and the remote end. For E1 lines, the framing is either CRC4 or noCRC4
-
Check the linecoding of the line and the remote end. The linecoding is either AMI or HDB3.
-
Check to see if the line termination is set for balanced or unbalanced (75-ohm or 120-ohm).
Consult your service provider for more information regarding the correct settings. Make any changes as necessary to both local or remote end-devices.
If the E1 controller and line are not up, check to see if one of the following messages appears in the show controller e1 EXEC output:
-
Receiver has loss of frame
-
Receiver has loss of signal
If E1 Receiver Has Loss of Frame:
Follow these steps if E1 receiver has loss of frame.
-
Check to see if the framing format configured on the port matches the framing format of the line. You can check the framing format of the controller from the running configuration or the show controller e1 command output.
To change the framing format, use the framing {CRC4 | no CRC4} command in the controller configuration mode as shown below:
maui-nas-03#configure terminal
Enter configuration commands, one per line.  End with CNTL/Z.
maui-nas-03(config)#controller E1 0
maui-nas-03(config-controlle)#framing CRC4
-
Try the other framing format to see if the alarm clears.
If this does not fix the problem, proceed to the «If E1 Receiver Has Loss of Signal» section below.
-
Check the framing format on the remote end.
-
Check the linecoding on the remote end.
If E1 Receiver Has Loss of Signal:
Follow these steps if E1 receiver has loss of signal
-
Make sure that the cable between the interface port and the E1 service provider’s equipment (or E1 terminal equipment) is connected correctly. Check to see if the cable is hooked up to the correct ports. Correct the cable connections if necessary.
-
Check cable integrity. Look for breaks or other physical abnormalities in the cable. Ensure that the pinouts are set correctly. If necessary, replace the cable.
-
Check the cable connectors. A reversal of the transmit and receive pairs or an open receive pair can cause errors. Set the receive pair to lines 1 & 2. Set the transmit pair to lines 4 & 5.
The pins on a RJ-48 jack are numbered from 1 through 8. Pin 1 is the leftmost pin when looking at the jack with the metal pins facing you. Refer to the following figure for more information.
Figure 15-11: RJ-45 Cable
-
Try using a rollover cable.
-
Check to see if there are far-end block errors. If so, the problem exists with the receive lead on the local end. Contact the TAC for more assistance.
Run the show controller e1 EXEC command after each step to check if the controller exhibits any errors.
If the Line is in Loopback Mode:
Check to see if the line is in loopback mode from the show controller e1 output. A line should be in loopback mode only for testing purposes.
To turn off loopback, use the no loopback command in the controller configuration mode as shown below:
maui-nas-03(config-controlle)#no loopback
If the Controller Displays Any Alarms:
Check the show controller command output to see if there are alarms displayed by the controller.
We will now discuss various alarms and the procedure necessary to correct them.
Receiver (Rx) Has Remote Alarm:
A received remote alarm means there is an alarm occurring on the line upstream of the equipment connected to the port.
-
Check to see if the framing format configured on the port matches the framing format of the line. If not, change the framing format on the controller to match that of the line.
-
Check the linecoding setting on the remote-end equipment. Contact your service provider for the correct settings. Correct any misconfigurations as necessary.
-
Insert an external loopback cable into the port. To create a loopback plug, see the section «Performing Hardware Loopback Plug Test,» earlier in the chapter.
-
Check to see if there are any alarms. If you do not see any alarms, then the local hardware is probably in good condition. In that case:
-
Check the cabling. Refer to the section «If E1 Receiver Has Loss of Signal» for more information.
-
Check the settings at the remote end and verify that they match your port settings.
-
If the problem persists, contact your service provider.
-
-
Remove the loopback plug and reconnect your E1 line.
-
Check the cabling. See the section «If E1 Receiver Has Loss of Signal» for more information.
-
Power-cycle the router.
-
Connect the E1 line to a different port. Configure the port with the same settings as that of the line. If the problem does not persist, then the fault lies with the one port:
-
Reconnect the E1 line to the original port.
-
Proceed to the «Troubleshooting E1 Error Events» section.
If the problem persists, then:
-
-
Perform a hardware loop test as described in the section «Performing Hardware loopback Plug Test»
-
Replace the E1 controller card.
-
Proceed to the «Troubleshooting E1 Error Events» section.
Transmitter Sending Remote Alarm (Red):
A Red alarm is declared when the CSU cannot synchronize with the framing pattern on the E1 line.
-
Check to see if the framing format configured on the port matches the framing format of the line. If not change the framing format on the controller to match that of the line.
-
Check the settings at the remote end and verify that they match your port settings.
-
Insert an external loopback cable into the port. To create a loopback plug, see the section «Performing Hardware Loopback Plug Test,» earlier in the chapter.
-
Check to see if there are any alarms. If you do not see any alarms, then the local hardware is probably in good condition. In that case:
-
Check the cabling. Refer to the section «If E1 Receiver Has Loss of Signal» for more information.
-
If the problem persists, contact your service provider.
-
-
Connect the E1 line to a different port. Configure the port with the same settings as that of the line. If the problem does not persist, then the fault lies with the one port.
-
Reconnect the E1 line to the original port.
-
Proceed to the «Troubleshooting E1 Error Events» section.
If the problem persists, then:
-
-
Perform a hardware loop test as described in the section «Performing Hardware Loopback Plug Test.»
-
Replace the E1 controller card.
-
Proceed to the «Troubleshooting E1 Error Events» section.
-
Contact your service provider.
Troubleshooting E1 Error Events
The show controller e1 EXEC command provides error messages that can be used to troubleshoot problems. We will now discuss several error messages and how to correct the errors.
To see if the error counters are increasing, execute the show controller e1 command repeatedly. Note the values of the counters for the current interval. Consult your service provider for framing and linecoding settings.
Slip Secs Counter is increasing:
The presence of slips on E1 lines indicates a clocking problem. The E1 provider (Telco) will provide the clocking to which the Customer Premises Equipment (CPE) should be synchronized.
-
Verify that the clock source is derived from the network. This can be ascertained by looking for Clock Source is Line Primary.
Note: If there are multiple E1s in an access server, only one can be the primary, while the other E1s derive the clock from the primary. In that case, verify that the E1 line designated as the primary clock source is configured correctly.
-
Set the E1 clock source correctly from the controller configuration mode.
maui-nas-03(config-controlle)#clock source line primary
Framing Loss Seconds Counter is Increasing:
Follow these steps when framing loss seconds counter is increasing:
-
Check to see if the framing format configured on the port matches the framing format of the line. You can check this by looking for the Framing is {CRC4|no CRC4} in the show controller e1 output.
-
To change the framing format use the framing {CRC4 | no CRC4} command in the controller configuration mode as shown below:
maui-nas-03(config-controlle)#framing crc4
Line Code Violations are Increasing:
Follow these steps when line code violations are increasing.
-
Check to see if the linecoding configured on the port matches the framing format of the line. You can check this by looking for the Line Code is {AMI/HDB3} in the show controller e1 output.
-
To change the linecoding, use the linecode {ami | hdb3} command in the controller configuration mode as shown below:
maui-nas-03(config-controlle)#linecode ami
Verifying that ISDN Switch Type and PRI-Group are Configured Correctly
Use the show running-config command to check if ISDN switch type and the PRI-group timeslots are configured correctly. Contact your service provider for correct values.
To change the ISDN switch type and PRI-group:
maui-nas-03#configure terminal
maui-nas-03(config)#isdn switch-type primary-net5
maui-nas-03(config)#controller e1 0
maui-nas-03(config-controlle)#pri-group timeslots 1-31
Verifying the Signaling Channel
If the error counters do not increase but the problem persists, verify that the signaling channel is up and configured correctly.
-
Run the show interface serial x:15 command, where x should be replaced by the interface number.
-
Check to see if the interface is up. If the interface is not up, use the no shutdown command to bring the interface up.
maui-nas-03#config terminal
Enter configuration commands, one per line.  End with CNTL/Z.
maui-nas-03(config)#interface serial 0:15
maui-nas-03(config-if)#no shutdown
-
Ensure that encapsulation is PPP. If the interface is not using PPP, then use the encapsulation ppp command in the interface configuration mode to correct it.
maui-nas-03(config-if)#encapsulation ppp
-
Check to see if loopback is set. Loopback should be set only for testing purposes. Use the no loopback command to remove loopbacks.
maui-nas-03(config-if)#no loopback
-
Power-cycle the router.
-
If the problem persists, contact your service provider or the Cisco TAC.
Troubleshooting a PRI
When troubleshooting a PRI, you need to determine if the E1 is running cleanly on both ends. If Layer 1 problems have been resolved as described above, consider Layer 2 and Layer 3 problems.
Troubleshooting Using the show isdn status Command
The show isdn status command is used to display a snapshot of all ISDN interfaces. It displays the status of Layers 1, 2 and 3.
-
Verify that Layer 1 is active.
The Layer 1 status should always say ACTIVE unless the E1 is down.
If show isdn status indicates that Layer 1 is DEACTIVATED, then there is a problem with the physical connectivity on the E1 line. See the section «Is the E1 Controller Administratively Down?»
Also verify that the E1 is not administratively down. Use the no shutdown command to bring the E1 controller up.
-
Check to see if the Layer 2 State is MULTIPLE_FRAME_ESTABLISHED.
The desired Layer 2 state is Multiple_Frame_Established, which indicates the startup protocol between ISDN switch and end-device has been established and we are exchanging Layer 2 frames.
If Layer 2 is not Multiple_Frame_Established, use the show controller e1 EXEC command to diagnose the problem. See «Troubleshooting Using the show controller e1 Command» section in this chapter and the «Troubleshooting E1 Error Events» section.
Because show isdn status is a snapshot of the current status, it is possible that Layer 2 is bouncing up and down despite indicating Mulitple_Frame_Established. Use the debug isdn q921 command to verify that Layer 2 is stable.
Using debug q921
The debug isdn q921 command displays data link layer (Layer 2) access procedures that are taking place at the router on the D-channel.
Ensure that you are configured to view debug messages by using the logging console or terminal monitor command as necessary.
Note: In a production environment, verify that console logging is disabled. Enter the show logging command. If logging is enabled, the access server may intermittently freeze up as soon as the console port gets overloaded with log messages. Enter the no logging console command.
Note: If debug isdn q921 is turned on and you do not receive any debug outputs, place a call or reset the controller to get debug outputs.
-
Verify that Layer 2 is stable. You should observe the debug outputs for messages indicating that the service is not bouncing up and down. If you see the following types of debug outputs, the line is not stable.
Mar 20 10:06:07.882: %ISDN-6-LAYER2DOWN: Layer 2 for Interface Se0:15, TEI 0
changed to down
Mar 20 10:06:09.882: %LINK-3-UPDOWN: Interface Serial0:15, changed state to down
Mar 20 10:06:21.274: %DSX1-6-CLOCK_CHANGE: Controller 0  clock is now selected
as clock source
Mar 20 10:06:21.702: %ISDN-6-LAYER2UP: Layer 2 for Interface Se0:15, TEI 0
changed to up
Mar 20 10:06:22.494: %CONTROLLER-5-UPDOWN: Controller E1 0, changed state to up
Mar 20 10:06:24.494: %LINK-3-UPDOWN: Interface Serial0:15, changed state to up
If Layer 2 does not appear to be stable, see «Troubleshooting E1 Error Events,» earlier in this chapter.
-
Verify that you are seeing only SAPI messages in both transmit (TX) and Receive (RX) sides.
Mar 20 10:06:52.505: ISDN Se0:15: TX ->  RRf sapi = 0  tei = 0  nr = 0
Mar 20 10:06:52.505: ISDN Se0:15: RX <-  RRf sapi = 0  tei = 0  nr = 0
Mar 20 10:07:22.505: ISDN Se0:15: TX ->  RRp sapi = 0  tei = 0 nr = 0
Mar 20 10:07:22.509: ISDN Se0:15: RX <-  RRp sapi = 0  tei = 0 nr = 0
Mar 20 10:07:22.509: ISDN Se0:15: TX ->  RRf sapi = 0  tei = 0  nr = 0
Mar 20 10:07:22.509: ISDN Se0:15: RX <-  RRf sapi = 0  tei = 0  nr = 0
-
Verify that you are not seeing SABME messages, which indicates that Layer 2 is trying to reinitialize. This is usually seen when we are transmitting poll requests (RRp) and not getting a response from the switch (RRf) or vice-versa. Below are example of SABME messages. We should get a response from ISDN switch for our SABME messages (UA frame received).
Mar 20 10:06:21.702: ISDN Se0:15: RX <-  SABMEp sapi = 0  tei = 0
Mar 20 10:06:22.494: ISDN Se0:15: TX ->  SABMEp sapi = 0  tei = 0
If you are seeing SABME messages, use the show running-config command to check if ISDN switch type and the PRI-group timeslots are configured correctly. Contact your service provider for correct values.
To change the ISDN switch type and PRI-group:
maui-nas-03#configure terminal
maui-nas-03(config)#isdn switch-type primary-net5
maui-nas-03(config)#controller e1 0
maui-nas-03(config-controlle)#pri-group timeslots 1-31
-
Verify that the D-channel is up using the show interfaces serial x:15 command.
If the D-channel is not up, then use the no shutdown command to bring it up:
maui-nas-03(config)#interface serial 0:15
maui-nas-03(config-if)#no shutdown
-
Check to see if encapsulation is PPP. If not use the encapsulation ppp command to set encapsulation.
maui-nas-03(config-if)#encapsulation ppp
-
Check to see if the interface is in loopback mode. For normal operation, the interface should not be in loopback mode.
maui-nas-03(config-if)#no loopback
-
Power-cycle the router.
-
If the problem persists, contact your service provider or the Cisco TAC.
Related Information
- Technical Support — Cisco Systems