Istio is a complex system. For the applications, the main component is the sidecar container Istio-Proxy, which proxies while traffic from all containers in Pod. And this can lead to some issues.
This post describes one of the most complicated problems I have encountered in my career.
The problem — Connection Reset 🐛
During Istio on a huge system, with more than different 40 microservices, on a single endpoint, QA engineers found a bug. It was POST endpoint, which was returning chunked data.
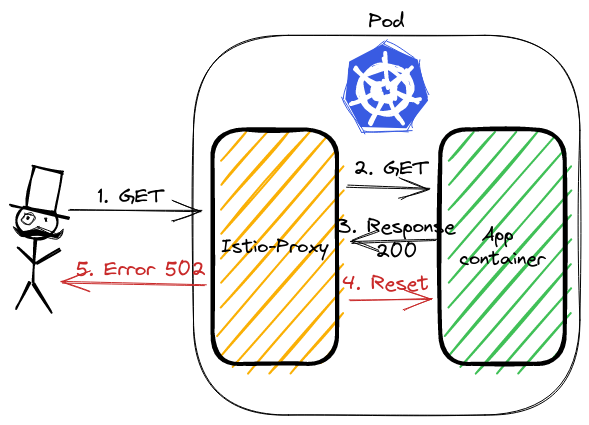
Istio was returning error 502, in logs were visible additional flag: upstream_reset_before_response_started. The application logs were confirming, that the result was correct.
In legacy Istio versions of the presented problem Istio were returning
503error withUCflag.
Analyzing issue ⛏️
Lest see the curl response and look at Istio-proxy logs:
kubectl exec -it curl-0 -- curl http://http-chunked:8080/wrong -v
< HTTP/1.1 502 Bad Gateway
< content-length: 87
< content-type: text/plain
< date: Sun, 24 Apr 2022 12:28:28 GMT
< server: istio-envoy
< x-envoy-decorator-operation: http-chunked.default.svc.cluster.local:8080/*
upstream connect error or disconnect/reset before headers. reset reason: protocol error

$ kubectl logs http-chunked-0 -c istio-proxy
[2022-04-24T12:23:37.047Z] "GET /wrong HTTP/1.1" 502 UPE upstream_reset_before_response_started{protocol_error} - "-" 0 87 1001 - "-" "curl/7.80.0" "3987a4cb-2e0e-4de6-af66-7e3447600c73" "http-chunked:8080" "10.244.0.17:8080" inbound|8080|| 127.0.0.6:39063 10.244.0.17:8080 10.244.0.14:35500 - default
Time for spying 🕵🏻♂️
To analyze the traffic we can use tcpdump and Wireshark. Istio-proxy runs as a sidecar, which routes whole incoming and outgoing traffic to pod through own proxy.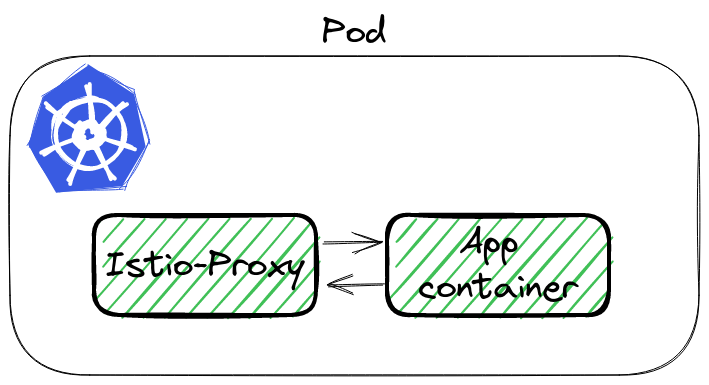
To sniff traffic there are 3 ways:
- Running tcpdump in
istio-proxycontainer, - Using
kubectlpluginksinff— a plugin to kubectl to dump packets from pod, github repo, - Adding additional container to pod, with
rootpermission andtcpdumpinstalled,
First will not work by default, because istio-proxy runs without root permission. The third is the backup if 1 and 2 would not work. Let’s try ksniff.
What is ksniff 🛠️
ksniff in three words is a plugin that:
- figures out what node is running pod with an app,
- deploys an own pod with an affinity to that node, bound to the host network,
- opens Wireshark on your laptop with a packet stream from the application.
Let’s execute it to sniff our application:
kubectl sniff http-chunked-0 -c istio-proxy -p -f '-i lo' -n default
Important parameters
-pis parameter to support sniffing even if the pod is non-priviledged. See docs,-f '-i lo'passes filter to tcpdump, we want to sniff localhost interface inside the Pod.
If there is no issue, our system has Wireshark in PATH, ksniff should open a new window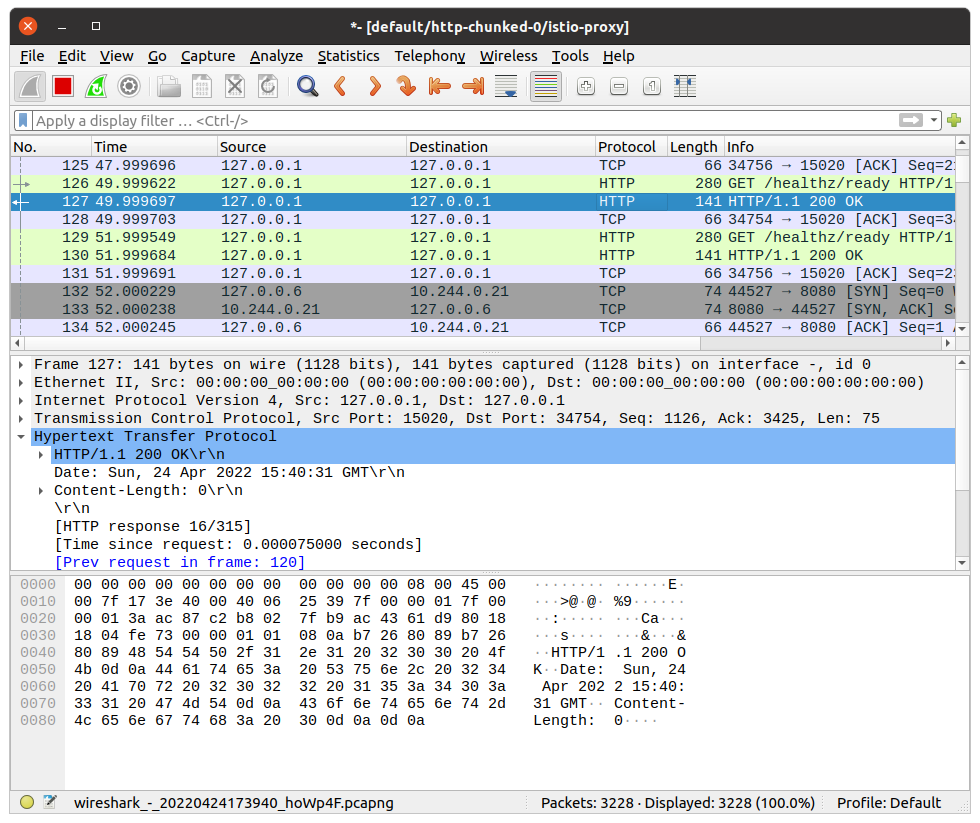
Finding the root cause 🔎
Wireshark will continuously follow with new packet records. It makes it hard to figure out our particular call. We can youse filters to help with searching. Knowing the request path, method, response code — we can use it to find our packet using filter:
http.request.uri == "/wrong"
It shows only a single packet, our request. Wireshark allows to show the whole TCP conversation:
- click right click on the packet,
- go to
Conversation Filter, - select
TCP.
Wireshark will write a filter to show the whole communication between istio-proxy container and the application container!
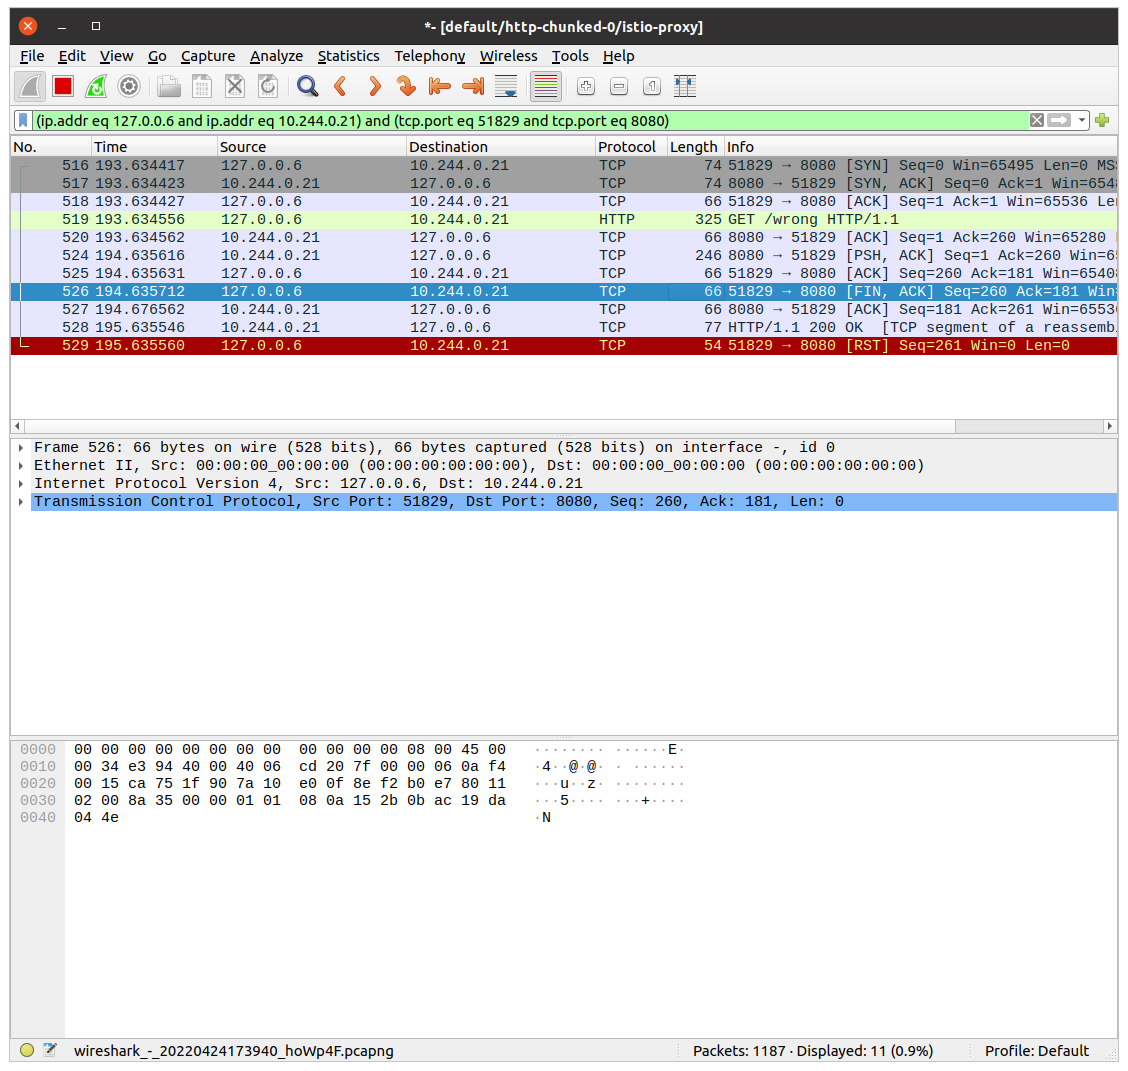
Let’s see the above image. The first 3 records are the three-way handshake packets. Later is our GET request. The most interesting happens in the last two packets. Application container returns response HTTP 200 OK. istio-proxy then closes the connection with RST packet.
This is what we saw in the logs. The flag was upstream_reset_before_response_started{protocol_error}. But why? This still does not explain.
Swiss knife by Wireshark 🪛
It is hard to read the HTTP protocol from multiple packets bodies. But also there Wireshark has a solution. We can see data from L7, the application one. In our case, it is the HTTP protocol.
Click with the right mouse on a single packet, go to the Follow tab, and select TCP Stream:
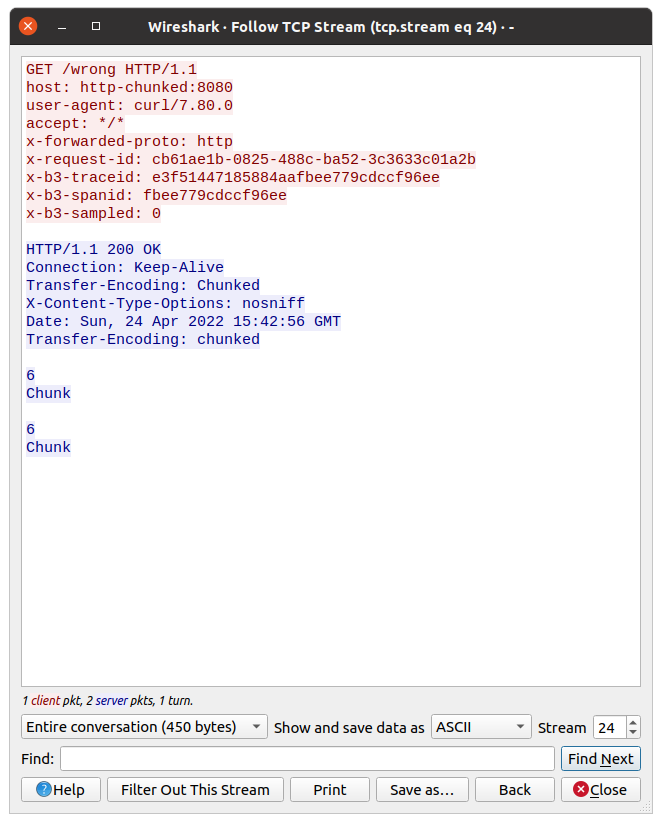
Now we can check what the request from istio-proxy looked like, and what was the response from the app.
Do you have an idea from the above picture?
Look closer at the response, there is a double Transfer-Encoding header. One starts from uppercase, the second one does not.
Searching over Istio issues I found this answer. The most important are first 2 points:
- two
transfer-encoding: chunkedis equivalent totransfer-encoding: chunked, chunkedas per RFC,transfer-encoding: chunked, chunkeddoesn’t have the same semantic astransfer-encoding: chunked
Why the response was taken as double-chunked? According to Transfer Codings in Section 4, transfer-coding names are case-insensitive.
Summary 📓
As you see, Istio stands as a guard 👮♂️ of the HTTP protocol. If the app is returning a double-chunked response, then Istio requires it, otherwise, it rejects processing the request. curl ignores this inconsistency.
This issue was one of the most difficult tasks, which I ever had 
Infrastructure to reproduce and example app 🏭
In Github repository I created example infrastructure to reproduce the problem.
Bootstrap of the infrastructure installs ArgoCD, Istio and the App. The sample app exposes two endpoints:
/correct— endpoint, which creates a streamed response,/wrong— is doing same as above, but additionally it set value of theTransfer-Encodingheader toChunked(uppercase).
I would like to thank Przemysław for his help and for showing me how to use Wireshark efficiently during this issue.🤝🏻
Hello,
We have the same issue, i read all opened tickets about this. One thing is that we don’t use sidecar, we notice some sporadic 503’s (mostly from our external monitoring tool). we were using istio 1.0.2 for some time now.
I installed 1.1.7 yesterday and we still have this issue,
logs from istio-ingressgateway:
{"log":"[2019-05-29T11:48:56.105Z] "GET / HTTP/1.1" 503 UC "-" 0 95 288 - "10.234.76.0" "Go-http-client/1.1" "0bede68c-a8a3-4d84-a8e9-1b0ea9f21beb" "npm.deez.re" "10.234.41.169:4873" outbound|4873||verdaccio.coreinfra.svc.dev.kubernetes - 10.234.23.18:80 10.234.76.0:54740 -n","stream":"stdout","time":"2019-05-29T11:49:03.638779538Z"}
logs from the app(verdaccio) at the same time:
{"log":" http u003c-- 200, user: null(10.234.61.0), req: 'GET /', bytes: 0/1042n","stream":"stdout","time":"2019-05-29T11:48:53.279570381Z"}
{"log":" http u003c-- 200, user: null(10.234.23.1 via 10.234.23.0), req: 'HEAD /', bytes: 0/0n","stream":"stdout","time":"2019-05-29T11:48:53.430792718Z"}
{"log":" http u003c-- 200, user: null(10.234.61.0), req: 'GET /', bytes: 0/1042n","stream":"stdout","time":"2019-05-29T11:48:54.297110264Z"}
{"log":" http u003c-- 200, user: null(10.234.23.0 via 10.234.76.0), req: 'HEAD /', bytes: 0/0n","stream":"stdout","time":"2019-05-29T11:48:54.448685695Z"}
{"log":" http u003c-- 200, user: null(10.234.61.0), req: 'GET /', bytes: 0/1042n","stream":"stdout","time":"2019-05-29T11:48:55.31475736Z"}
{"log":" http u003c-- 200, user: null(10.234.23.0 via 10.234.76.0), req: 'HEAD /', bytes: 0/0n","stream":"stdout","time":"2019-05-29T11:48:55.466233909Z"}
{"log":" http u003c-- 200, user: null(10.234.61.0), req: 'GET /', bytes: 0/1042n","stream":"stdout","time":"2019-05-29T11:48:56.675295282Z"}
{"log":" http u003c-- 200, user: null(10.234.23.1 via 10.234.23.0), req: 'HEAD /', bytes: 0/0n","stream":"stdout","time":"2019-05-29T11:48:56.675736777Z"}
{"log":" http u003c-- 200, user: null(10.234.41.1), req: 'GET /-/ping', bytes: 0/3n","stream":"stdout","time":"2019-05-29T11:48:57.38159729Z"}
{"log":" http u003c-- 200, user: null(10.234.61.0), req: 'GET /', bytes: 0/1042n","stream":"stdout","time":"2019-05-29T11:48:57.692149781Z"}
{"log":" http u003c-- 200, user: null(10.234.23.0 via 10.234.76.0), req: 'HEAD /', bytes: 0/0n","stream":"stdout","time":"2019-05-29T11:48:57.692597648Z"}
{"log":" http u003c-- 200, user: null(10.234.61.0), req: 'GET /', bytes: 0/1042n","stream":"stdout","time":"2019-05-29T11:48:58.710610856Z"}
{"log":" http u003c-- 200, user: null(10.234.23.0 via 10.234.76.0), req: 'HEAD /', bytes: 0/0n","stream":"stdout","time":"2019-05-29T11:48:58.711203625Z"}
{"log":" http u003c-- 200, user: null(10.234.76.0 via 10.234.23.0), req: 'GET /', bytes: 0/454n","stream":"stdout","time":"2019-05-29T11:48:58.841457719Z"}
it happens for others services/apps as well when using istio.
NodePort services (not using the ingress) doesn’t have this issue
We ran tests all nights:
curl on pod directly => 200 only
curl on ingress => some 503
Istio was installed with these:
helm template install/kubernetes/helm/istio --name istio --namespace istio-system --set global.proxy.accessLogFile="/dev/stdout" --set global.proxy.clusterDomain=dev.kubernetes --set prometheus.service.nodePort.enabled=true --set sidecarInjectorWebhook.enabled=false --set global.proxy.includeIPRanges=100.64.0.0/16 --set gateways.istio-ingressgateway.type=NodePort --set gateways.istio-ingressgateway.autoscaleMin=2 --set pilot.autoscaleMin=2 --set gateways.istio-ingressgateway.nodeSelector.node-role\.kubernetes\.io/master="true" > istio1.1.7.yaml
If you have any questions, i’d like to fix this asap
thanks
описание проблемы
Среда K8s (v1.13.5) + Istio (v1.1.7) была установлена в тестовой среде, и в один день в кластере Istio было выпущено более 30 сервисов (интерфейсные, внутренние, шлюз), и связанные с Istio были настроены правила маршрутизации. Позже я с полной уверенностью проверил маршрутизацию между службами, только щелкнув внешнюю страницу, чтобы вызвать шлюз, а затем шлюз вызвал другие внутренние службы (веб-интерфейс -> шлюз -> серверная часть). end service), но в фактическом тесте В процессе, шлюз всегда будет сообщать код ответа http внутренней службы 503, а сам шлюз также время от времени будет сообщать код ошибки 503, и кажется, что нет никакой закономерности в сроках сообщения об ошибке, что меня смущает … ..
Связанная проблема
Первое, что приходит в голову, это найти связанные проблемы в github-> istio. Для конкретных проблем, пожалуйста, перейдите по следующей ссылке:
503 «upstream connect error or disconnect/reset before headers» in 1.1 with low traffic
Sporadic 503 errors
Almost every app gets UC errors, 0.012% of all requests in 24h period
В выпуске много дискуссий по поводу 503. Istio представила концепцию sidecar (посланник). Простое понимание sidecar — это прокси локальной сети, висящий перед каждым конкретным приложением в сервисной сетке (соответствует Pod в K8s. . Существует несколько контейнеров: istio-proxy, app, оба могут обмениваться данными через localhost). В Istio дополнительный компонент реализован за счет расширения Envoy. Дополнительный элемент обеспечивает удобство (маршрутизация, предохранитель, конфигурация пула соединений и т. Д.), Но В то же время это также усложняет вызовы между службами. Исходный простой вызов Application1-> Application2 становится вызовом Application1-> Envoy1-> Envoy2-> Application2 в Istio, как показано ниже:

По сути, любые проблемы в процессе связи между Envoy2 и Application2 будут упакованы в 503, отправлены обратно в Enovy1 и, наконец, возвращены в Application1.
Путем повторного изучения Issue было обнаружено, что проблема 503, обычно упоминаемая в Issue, связана с тем, что пул соединений в Envoy2 кэширует недопустимые соединения в Applicaiton2. Envoy2 вызывает Application2 через недопустимое соединение, вызывая сброс соединения, а затем инкапсулирует Envoy2 как 503 и вернулся к нижестоящему вызывающему,
Типичные характеристики этого 503 можно просмотреть в журнале istio-proxy соответствующего приложения.Команда для настройки уровня журнала istio-proxy выглядит следующим образом:
curl -X POST localhost:15000/logging?level=trace
Типичный журнал 503 выглядит следующим образом:
[2019-06-28 13:02:36.790][37][debug][pool] [external/envoy/source/common/http/http1/conn_pool.cc:97] [C26] using existing connection
[2019-06-28 13:02:36.790][37][debug][router] [external/envoy/source/common/router/router.cc:1210] [C21][S3699665653477458718] pool ready
[2019-06-28 13:02:36.790][37][debug][connection] [external/envoy/source/common/network/connection_impl.cc:518] [C26] remote close
[2019-06-28 13:02:36.790][37][debug][connection] [external/envoy/source/common/network/connection_impl.cc:188] [C26] closing socket: 0
[2019-06-28 13:02:36.791][37][debug][client] [external/envoy/source/common/http/codec_client.cc:82] [C26] disconnect. resetting 1 pending requests
[2019-06-28 13:02:36.791][37][debug][client] [external/envoy/source/common/http/codec_client.cc:105] [C26] request reset
[2019-06-28 13:02:36.791][37][debug][router] [external/envoy/source/common/router/router.cc:671] [C21][S3699665653477458718] upstream reset: reset reason connection termination
[2019-06-28 13:02:36.791][37][debug][http] [external/envoy/source/common/http/conn_manager_impl.cc:1137] [C21][S3699665653477458718] Sending local reply with details upstream_reset_before_response_started{connection termination}
[2019-06-28 13:02:36.791][37][debug][filter] [src/envoy/http/mixer/filter.cc:141] Called Mixer::Filter : encodeHeaders 2
[2019-06-28 13:02:36.791][37][debug][http] [external/envoy/source/common/http/conn_manager_impl.cc:1329] [C21][S3699665653477458718] encoding headers via codec (end_stream=false):
‘:status’, ‘503’
‘content-length’, ’95’
‘content-type’, ‘text/plain’
‘date’, ‘Fri, 28 Jun 2019 13:02:36 GMT’
‘server’, ‘istio-envoy’
В приведенном выше журналеupstream reset: reset reason connection terminationЭто означает, что соединение в пуле соединений посланника было прервано;
Базовое решение
Для решения вышеуказанных проблем можно использовать следующие 4 метода оптимизации:
(1) Измените HTTPRetry (попытки, perTryTimeout, retryOn) в VirtualService и установите стратегию повтора ошибок.
(Примечание: вам необходимо установить тайм-аут в Envoy одновременно (ссылка на Envoy), то есть общее время повтора должно быть меньше тайм-аута,
HttpRoute.timeout необходимо установить одновременно в Istio);
(2) Измените HTTPSettings.idleTimeout в DestinationRule, чтобы установить время простоя кэширования соединений в пуле соединений envoy;
(3) Измените HTTPSettings.maxRequestsPerConnection в DestinationRule на 1 (закройте Keeplive, соединение не будет повторно использоваться и производительность снизится);
(4) Измените tomcat connectionTimeout (конфигурация Springboot server.connectionTimeout), чтобы увеличить время ожидания соединения для веб-контейнера;
В то же время вы можете обратиться к следующей статье, чтобы узнать о методах устранения неполадок 503 в Istio:
[Английская версия] Istio: 503’s с UC’s и TCP Fun Times
[Китайская версия] Istio: 503, UC и TCP
В целом расследование делится на 4 основных метода:
(1) Просмотр записей отслеживания JagerUI (установка теговerror=true);
(2) Просмотр метрик (Istio, Envoy);
(3) Просмотрите журнал отладки istio-proxy;
(4) захват сетевых пакетов;
Я использовал только методы (1) (3) (4) в самом процессе устранения неполадок.
JaggerUI
При использовании метода (1) Jagger для устранения проблем (вы можете временно установить PILOT_TRACE_SAMPLING на 100, то есть отслеживать все), вам необходимо обратить внимание на следующие моменты:
(1) Установите ошибку тегов = true в условиях запроса, чтобы быстро найти информацию для отслеживания ошибок;

(2) Обратите внимание на информацию response_flags в деталях отслеживания. Это поле указывает тип отказа ответа и может быстро определить причину отказа;

См. Описание response_flagsДокументация посланника:

журнал istio-proxy
В методе использования (3) установите уровень журнала istio-proxy на отладку (трассировку) и сосредоточьтесь на следующем содержимом журнала:
(1) код ответа HTTP, например «503»;
(2) Найдите соответствующий журнал над кодом ответа http (например, 503):upstream reset: reset reason connection termination, Причина неудачного позиционирования;
(3) Продолжайте искать способ подключения выше:using existing connection | creating a new connection(Существующее соединение ИЛИ новое соединение);
обычноУже подключенПроблема в том, что соединение, кэшированное в пуле соединений enovy, вначале недействительно, иНовое соединениеЕсли есть проблема, вам нужно найти другие причины. Ниже будет показано, с чем я столкнулся на практике.Новое соединениеОбъясните проблему;
Сетевой захват
Вы можете использовать плагин kubectl ksniff, но мне не удалось выполнить фактический процесс использования (проблема в том, что wirehark-gtk не запустился), поэтому была использована исходная команда tcpdump. Основные шаги следующие:
(1) Войдите в операционную среду контейнера приложения: kubectl exec -it xxx -c app -n tsp / bin / bash;
(2) Выполните команду tcpdump и выведите результат в файл: sudo tcpdump -ni lo port 8080 -vv -w my-packets.pcap;
-i определяет сетевую карту как lo (loopback) и наблюдает только за трафиком между локальным Envoy и приложением (Envoy и приложение находятся на одном хосте и обмениваются данными через localhost)
-n display ip (преобразовать домен в IP)
порт указывает, что отслеживается только порт 8080 (порт связи, доступный для приложения)
-vv показать подробную информацию
-w Указанный результат выводится в файл my-packet.pcap
(3) Войдите в рабочий узел модуля и скопируйте файл результатов my-packets.pcap на шаге (2) на узел узла через docker cp;
(4) Получите my-packets.pcap на хосте узла и просмотрите его через wirehark;
Примечание. Контейнер istio-proxy является файловой системой только для чтения и не может записывать файлы, поэтому выберите приложение для tcpdump в конкретном контейнере приложения;
Источник моей проблемы
После вышеупомянутого броска я изменил свои VirtualService и DestionationRule, но проблема 503. Я также рассмотрел, было ли это связано с ограничениями подключения хоста и настройками сети (ulimit, tcp_tw_recycle и т. Д.). Версия Istio была обновлена (с 1.1.7 до 1.1.11, версия после 1.1.7 содержит исправление для ошибки 503), но, как бы сложно это ни было, версия 503 не была удалена;
И что странно, на гитхабе все говорилиusing existing connectionПроблема возникает, но яcreating a new connectionПроблема, мой полный журнал выглядит следующим образом:
[2019-07-16 08:59:23.853][31][debug][pool] [external/envoy/source/common/http/http1/conn_pool.cc:92] creating a new connection
[2019-07-16 08:59:23.853][31][debug][client] [external/envoy/source/common/http/codec_client.cc:26] [C297] connecting
[2019-07-16 08:59:23.853][31][debug][connection] [external/envoy/source/common/network/connection_impl.cc:644] [C297] connecting to 127.0.0.1:8080
[2019-07-16 08:59:23.853][31][debug][connection] [external/envoy/source/common/network/connection_impl.cc:653] [C297] connection in progress
[2019-07-16 08:59:23.853][31][debug][pool] [external/envoy/source/common/http/conn_pool_base.cc:20] queueing request due to no available connections
[2019-07-16 08:59:23.853][31][debug][filter] [src/envoy/http/mixer/filter.cc:94] Called Mixer::Filter : decodeData (84, false)
[2019-07-16 08:59:23.853][31][debug][http] [external/envoy/source/common/http/conn_manager_impl.cc:1040] [C93][S18065063288515590867] request end stream
[2019-07-16 08:59:23.853][31][debug][filter] [src/envoy/http/mixer/filter.cc:94] Called Mixer::Filter : decodeData (0, true)
[2019-07-16 08:59:23.853][31][debug][connection] [external/envoy/source/common/network/connection_impl.cc:526] [C297] delayed connection error: 111
[2019-07-16 08:59:23.853][31][debug][connection] [external/envoy/source/common/network/connection_impl.cc:183] [C297] closing socket: 0
[2019-07-16 08:59:23.853][31][debug][client] [external/envoy/source/common/http/codec_client.cc:82] [C297] disconnect. resetting 0 pending requests
[2019-07-16 08:59:23.853][31][debug][pool] [external/envoy/source/common/http/http1/conn_pool.cc:133] [C297] client disconnected, failure reason:
[2019-07-16 08:59:23.853][31][debug][pool] [external/envoy/source/common/http/http1/conn_pool.cc:173] [C297] purge pending, failure reason:
[2019-07-16 08:59:23.853][31][debug][router] [external/envoy/source/common/router/router.cc:644] [C93][S18065063288515590867] upstream reset: reset reason connection failure
[2019-07-16 08:59:23.853][31][debug][filter] [src/envoy/http/mixer/filter.cc:133] Called Mixer::Filter : encodeHeaders 2
[2019-07-16 08:59:23.853][31][trace][http] [external/envoy/source/common/http/conn_manager_impl.cc:1200] [C93][S18065063288515590867] encode headers called: filter=0x5c79f40 status=0
[2019-07-16 08:59:23.853][31][debug][http] [external/envoy/source/common/http/conn_manager_impl.cc:1305] [C93][S18065063288515590867] encoding headers via codec (end_stream=false):
‘:status’, ‘503’
‘content-length’, ’91’
‘content-type’, ‘text/plain’
‘date’, ‘Tue, 16 Jul 2019 08:59:23 GMT’
‘server’, ‘istio-envoy’
Через журнал я обнаружил, что моя проблема возникла, когда Enovy подключился к локальному приложению 127.0.0.1:8080 порту.connection failure, И response_flags в JaggerUI — это UF (сбой соединения с восходящей службой), и этот сбой является периодическим, иногда успешным, а иногда — неудачным;

В пятницу утром, когда погода была ясной (после почти недели метания> _ <|||), я заметил следующее явление:
Проверьте мой контейнер приложения через приложение docker ps | grep, почему все контейнеры приложения были активны 6 или 7 минут;
Похоже, проблема обнаружена. Так много контейнеров обычно работают в течение 6 или 7 минут, что означает, что контейнер приложения постоянно перезапускается. Причина перезапуска контейнера приложения заключается в том, что проверка работоспособности K8s не удалась. Сразу поехал проверять работоспособность K8s. Проверяем конфигурацию:

Порт, предоставленный контейнером, содержитPort = 8080, а tcpSocket.port, установленный в livenessProbe, равен 80. Эти два значения не совсем правильные, и из-за конфигурации проверки работоспособности:
Отложенное обнаружение 300 с (5 минут) + первая ошибка обнаружения + неудачная повторная попытка (3-1) раза * Интервал повторной попытки 60 с = 5 минут + 2 * 1 минута = более 7 минут (примерно от 7 до 8 минут)
В результате приложение будет обнаружено как неисправное через 7-8 минут, что приведет к тому, что контейнер приложения будет работать не более 8 минут, и он будет постоянно перезапускаться, а процесс перезапуска неизбежно приведет к тому, что посланник будет подключиться к приложению.connection failure, Существует также периодически возникающая проблема 503. В то же время, наблюдение, что интерфейсный интерфейс (синхронизированный пульс) запрашивает у серверной службы отчет за период времени 503, также согласуется со временем перезапуска контейнера приложения, кроме того подтверждающие причину сбоя подключения:
Ошибка конфигурации проверки работоспособностиВызвать непрерывный перезапуск контейнера приложения и вызвать его во время процесса перезапускаconnection failure;
После изменения livenessProbe во всех развертываниях предыдущая проблема 503 исчезла …
Я могу снова пойти повеселиться в эти выходные …
подводить итоги
Из-за моей неосторожности была вызвана ошибка конфигурации проверки работоспособности, которая, в свою очередь, вызвала проблемы с Istio 503. У меня до сих пор нет полного понимания соответствующей конфигурации, и мне нужно углубить исследование;
Однако, устраняя проблему 503, я лучше понимаю метод устранения неполадок Isito, и я могу быстро найти проблему в будущем;
Не сдавайся легкомысленно …
In the previous article, we fixed a DNS time out issue in our EKS cluster by upgrading the kernel and using the NodeLocalDNS. Then we got into another issue of getting 503 from services randomly. We are using Istio Service Mesh .
Problem :-
We started debugging to find out where and why connections are getting dropped. From the logs, we found out that the requests were reaching to the istio-proxy sidecar but it was not forwarded to the application container. Most of the 503 errors were for inbound traffic in the istio access log. On further debugging and istio documentation, we found that when a request arrives at Istio-proxy, it opens up a connection with the application container. These connections are cached at istio for better performance. But from the application side these connections have some idle timeouts. 503 errors were a result of istio forwarding requests to one of those closed connection from the application side due to idle timeout. We thought to disable the istio-proxy caching, but it would affect the performance.
Enabling retry in Virtual Service :-
We considered to add a retry option, which will basically retry if any request fails due to some specific connection errors. By doing so we can avoid disabling the istio-proxy caching and handle closed connections. This is defined in VirtualService. With following configuration, it will try to attempt the request 3 times in case of mentioned error. We are setting the retries on gateway-error, connect-failure and refused-stream errors. perTryTimeout can also be configured.
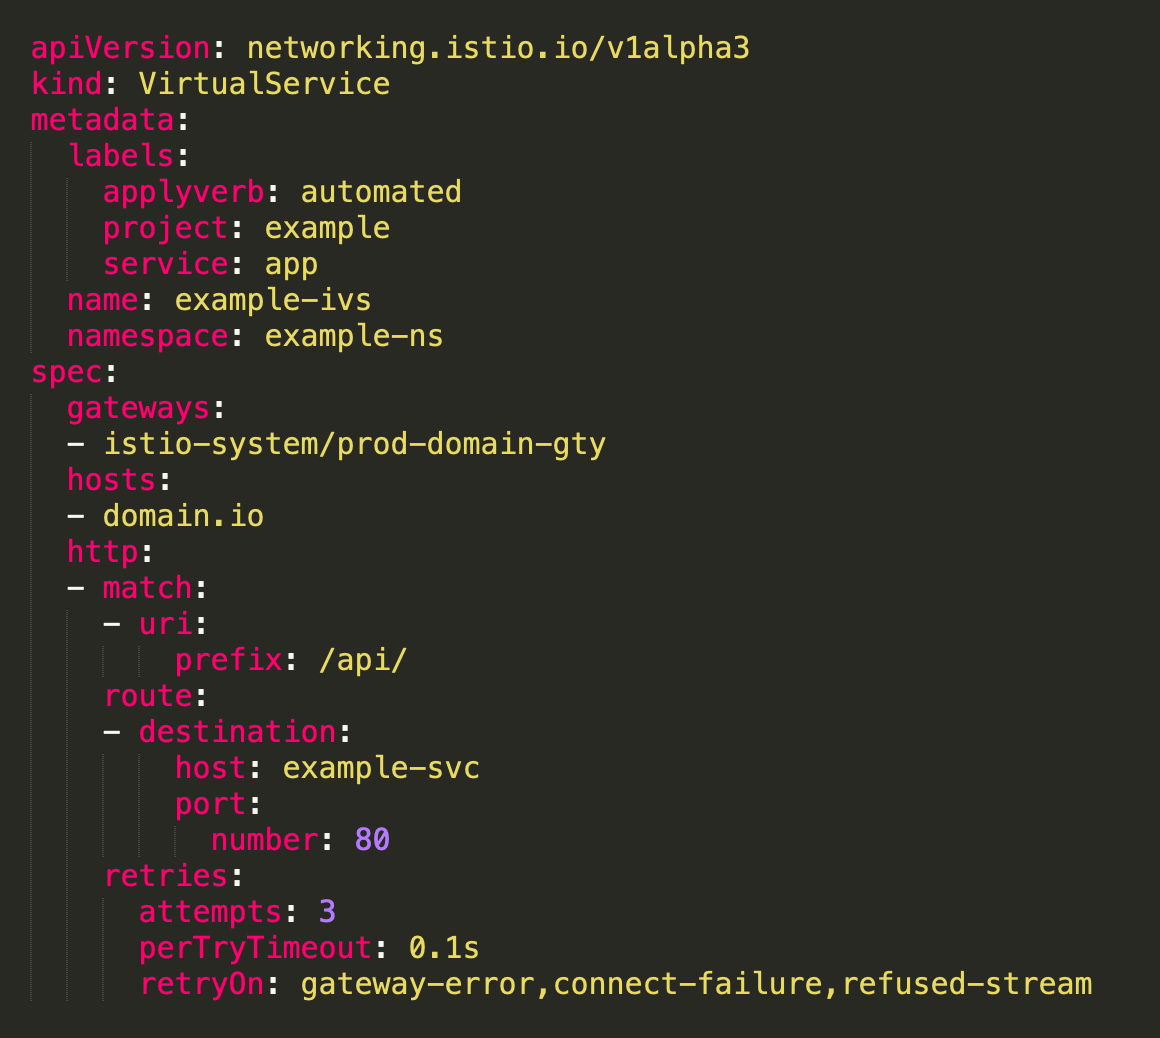
We have a retry time out of 0.1 sec and it varies from application to application. It will do an attempt to reinitiate the request.
To test it, we created a dummy application and an end point which will return 503 in response code. We verified in istio logs that requests were retied thrice before returning the error response to the client. Following is a basic flask app, which returns a message and 503 in response code for the route /dnschecker.
@app.route('/dnschecker')
def home_page():
	return "This is to check DNS timeouts issue in istio-proxy", 503
End point to trigger the retry attempts,
https://host/dnscheckerIn the log we can see 3 consecutive attempts,
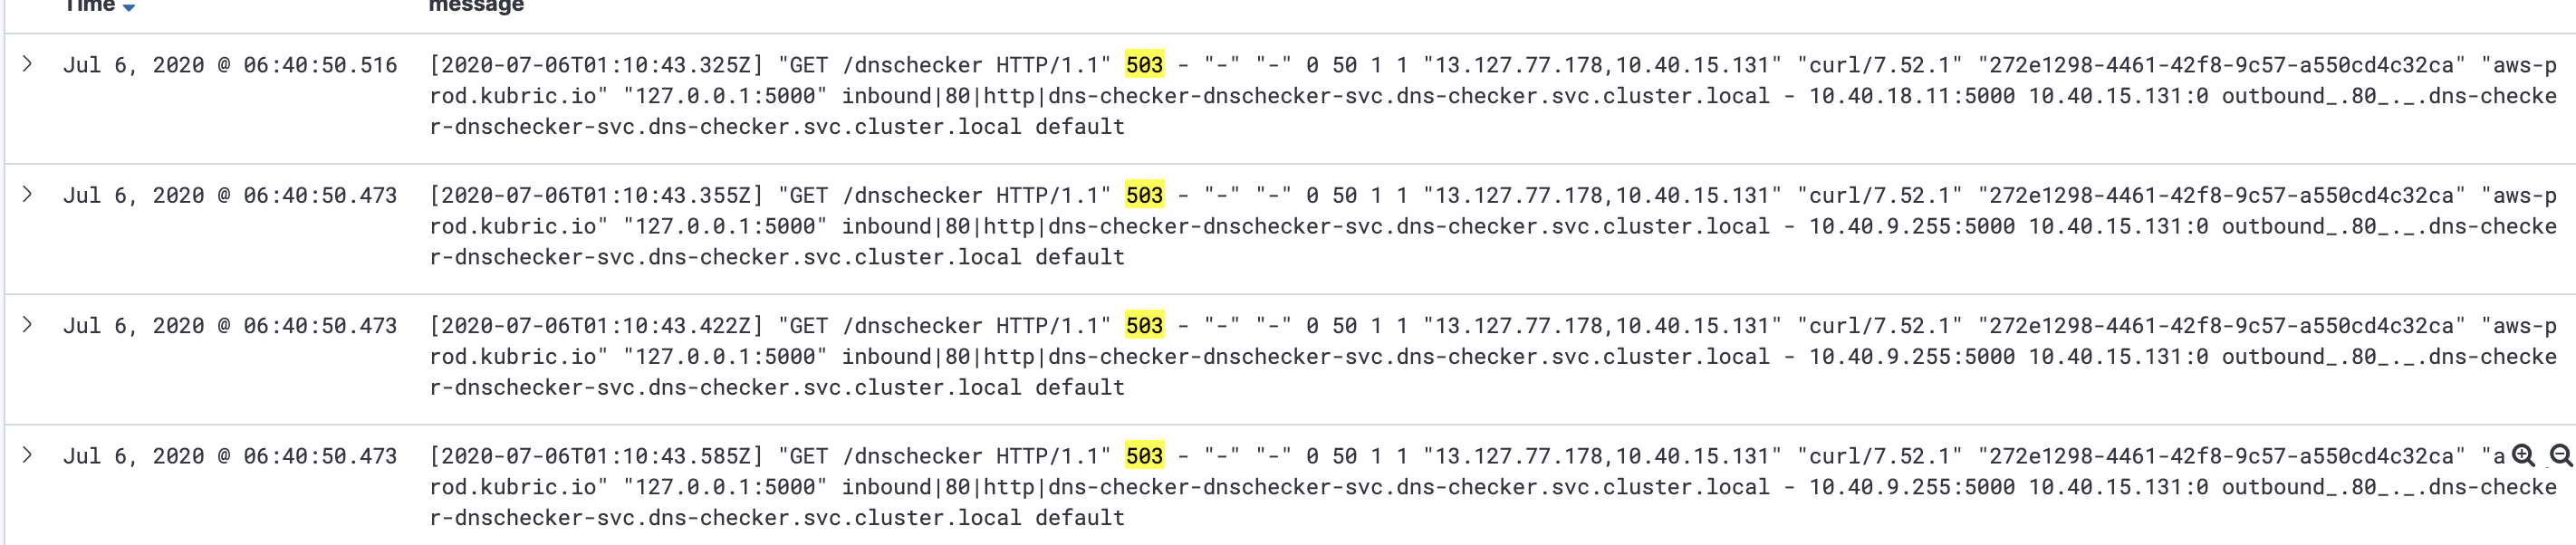
We rolled it out to all of our services. We monitored it for next few days and noticed that each of the failed requests is having three retries.
Please let us know how has been your experience with Kubernetes cluster in the comment section.
Stay tuned for more interesting stories.
![]()