You can change the zoom level, font size, name, and style used by tools in MATLAB®. You also can install new fonts to use with
MATLAB.
Zoom
You can change the zoom level in the Editor, Live Editor, and Help browser. To
zoom in and out, hold the Ctrl key and move the scroll wheel. On
macOS systems, use the Command key instead.
Alternatively, you can zoom in and out using the available keyboard
shortcuts.
| Action | Keyboard Shortcut |
|---|---|
|
Zoom in |
Ctrl+Plus On macOS systems, use |
|
Zoom out |
Ctrl+Minus On macOS systems, use |
|
Reset Zoom (Not supported in Help |
Ctrl+Alt+0 On macOS systems, use |
Alternatively, you can change the zoom level in the Editor and Live Editor by
going to the View tab and selecting ![]()
Zoom In, ![]()
Zoom Out, or ![]()
Reset Zoom.
In MATLAB
Online™, to change the zoom level, adjust the zoom settings for your web
browser.
Change Font Size
You can change the font size in MATLAB using preferences or settings. This table describes how to change the font size
for each tool.
| Tool | Procedure |
|---|---|
|
Live Editor |
Specify the font size for code and text programmatically s = settings; s.matlab.fonts.editor.code.Size.TemporaryValue = '26pt' For |
|
Code tools
|
Specify the font size using font On the Home tab, in the Environment section, click |
|
Text-based tools
|
Specify the font size using font On the Home tab, in the Environment section, click |
|
Charts |
See Add Title and Axis Labels to Chart. |
In MATLAB
Online, you only can change the font size for the Editor, Command Window, and
Live Editor.
Change Font Name and Style
You can change the font name and style in MATLAB using several different methods,
depending on the tool. This table describes how to change the font name and style
for each tool in MATLAB.
| Tool | Procedure |
|---|---|
|
Live Editor |
Specify the font name and style for code and text s = settings;
s.matlab.fonts.editor.normal.Name.PersonalValue = 'Calibri';
s.matlab.fonts.editor.normal.Style.PersonalValue = {'bold'};
For |
|
Code tools
|
Specify the font name and style using font On the Home tab, in the Environment section, click By default, |
|
Text-based tools
|
Specify the font name and style using font On the Home tab, in the Environment section, click |
|
Help Browser MATLAB web browser |
Changing the font name and style is not |
In MATLAB
Online, you only can change the font name and font style for the Editor,
Command Window, and Live Editor.
To apply antialiasing and create a smoother desktop appearance on Linux® systems, select Use antialiasing to smooth desktop
fonts. You must restart MATLAB for the preference to take effect. On Microsoft®
Windows® and macOS platforms, MATLAB uses system setting for antialiasing.
Advanced Customization
You can further customize fonts in MATLAB by changing the font preferences for an individual tool. To change the
font preferences, on the Home tab, in the Environment section, click ![]()
Preferences. Select > > and choose a tool from the list of Desktop tools.
Then, select the font to use:
-
Desktop code — Select this option to use the
desktop code font for this tool. -
Desktop text — Select this option to use the
desktop text font for this tool. -
Custom — Select this option to specify a
custom font for this tool. Then, specify a font name, style, and size. Some
options are not supported for all tools.
For example, to change the Editor font to a custom font, in the list of
Desktop tools, select Editor. Then, in
the Font to use section, select Custom and
specify the desired font name, style, and size.
Setting custom font preferences is not supported for the Live Editor. To change
the font name and style of code and text in the Live Editor, use settings. For more
information, see matlab.fonts Settings. In
MATLAB
Online, setting custom font preferences is only supported for the Editor and
Command Window.
Default Font Preferences
This table shows the default font preferences for the tools in MATLAB. You can use this table to restore fonts to their original
state.
|
Tool |
Font to Use |
Default Font |
|---|---|---|
|
Command History |
Desktop |
Monospaced, plain, 10 When the font is set to monospaced, the |
|
Command Window |
||
|
Editor (and Shortcuts Editor) |
||
|
Current Folder browser (and Path |
Desktop |
Your system’s current font |
|
Workspace browser |
||
|
Variables editor |
||
|
Function Browser |
||
| Profiler |
Custom |
Sans serif, plain, 10 point |
Add New Font
You can install new fonts to use with MATLAB. A common reason to install additional fonts is to read files created
in different languages. For details on adding fonts to your system, refer to the
documentation for your system.
Choose a new font that is compatible with MATLAB. MATLAB only includes compatible fonts in the font preferences.
-
For desktop components (such as the Command Window), figure windows, and
uicontrols, fonts must be compatible with TrueType and Microsoft
OpenType® fonts -
For graphics objects, such as
xlabel,
ylabel,title, and
text, fonts must be TrueType and Microsoft
OpenType fonts
Install your new font in a location where MATLAB looks for fonts. MATLAB looks for fonts in these locations:
-
The operating system’s standard location (see your system administrator
for details) -
The
/jre/lib/fontsfolder where Java® software is installed on your system
If you install a font with MATLAB running, restart MATLAB to include the font in the font preferences.
Then, to use the new font, follow the instructions in Change Font Name and Style.
See Also
Preferences
Related Topics
- Add Title and Axis Labels to Chart
- Change Desktop Colors
- Set Print Options for Command Window and Editor
fontsize
Change font size for objects in a figure
Syntax
Description
example
fontsize(obj,size,units)
sets the font size and font units for all of the text within graphics object
obj. If obj contains other graphics objects, such as
a figure that contains UI components or an axes object that has a legend,
fontsize also sets the font size and font units for those objects
within obj. Font units can be "points",
"pixels", "inches", or
"centimeters".
example
fontsize(obj,"increase")
increases the font size by a factor of 1.1.
fontsize(obj,"decrease")
decreases the font size by a factor of 0.9.
example
fontsize(obj,scale=sfactor)
scales the font size by a factor of sfactor. For example, use a scale
factor of 1.2 to scale by 120%.
example
fontsize(obj,"default")
resets the font size and font units back to the default, automatic values for
obj.
Examples
collapse all
Change Font Size of Plot Text
Create a plot of random data, and add a plot title and legend.
y = rand(5);
plot(y)
title("2-D Line Plot")
legend("Line 1","Line 2","Line 3","Line 4","Line 5")

Set the font size of all text within the axes object to 10 and the font units to "pixels". Use the object returned by gca as the target object to apply this change.
fontsize(gca,10,"pixels")

Scale Font Size of Text in Figure
Create a plot with several text elements of varying font sizes.
[X,Y,Z] = peaks;
contourf(X,Y,Z,LineColor="#4F4F4F")
title("Peak Elevation")
colorbar
annotation("textarrow",[.53 .41],[.65 .47],String="Local maxima")
annotation("textarrow",[.53 .59],[.65 .55])
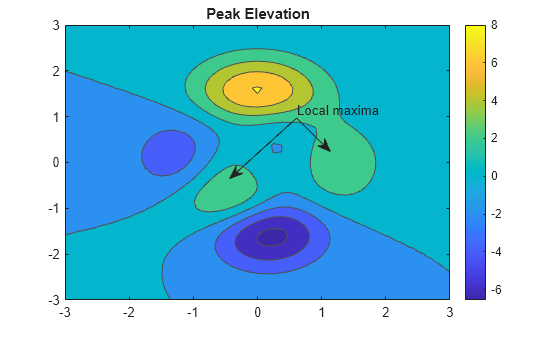
Scale the font sizes in the figure by 120% by using a scale factor of 1.2. The fontsize function scales each font size individually, maintaining the relative sizes of the fonts.

Change Font Size in Tiled Chart Layout
Create a tiling of several plots by using the tiledlayout and nexttile functions.
x = linspace(0,3*pi,200);
y = cos(x) + rand(1,200);
t = tiledlayout(2,2);

% Top scatter plot in tiles 1,2
ax1 = nexttile([1 2]);
scatter(x,y)
title("Random Variance on Cosine")

% Lower polar plot in tile 3
ax2 = nexttile;
plot(x,cos(x)+0.5)

% Lower histogram in tile 4
ax3 = nexttile;
histogram(y,20)
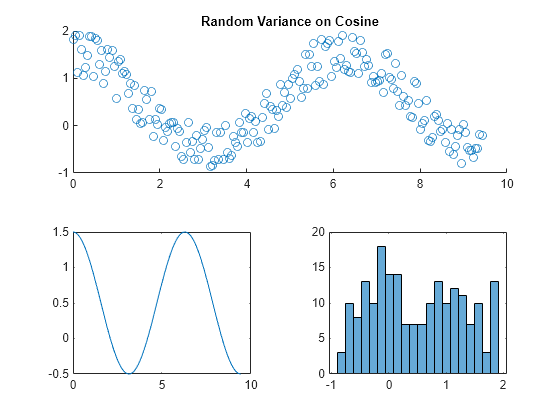
Scale up the font size of the scatter plot, and change the font size of the other two plots to 10 pixels.
fontsize(ax1,scale=1.2)
fontsize([ax2 ax3],10,"pixels")
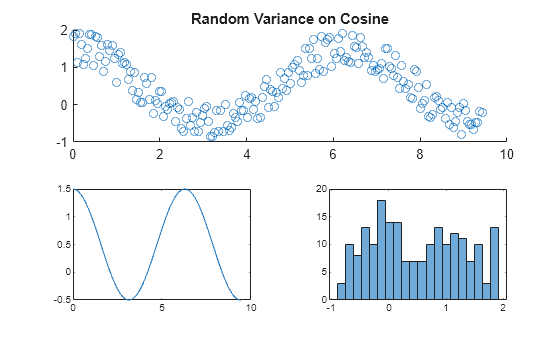
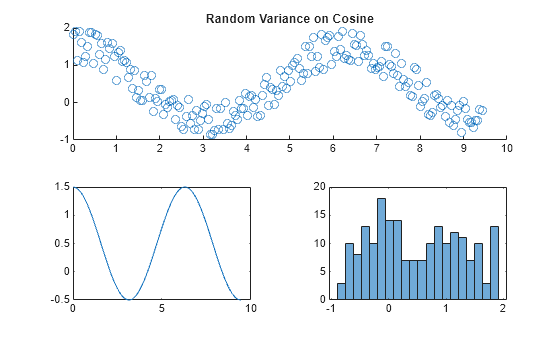
To undo the font size changes across all the tiled plots, reset the font sizes and units to their default values. Apply this change to all three plots by using the current figure object returned by gcf.
Change Font Size of App Text
Create the following function file, and save it as myapplayout.m on your MATLAB® path. This function returns the layout for a simple app to plot data using different plot types.
function fig = myapplayout
% Create figure window
fig = uifigure;

% Create UI components
ax = uiaxes(fig,Position=[15 70 535 340]);
lbl = uilabel(fig,Position=[30 15 100 35],Text="Choose Plot Type:");
b1 = uibutton(fig,Position=[140 15 180 35],Text="Surf");
b2 = uibutton(fig,Position=[350 15 180 35],Text="Mesh");

% Configure UI component appearance
surf(ax,peaks);
fontsize(fig,8,"pixels")
title(ax,"Peak Surface",FontSize=11)
end
Call the function and assign the returned figure object to f.
![{"String":"Figure contains an axes object and other objects of type uilabel, uibutton. The axes object with title Peak Surface contains an object of type surface.","Tex":"Peak Surface","LaTex":[]}](https://www.mathworks.com/help/examples/matlab/win64/ChangeFontSizeOfAppTextExample_01.png)
Use f to increase the font size of all text in the figure until it is more easily readable. Here, the fontsize function increases each font size individually by a scale factor of 1.1, maintaining the relative sizes of the fonts.
fontsize(f,"increase")
fontsize(f,"increase")
fontsize(f,"increase")
![{"String":"Figure contains an axes object and other objects of type uilabel, uibutton. The axes object with title Peak Surface contains an object of type surface.","Tex":"Peak Surface","LaTex":[]}](https://www.mathworks.com/help/examples/matlab/win64/ChangeFontSizeOfAppTextExample_02.png)
Input Arguments
collapse all
obj — Object or container with text
graphics object | array of graphics objects
Object or container with text, specified as a graphics object or array of graphics
objects. The fontsize function sets the font size of text in the
specified objects. If obj contains other graphics objects, such as a
figure that contains UI components or an axes object that has a legend, the function
also sets the font size and font units for those objects within obj.
Objects without a FontSize property are not affected.
size — Font size
positive scalar value
Font size, specified as a positive scalar value.
Data Types: single | double | int8 | int16 | int32 | int64 | uint8 | uint16 | uint32 | uint64
units — Font size units
"points" | "pixels" | "inches" | "centimeters"
Font size units, specified as "points",
"pixels", "inches", or
"centimeters".
sfactor — Scale factor
scalar
Scale factor, specified as a scalar. All font sizes under the target object are
scaled by sfactor. Use a scale factor greater than
1 to increase the font sizes or a factor less than
1 to decrease the font sizes.
Example: fontsize(gcf,scale=0.8) scales the text to 80% of its
original size.
Data Types: single | double | int8 | int16 | int32 | int64 | uint8 | uint16 | uint32 | uint64
Version History
Introduced in R2022a
Измените настольные шрифты
Можно изменить размер шрифта, имя и стиль, используемый инструментами в MATLAB®. Также можно установить новые шрифты, чтобы использовать с MATLAB.
Изменение масштаба
Можно изменить уровень изменения масштаба в Редакторе, Live Editor и Браузере документации. Чтобы увеличить и уменьшить масштаб, удержите клавишу Ctrl и переместите колесико прокрутки. В macOS системах используйте ключ Command вместо этого.
В качестве альтернативы можно увеличить и уменьшить масштаб использования доступных горячих клавиш.
| Действие | Горячая клавиша |
|---|---|
|
Увеличение |
Ctrl+Plus В macOS системах используйте Command+Shift+Plus. |
|
Уменьшение |
Ctrl+Minus В macOS системах используйте Command+Shift+Minus. |
|
Сбросьте изменение масштаба (Не поддерживаемый в Браузере документации) |
Ctrl+Alt+0 В macOS системах используйте Command+Alt+0. |
В качестве альтернативы можно изменить уровень изменения масштаба в Редакторе и Live Editor путем движения во вкладку View и выбора![]()
Zoom In,![]()
Zoom Out или![]()
Reset Zoom.
В MATLAB Online™, чтобы изменить уровень изменения масштаба, настраивают настройки изменения масштаба для вашего веб-браузера.
Измените размер шрифта
Можно изменить размер шрифта в MATLAB с помощью настроек или настроек. Эта таблица описывает, как изменить размер шрифта для каждого инструмента.
| Инструмент | Процедура |
|---|---|
|
Live Editor |
Задайте размер шрифта для кода и текста программно с помощью настроек. Для получения дополнительной информации см. matlab.fonts Настройки. |
|
Инструменты кода
|
Задайте размер шрифта с помощью настроек шрифта. На вкладке «Главная страница (Home)» в разделе «Конфигурация (Environment)» нажмите «Настройки (Preferences)». |
|
Основанные на тексте инструменты
|
Задайте размер шрифта с помощью настроек шрифта. На вкладке «Главная страница (Home)» в разделе «Конфигурация (Environment)» нажмите «Настройки (Preferences)». |
|
Графики |
Смотрите Добавление заголовка и подписей по осям, чтобы строить диаграмму. |
В MATLAB Online только можно изменить размер шрифта для Редактора (использующий настройки шрифта) и Live Editor (использующий настройки).
Измените название шрифта и стиль
Можно изменить название шрифта и стиль в MATLAB с помощью нескольких различных методов, в зависимости от инструмента. Эта таблица описывает, как изменить название шрифта и стиль для каждого инструмента в MATLAB.
| Инструмент | Процедура |
|---|---|
|
Live Editor |
Задайте название шрифта и стиль для кода и текста программно с помощью настроек. Например, этот код изменяет название шрифта и стиль обычного текста в Live Editor. s = settings;
s.matlab.fonts.editor.normal.Name.PersonalValue = 'Calibri';
s.matlab.fonts.editor.normal.Style.PersonalValue = {'bold'};
Для получения дополнительной информации см. matlab.fonts Настройки. |
|
Инструменты кода
|
Задайте название шрифта и стиль с помощью настроек шрифта. На вкладке «Главная страница (Home)» в разделе «Конфигурация (Environment)» нажмите «Настройки (Preferences)». По умолчанию шрифт кода собирается в моноширинный сохранить выравнивание по вертикали. Когда шрифт установлен в моноширинный, фактический отображенный шрифт в Редакторе отличается, чем шрифт, отображенный в Командном окне и Истории команд. Это вызвано тем, что моноширинный логический шрифт, не физический шрифт. Чтобы избежать этого несоответствия, задайте название шрифта как физический шрифт, например, |
|
Основанные на тексте инструменты
|
Задайте название шрифта и стиль с помощью настроек шрифта. На вкладке «Главная страница (Home)» в разделе «Конфигурация (Environment)» нажмите «Настройки (Preferences)». |
|
Браузер документации Веб-браузер MATLAB |
Изменение названия шрифта и стиля не поддерживается. |
В MATLAB Online только можно изменить название шрифта и стиль шрифта для Редактора (использующий настройки шрифта) и Live Editor (использующий настройки).
Применить сглаживание и создать более сглаженный внешний вид рабочего стола на Linux® системы, выберите Use antialiasing to smooth desktop fonts. Необходимо перезапустить MATLAB для настройки, чтобы вступить в силу. На Microsoft® Windows® и платформы macOS, MATLAB использует параметр настройки системы для сглаживания.
Усовершенствованная индивидуальная настройка
Можно далее настроить шрифты в MATLAB путем изменения настроек шрифта для отдельного инструмента. Чтобы изменить настройки шрифта, на вкладке Home, в разделе Environment, нажимают![]()
Preferences. Выберите > > и выберите инструмент из списка Desktop tools. Затем выберите шрифт, чтобы использовать:
-
Desktop code — Выберите эту опцию, чтобы использовать настольный шрифт кода для этого инструмента.
-
Desktop text — Выберите эту опцию, чтобы использовать системный шрифт для этого инструмента.
-
Custom — Выберите эту опцию, чтобы задать пользовательский шрифт для этого инструмента. Затем задайте название шрифта, стиль и размер. Некоторые опции не поддерживаются для всех инструментов.
Например, чтобы изменить шрифт Редактора в пользовательский шрифт, в списке Desktop tools, выбирают Editor. Затем в разделе Font to use выберите Custom и задайте желаемое название шрифта, стиль и размер.
Установка настроек пользовательского шрифта не поддерживается для Live Editor. Изменить название шрифта и стиль кода и текста в Live Editor, с помощью настроек. Для получения дополнительной информации см. matlab.fonts Настройки.
Настройки стандартного шрифта
Эта таблица показывает настройки стандартного шрифта для инструментов в MATLAB. Можно использовать эту таблицу, чтобы восстановить шрифты к их исходному состоянию.
|
Инструмент |
Шрифт, чтобы использовать |
Стандартный шрифт |
|---|---|---|
|
История команд |
Desktop code |
Моноширинный, простой, 10 точек Когда шрифт установлен в моноширинный, фактический отображенный шрифт в Редакторе отличается, чем шрифт, отображенный в Командном окне и Истории команд. Это вызвано тем, что моноширинный логический шрифт, не физический шрифт. Чтобы избежать этого несоответствия, задайте название шрифта как физический шрифт, например, |
|
Командное окно |
||
|
Редактор (и редактор ярлыков) |
||
|
Браузер текущей папки (и браузер Пути) |
Desktop text |
Текущий шрифт вашей системы |
|
Браузер рабочей области |
||
|
Редактор переменных |
||
|
Браузер функций |
||
| Профилировщик |
Custom |
Гротесковый шрифт, плоскость, 10 точек |
Добавьте новый шрифт
Можно установить новые шрифты, чтобы использовать с MATLAB. Общая причина установить дополнительные шрифты состоит в том, чтобы считать файлы, созданные на различных языках. Для получения дополнительной информации на добавляющих шрифтах к вашей системе, обратитесь к документации для своей системы.
Выберите новый шрифт, который совместим с MATLAB. MATLAB только включает совместимые шрифты в настройки шрифта.
-
Для настольных компонентов (таких как Командное окно), окна рисунка и uicontrol, шрифты должны быть совместимы с TrueType и Microsoft OpenType® шрифты
-
Для графических объектов, таких как
xlabelYLabelзаголовок, иtext, шрифты должны быть шрифты Microsoft OpenType и TrueType
Установите свой новый шрифт в месте, где MATLAB ищет шрифты. MATLAB ищет шрифты в этих местоположениях:
-
Стандартное местоположение операционной системы (см. своего системного администратора для деталей),
-
/jre/lib/fontsпапка, где Java® программное обеспечение установлено в вашей системе
Если вы устанавливаете шрифт с выполнением MATLAB, перезапускаете MATLAB, чтобы включать шрифт в настройки шрифта.
Затем чтобы использовать новый шрифт, следуйте инструкциям на Название шрифта Изменения и Стиль.
Смотрите также
Окно настроек
Похожие темы
- Добавление заголовка и подписей по осям, чтобы строить диаграмму
- Измените настольные цвета
- Установите опции печати для командного окна и редактор
TextBox Properties
Text box appearance and behavior
TextBox properties control the appearance
and behavior of a TextBox object. By changing property
values, you can modify certain aspects of the text box. Use dot notation to query and
set properties.
t = annotation('textbox');
sz = t.FontSize;
t.FontSize = 12;
expand all
Text to display, specified as a character vector, cell array of character vectors,
string array, categorical array, or numeric value. Specify a value according to how you
want the text to appear. This table lists the most common situations.
| Appearance of Text | Description of Value | Example |
|---|---|---|
| One line of text | Character vector or 1-by-1 string array. |
str = 'My Text'
or str = "My Text"
|
| Multiple lines of text | Cell array of character vectors or a string array. |
str = {'First line','Second line'};
or str = ["First line", "Second line"]; |
| Text that includes a numeric variable | Array that includes the number converted to achar array. Use num2str to convertthe value. |
x = 42;
str = ['The value is ',num2str(x)];
|
| Text that includes special characters such as Greek letters or mathematical symbols |
Array that includes TeX markup. For a list of supported markup, see the Interpreter property. |
str = 'x ranges from 0 to 2pi'
|
Note
-
The words
default,factory, and
removeare reserved words that do not appear in text
when quoted as normal characters. To display any of these words
individually, precede them with a backslash, such as
'default'or'remove'. -
If you specify this property as a categorical array, MATLAB® uses the values in the array, not the categories.
-
If you specify text that contains only a numeric value, the value is
converted usingsprintf('%g',value). For example,
12345678displays as
1.23457e+07.
Text color, specified as an RGB triplet, a hexadecimal color code, a color name, or a short
name. The default value of [0 0 0] corresponds to black.
For a custom color, specify an RGB triplet or a hexadecimal color code.
-
An RGB triplet is a three-element row vector whose elements
specify the intensities of the red, green, and blue
components of the color. The intensities must be in the
range[0,1], for example,[0.4.
0.6 0.7] -
A hexadecimal color code is a character vector or a string
scalar that starts with a hash symbol (#)
followed by three or six hexadecimal digits, which can range
from0toF. The
values are not case sensitive. Therefore, the color codes
"#FF8800",
"#ff8800",
"#F80", and
"#f80"are equivalent.
Alternatively, you can specify some common colors by name. This table lists the named color
options, the equivalent RGB triplets, and hexadecimal color codes.
| Color Name | Short Name | RGB Triplet | Hexadecimal Color Code | Appearance |
|---|---|---|---|---|
"red" |
"r" |
[1 0 0] |
"#FF0000" |
|
"green" |
"g" |
[0 1 0] |
"#00FF00" |
|
"blue" |
"b" |
[0 0 1] |
"#0000FF" |
|
"cyan"
|
"c" |
[0 1 1] |
"#00FFFF" |
|
"magenta" |
"m" |
[1 0 1] |
"#FF00FF" |
|
"yellow" |
"y" |
[1 1 0] |
"#FFFF00" |
|
"black" |
"k" |
[0 0 0] |
"#000000" |
|
"white" |
"w" |
[1 1 1] |
"#FFFFFF" |
|
"none" |
Not applicable | Not applicable | Not applicable | No color |
Here are the RGB triplets and hexadecimal color codes for the default colors MATLAB uses in many types of plots.
| RGB Triplet | Hexadecimal Color Code | Appearance |
|---|---|---|
[0 0.4470 0.7410] |
"#0072BD" |
|
[0.8500 0.3250 0.0980] |
"#D95319" |
|
[0.9290 0.6940 0.1250] |
"#EDB120" |
|
[0.4940 0.1840 0.5560] |
"#7E2F8E" |
|
[0.4660 0.6740 0.1880] |
"#77AC30" |
|
[0.3010 0.7450 0.9330] |
"#4DBEEE" |
|
[0.6350 0.0780 0.1840] |
"#A2142F" |
|
Example: 'blue'
Example: [0
0 1]
Example: '#0000FF'
Text interpreter, specified as one of these values:
-
'tex'— Interpret characters using a subset of
TeX markup. -
'latex'— Interpret characters using LaTeX
markup. -
'none'— Display literal characters.
TeX Markup
By default, MATLAB supports a subset of TeX markup. Use TeX markup to add superscripts
and subscripts, modify the font type and color, and include special characters in
the text.
Modifiers remain in effect until the end of the text.
Superscripts and subscripts are an exception because they modify only the next character or the
characters within the curly braces. When you set the interpreter to 'tex',
the supported modifiers are as follows.
| Modifier | Description | Example |
|---|---|---|
^{ } |
Superscript | 'text^{superscript}' |
_{ } |
Subscript | 'text_{subscript}' |
bf |
Bold font | 'bf text' |
it |
Italic font | 'it text' |
sl |
Oblique font (usually the same as italic font) | 'sl text' |
rm |
Normal font | 'rm text' |
fontname{ |
Font name — Replacea font family. You can use this in combination with other modifiers. |
'fontname{Courier} text' |
fontsize{ |
Font size —Replacescalar value in point units. |
'fontsize{15} text' |
color{ |
Font color — Replacethese colors: red, green,yellow, magenta,blue, black,white, gray,darkGreen, orange, orlightBlue. |
'color{magenta} text' |
color[rgb]{specifier} |
Custom font color — Replacethree-element RGB triplet. |
'color[rgb]{0,0.5,0.5} text' |
This table lists the supported special characters for the
'tex' interpreter.
| Character Sequence | Symbol | Character Sequence | Symbol | Character Sequence | Symbol |
|---|---|---|---|---|---|
|
|
α |
|
υ |
|
~ |
|
|
∠ |
|
ϕ |
|
≤ |
|
|
|
|
χ |
|
∞ |
|
|
β |
|
ψ |
|
♣ |
|
|
γ |
|
ω |
|
♦ |
|
|
δ |
|
Γ |
|
♥ |
|
|
ϵ |
|
Δ |
|
♠ |
|
|
ζ |
|
Θ |
|
↔ |
|
|
η |
|
Λ |
|
← |
|
|
θ |
|
Ξ |
|
⇐ |
|
|
ϑ |
|
Π |
|
↑ |
|
|
ι |
|
Σ |
|
→ |
|
|
κ |
|
ϒ |
|
⇒ |
|
|
λ |
|
Φ |
|
↓ |
|
|
µ |
|
Ψ |
|
º |
|
|
ν |
|
Ω |
|
± |
|
|
ξ |
|
∀ |
|
≥ |
|
|
π |
|
∃ |
|
∝ |
|
|
ρ |
|
∍ |
|
∂ |
|
|
σ |
|
≅ |
|
• |
|
|
ς |
|
≈ |
|
÷ |
|
|
τ |
|
ℜ |
|
≠ |
|
|
≡ |
|
⊕ |
|
ℵ |
|
|
ℑ |
|
∪ |
|
℘ |
|
|
⊗ |
|
⊆ |
|
∅ |
|
|
∩ |
|
∈ |
|
⊇ |
|
|
⊃ |
|
⌈ |
|
⊂ |
|
|
∫ |
|
· |
|
ο |
|
|
⌋ |
|
¬ |
|
∇ |
|
|
⌊ |
|
x |
|
… |
|
|
⊥ |
|
√ |
|
´ |
|
|
∧ |
|
ϖ |
|
∅ |
|
|
⌉ |
|
〉 |
|
| |
|
|
∨ |
|
〈 |
|
© |
LaTeX Markup
To use LaTeX markup, set the interpreter to 'latex'. For inline
mode, surround the markup with single dollar signs ($). For
display mode, surround the markup with double dollar signs
($$).
| LaTeX Mode | Example | Result |
|---|---|---|
| Inline |
'$int_1^{20} x^2 dx$'
|
|
| Display |
'$$int_1^{20} x^2 dx$$'
|
|
The displayed text uses the default LaTeX font style. The
FontName, FontWeight, and
FontAngle properties do not have an effect. To change the
font style, use LaTeX markup.
The maximum size of the text that you can use with the LaTeX interpreter is 1200
characters. For multiline text, this reduces by about 10 characters per line.
For examples that use TeX and LaTeX, see Greek Letters and Special Characters in Chart Text. For more information about the LaTeX
system, see The LaTeX Project website at https://www.latex-project.org/.
Font
expand all
Font name, specified as a supported font name or 'FixedWidth'. To display
and print text properly, you must choose a font that your system supports. The default
font depends on your operating system and locale.
To use a fixed-width font that looks good in any locale, use 'FixedWidth'.
The fixed-width font relies on the root FixedWidthFontName
property. Setting the root FixedWidthFontName property causes an
immediate update of the display to use the new font.
Font size, specified as a scalar value greater than 0 in point units. The default font size
depends on the specific operating system and locale. One point equals 1/72 inch. To
change the font units, use the FontUnits property.
Example: 12
Data Types: single | double | int8 | int16 | int32 | int64 | uint8 | uint16 | uint32 | uint64 | logical
Character thickness, specified as 'normal' or
'bold'.
MATLAB uses the FontWeight property to select a font from
those available on your system. Not all fonts have a bold weight. Therefore, specifying
a bold font weight can still result in the normal font weight.
Character slant, specified as 'normal' or
'italic'.
Not all fonts have both font styles. Therefore, the italic font might look the same
as the normal font.
FontUnits — Font size units
'points' (default) | 'inches' | 'centimeters' | 'normalized' | 'pixels'
Font size units, specified as one of the values in this
table.
Units |
Description |
|---|---|
'points' |
Points. One point equals 1/72 inch. |
'inches' |
Inches. |
'centimeters' |
Centimeters. |
'normalized'
|
Interpret font size as a fraction of the parent container height, typically a figure. If you resize the container, the font size modifies accordingly. For example, if the FontSize is0.1 in normalized units, then thetext is 1/10 of the container height. |
'pixels' |
Pixels. Starting in R2015b, distances in pixels are
On Linux® systems, the size of a pixel is |
If you set both the font size and the font units in one function call, you
must set the FontUnits property first so that the axes
correctly interprets the specified font size.
Text Box
expand all
FitBoxToText — Option to fit box width and height to text
'on' (default) | on/off logical value
Option to fit the box width and height to the text, specified as
'on' or 'off', or as numeric or
logical 1 (true) or
0 (false). A value of
'on' is equivalent to true, and
'off' is equivalent to false.
Thus, you can use the value of this property as a logical value. The value
is stored as an on/off logical value of type matlab.lang.OnOffSwitchState.
-
'on'— Resize the text box to fit
the text. -
'off'— Wrap the text to fit the
width of the text box. Wrapping can cause some of the text to
extend below the text box.
If you resize a text box when in plot edit mode, or if you
change the Position property, then the
FitBoxToText property changes to
'off'.
EdgeColor — Color of box outline
[0 0 0]
(default) | RGB triplet | hexadecimal color code | 'r' | 'g' | 'b' | …
Color of box outline, specified as a three-element RGB triplet, a
hexadecimal color code, a color name, or a short name. The default value of
[0 0 0] corresponds to black.
For a custom color, specify an RGB triplet or a hexadecimal color code.
-
An RGB triplet is a three-element row vector whose elements
specify the intensities of the red, green, and blue
components of the color. The intensities must be in the
range[0,1], for example,[0.4.
0.6 0.7] -
A hexadecimal color code is a character vector or a string
scalar that starts with a hash symbol (#)
followed by three or six hexadecimal digits, which can range
from0toF. The
values are not case sensitive. Therefore, the color codes
"#FF8800",
"#ff8800",
"#F80", and
"#f80"are equivalent.
Alternatively, you can specify some common colors by name. This table lists the named color
options, the equivalent RGB triplets, and hexadecimal color codes.
| Color Name | Short Name | RGB Triplet | Hexadecimal Color Code | Appearance |
|---|---|---|---|---|
"red" |
"r" |
[1 0 0] |
"#FF0000" |
|
"green" |
"g" |
[0 1 0] |
"#00FF00" |
|
"blue" |
"b" |
[0 0 1] |
"#0000FF" |
|
"cyan"
|
"c" |
[0 1 1] |
"#00FFFF" |
|
"magenta" |
"m" |
[1 0 1] |
"#FF00FF" |
|
"yellow" |
"y" |
[1 1 0] |
"#FFFF00" |
|
"black" |
"k" |
[0 0 0] |
"#000000" |
|
"white" |
"w" |
[1 1 1] |
"#FFFFFF" |
|
"none" |
Not applicable | Not applicable | Not applicable | No color |
Here are the RGB triplets and hexadecimal color codes for the default colors MATLAB uses in many types of plots.
| RGB Triplet | Hexadecimal Color Code | Appearance |
|---|---|---|
[0 0.4470 0.7410] |
"#0072BD" |
|
[0.8500 0.3250 0.0980] |
"#D95319" |
|
[0.9290 0.6940 0.1250] |
"#EDB120" |
|
[0.4940 0.1840 0.5560] |
"#7E2F8E" |
|
[0.4660 0.6740 0.1880] |
"#77AC30" |
|
[0.3010 0.7450 0.9330] |
"#4DBEEE" |
|
[0.6350 0.0780 0.1840] |
"#A2142F" |
|
Example: 'blue'
Example: [0 0 1]
Example: '#0000FF'
BackgroundColor — Color of text box background
'none'
(default) | RGB triplet | hexadecimal color code | 'r' | 'g' | 'b' | …
Color of text box background, specified as an RGB triplet, a hexadecimal
color code, a color name, or a short name.
For a custom color, specify an RGB triplet or a hexadecimal color code.
-
An RGB triplet is a three-element row vector whose elements
specify the intensities of the red, green, and blue
components of the color. The intensities must be in the
range[0,1], for example,[0.4.
0.6 0.7] -
A hexadecimal color code is a character vector or a string
scalar that starts with a hash symbol (#)
followed by three or six hexadecimal digits, which can range
from0toF. The
values are not case sensitive. Therefore, the color codes
"#FF8800",
"#ff8800",
"#F80", and
"#f80"are equivalent.
Alternatively, you can specify some common colors by name. This table lists the named color
options, the equivalent RGB triplets, and hexadecimal color codes.
| Color Name | Short Name | RGB Triplet | Hexadecimal Color Code | Appearance |
|---|---|---|---|---|
"red" |
"r" |
[1 0 0] |
"#FF0000" |
|
"green" |
"g" |
[0 1 0] |
"#00FF00" |
|
"blue" |
"b" |
[0 0 1] |
"#0000FF" |
|
"cyan"
|
"c" |
[0 1 1] |
"#00FFFF" |
|
"magenta" |
"m" |
[1 0 1] |
"#FF00FF" |
|
"yellow" |
"y" |
[1 1 0] |
"#FFFF00" |
|
"black" |
"k" |
[0 0 0] |
"#000000" |
|
"white" |
"w" |
[1 1 1] |
"#FFFFFF" |
|
"none" |
Not applicable | Not applicable | Not applicable | No color |
Here are the RGB triplets and hexadecimal color codes for the default colors MATLAB uses in many types of plots.
| RGB Triplet | Hexadecimal Color Code | Appearance |
|---|---|---|
[0 0.4470 0.7410] |
"#0072BD" |
|
[0.8500 0.3250 0.0980] |
"#D95319" |
|
[0.9290 0.6940 0.1250] |
"#EDB120" |
|
[0.4940 0.1840 0.5560] |
"#7E2F8E" |
|
[0.4660 0.6740 0.1880] |
"#77AC30" |
|
[0.3010 0.7450 0.9330] |
"#4DBEEE" |
|
[0.6350 0.0780 0.1840] |
"#A2142F" |
|
Example: 'blue'
Example: [0 0 1]
Example: '#0000FF'
FaceAlpha — Transparency of background color
1 (default) | scalar value between 0 and 1 inclusive
Transparency of the background color, specified as a scalar value between
0 and 1. If the value is 1, then the color is opaque. To add transparency,
set the property to a value closer to 0, where 0 is completely
transparent.
LineStyle — Line style of box outline
'-' (default) | '--' | ':' | '-.' | 'none'
Line style of box outline, specified as one of the options listed in this
table.
| Line Style | Description |
|---|---|
'-' |
Solid line |
'--' |
Dashed line |
':' |
Dotted line |
'-.' |
Dash-dotted line |
'none' |
Box outline is invisible |
LineWidth — Width of box outline
0.5 (default) | scalar numeric value
Width of box outline, specified as a scalar numeric value in
point units. One point equals 1/72 inch.
Example: 1.5
Margin — Space around text within the text box
5 (default) | scalar numeric value
The space around the text within the text box, specified as a scalar
numeric value in pixel units.
Position
expand all
Position — Size and location
[0.3 0.3 0.1 0.1] (default) | four-element vector
Size and location, specified as a four-element vector of the form
[x_begin y_begin length height]. The first two
elements specify the coordinates for the lower-left corner of the text box.
The second two elements specify the length and height of the text
box.
By default, the units are normalized to the figure. The lower-left corner
of the figure maps to (0,0), and the upper-right corner
maps to (1,1). To change the units, use the
Units property.
Note
If the FitBoxToText property is set to
'on' and you change the String
property, then the Position property might not
reflect the latest changes until the next time the screen refreshes. To
ensure that the position value reflects the latest changes, call
drawnow before querying the position when working
in a script or function.
Example: [0.2 0.3 0.4 0.5]
Rotation — Rotation angle in degrees
0 (default) | scalar numeric value
Rotation angle in degrees, specified as a scalar numeric value. Rotation angle is absolute
and not relative to previous rotations.
This table shows the resulting annotation rotation for the possible
Rotation values.
| Rotation Value | Resulting Rotation |
|---|---|
| 0 | Unrotated |
| Positive scalar value | Rotated counterclockwise by the specified number of degrees |
| Negative scalar value | Rotated clockwise by the specified number of degrees |
The anchor point for rotation is the location specified by the first two elements of the
Position property vector, indicated by the [x y]
values.
Example: 45
Position units, specified as one of the values in this table.
Units |
Description |
|---|---|
'normalized' (default) |
Normalized with respect to the figure, uipanel, or uitab that contains the annotation. The lower-left corner of the container maps to (0,0) and the upper-right corner maps to (1,1). |
'inches' |
Inches. |
'centimeters' |
Centimeters. |
'characters' |
Based on the default system font character size.
|
'points' |
Points. One point equals 1/72 inch. |
'pixels' |
Pixels. Starting in R2015b, distances in
On Linux systems, the size of a pixel is determined |
All units are measured from the lower-left corner of the figure
window.
This property affects the Position property.
If you change the units, then it is good practice to return it to
the default value after completing your computation to prevent affecting
other functions that assume Units is set to the
default value.
If you specify the Position and Units properties
as Name,Value pairs when creating the object, then
the order of specification matters. If you want to define the position
with particular units, then you must set the Units property
before the Position property.
Horizontal alignment of the text within the text box, specified
as one of the values in this table.
| Value | Result |
|---|---|
'left' |
|
'center' |
|
'right' |
|
Vertical alignment of the text within the text box, specified
as one of the values in this table.
| Value | Result |
|---|---|
'top' |
|
'middle' |
|
'bottom' |
|


Note
The 'cap' and 'baseline' values
are not recommended. Use the 'top' and 'bottom' values,
respectively, instead.
Version History
Introduced before R2006a
expand all
R2022a: Rotate annotation
Rotate the annotation the specified number of degrees using the
Rotation property. The anchor point for rotation is the location
specified by the Position property, so the
Position property is unaffected by rotation.
TextBox Properties
Text box appearance and behavior
TextBox properties control the appearance
and behavior of a TextBox object. By changing property
values, you can modify certain aspects of the text box. Use dot notation to query and
set properties.
t = annotation('textbox');
sz = t.FontSize;
t.FontSize = 12;
expand all
Text to display, specified as a character vector, cell array of character vectors,
string array, categorical array, or numeric value. Specify a value according to how you
want the text to appear. This table lists the most common situations.
| Appearance of Text | Description of Value | Example |
|---|---|---|
| One line of text | Character vector or 1-by-1 string array. |
str = 'My Text'
or str = "My Text"
|
| Multiple lines of text | Cell array of character vectors or a string array. |
str = {'First line','Second line'};
or str = ["First line", "Second line"]; |
| Text that includes a numeric variable | Array that includes the number converted to achar array. Use num2str to convertthe value. |
x = 42;
str = ['The value is ',num2str(x)];
|
| Text that includes special characters such as Greek letters or mathematical symbols |
Array that includes TeX markup. For a list of supported markup, see the Interpreter property. |
str = 'x ranges from 0 to 2pi'
|
Note
-
The words
default,factory, and
removeare reserved words that do not appear in text
when quoted as normal characters. To display any of these words
individually, precede them with a backslash, such as
'default'or'remove'. -
If you specify this property as a categorical array, MATLAB® uses the values in the array, not the categories.
-
If you specify text that contains only a numeric value, the value is
converted usingsprintf('%g',value). For example,
12345678displays as
1.23457e+07.
Text color, specified as an RGB triplet, a hexadecimal color code, a color name, or a short
name. The default value of [0 0 0] corresponds to black.
For a custom color, specify an RGB triplet or a hexadecimal color code.
-
An RGB triplet is a three-element row vector whose elements
specify the intensities of the red, green, and blue
components of the color. The intensities must be in the
range[0,1], for example,[0.4.
0.6 0.7] -
A hexadecimal color code is a character vector or a string
scalar that starts with a hash symbol (#)
followed by three or six hexadecimal digits, which can range
from0toF. The
values are not case sensitive. Therefore, the color codes
"#FF8800",
"#ff8800",
"#F80", and
"#f80"are equivalent.
Alternatively, you can specify some common colors by name. This table lists the named color
options, the equivalent RGB triplets, and hexadecimal color codes.
| Color Name | Short Name | RGB Triplet | Hexadecimal Color Code | Appearance |
|---|---|---|---|---|
"red" |
"r" |
[1 0 0] |
"#FF0000" |
|
"green" |
"g" |
[0 1 0] |
"#00FF00" |
|
"blue" |
"b" |
[0 0 1] |
"#0000FF" |
|
"cyan"
|
"c" |
[0 1 1] |
"#00FFFF" |
|
"magenta" |
"m" |
[1 0 1] |
"#FF00FF" |
|
"yellow" |
"y" |
[1 1 0] |
"#FFFF00" |
|
"black" |
"k" |
[0 0 0] |
"#000000" |
|
"white" |
"w" |
[1 1 1] |
"#FFFFFF" |
|
"none" |
Not applicable | Not applicable | Not applicable | No color |
Here are the RGB triplets and hexadecimal color codes for the default colors MATLAB uses in many types of plots.
| RGB Triplet | Hexadecimal Color Code | Appearance |
|---|---|---|
[0 0.4470 0.7410] |
"#0072BD" |
|
[0.8500 0.3250 0.0980] |
"#D95319" |
|
[0.9290 0.6940 0.1250] |
"#EDB120" |
|
[0.4940 0.1840 0.5560] |
"#7E2F8E" |
|
[0.4660 0.6740 0.1880] |
"#77AC30" |
|
[0.3010 0.7450 0.9330] |
"#4DBEEE" |
|
[0.6350 0.0780 0.1840] |
"#A2142F" |
|
Example: 'blue'
Example: [0
0 1]
Example: '#0000FF'
Text interpreter, specified as one of these values:
-
'tex'— Interpret characters using a subset of
TeX markup. -
'latex'— Interpret characters using LaTeX
markup. -
'none'— Display literal characters.
TeX Markup
By default, MATLAB supports a subset of TeX markup. Use TeX markup to add superscripts
and subscripts, modify the font type and color, and include special characters in
the text.
Modifiers remain in effect until the end of the text.
Superscripts and subscripts are an exception because they modify only the next character or the
characters within the curly braces. When you set the interpreter to 'tex',
the supported modifiers are as follows.
| Modifier | Description | Example |
|---|---|---|
^{ } |
Superscript | 'text^{superscript}' |
_{ } |
Subscript | 'text_{subscript}' |
bf |
Bold font | 'bf text' |
it |
Italic font | 'it text' |
sl |
Oblique font (usually the same as italic font) | 'sl text' |
rm |
Normal font | 'rm text' |
fontname{ |
Font name — Replacea font family. You can use this in combination with other modifiers. |
'fontname{Courier} text' |
fontsize{ |
Font size —Replacescalar value in point units. |
'fontsize{15} text' |
color{ |
Font color — Replacethese colors: red, green,yellow, magenta,blue, black,white, gray,darkGreen, orange, orlightBlue. |
'color{magenta} text' |
color[rgb]{specifier} |
Custom font color — Replacethree-element RGB triplet. |
'color[rgb]{0,0.5,0.5} text' |
This table lists the supported special characters for the
'tex' interpreter.
| Character Sequence | Symbol | Character Sequence | Symbol | Character Sequence | Symbol |
|---|---|---|---|---|---|
|
|
α |
|
υ |
|
~ |
|
|
∠ |
|
ϕ |
|
≤ |
|
|
|
|
χ |
|
∞ |
|
|
β |
|
ψ |
|
♣ |
|
|
γ |
|
ω |
|
♦ |
|
|
δ |
|
Γ |
|
♥ |
|
|
ϵ |
|
Δ |
|
♠ |
|
|
ζ |
|
Θ |
|
↔ |
|
|
η |
|
Λ |
|
← |
|
|
θ |
|
Ξ |
|
⇐ |
|
|
ϑ |
|
Π |
|
↑ |
|
|
ι |
|
Σ |
|
→ |
|
|
κ |
|
ϒ |
|
⇒ |
|
|
λ |
|
Φ |
|
↓ |
|
|
µ |
|
Ψ |
|
º |
|
|
ν |
|
Ω |
|
± |
|
|
ξ |
|
∀ |
|
≥ |
|
|
π |
|
∃ |
|
∝ |
|
|
ρ |
|
∍ |
|
∂ |
|
|
σ |
|
≅ |
|
• |
|
|
ς |
|
≈ |
|
÷ |
|
|
τ |
|
ℜ |
|
≠ |
|
|
≡ |
|
⊕ |
|
ℵ |
|
|
ℑ |
|
∪ |
|
℘ |
|
|
⊗ |
|
⊆ |
|
∅ |
|
|
∩ |
|
∈ |
|
⊇ |
|
|
⊃ |
|
⌈ |
|
⊂ |
|
|
∫ |
|
· |
|
ο |
|
|
⌋ |
|
¬ |
|
∇ |
|
|
⌊ |
|
x |
|
… |
|
|
⊥ |
|
√ |
|
´ |
|
|
∧ |
|
ϖ |
|
∅ |
|
|
⌉ |
|
〉 |
|
| |
|
|
∨ |
|
〈 |
|
© |
LaTeX Markup
To use LaTeX markup, set the interpreter to 'latex'. For inline
mode, surround the markup with single dollar signs ($). For
display mode, surround the markup with double dollar signs
($$).
| LaTeX Mode | Example | Result |
|---|---|---|
| Inline |
'$int_1^{20} x^2 dx$'
|
|
| Display |
'$$int_1^{20} x^2 dx$$'
|
|
The displayed text uses the default LaTeX font style. The
FontName, FontWeight, and
FontAngle properties do not have an effect. To change the
font style, use LaTeX markup.
The maximum size of the text that you can use with the LaTeX interpreter is 1200
characters. For multiline text, this reduces by about 10 characters per line.
For examples that use TeX and LaTeX, see Greek Letters and Special Characters in Chart Text. For more information about the LaTeX
system, see The LaTeX Project website at https://www.latex-project.org/.
Font
expand all
Font name, specified as a supported font name or 'FixedWidth'. To display
and print text properly, you must choose a font that your system supports. The default
font depends on your operating system and locale.
To use a fixed-width font that looks good in any locale, use 'FixedWidth'.
The fixed-width font relies on the root FixedWidthFontName
property. Setting the root FixedWidthFontName property causes an
immediate update of the display to use the new font.
Font size, specified as a scalar value greater than 0 in point units. The default font size
depends on the specific operating system and locale. One point equals 1/72 inch. To
change the font units, use the FontUnits property.
Example: 12
Data Types: single | double | int8 | int16 | int32 | int64 | uint8 | uint16 | uint32 | uint64 | logical
Character thickness, specified as 'normal' or
'bold'.
MATLAB uses the FontWeight property to select a font from
those available on your system. Not all fonts have a bold weight. Therefore, specifying
a bold font weight can still result in the normal font weight.
Character slant, specified as 'normal' or
'italic'.
Not all fonts have both font styles. Therefore, the italic font might look the same
as the normal font.
FontUnits — Font size units
'points' (default) | 'inches' | 'centimeters' | 'normalized' | 'pixels'
Font size units, specified as one of the values in this
table.
Units |
Description |
|---|---|
'points' |
Points. One point equals 1/72 inch. |
'inches' |
Inches. |
'centimeters' |
Centimeters. |
'normalized'
|
Interpret font size as a fraction of the parent container height, typically a figure. If you resize the container, the font size modifies accordingly. For example, if the FontSize is0.1 in normalized units, then thetext is 1/10 of the container height. |
'pixels' |
Pixels. Starting in R2015b, distances in pixels are
On Linux® systems, the size of a pixel is |
If you set both the font size and the font units in one function call, you
must set the FontUnits property first so that the axes
correctly interprets the specified font size.
Text Box
expand all
FitBoxToText — Option to fit box width and height to text
'on' (default) | on/off logical value
Option to fit the box width and height to the text, specified as
'on' or 'off', or as numeric or
logical 1 (true) or
0 (false). A value of
'on' is equivalent to true, and
'off' is equivalent to false.
Thus, you can use the value of this property as a logical value. The value
is stored as an on/off logical value of type matlab.lang.OnOffSwitchState.
-
'on'— Resize the text box to fit
the text. -
'off'— Wrap the text to fit the
width of the text box. Wrapping can cause some of the text to
extend below the text box.
If you resize a text box when in plot edit mode, or if you
change the Position property, then the
FitBoxToText property changes to
'off'.
EdgeColor — Color of box outline
[0 0 0]
(default) | RGB triplet | hexadecimal color code | 'r' | 'g' | 'b' | …
Color of box outline, specified as a three-element RGB triplet, a
hexadecimal color code, a color name, or a short name. The default value of
[0 0 0] corresponds to black.
For a custom color, specify an RGB triplet or a hexadecimal color code.
-
An RGB triplet is a three-element row vector whose elements
specify the intensities of the red, green, and blue
components of the color. The intensities must be in the
range[0,1], for example,[0.4.
0.6 0.7] -
A hexadecimal color code is a character vector or a string
scalar that starts with a hash symbol (#)
followed by three or six hexadecimal digits, which can range
from0toF. The
values are not case sensitive. Therefore, the color codes
"#FF8800",
"#ff8800",
"#F80", and
"#f80"are equivalent.
Alternatively, you can specify some common colors by name. This table lists the named color
options, the equivalent RGB triplets, and hexadecimal color codes.
| Color Name | Short Name | RGB Triplet | Hexadecimal Color Code | Appearance |
|---|---|---|---|---|
"red" |
"r" |
[1 0 0] |
"#FF0000" |
|
"green" |
"g" |
[0 1 0] |
"#00FF00" |
|
"blue" |
"b" |
[0 0 1] |
"#0000FF" |
|
"cyan"
|
"c" |
[0 1 1] |
"#00FFFF" |
|
"magenta" |
"m" |
[1 0 1] |
"#FF00FF" |
|
"yellow" |
"y" |
[1 1 0] |
"#FFFF00" |
|
"black" |
"k" |
[0 0 0] |
"#000000" |
|
"white" |
"w" |
[1 1 1] |
"#FFFFFF" |
|
"none" |
Not applicable | Not applicable | Not applicable | No color |
Here are the RGB triplets and hexadecimal color codes for the default colors MATLAB uses in many types of plots.
| RGB Triplet | Hexadecimal Color Code | Appearance |
|---|---|---|
[0 0.4470 0.7410] |
"#0072BD" |
|
[0.8500 0.3250 0.0980] |
"#D95319" |
|
[0.9290 0.6940 0.1250] |
"#EDB120" |
|
[0.4940 0.1840 0.5560] |
"#7E2F8E" |
|
[0.4660 0.6740 0.1880] |
"#77AC30" |
|
[0.3010 0.7450 0.9330] |
"#4DBEEE" |
|
[0.6350 0.0780 0.1840] |
"#A2142F" |
|
Example: 'blue'
Example: [0 0 1]
Example: '#0000FF'
BackgroundColor — Color of text box background
'none'
(default) | RGB triplet | hexadecimal color code | 'r' | 'g' | 'b' | …
Color of text box background, specified as an RGB triplet, a hexadecimal
color code, a color name, or a short name.
For a custom color, specify an RGB triplet or a hexadecimal color code.
-
An RGB triplet is a three-element row vector whose elements
specify the intensities of the red, green, and blue
components of the color. The intensities must be in the
range[0,1], for example,[0.4.
0.6 0.7] -
A hexadecimal color code is a character vector or a string
scalar that starts with a hash symbol (#)
followed by three or six hexadecimal digits, which can range
from0toF. The
values are not case sensitive. Therefore, the color codes
"#FF8800",
"#ff8800",
"#F80", and
"#f80"are equivalent.
Alternatively, you can specify some common colors by name. This table lists the named color
options, the equivalent RGB triplets, and hexadecimal color codes.
| Color Name | Short Name | RGB Triplet | Hexadecimal Color Code | Appearance |
|---|---|---|---|---|
"red" |
"r" |
[1 0 0] |
"#FF0000" |
|
"green" |
"g" |
[0 1 0] |
"#00FF00" |
|
"blue" |
"b" |
[0 0 1] |
"#0000FF" |
|
"cyan"
|
"c" |
[0 1 1] |
"#00FFFF" |
|
"magenta" |
"m" |
[1 0 1] |
"#FF00FF" |
|
"yellow" |
"y" |
[1 1 0] |
"#FFFF00" |
|
"black" |
"k" |
[0 0 0] |
"#000000" |
|
"white" |
"w" |
[1 1 1] |
"#FFFFFF" |
|
"none" |
Not applicable | Not applicable | Not applicable | No color |
Here are the RGB triplets and hexadecimal color codes for the default colors MATLAB uses in many types of plots.
| RGB Triplet | Hexadecimal Color Code | Appearance |
|---|---|---|
[0 0.4470 0.7410] |
"#0072BD" |
|
[0.8500 0.3250 0.0980] |
"#D95319" |
|
[0.9290 0.6940 0.1250] |
"#EDB120" |
|
[0.4940 0.1840 0.5560] |
"#7E2F8E" |
|
[0.4660 0.6740 0.1880] |
"#77AC30" |
|
[0.3010 0.7450 0.9330] |
"#4DBEEE" |
|
[0.6350 0.0780 0.1840] |
"#A2142F" |
|
Example: 'blue'
Example: [0 0 1]
Example: '#0000FF'
FaceAlpha — Transparency of background color
1 (default) | scalar value between 0 and 1 inclusive
Transparency of the background color, specified as a scalar value between
0 and 1. If the value is 1, then the color is opaque. To add transparency,
set the property to a value closer to 0, where 0 is completely
transparent.
LineStyle — Line style of box outline
'-' (default) | '--' | ':' | '-.' | 'none'
Line style of box outline, specified as one of the options listed in this
table.
| Line Style | Description |
|---|---|
'-' |
Solid line |
'--' |
Dashed line |
':' |
Dotted line |
'-.' |
Dash-dotted line |
'none' |
Box outline is invisible |
LineWidth — Width of box outline
0.5 (default) | scalar numeric value
Width of box outline, specified as a scalar numeric value in
point units. One point equals 1/72 inch.
Example: 1.5
Margin — Space around text within the text box
5 (default) | scalar numeric value
The space around the text within the text box, specified as a scalar
numeric value in pixel units.
Position
expand all
Position — Size and location
[0.3 0.3 0.1 0.1] (default) | four-element vector
Size and location, specified as a four-element vector of the form
[x_begin y_begin length height]. The first two
elements specify the coordinates for the lower-left corner of the text box.
The second two elements specify the length and height of the text
box.
By default, the units are normalized to the figure. The lower-left corner
of the figure maps to (0,0), and the upper-right corner
maps to (1,1). To change the units, use the
Units property.
Note
If the FitBoxToText property is set to
'on' and you change the String
property, then the Position property might not
reflect the latest changes until the next time the screen refreshes. To
ensure that the position value reflects the latest changes, call
drawnow before querying the position when working
in a script or function.
Example: [0.2 0.3 0.4 0.5]
Rotation — Rotation angle in degrees
0 (default) | scalar numeric value
Rotation angle in degrees, specified as a scalar numeric value. Rotation angle is absolute
and not relative to previous rotations.
This table shows the resulting annotation rotation for the possible
Rotation values.
| Rotation Value | Resulting Rotation |
|---|---|
| 0 | Unrotated |
| Positive scalar value | Rotated counterclockwise by the specified number of degrees |
| Negative scalar value | Rotated clockwise by the specified number of degrees |
The anchor point for rotation is the location specified by the first two elements of the
Position property vector, indicated by the [x y]
values.
Example: 45
Position units, specified as one of the values in this table.
Units |
Description |
|---|---|
'normalized' (default) |
Normalized with respect to the figure, uipanel, or uitab that contains the annotation. The lower-left corner of the container maps to (0,0) and the upper-right corner maps to (1,1). |
'inches' |
Inches. |
'centimeters' |
Centimeters. |
'characters' |
Based on the default system font character size.
|
'points' |
Points. One point equals 1/72 inch. |
'pixels' |
Pixels. Starting in R2015b, distances in
On Linux systems, the size of a pixel is determined |
All units are measured from the lower-left corner of the figure
window.
This property affects the Position property.
If you change the units, then it is good practice to return it to
the default value after completing your computation to prevent affecting
other functions that assume Units is set to the
default value.
If you specify the Position and Units properties
as Name,Value pairs when creating the object, then
the order of specification matters. If you want to define the position
with particular units, then you must set the Units property
before the Position property.
Horizontal alignment of the text within the text box, specified
as one of the values in this table.
| Value | Result |
|---|---|
'left' |
|
'center' |
|
'right' |
|
Vertical alignment of the text within the text box, specified
as one of the values in this table.
| Value | Result |
|---|---|
'top' |
|
'middle' |
|
'bottom' |
|
Note
The 'cap' and 'baseline' values
are not recommended. Use the 'top' and 'bottom' values,
respectively, instead.
Version History
Introduced before R2006a
expand all
R2022a: Rotate annotation
Rotate the annotation the specified number of degrees using the
Rotation property. The anchor point for rotation is the location
specified by the Position property, so the
Position property is unaffected by rotation.
I want to change Font Size for xlabel, ylabel, axis size, legend font size a.k.a everything at once, is this possible? By default, font is Helvetica 10.
Is there way to change this?
I want to use ‘FontSize’,14, for x or y labels.
![]()
Matteo Ragni
2,7771 gold badge22 silver badges33 bronze badges
asked Jan 19, 2012 at 22:43
![]()
Jonas’s answer is good, but I had to modify it slightly to get every piece of text on the screen to change:
set(gca,'FontSize',30,'fontWeight','bold')

set(findall(gcf,'type','text'),'FontSize',30,'fontWeight','bold')
answered Jul 11, 2012 at 18:55
![]()
sergeyfsergeyf
1,00411 silver badges10 bronze badges
1
If you want to change font size for all the text in a figure, you can use findall to find all text handles, after which it’s easy:
figureHandle = gcf;
%# make all text in the figure to size 14 and bold
set(findall(figureHandle,'type','text'),'fontSize',14,'fontWeight','bold')
answered Jan 19, 2012 at 22:58
![]()
JonasJonas
74.5k10 gold badges137 silver badges177 bronze badges
1
It’s possible to change default fonts, both for the axes and for other text, by adding the following lines to the startup.m file.
% Change default axes fonts.
set(0,'DefaultAxesFontName', 'Times New Roman')
set(0,'DefaultAxesFontSize', 14)

% Change default text fonts.
set(0,'DefaultTextFontname', 'Times New Roman')
set(0,'DefaultTextFontSize', 14)
If you don’t know if you have a startup.m file, run
which startup
to find its location. If Matlab says there isn’t one, run
userpath
to know where it should be placed.
answered Jan 21, 2012 at 23:18
![]()
If anyone was wondering how to change the font sizes without messing around with the Matlab default fonts, and change every font in a figure, I found this thread where suggests this:
set(findall(fig, '-property', 'FontSize'), 'FontSize', 10, 'fontWeight', 'bold')
findall is a pretty handy command and in the case above it really finds all the children who have a 'FontSize' property: axes lables, axes titles, pushbuttons, etc.
Hope it helps.
answered Nov 12, 2013 at 0:04
![]()
p8mep8me
1,8401 gold badge15 silver badges23 bronze badges
To change the title font size, use the following example
title('mytitle','FontSize',12);
to the change the graph axes label font size, do the following
axes('FontSize',24);
answered Jan 19, 2012 at 22:53
![]()
sureshsuresh
1,1091 gold badge8 silver badges24 bronze badges
Jonas’s answer does not change the font size of the axes.
Sergeyf’s answer does not work when there are multiple subplots.
Here is a modification of their answers that works for me when I have multiple subplots:
set(findall(gcf,'type','axes'),'fontsize',30)
set(findall(gcf,'type','text'),'fontSize',30)
answered Sep 4, 2013 at 11:43
![]()
omianomian
511 silver badge3 bronze badges
To change the default property for your entire MATLAB session, see the documentation on how default properties are handled.
As an example:
set(0,'DefaultAxesFontSize',22)
x=1:200; y=sin(x);
plot(x,y)
title('hello'); xlabel('x'); ylabel('sin(x)')
answered Jan 19, 2012 at 23:02
![]()
mbaumanmbauman
30.6k4 gold badges89 silver badges123 bronze badges
0
7 ответов
Ответ Jonas — это хорошо, но мне пришлось немного изменить его, чтобы изменить каждый текст на экране:
set(gca,'FontSize',30,'fontWeight','bold')

set(findall(gcf,'type','text'),'FontSize',30,'fontWeight','bold')
sergeyf
11 июль 2012, в 19:47
Поделиться
Если вы хотите изменить размер шрифта для всего текста на рисунке, вы можете использовать findall, чтобы найти все текстовые дескрипторы, после чего легко:
figureHandle = gcf;
%# make all text in the figure to size 14 and bold
set(findall(figureHandle,'type','text'),'fontSize',14,'fontWeight','bold')
Jonas
20 янв. 2012, в 00:25
Поделиться
Можно изменить шрифты по умолчанию, как для осей, так и для другого текста, добавив следующие строки в файл startup.m.
% Change default axes fonts.
set(0,'DefaultAxesFontName', 'Times New Roman')
set(0,'DefaultAxesFontSize', 14)

% Change default text fonts.
set(0,'DefaultTextFontname', 'Times New Roman')
set(0,'DefaultTextFontSize', 14)
Если вы не знаете, есть ли файл startup.m, запустите
which startup
чтобы найти его местоположение. Если Matlab говорит, что его нет, запустите
userpath
чтобы узнать, где он должен быть размещен.
Alexandre Chabot
22 янв. 2012, в 01:13
Поделиться
Если кто-то задавался вопросом, как изменить размер шрифта, не вмешиваясь в шрифты по умолчанию Matlab и изменить каждый шрифт на фигуре, я нашел эта нить, где предлагает это:
set(findall(fig, '-property', 'FontSize'), 'FontSize', 10, 'fontWeight', 'bold')
findall — довольно удобная команда, и в приведенном выше случае он действительно находит всех детей, у которых есть свойство 'FontSize': осями, названиями осей, кнопками и т.д.
Надеюсь, что это поможет.
pm89
12 нояб. 2013, в 00:22
Поделиться
Ответ Jonas не изменяет размер шрифта осей.
Ответ Sergeyf не работает, когда есть несколько подзаговоров.
Вот модификация их ответов, которая работает для меня, когда у меня есть несколько подзаговоров:
set(findall(gcf,'type','axes'),'fontsize',30)
set(findall(gcf,'type','text'),'fontSize',30)
omian
04 сен. 2013, в 12:48
Поделиться
Чтобы изменить размер шрифта заголовка, используйте следующий пример
title('mytitle','FontSize',12);
чтобы изменить размер шрифта метки осей графа, выполните следующие действия
axes('FontSize',24);
suresh
19 янв. 2012, в 23:47
Поделиться
Чтобы изменить свойство по умолчанию для всего сеанса MATLAB, см. документацию по как обрабатываются свойства по умолчанию.
В качестве примера:
set(0,'DefaultAxesFontSize',22)
x=1:200; y=sin(x);
plot(x,y)
title('hello'); xlabel('x'); ylabel('sin(x)')
Matt B.
19 янв. 2012, в 23:48
Поделиться
Ещё вопросы
- 1Уберите это «$,. Строки в Robot Framework
- 1Как убрать перекрестие с полей в d3.js?
- 1Jframe ничего не показывает и «не может быть приведен к java.applet.Applet»
- 0Ограничение текстового поля цифрами ИЛИ одной из двух неповторяющихся строк, используя только регулярные выражения
- 0Ключ JQuery не определен в локальном хранилище
- 0Добавить текст в XML-файл через php в AS3
- 0jqGrid Редактирование нескольких строк не сохраняется в базе данных в iOS7
- 0Как я могу узнать, сколько раз пятница 13-го появляется в году?
- 0Почему onmouseover и onclick не будут работать вместе, устанавливая стили div, и как сбросить стили набора onclick, не теряя onmouseover?
- 0PHP создать команду копирования, как phpmyadmin
- 0Как отправить динамически созданные входные (или текстовые) значения в iframe и показать его как HTML внутри iframe?
- 0openCV — система anpr. Улучшить показатель успеха
- 1Вычислить среднее значение для каждой строки тензора в TensorFlow
- 0Обновить список в ng-repeat без функции onclick
- 0SQL-логика Silverstripe
- 0GMP неисправен алгоритм наивной простоты c ++
- 1событие шаблона для ожидания подписки до collection.find
- 0WriteFIle зависает
- 1Реализация интерфейса с типом возврата, который реализует требуемый тип возврата
- 0Дно границы отсутствует
- 1Переключение между неопределенным ProgressBar и Image в ViewSwitcher
- 1Размер изображения с Selenium
- 1Реализация пользовательского набора данных с помощью PyTorch
- 0Как я могу использовать angularjs OrderBy и ng-repeat для последовательной итерации списка (10-секундные интервалы)?
- 0Невозможно определить стабильный пакет композитора
- 1Это значение по сравнению со значением?
- 0preg_replace несколько строк в скобках (php / regex)
- 1Android OutOfMemoryError: размер растрового изображения превышает бюджет виртуальной машины
- 1Как заставить самсунг момент соединиться с adb
- 1Как удалить файлы в AppData / Temp после загрузки файла с помощью .NET WebAPI 2? Ошибка файла в использовании
- 0делаю прокрутку div с процентом
- 0LNK2019: неразрешенный внешний символ в функции
- 1Оси Y тикают с неправильным вращением
- 1Dojo themePreviewer застрял «Загрузка…»
- 0C ++ Статический массив
- 1вид с макета
- 1Обработка 2.0 Фильм не может открыть файл фильма при запуске из банки
- 0Сравнение Javascript window.location.href с index.php или корневым именем
- 0Angular — вызов функции, когда все JS загружены
- 0Angular — вернуть разницу в неработающих объектах
- 1NullPointerException с небезопасным классом в Java
- 0PHP REGEXP для замены строк на URL-адреса в тегах <p>
- 1Переход от Jdialog к Jframe
- 0Бэкэнд без состояния безопасен?
- 1Разница между C # dll, созданной на локальном компьютере, и сервером сборки TFS
- 1Завершение работы Java-исполнителя при завершении программы
- 0Пустая проверка объекта JSON
- 1Gmail контент-провайдер для доступа к сообщениям
- 0Сервер коротких URL Nginx Rewrite только в URL подпапок
- 0Форма обратной связи php скрипт для отправки спама в Gmail
Maybe I’m getting old, but the text in Matlab’s built-in help browser is too small for me to read comfortably. It is possible to increase the font size using Ctrl—+, but every time a new help page is loaded, this change is lost
How can I permanently increase the font size?
![]()
Kevin Panko
7,22622 gold badges43 silver badges52 bronze badges
asked May 21, 2015 at 16:07
![]()
This has been tested with Matlab R2015a on Linux, but I’d expect it to work on other platforms and maybe earlier versions, too.
Matlab’s documentation is in the form of HTML, and the help browser is basically a web browser displaying locally stored files. There are several central style files, but the most important one appears to be
/opt/MATLAB/R2015a/help/includes/product/css/reset.css
Open this file (as root / administrator) in a text editor, and append the line
html { zoom: 1.5; }
Adjust the number to your liking.
answered May 21, 2015 at 16:07
![]()
A. DondaA. Donda
7991 gold badge5 silver badges24 bronze badges
2
for R2014a, in /opt/MATLAB/R2015a/help/includes/product/css/reset.css, alter the value in the field
font-size:100%
to your liking. start with 105% — it’s sensitive.
Note that you don’t have to restart Matlab, just close the help window and re-open after you save the file. You can iterate quickly to find your desired zoom.
![]()
user
29.1k11 gold badges99 silver badges144 bronze badges
answered Apr 1, 2016 at 18:36
![]()
1