canvas_textbox = canvas.create_text() will return an object id(numeric)
Firstly, Bind the canvas to the mouse. Then pass the mouse position to closest=canvas.find_closest(x, y), which will return the item(s) id under the x,y position.
Now check whether the object id text is in the closest. If it is in the closest use create_window to place the Entry widget at the mouse position or the position f your choice.
Here is the code:
from tkinter import *
from PIL import Image, ImageTk

def update(event):
    canvas.delete('entry')
    canvas.itemconfig(tagOrId='text', text=text_box.get())

def clicked(event):

    closest = canvas.find_closest(event.x, event.y)# returns the closest item to x, y in the form of tuple

    if 2 in closest:
        canvas.itemconfig(tagOrId='text', text='')
        canvas.create_window(event.x, event.y, window=text_box, tag='entry')
    else:
        print('No')

window = Tk()
canvas = Canvas(window,width=300, height=300, bd=0)
canvas.pack()

background = ImageTk.PhotoImage(Image.open(r"path.jpg")) # can be any background image
canvas.create_image(300,300,image=background)

canvas_textbox = canvas.create_text(20, 70, text='TOUCH ME TO EDIT THIS TEXT', anchor=NW, fill="lime", tag='text')
text_box = Entry(window)
text_box.bind('<Return>', update)

print(canvas.find_all()) # returns all the items in canvas as tuple

canvas.bind('<Button>', clicked)

window.mainloop()
Or you may also try this:
from tkinter import *
from PIL import Image, ImageTk

def update(event):
    canvas.delete('entry')
    canvas.itemconfig(tagOrId='text', text=text_box.get())

def clicked(event):

    closest = canvas.find_closest(event.x, event.y)# returns the closest item to x, y in the form of tuple
    x, y = canvas.coords(closest)

    if canvas_textbox in closest:
        canvas.itemconfig(tagOrId='text', text='')
        canvas.create_window(x+100, y, window=text_box, tag='entry')

    else:
        print('No')

window = Tk()
canvas = Canvas(window,width=300, height=300, bd=0)
canvas.pack()

background = ImageTk.PhotoImage(Image.open(r"image")) # can be any background image
canvas.create_image(300,300,image=background)

canvas_textbox = canvas.create_text(20, 70, text='TOUCH ME TO EDIT THIS TEXT', anchor=NW, fill="lime", tag='text')
text_box = Entry(window, borderwidth=0, highlightthickness=0)
text_box.insert(0, 'TOUCH ME TO EDIT THIS TEXT')
print(canvas.coords(2))
text_box.bind('<Return>', update)

print(canvas.find_all()) # returns all the items in canvas as tuple

canvas.bind('<Double-1>', clicked)

window.mainloop()
(double click on the text)
В этой части изучения Tkinter мы немного порисуем. Рисование в Tkinter реализовано при помощи виджета Canvas. Это функционал высокого уровня, который позволяет создавать графику в Tkinter. Рисование можно использовать для создания графиков статистики, самодельных пользовательских виджетов и даже небольших игр.
Содержание курса
- Создание окна по центру и кнопка выхода в Tkinter
- Разметка виджетов в Tkinter — pack, grid и place
- Виджеты Checkbutton, Label, Scale и Listbox в Tkinter
- Меню, подменю и панель инструментов в Tkinter
- Диалоговые окна в Tkinter — Выбор цвета — Выбор файла
- Рисуем линии, прямоугольники, круг и текст в Tkinter
- Пишем игру змейка на Tkinter
Содержание статьи
- Рисуем линии в Tkinter — create_line()
- Создаем цветные прямоугольники в Tkinter
- Рисуем различные формы в Tkinter
- Вставляем изображение в Canvas
- Меняем шрифт и рисуем текст в Tkinter
Рисуем линии в Tkinter — create_line()
Линия – это примитивный геометрический элемент. На виджете Canvas создать линию можно при помощи метода create_line().
|
1 2 3 4 5 6 7 8 9 10 11 12 13 14 15 16 17 18 19 20 21 22 23 24 25 26 27 28 29 30 |
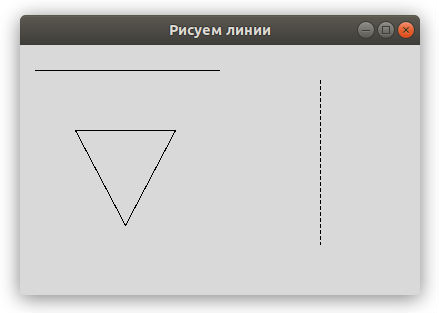
from tkinter import Tk, Canvas, Frame, BOTH class Example(Frame): def __init__(self): super().__init__() self.initUI() def initUI(self): self.master.title(«Рисуем линии») self.pack(fill=BOTH, expand=1) canvas = Canvas(self) canvas.create_line(15, 25, 200, 25) canvas.create_line(300, 35, 300, 200, dash=(4, 2)) canvas.create_line(55, 85, 155, 85, 105, 180, 55, 85) canvas.pack(fill=BOTH, expand=1) def main(): root = Tk() ex = Example() root.geometry(«400×250+300+300») root.mainloop() if __name__ == ‘__main__’: main() |
В примере нашего кода, мы рисуем простые линии в Tkinter.
|
canvas.create_line(15, 25, 200, 25) |
Параметрами метода create_line() являются координаты x и y, которые обозначают стартовые и конечные точки линии.
|
canvas.create_line(300, 35, 300, 200, dash=(4, 2)) |
Мы нарисовали вертикальную линию. Опция dash позволяет создать пунктированную линию. Множества (4, 3) означает:
- 4 — длинна тире или точки в пикселях;
- 2 — пустой промежуток между тире либо точками.
Если указать dash=(1, 1) то у нас будет линия из точек.
|
canvas.create_line(55, 85, 155, 85, 105, 180, 55, 85) |
Метод create_line() может содержать несколько конечных точек, которые будут пресекаться линией. Согласно этому коду мы нарисовали треугольник имея три координата разных точек.
Цвет является объектом, который отображает комбинацию Красного, Зеленого и Синего цветов (RGB).
|
1 2 3 4 5 6 7 8 9 10 11 12 13 14 15 16 17 18 19 20 21 22 23 24 25 26 27 28 29 30 31 32 33 34 35 36 37 38 39 40 41 |
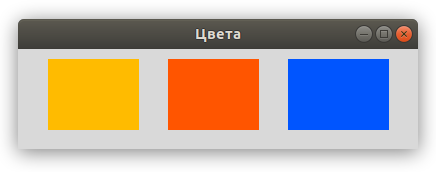
from tkinter import Tk, Canvas, Frame, BOTH class Example(Frame): def __init__(self): super().__init__() self.initUI() def initUI(self): self.master.title(«Цвета») self.pack(fill=BOTH, expand=1) canvas = Canvas(self) canvas.create_rectangle( 30, 10, 120, 80, outline=«#fb0», fill=«#fb0» ) canvas.create_rectangle( 150, 10, 240, 80, outline=«#f50», fill=«#f50» ) canvas.create_rectangle( 270, 10, 370, 80, outline=«#05f», fill=«#05f» ) canvas.pack(fill=BOTH, expand=1) def main(): root = Tk() ex = Example() root.geometry(«400×100+300+300») root.mainloop() if __name__ == ‘__main__’: main() |
В данном примере мы нарисовали прямоугольники и закрасили их разными цветами. Мы ранее работали с выбором цвета в Tkinter используя диалоговое окно цветовой палитры.
Мы создали виджет canvas.
|
canvas.create_rectangle( 30, 10, 120, 80, outline=«#fb0», fill=«#fb0» ) |
Есть вопросы по Python?
На нашем форуме вы можете задать любой вопрос и получить ответ от всего нашего сообщества!
Telegram Чат & Канал
Вступите в наш дружный чат по Python и начните общение с единомышленниками! Станьте частью большого сообщества!
Паблик VK
Одно из самых больших сообществ по Python в социальной сети ВК. Видео уроки и книги для вас!
С помощью create_rectangle() мы создаем прямоугольник на холсте. Первыми четырьмя параметрами являются x и y координаты двух ограничительных точек: верхней левой и нижней правой. При помощи параметра outline мы можем задать цвет контура прямоугольников. А параметр fill используется для окрашивания всей внутренней области прямоугольника.
Рисуем различные формы в Tkinter
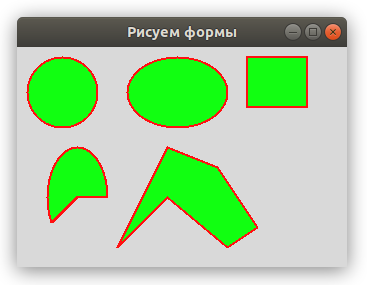
На холсте мы можем нарисовать самые разнообразные формы. На представленном ниже примере показаны некоторые из них.
|
1 2 3 4 5 6 7 8 9 10 11 12 13 14 15 16 17 18 19 20 21 22 23 24 25 26 27 28 29 30 31 32 33 34 35 36 37 38 39 40 41 42 43 44 45 46 47 48 49 50 51 52 53 54 55 56 57 58 59 |
from tkinter import Tk, Canvas, Frame, BOTH class Example(Frame): def __init__(self): super().__init__() self.initUI() def initUI(self): self.master.title(«Рисуем формы») self.pack(fill=BOTH, expand=1) canvas = Canvas(self) # Овальная форма. canvas.create_oval( 10, 10, 80, 80, outline=«#f11», fill=«#1f1», width=2 ) # Овальная форма. canvas.create_oval( 110, 10, 210, 80, outline=«#f11», fill=«#1f1», width=2 ) # Рисуем прямоугольник. canvas.create_rectangle( 230, 10, 290, 60, outline=«#f11», fill=«#1f1», width=2 ) # Рисуем дугу. canvas.create_arc( 30, 200, 90, 100, start=0, extent=210, outline=«#f11», fill=«#1f1», width=2 ) points = [ 150, 100, 200, 120, 240, 180, 210, 200, 150, 150, 100, 200 ] # Рисуем многоугольник. canvas.create_polygon(points, outline=‘#f11’, fill=‘#1f1’, width=2) canvas.pack(fill=BOTH, expand=1) def main(): root = Tk() ex = Example() root.geometry(«330×220+300+300») root.mainloop() if __name__ == ‘__main__’: main() |
Мы нарисовали разные формы в окне:
- круг;
- овал;
- прямоугольник;
- дугу и многугольник.
Контур окрашен в красный цвет, фигуры были наполнены зеленым цветом. Ширина контура указана в 2 пикселя.
|
canvas.create_oval( 10, 10, 80, 80, outline=«red», fill=«green», width=2 ) |
Метод create_oval() используется для того, чтобы создать круг в Tkinter. Первые четыре параметра определяют ограничивающие координаты фигуры. Иными словами, это x и y координаты верхней левой и правой нижней точек квадрата, в который помещен круг.
|
canvas.create_rectangle( 230, 10, 290, 60, outline=«#f11», fill=«#1f1», width=2 ) |
Мы нарисовали прямоугольник в Tkinter. Координаты снова обозначают ограничительные точки с координатами x и y..
|
canvas.create_arc( 30, 200, 90, 100, start=0, extent=210, outline=«#f11», fill=«#1f1», width=2 ) |
С помощью этого кода мы создаем дугу. Дуга является частью круга. Мы указывает ограничительные координаты нашей дуги.
Успейте заказать просмотры на видео в YouTube ДокторСмм по наиболее дешевой цене с большими оптовыми скидками. Кроме того, с заказом Вы сможете получить также персональные условия на приобретение ресурса с возможностью выбора более подходящей для Вашей ситуации скорости поступления просмотров. Торопитесь, скидки действуют ограниченное время!
С помощью параметра start мы устанавливаем угол дуги. Параметр extent указывает на размер угла.
|
points = [ 150, 100, 200, 120, 240, 180, 210, 200, 150, 150, 100, 200 ] canvas.create_polygon( points, outline=‘red’, fill=‘green’, width=2 ) |
Данный код позволяет нам создать многоугольник. У этой фигуры присутствует большое количество углов. Чтобы создать многоугольник в Tkinter, нам нужно задать несколько координат, используя метод create_polygon().
Вставляем изображение в Canvas
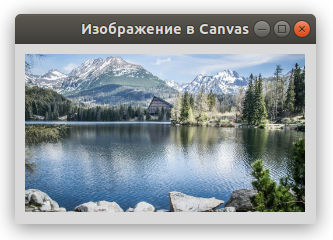
В данном примере мы рассмотрим, как вставить изображение в canvas виджете.
В данном примере используется файл изображения tatras.jpg который нужно сохранить рядом с нами кодом:
- tatras.jpg
|
1 2 3 4 5 6 7 8 9 10 11 12 13 14 15 16 17 18 19 20 21 22 23 24 25 26 27 28 29 30 31 32 33 34 |
from tkinter import Tk, Canvas, Frame, BOTH, NW from PIL import Image, ImageTk class Example(Frame): def __init__(self): super().__init__() self.initUI() def initUI(self): self.master.title(«Изображение в Canvas») self.pack(fill=BOTH, expand=1) self.img = Image.open(«tatras.jpg») self.tatras = ImageTk.PhotoImage(self.img) canvas = Canvas( self, width=self.img.size[0]+20, height=self.img.size[1]+20 ) canvas.create_image(10, 10, anchor=NW, image=self.tatras) canvas.pack(fill=BOTH, expand=1) def main(): root = Tk() ex = Example() root.mainloop() if __name__ == ‘__main__’: main() |
В примере продемонстрировано как добавить изображение в Canvas.
|
self.img = Image.open(«tatras.jpg») self.tatras = ImageTk.PhotoImage(self.img) |
Из библиотеки Pillow мы используем модули Image и ImageTk.
|
canvas = Canvas( self, width=self.img.size[0]+20, height=self.img.size[1]+20 ) |
Мы создаем виджет Canvas. Учитываем размеры изображения. Холст будет на 20 пикселей шире и на 20 пикселей выше, нежели наше изображение.
|
canvas.create_image(10, 10, anchor=NW, image=self.tatras) |
Мы используем метод create_image(), чтобы создать изображение на холсте. Чтобы показать изображение, оно закрепляется в северном и западном направлениях anchor=NW нашего окна. Параметр image позволяет отобразить изображение.
Меняем шрифт и рисуем текст в Tkinter
В последнем примере мы рассмотрим рисование текста используя виджет Canvas в Tkinter.
|
1 2 3 4 5 6 7 8 9 10 11 12 13 14 15 16 17 18 19 20 21 22 23 24 25 26 27 28 29 30 31 32 33 34 35 36 37 38 39 40 41 42 43 44 45 46 47 48 49 50 51 52 53 54 55 56 |
from tkinter import Tk, Canvas, Frame, BOTH, W class Example(Frame): def __init__(self): super().__init__() self.initUI() def initUI(self): self.master.title(«Текст и Шрифт в Tkinter») self.pack(fill=BOTH, expand=1) canvas = Canvas(self) canvas.create_text( 20, 30, anchor=W, font=«DejavuSansLight», text=«Красное солнце сгорает дотла» ) canvas.create_text( 20, 60, anchor=W, font=«Arial», text=«На пылающий город падает тень» ) canvas.create_text( 20, 130, anchor=W, font=«TimesNewRoman», text=«Перемен!» ) canvas.create_text( 20, 160, anchor=W, font=«ComicSans», text=«Требуют наши сердца» ) canvas.create_text( 20, 190, anchor=W, font=«FreeSerif», text=«Перемен!» ) canvas.create_text( 20, 220, anchor=W, font=«LatoThin», text=«Требуют наши глаза» ) canvas.pack(fill=BOTH, expand=1) def main(): root = Tk() ex = Example() root.geometry(«420×250+300+300») root.mainloop() if __name__ == ‘__main__’: main() |
Мы рисуем слова из песни в нашем окне.
|
canvas.create_text( 20, 30, anchor=W, font=«DejavuSansLight», text=«Красное солнце сгорает дотла» ) |
Первые два параметра – это x и y координаты центральной точки текста. Если мы закрепим текстовый объект по направлению запада anchor=W, текст будет начинаться в этой части окна. Параметр font позволяет нам менять шрифт текста, а параметр text отображает написанный текст в окне.
Являюсь администратором нескольких порталов по обучению языков программирования Python, Golang и Kotlin. В составе небольшой команды единомышленников, мы занимаемся популяризацией языков программирования на русскоязычную аудиторию. Большая часть статей была адаптирована нами на русский язык и распространяется бесплатно.
E-mail: vasile.buldumac@ati.utm.md
Образование
Universitatea Tehnică a Moldovei (utm.md)
- 2014 — 2018 Технический Университет Молдовы, ИТ-Инженер. Тема дипломной работы «Автоматизация покупки и продажи криптовалюты используя технический анализ»
- 2018 — 2020 Технический Университет Молдовы, Магистр, Магистерская диссертация «Идентификация человека в киберпространстве по фотографии лица»
activefill
|
The text color to be used when the text is active, that is, when the mouse is over it. For option values, see fill below.
|
activestipple
|
The stipple pattern to be used when the text is active. For option values, see stipple below.
|
anchor |
The default is anchor=tk.CENTER,meaning that the text is centered vertically and horizontally around position ( Section 5.5, “Anchors” for possible values. For example, if you specify anchor=tk.SW, the text will be positionedso its lower left corner is at point ( |
disabledfill
|
The text color to be used when the text object’sstate is tk.DISABLED.For option values, see fill below.
|
disabledstipple
|
The stipple pattern to be used when the text is disabled. For option values, see stipple below.
|
fill |
The default text color is black, but you can render it in any color by setting the fill option to that color. See Section 5.3, “Colors”.
|
font |
If you don’t like the default font, set this option to any font value. See Section 5.4, “Type fonts”. |
justify |
For multi-line textual displays, this option controls how the lines are justified: tk.LEFT (the default), tk.CENTER, or tk.RIGHT.
|
offset
|
The stipple offset to be used in rendering the text. For more information, see Section 5.14, “Matching stipple patterns”. |
state
|
By default, the text item’s state is tk.NORMAL. Set this option to tk.DISABLED to make in unresponsive tomouse events, or set it to tk.HIDDENto make it invisible. |
stipple |
A bitmap indicating how the text will be stippled. Default is stipple='',which means solid. A typical value would be stipple='gray25'. See Section 5.7, “Bitmaps”.
|
tags |
If a single string, the text object is tagged with that string. Use a tuple of strings to tag the object with multiple tags. See Section 8.4, “ Canvas tags”.
|
text |
The text to be displayed in the object, as a string. Use newline characters ( 'n') to force line breaks.
|
width |
If you don’t specify a widthoption, the text will be set inside a rectangle as long as the longest line. However, you can also set the width option to adimension, and each line of the text will be broken into shorter lines, if necessary, or even broken within words, to fit within the specified width. See Section 5.1, “Dimensions”. |
Скачайте код уроков с GitLab: https://gitlab.com/PythonRu/tkinter-uroki
В предыдущих материалах основное внимание было уделено стандартному виджету Tkinter. Однако вне внимания остался виджет Canvas. Причина в том, что он предоставляет массу графических возможностей и заслуживает отдельного рассмотрения.
Canvas (полотно) — это прямоугольная область, в которой можно выводить не только текст или геометрические фигуры, такие как линии, прямоугольники или овалы, но также другие виджеты Tkinter. Все вложенные объекты называются элементами Canvas, и у каждого есть свой идентификатор, с помощью которого ими можно манипулировать еще до момента отображения.
Рассмотрим методы класса Canvas на реальных примерах, что поможет познакомиться с распространенными паттернами, которые в дальнейшем помогут при создании приложений.
Понимание системы координат
Для рисования графических элементов на полотне, нужно обозначать их положение с помощью системы координат. Поскольку Canvas — это двумерная область, то точки будут обозначаться координатами горизонтальной и вертикальной осей — традиционными x и y соответственно.
На примере простого приложения можно легко изобразить, как именно стоит располагать эти точки по отношению к основанию системы координат, которая находится в верхнем левом углу области полотна.
Следующая программа содержит пустое полотно, а также метку, которая показывает положение курсора на нем. Можно перемещать курсор и видеть, в каком положении он находится. Это явно показывает, как изменяются координаты x и y в зависимости от положения курсора:
import tkinter as tk
class App(tk.Tk):
def __init__(self):
super().__init__()
self.title("Базовый canvas")
self.canvas = tk.Canvas(self, bg="white")
self.label = tk.Label(self)
self.canvas.bind("
", self.mouse_motion)
self.canvas.pack()
self.label.pack()
def mouse_motion(self, event):
x, y = event.x, event.y
text = "Позиция курсора: ({}, {})".format(x, y)
self.label.config(text=text)
if __name__ == "__main__":
app = App()
app.mainloop()
Как работает система координат
Экземпляр Canvas создается по аналогии с любым другим виджетом Tkinter. В него передаются родительский контейнер, а также все настройки в виде ключевых слов:
def __init__(self):

    # ...

    self.canvas = tk.Canvas(self, bg="white")

    self.label = tk.Label(self)

    self.canvas.bind("", self.mouse_motion)
Следующий скриншот показывает точку, составленную из перпендикулярных проекций двух осей:
- Координата x соответствует расстоянию по горизонтальной оси и увеличивается по мере движения слева направо;
- Координата y соответствует расстоянию по вертикальной оси и увеличивается по мере движения снизу вверх;
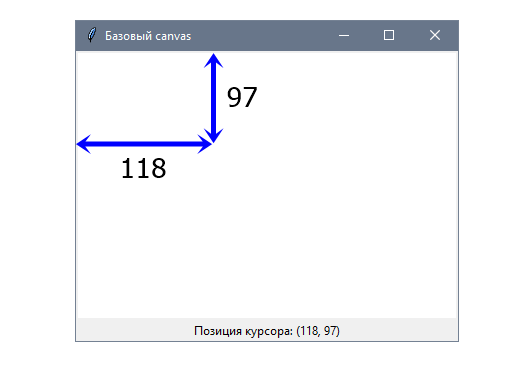
Можно обратить внимание на то, что эти координаты точно соответствуют атрибутам x и y экземпляра event, который был передан обработчику:
def mouse_motion(self, event):

    x, y = event.x, event.y

    text = "Позиция курсора: ({}, {})".format(x, y)

    self.label.config(text=text)
Так происходит из-за того, что атрибуты рассчитываются относительно виджета, к которому прикреплено событие — в этом случае это последовательность .
Площадь полотна также способна отображать элементы с отрицательными значениями их координат. В зависимости от размера элемента, он может быть частично виден у левой или верхней границ полотна.
Аналогично если расположить элемент так, что его координаты будут лежать за пределами полотна, то часть его будет видна у правого и нижнего краев.
Рисование линий и стрелок
Одно из базовых действий, которое можно выполнить на полотне — рисование сегментов от одной точки к другой. Хотя есть другие способы рисовать многоугольники, метод create_line класса Canvas предлагает достаточное количество опций для понимания основ отображения элементов.
В этом примере создадим приложение, которое позволит рисовать линии с помощью кликов по полотну. Каждая из них будет отображаться после двух кликов: первый будет указывать на начало линии, а второй — на ее конец.
Также можно будет задавать определенные элементы внешнего вида, например, толщину и цвет:
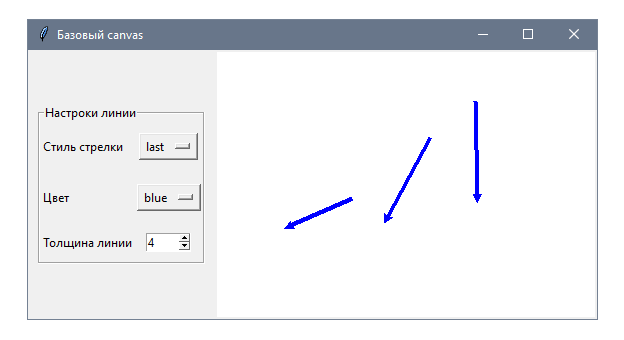
Класс App будет отвечать за создание пустого полотна и обработку кликов мышью.
Информация о линии будет идти из класса LineForm. Такой подход с выделением компонента в отдельный класс позволит абстрагировать детали его реализации и сфокусироваться на работе с виджетом Canvas.
Говоря простым словами, мы пропускаем реализацию класса LineForm в следующем коде:
import tkinter as tk
class LineForm(tk.LabelFrame):
# ...
class App(tk.Tk):
def __init__(self):
super().__init__()
self.title("Базовый canvas")
self.line_start = None
self.form = LineForm(self)
self.canvas = tk.Canvas(self, bg="white")
self.canvas.bind("
", self.draw)
self.form.pack(side=tk.LEFT, padx=10, pady=10)
self.canvas.pack(side=tk.LEFT)
def draw(self, event):
x, y = event.x, event.y
if not self.line_start:
self.line_start = (x, y)
else:
x_origin, y_origin = self.line_start
self.line_start = None
line = (x_origin, y_origin, x, y)
arrow = self.form.get_arrow()
color = self.form.get_color()
width = self.form.get_width()
self.canvas.create_line(*line, arrow=arrow,
fill=color, width=width)
if __name__ == "__main__":
app = App()
app.mainloop()
Весь код целиком можно найти в отдельном файле lesson_18/drawing.py.
Как рисовать линии в Tkinter
Поскольку нужно обрабатывать клики мышью на полотне, свяжем метод draw() с этим типом события. Также определим поле line_start, чтобы отслеживать начальное положение каждой линии:
def __init__(self):

    # ...

    self.line_start = None

    self.form = LineForm(self)

    self.canvas = tk.Canvas(self, bg="white")

    self.canvas.bind("", self.draw)
Метод draw() содержит основную логику приложения. Первый клик служит для определения начала для каждой линии и ничего не рисует. Координаты он получает из объекта event, который передается обработчику:
def draw(self, event):

    x, y = event.x, event.y

    if not self.line_start:

        self.line_start = (x, y)

    else:

        # ...
Если у line_start уже есть значение, то мы получаем его и передаем координаты текущего события, чтобы нарисовать линию:
def draw(self, event):

    x, y = event.x, event.y

    if not self.line_start:

        # ...

    else:

        x_origin, y_origin = self.line_start

        self.line_start = None

        line = (x_origin, y_origin, x, y)

        self.canvas.create_line(*line)

        text = "Линия проведена из ({}, {}) к ({}, {})".format(*line)
Метод canvas.create_line() принимает четыре аргумента, где первые два — это горизонтальная и вертикальная координаты начала линии, а вторые два — ее конечной точки.
В некоторых случаях появляется необходимость вывести на полотне текст. Для этого нет нужды использовать дополнительный виджет, такой как Label. Класс Canvas включает метод create_text для отображения строки, которой можно управлять точно так же, как и любым другим элементом полотна.
При этом есть возможность использовать те же параметры форматирования, что позволит задавать стиль текста: цвет, размер и семейство шрифтов.
В этом примере объединим виджет Entry с содержимым текстового элемента полотна. И если у первого будет стандартный стиль, то текст на полотне можно будет стилизовать:
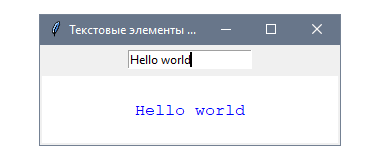
Текстовый элемент по умолчанию будет отображаться с помощью canvas.create_text() и дополнительными параметрами, которые позволят добавить семейство шрифтов Consolas и синий цвет.
Динамическое поведение текстового элемента реализовано с помощью StringVar. Отслеживая эту переменную Tkinter, можно менять содержимое элемента:
import tkinter as tk

class App(tk.Tk):

    def __init__(self):

        super().__init__()

        self.title("Текстовые элементы Canvas")

        self.geometry("300x100")

        self.var = tk.StringVar()

        self.entry = tk.Entry(self, textvariable=self.var)

        self.canvas = tk.Canvas(self, bg="white")

        self.entry.pack(pady=5)

        self.canvas.pack()

        self.update()

        w, h = self.canvas.winfo_width(), self.canvas.winfo_height()

        options = {"font": "courier", "fill": "blue",

                   "activefill": "red"}

        self.text_id = self.canvas.create_text((w / 2, h / 2), **options)

        self.var.trace("w", self.write_text)

    def write_text(self, *args):

        self.canvas.itemconfig(self.text_id, text=self.var.get())

if __name__ == "__main__":

    app = App()

    app.mainloop()
Можно ознакомиться с этой программой, введя любой текст в поле ввода, что автоматически обновит его на полотне.
Как работает вывод текста на полотно
В первую очередь создается экземпляр Entry с переменной StringVar и виджетом Canvas:
    self.var = tk.StringVar()

    self.entry = tk.Entry(self, textvariable=self.var)

    self.canvas = tk.Canvas(self, bg="white")
После этого виджеты размещаются с помощью вызовов методов geometry manager Pack. Важно отметить, что update() нужно вызывать в корневом окне, благодаря чему Tkinter будет вынужден обрабатывать все изменения, в данном случае — рендеринг виджетов до того, как метод __init__ продолжит выполнение:
    self.entry.pack(pady=5)

    self.canvas.pack()

    self.update()
Это делается, потому что на следующем шаге будут выполняться вычисления размеров полотна, и до тех пор пока geometry manager не разместит виджет, у него не будет реальных значений высоты и ширины.
После этого можно безопасно получить размеры полотна. Поскольку текст нужно выровнять относительно центра полотна, достаточно поделить значения ширины и длины пополам.
Эти координаты будут определять положение элемента, и вместе с параметрами стиля их нужно передать в метод create_text(). Аргумент-ключевое слово text — это стандартный параметр, но его можно пропустить, потому что он будет задаваться динамически при изменении значения StringVar:
    w, h = self.canvas.winfo_width(), self.canvas.winfo_height()

options = { "font": "courier", "fill": "blue",

                 "activefill": "red" }

    self.text_id = self.canvas.create_text((w/2, h/2), **options)

    self.var.trace("w", self.write_text)
Идентификатор, который возвращает create_text(), будет сохранен в поле text_id. Он будет использоваться в методе write_text() для ссылки на элемент. А этот метод будет вызван за счет механизма отслеживания операции записи в экземпляре var.
Для обновления параметра text в обработчике write_text() вызывается метод canvas.itemconfig() с идентификатором элемента в качестве первого аргумента и настройки — как второго.
В этой программе используем поле field_id, сохраненное при создании экземпляра App, а также содержимое StringVar с помощью метода get():
Метод write_text() определен таким образом, что он может получать переменное число аргументов, хотя они не нужны, потому что метод trace() переменных Tkinter передает их в функции обратного вызова.
В методе canvas.create_text() есть много других параметров для изменения внешнего вида элементов полотна.
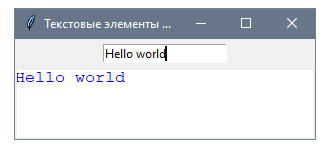
Размещение текста в левом верхнем углу
Параметр anchor позволяет контролировать положение элемента относительно координат, переданных в качестве первого аргумента в canvas.create_text(). По умолчанию это значение равно tk.CENTER, что значит, что текст будет отцентрирован в этих координатах.
Если же его нужно разместить в верхнем левом углу, то достаточно передать (0, 0) и задать значение tk.NW для anchor, что выровняет его в северо-западном положении прямоугольной области, в которой находится текст:
    # ...

    options = { "font": "courier", "fill": "blue",

                     "activefill": "red", "anchor": tk.NW }

    self.text_id = self.canvas.create_text((0, 0), **options)
Этот код обеспечит такой результат:
Перенос строк
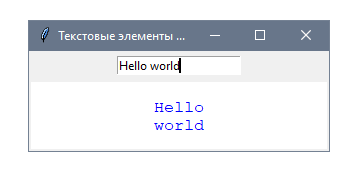
По умолчанию содержимое текстового элемента будет выводиться в одну строку. Параметр width же позволяет задать максимальную ширину строки. В результате если она окажется больше, то содержимое перенесется на новую строку:
    # ...

    options = { "font": "courier", "fill": "blue",

                     "activefill": "red", "width": 70 }

    self.text_id = self.canvas.create_text((w/2, h/2), **options)
Теперь если написать Hello World, часть текста выйдет за пределы заданной ширины и перенесется на новую строку:
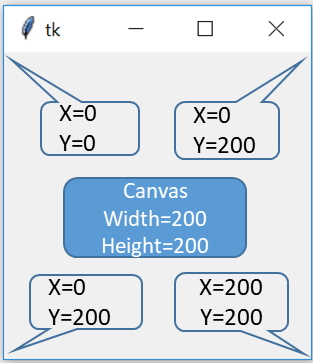
Canvas can be used to create graphics by using Lines, rectangles , Arcs etc. It can be used to hold different types of widgets.
X — Horizontal coordinates
Y — Vertical coordinates
Basics of Python Tkinter
Tkinter canvas to add items like line, text , rectangle , oval, polygon, arc and Images with options
import tkinter as tk
my_w = tk.Tk()
my_c = tk.Canvas(my_w,width=200,height=200)
my_c.pack()
my_w.mainloop()
We can create different type of shapes to place over a canvas.
create_text
import tkinter as tk
my_w = tk.Tk()
my_c = tk.Canvas(my_w,width=350,height=150)
my_c.pack()
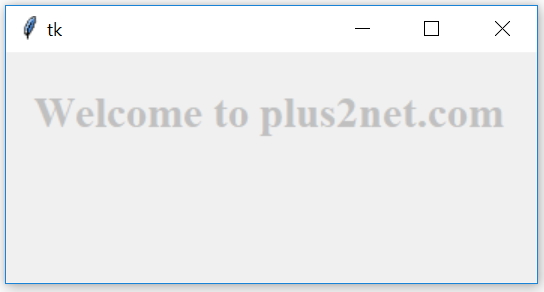
my_c.create_text(175,40,fill='#c0c0c0',font="Times 22  bold",text="Welcome to plus2net.com")my_w.mainloop()
create_line
import tkinter as tk
my_w = tk.Tk()my_c = tk.Canvas(my_w,width=100,height=100)my_c.pack()x1=0y1=50x2=90y2=50my_c.create_line(x1,y1, x2,y2, fill="#ff00ff")my_w.mainloop()
We can add width to our line
my_c.create_line(x1,y1, x2,y2, fill="#ff00ff",width=5)create_rectangle
import tkinter as tk
my_w = tk.Tk()
my_c = tk.Canvas(my_w,width=200,height=200)
my_c.pack()
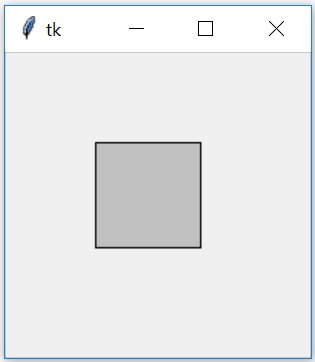
my_c.create_rectangle(80,80,110,110,fill='#c0c0c0')
my_w.mainloop()
create_oval
We will draw one oval using create_oval
import tkinter as tk
my_w = tk.Tk()
my_c = tk.Canvas(my_w,width=150,height=150)
my_c.pack()
my_c.create_oval(25,25,125,125,fill='#c0c0c0')
my_w.mainloop()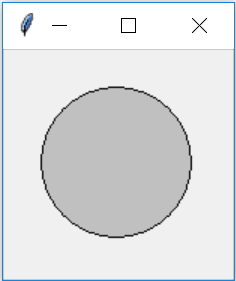
Create one Circle by using create_oval
import tkinter as tkmy_w = tk.Tk()my_c = tk.Canvas(my_w,width=200,height=200)my_c.pack()def my_circle(my_canvas,x,y,r):    my_id=my_canvas.create_oval(x-r,y-r,x+r,y+r,fill='#c0c0c0')    return my_id
my_circle(my_c,60,60,15)#my_c.create_oval(60,60,130,130,fill='#c0c0c0')my_w.mainloop()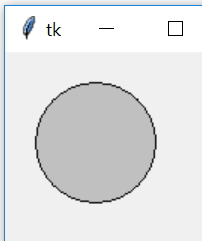
create_image
import tkinter as tkmy_w = tk.Toplevel()from PIL import Image, ImageTkmy_c = tk.Canvas(my_w,width=200,height=200)my_c.pack()
#image = Image.open("icon-dwn.png")f_name = tk.PhotoImage(file='icon-dwn.png')my_img = my_c.create_image(50, 50,  image=f_name)my_w.mainloop()
create_arc
import tkinter as tk
my_w = tk.Tk()my_c = tk.Canvas(my_w,width=150,height=150)my_c.pack()
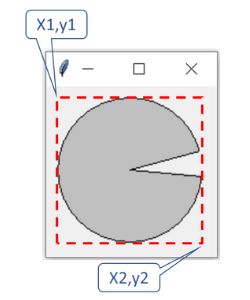
#my_c.create_arc(10,10,130,130,start=15,extent=160,fill='#c0c0c0')my_c.create_arc(10,10,140,140,start=15,extent=340,fill='#c0c0c0')my_w.mainloop()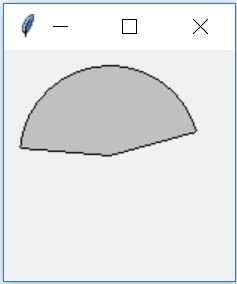
create_polygon
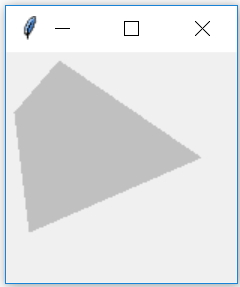
import tkinter as tkmy_w = tk.Tk()my_c = tk.Canvas(my_w,width=150,height=150)my_c.pack()my_c.create_polygon(5,40,15,120,130,70,35,5,fill='#c0c0c0')my_w.mainloop()Options
fill |
Colour used to fill the shape | |
width |
Line width of the item ( or its outline) | |
outline |
Colour of the outline ( rectangle , Oval etc. ) | |
dash |
Draw dashed line instead of solid Line width of the item ( or its outline). alternates short and long pixels. ( 2,5,210) | |
outline |
Colour of the outline ( rectangle , Oval etc. ) | |
stipple |
pattern fill instead of solid fill colour. gray75,gray50 etc.. | |
state |
normal, disabled or hidden . Default value is normal | |
activefill |
Colour when active ( mouse pointer is over the item ) | |
activeoutline |
Colour of the outline when active ( Mouse is over the item ) | |
activedash |
Same as dash ( above ) when active ( Mouse is over it ) | |
activewidth |
Same as width ( above ) when active ( Mouse is over it ) | |
disableddash |
When the item is disabled ( state=disabled) | |
disabledfill |
||
disabledoutline |
||
disabledoutlinestipple |
||
disabledstipple |
||
disabledwidth |
||
relief |
Values are flat, groove, raised, ridge, solid, or sunken Check the example below how canvas is used as a vertical button. |
All options of Canvas can be displayed.
print(canvas.config().keys())Listing all options and values.
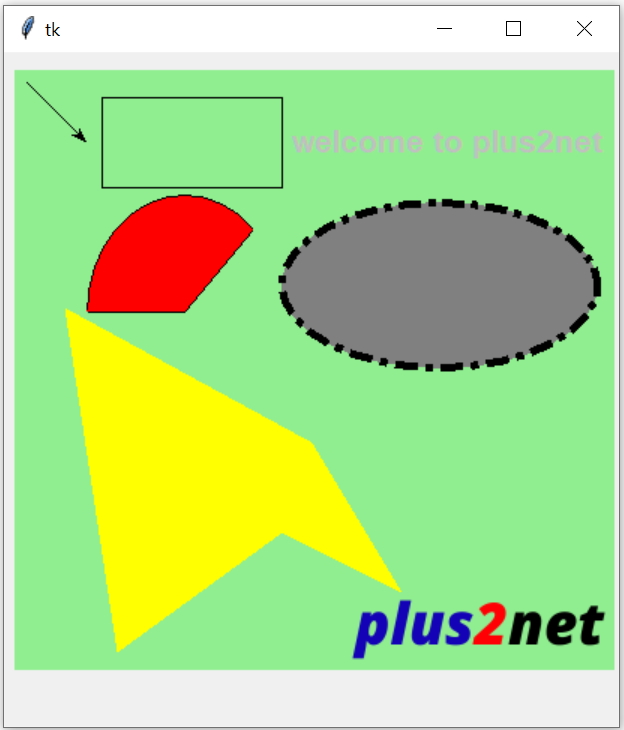
for options in canvas.config(): print(options + ": " + str(canvas[options]))import tkinter as tkmy_w = tk.Tk()width,height=410,410 # set the variables d=str(width)+"x"+str(height+40)my_w.geometry(d) c1 = tk.Canvas(my_w, width=width-10, height=height-10,bg='lightgreen')c1.grid(row=1,column=0,padx=5,pady=10)c1.create_text(290,50,fill='#c0c0c0',font='Time 16 bold',text='welcome to plus2net')my_rect=c1.create_rectangle(60, 20, 180, 80)c1.create_oval(180, 90, 390, 200,fill='gray',dash=(25,5,1,10),activedash=(50,10),stipple='gray75',width=5,activestipple='gray25')c1.create_line(10, 10, 50, 50,width=1,arrow='last')c1.create_arc(50, 85, 180, 240, start=45, extent=135, fill="red")c1.create_polygon(35,160, 70, 390, 180, 310,260, 350, 200, 250, fill='yellow')f_name=tk.PhotoImage(file='D:\top2.png')my_img=c1.create_image(315,375,image=f_name)#c1.delete(my_rect)my_w.mainloop()Using canvas as Background image
Here the variable path_image holds the path of the directory storing the image ( bg2.png )
frame_m_left is the Frame we used. This frame can hold other widgets. Here by using sticky=’nw’ we are keeping the 0,0 position to top left edge of the image.
bg=tk.PhotoImage(file=path_image+'bg2.png')c1 = tk.Canvas(frame_m_left,width=1000,height=500)c1.grid(row=0,column=0,columnspan=4,rowspan=4,sticky='nw',padx=0)c1.create_image(0,0,image=bg,anchor='nw')Vertical text on Canvas to use as Button
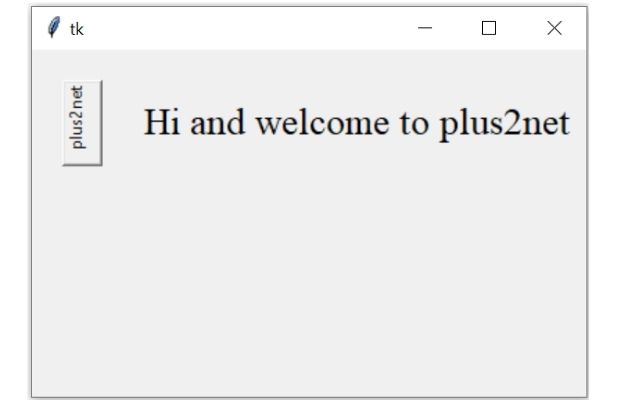
By using Canvas option angle we can rotate text. Here the width and height of the canvas has to match with the length of the text string and line height ( linespace ) of the font used.
Tkinter canvas as button to display vertical or rotated text with mouse events to trigger function
On Mouse click and mouse release events we configure the relief option of the canvas. Here on Mouse click the function my_task() is triggered to perform some additional task along with configuring the relief option to ‘sunken’.
#canvas.bind("<ButtonPress-1>",lambda x:x.widget.configure(relief='sunken'))canvas.bind("<ButtonPress-1>",lambda x:my_task()) # Mouse button pressed canvas.bind("<ButtonRelease-1>",lambda x:x.widget.configure(relief='raised'))The full code is here.
import tkinter as tk
import tkinter.font as tkfont
my_w = tk.Tk()
my_w.geometry("400x250")
font = tkfont.nametofont("TkDefaultFont")
my_str="plus2net " # string over the button to display.
height=font.measure(my_str) + 10 # used as canvas heightwidth=font.metrics()['linespace'] + 10 # as canvas widthcanvas=tk.Canvas(my_w,height=height,width=width,    background="SystemButtonFace",borderwidth=2, relief='raised')
canvas.create_text((4,4),angle='90',anchor='ne',text=my_str,   fill='SystemButtonText',font=font)
canvas.grid(row=0,column=0,padx=20,pady=20)
l1_str=tk.StringVar(value='Welcome') # message on click event of cavasl1=tk.Label(my_w,textvariable=l1_str,font=('Times',20,'normal'))l1.grid(row=0,column=1,padx=5,pady=20)
def my_task(): # to execute when mouse button is released.     canvas.configure(relief='sunken')     l1_str.set('Hi and welcome to plus2net')
#canvas.bind("<ButtonPress-1>",lambda x:x.widget.configure(relief='sunken'))canvas.bind("<ButtonPress-1>",lambda x:my_task()) # Mouse button pressed canvas.bind("<ButtonRelease-1>",lambda x:x.widget.configure(relief='raised'))
my_w.mainloop()
Animation using Rectangles & Circles
Moving element in Canvas Moving widgets or Images on Canvas by using move()
Sin & cos curves in Canvas Scale value in Canvas Arc and pointer
plus2net.com
In this Python tutorial, we will discuss in detail Python Tkinter Canvas. We will cover the below topics also:
- Python Tkinter Canvas Tutorial
- Create Rectangle using Python Tkinter Canvas
- Adding an image using Python Tkinter Canvas
- Adding Text using Python Tkinter Canvas
- Clearing Canvas objects in Python Tkinter Canvas
- Working with Matploitlib in Python Tkinter Canvas
- Change the size of Python Tkinter Canvas
- Like other widgets, the canvas is also a widget that is used for multiple uses.
- Canvas is a drawing widget and it can hold other widgets as well.
- Using canvas 2D objects can be created like text, circle, rectangle, etc.
- In canvas, x & y coordinates have 0 value at the top left corner.
- Moving to the right increases x value and Moving to the left increases y value.
- The layer of python Tkinter canvas is decided on the basis of the sequence of placement, which means the object placed in end stys on the top layer.
If you are new to Python Tkinter or Python GUI programming, check out Python GUI Programming (Python Tkinter) and Python Tkinter drag and drop.
Python Tkinter Canvas Rectangle
- Python Tkinter Canvas has built-in features to create shapes.
- To create a rectangle create_rectangle() method is used.
- This method accepts 4 parameters x1, y1, x2, y2. Here x1 and y1 are the coordinates for the top left corner and x2 and y2 are the coordinates for the bottom right corner.
Code:
Here is the code with explanation to create python tkinter rectangle using canvas.
from tkinter import *


ws = Tk()
ws.title('PythonGuides')
ws.geometry('300x300')
ws.config(bg='#345')

canvas = Canvas(
    ws,
    height=200,
    width=200,
    bg="#fff"
    )

canvas.pack()

canvas.create_rectangle(
    30, 30, 180, 120,
    outline="#fb0",
    fill="#fb0")

ws.mainloop()
Output:
In this output, rectangle is created using python tkinter Canvas.

If you are confused with x1, y1,x2, y2 coordinates then here is the explanation for the same. x1 pushes the object to the right side or in the East., y1 pushes the object towards the South direction. X2 and Y2 expand the rectangle in East & South directions.

Python Tkinter Canvas Image
- In this tutorial, we will learn to implement an image in Python Tkinter Canvas.
- We have created a simple .png image using ms paint for demonstration purposes.
- First, we will create a Canvas widget and provide height and width to it.
PhotoImage()the method is used to read the image and the value is stored in the img variable.canvas.create_image(x, y, image=img_path)- Here, x expands the image towards the right whereas y expands the image downwards.
- image option holds the file name.
Code:
from tkinter import *
from tkinter import *

ws = Tk()
ws.title('PythonGuides')
ws.geometry('750x400')
ws.config(bg='#345')

canvas = Canvas(
    ws,
    height=500,
    width=1000,
    bg="#fff"
    )

canvas.pack()

img = PhotoImage(file="python-tkinter-canvas-image-for-use.png")
canvas.create_image(370, 200, image=img)

ws.mainloop()
Output:
In this output, image is displayed using canvas in Python Tkinter.
Python Tkinter Canvas Text
- The text refers to the arrangement of the alphabet(s).
- We can place text in python Tkinter canvas using
canvas.create_text(x, y). Here x & y is the position of the text.
Code:
In this code, python tkinter canvas text is displayed.
from tkinter import *


ws = Tk()
ws.title('PythonGuides')
ws.geometry('500x300')
ws.config(bg='#345')

canvas = Canvas(
    ws,
    height=200,
    width=400,
    bg="#fff"
    )

canvas.pack()

canvas.create_text(
    200,100,
    fill="darkblue",
    font="Times 20 italic bold",
    text="with great power comes ngreat responsibility")

ws.mainloop()
Output:
In this output, we can see that text is displayed using python tkinter canvas.

Python Tkinter Canvas Clear
- In this section, we will learn to delete or clear the python Tkinter Canvas.
- The delete method is used to clear the canvas or specific object of the canvas.
- To delete the entire canvas, use
canvas.delete("all")- Here canvas is the variable that stores the value of the Canvas widget.
- all is a built-in feature that is used to delete everything inside the canvas.
- To delete a specific object of the canvas, provide the tag name in place of “all”.
- tags can be created by using the keyword tag followed by any name.
- Example: canvas.create_rectangle(100, 30, 400, 200, fill=”red”, tags=”rect”)
canvas.delete("rect")- this code will delete only the rectangle having a tag as rect.
- The same tag name can be provided to multiple objects.
- And these objects will be deleted when the delete method is used for the provided tag.
code:
In this code, we have created multiple objects & we have created buttons to delete these objects. rectangles will be deleted when clicked on del_rect button, squares will be deleted when clicked on del_squ button and all the objects will be deleted when click on the del_all button.
from tkinter import *

ws = Tk()
ws.title('PythonGuides')
ws.geometry('500x400')
ws.config(bg='grey')

canvas = Canvas(
    ws,
    height=300,
    width=400,
    bg="#fff",
    )

canvas.pack()

canvas.create_rectangle(
    30, 20, 200, 100,
    fill="red",
    tags="rect",
    )

canvas.create_oval(
    150, 150, 50, 50,
    fill="blue",
    tag="circ"
    )

canvas.create_rectangle(
    150, 50, 250, 150,
    fill="grey",
    tag="squa"
    )

canvas.create_text(
    180, 250,
    font= "Times 20",
    text="Squre,Circle & Rectangle n inside the canvas",
    tag='txt'
    )

btn1 = Button(
    ws,
    text='del_rect',
    font="Times 12",
    command=lambda:canvas.delete("rect")
    )

btn1.pack(side=LEFT, fill=X, expand=True)

btn2 = Button(
    ws,
    text='del_squ',
    font="Times 12",
    command=lambda:canvas.delete("squa")
    )

btn2.pack(side=LEFT, fill=X, expand=True)

btn3 = Button(
    ws,
    text='del_circ',
    font="Times 12",
    command=lambda:canvas.delete("circ")
    )

btn3.pack(side=LEFT, fill=X, expand=True)

btn4 = Button(
    ws,
    text='del_all',
    font="Times 12",
    command=lambda:canvas.delete("all")
    )

btn4.pack(side=LEFT, fill=X, expand=True)


ws.mainloop()
Output:
In this output, circle, square, rectangle, and text is displayed. There are four buttons at the bottom. Each button will clear one object on the screen. del_all the button will clear everything on the canvas.

Python Tkinter Canvas Matplotlib
- In this section, we will learn to use matplotlib in python Tkinter canvas
- Matplotlib is a python library used for plotting data in a visual form. It is widely used in data analysis. It turns the data into graphs, histograms, etc.
- matplotlib is an external library that needs to be installed before use.
pip install matplotlibthis command will install matplotlib- once matplotlib is installed, we need to import the libraries.
- backend_tkagg module is used to plot on canvas using matplotlib
- This module is inside the matplotlib.backend.
- Also, we need to import Figure from matplotlib. figure
- Figure decides the size of the plotting area also provides an important toolbar.
Code:
In this code, We have plotted data using histogram.
from tkinter import *
from matplotlib.figure import Figure
from matplotlib.backends.backend_tkagg import *

def click_toplot():
    fig = Figure(
        figsize = (5, 3),
        dpi = 100
        )

    #change this data to see difference
    y = [2, 10, 30, 10, 5, 8, 50, 44, 41]

    plot1 = fig.add_subplot(111)

    plot1.hist(y)

    canvas = FigureCanvasTkAgg(
        fig,
        master = ws)
    canvas.draw()
    canvas.get_tk_widget().pack()

    toolbar = NavigationToolbar2Tk(
        canvas,
        ws
        )

    toolbar.update()
    canvas.get_tk_widget().pack()


ws = Tk()
ws.title('PythonGuides')
ws.geometry("650x400")
ws.config(bg='#fb0')

plot_button = Button(master=ws,
					command = click_toplot,
					text = "Click to Plot")

plot_button.pack()

ws.mainloop()
Output:
In this output, data is displayed in a histogram way.

Python Tkinter Canvas Size
- Python Tkinter Canvas size can be decided by providing height and width.
- Height is the vertical position of canvas on the parent window.
- Width is the horizontal position of the canvas on the parent window.
- Change in the height & width will change the size of the canvas.
canvas = Canvas(
    ws,
    height=200,
    width=400,
    bg="#fff"
    )

canvas.pack()- In this code, we are using the Canvas widget.
- ws is the parent layer of Tkinter.
- height provides vertical space to the canvas
- width provides horizontal space to the canvas.
- bg is used to provide background color to the canvas.
You may like the following Python Tkinter Canvas tutorials:
- Python Tkinter Progress bar
- Python Tkinter Stopwatch
- Python Tkinter Listbox
- Python tkinter messagebox
- Python Tkinter Frame
- How to make a calculator in Python
- Python Tkinter ToDo List
In this tutorial we have learned about python tkinter canvas, Also we have covered these topics.
- Python Tkinter Canvas Tutorial
- Create Rectangle using Python Tkinter Canvas
- Adding an image using Python Tkinter Canvas
- Adding Text using Python Tkinter Canvas
- Clearing Canvas objects in Python Tkinter Canvas
- Working with Matploitlib in Python Tkinter Canvas
- Change the size of Python Tkinter Canvas
Python is one of the most popular languages in the United States of America. I have been working with Python for a long time and I have expertise in working with various libraries on Tkinter, Pandas, NumPy, Turtle, Django, Matplotlib, Tensorflow, Scipy, Scikit-Learn, etc… I have experience in working with various clients in countries like United States, Canada, United Kingdom, Australia, New Zealand, etc. Check out my profile.

![Рисуем линии, прямоугольники, круг и текст в Tkinter [Урок №6]](https://python-scripts.com/wp-content/uploads/2016/09/draw-text-tkinter.jpg)

