- 1. Введение
-
2. Настройка
- 2.1. Детализация ошибок
- 2.2. Хранилище журналов
- 2.3. Уровни важности событий
-
3. Обработчик исключений
-
3.1. Метод
PHPreport() -
3.2. Метод
PHPrender()
-
3.1. Метод
-
4. HTTP-исключения
- 4.1. Свои страницы HTTP-ошибок
- 5. Журналы
Введение
Когда вы начинаете новый Laravel проект, обработка ошибок и исключений уже настроена для вас. Все происходящие в вашем приложении исключения записываются в журнал и отображаются пользователю в классе AppExceptionsHandler. В этой статье мы подробно рассмотрим этот класс.
Для журналирования Laravel использует библиотеку Monolog, которая обеспечивает поддержку различных мощных обработчиков журналов. В Laravel настроены несколько из них, благодаря чему вы можете выбрать между единым файлом журнала, ротируемыми файлами журналов и записью информации в системный журнал.
Настройка
Детализация ошибок
Параметр confdebug в файле настроек config/app.php определяет, сколько информации об ошибке показывать пользователю. По умолчанию этот параметр установлен в соответствии со значением переменной среды APP_DEBUG, которая хранится в файле .env.
Для локальной разработки вам следует установить переменную среды APP_DEBUG в значение true. В продакшн-среде эта переменная всегда должна иметь значение false. Если значение равно true на продакшн-сервере, вы рискуете раскрыть важные значения настроек вашим конечным пользователям.
Хранилище журналов
Изначально Laravel поддерживает запись журналов в единый файл (single), в отдельные файлы за каждый день (daily), в syslog и errorlog. Для использования определённого механизма хранения вам надо изменить параметр conflog в файле config/app.php. Например, если вы хотите использовать ежедневные файлы журнала вместо единого файла, вам надо установить значение log равное daily в файле настроек app:
+
5.3 5.2
добавлено в
5.3
(28.01.2017)
5.2
(08.12.2016)
Максимальное число ежедневных файлов журнала
При использовании режима daily Laravel по умолчанию хранит журналы только за последние 5 дней. Если вы хотите изменить число хранимых файлов, добавьте в файл app значение для параметра log_max_files:
+
5.3 5.2
добавлено в
5.3
(28.01.2017)
5.2
(08.12.2016)
Уровни важности событий
При использовании Monolog сообщения в журнале могут иметь разные уровни важности. По умолчанию Laravel сохраняет в журнал события всех уровней. Но на продакшн-сервере вы можете задать минимальный уровень важности, который необходимо заносить в журнал, добавив параметр conflog_level в файл app.php.
После задания этого параметра Laravel будет записывать события всех уровней начиная с указанного и выше. Например, при conflog_level равном error будут записываться события error, critical, alert и emergency:
conf'log_level' => env('APP_LOG_LEVEL', 'error'),
В Monolog используются следующие уровни важности — от меньшего к большему: debug, info, notice, warning, error, critical, alert, emergency.
Изменение настроек Monolog
Если вы хотите иметь полный контроль над конфигурацией Monolog для вашего приложения, вы можете использовать метод приложения PHPconfigureMonologUsing(). Вызов этого метода необходимо поместить в файл bootstrap/app.php прямо перед тем, как в нём возвращается переменная PHP$app:
PHP
$app->configureMonologUsing(function ($monolog) {
  $monolog->pushHandler(...);
});return $app;
Обработчик исключений
Метод PHPreport()
Все исключения обрабатываются классом AppExceptionsHandler. Этот класс содержит два метода: PHPreport() и PHPrender(). Рассмотрим каждый из них подробнее. Метод PHPreport() используется для занесения исключений в журнал или для отправки их во внешний сервис, такой как BugSnag или Sentry. По умолчанию метод PHPreport() просто передаёт исключение в базовую реализацию родительского класса, где это исключение зафиксировано. Но вы можете регистрировать исключения как пожелаете.
Например, если вам необходимо сообщать о различных типах исключений разными способами, вы можете использовать оператор сравнения PHP PHPinstanceof::
PHP
/**
 * Сообщить или зарегистрировать исключение.
 *
 * Это отличное место для отправки исключений в Sentry, Bugsnag, и т.д.
 *
 * @param  Exception  $exception
 * @return void
 */
public function report(Exception $exception)
{
  if ($exception instanceof CustomException) {
    //
  }  return parent::report($exception);
}
Игнорирование исключений заданного типа
Свойство обработчика исключений PHP$dontReport содержит массив с типами исключений, которые не будут заноситься в журнал. Например, исключения, возникающие при ошибке 404, а также при некоторых других типах ошибок, не записываются в журналы. При необходимости вы можете включить другие типы исключений в этот массив:
PHP
/**
 * Список типов исключений, о которых не надо сообщать.
 *
 * @var array
 */
protected $dontReport = [
  IlluminateAuthAuthenticationException::class,
  IlluminateAuthAccessAuthorizationException::class,
  SymfonyComponentHttpKernelExceptionHttpException::class,
  IlluminateDatabaseEloquentModelNotFoundException::class,
  IlluminateValidationValidationException::class,
];
Метод PHPrender()
Метод PHPrender() отвечает за конвертацию исключения в HTTP-отклик, который должен быть возвращён браузеру. По умолчанию исключение передаётся в базовый класс, который генерирует для вас отклик. Но вы можете проверить тип исключения или вернуть ваш собственный отклик:
PHP
/**
 * Отрисовка HTTP-оклика для исключения.
 *
 * @param  IlluminateHttpRequest  $request
 * @param  Exception  $exception
 * @return IlluminateHttpResponse
 */
public function render($request, Exception $exception)
{
  if ($exception instanceof CustomException) {
    return response()->view('errors.custom', [], 500);
  }  return parent::render($request, $exception);
}
HTTP-исключения
Некоторые исключения описывают коды HTTP-ошибок от сервера. Например, это может быть ошибка «страница не найдена» (404), «ошибка авторизации» (401) или даже сгенерированная разработчиком ошибка 500. Для возврата такого отклика из любого места в приложении можете использовать вспомогательный метод PHPabort():
Вспомогательный метод PHPabort() немедленно создаёт исключение, которое будет отрисовано обработчиком исключений. Или вы можете предоставить такой отклик:
PHP
abort(403, 'Unauthorized action.');
Свои страницы HTTP-ошибок
В Laravel можно легко возвращать свои собственные страницы для различных кодов HTTP-ошибок. Например, для выдачи собственной страницы для ошибки 404 создайте файл resources/views/errors/404.blade.php. Этот файл будет использован для всех ошибок 404, генерируемых вашим приложением. Представления в этой папке должны иметь имена, соответствующие кодам ошибок. Экземпляр HttpException, созданный функцией PHPabort(), будет передан в представление как переменная PHP$exception.
Журналы
Laravel обеспечивает простой простой уровень абстракции над мощной библиотекой Monolog. По умолчанию Laravel настроен на создание файла журнала в storage/logs. Вы можете записывать информацию в журнал при помощи фасада Log:
PHP
<?phpnamespace AppHttpControllers;use IlluminateSupportFacadesLog;
//для версии 5.2 и ранее:
//use Log;
use AppUser;
use AppHttpControllersController;class UserController extends Controller
{
  /**
   * Показать профиль данного пользователя.
   *
   * @param  int  $id
   * @return Response
   */
  public function showProfile($id)
  {
    Log::info('Showing user profile for user: '.$id);    return view('user.profile', ['user' => User::findOrFail($id)]);
  }
}
Регистратор событий предоставляет восемь уровней журналирования, описанных в RFC 5424: debug, info, notice, warning, error, critical, alert и emergency.
PHP
Log::emergency($message);
Log::alert($message);
Log::critical($message);
Log::error($message);
Log::warning($message);
Log::notice($message);
Log::info($message);
Log::debug($message);
Контекстная информация
Также в методы журналирования может быть передан массив контекстных данных:
PHP
Log::info('User failed to login.', ['id' => $user->id]);
Обращение к низкоуровневому экземпляру Monolog
В Monolog доступно множество дополнительных обработчиков для журналов. При необходимости вы можете получить доступ к низкоуровневому экземпляру Monolog, используемому в Laravel:
PHP
$monolog = Log::getMonolog();
+
5.0
добавлено в
5.0
(08.02.2016)
Вы также можете зарегистрировать событие для перехвата всех сообщений, передаваемых в журнал.
Регистрация слушателя событий журнала
PHP
Log::listen(function($level, $message, $context)
{
  //
});
In a production environment, it would be great to get an instant alert if any error occurred in your application. If you are part of a big team, then it would be ideal that the alert will be passed on to the right person to resolve the issue.
Imagin if some error occurred in your application on the production environment and then you have to go through the large file of error logs to find what actually happened at a given time for a particular user (happened to me so many times). It would be ideal to browse through the error history of your application right within your browser.
That’s where the Sentry comes into play. Sentry is a cloud-based error tracking tool that comes with free and paid subscriptions. You can browse through the full list of features on their website at Sentry.io. One of the coolest features of Sentry is the fact that it’s super easy to integrate into your application. So let’s get started.
Installation
Firstly, you’ll need to register an account on the Sentry website (the free plan will be enough to get you started) and create a project. The process of creating a project is very easy, even there is an option for Laravel projects which will tailor the documentation according to your project. Once you have done that, come back here!
I will be using the latest release of Laravel which is ^8.0. To create a new Laravel application, I will use the composer create-project command.
composer create-project laravel/laravel laravel-sentry
Sentry can be integrated into Laravel application using the native package sentry-laravel. We will now install this package using the composer.
composer require sentry/sentry-laravel
Once the package is installed, we will need to generate the config file for this package using the below command.
php artisan vendor:publish --provider="SentryLaravelServiceProvider"
When you create a new account on the Sentry website, you will be given a DSN string which is like an API key, if you haven’t copied it yet, you can grab it from the settings area. Next, we will add that key to our .env file.
SENTRY_LARAVEL_DSN=https://[email protected]/0000000
Where xxxxx and 0000000 will be equivlent to your keys from Sentry.
Sentry documentation for Laravel will advise you to hook into Laravel error capturing via an Exception handler.
I always set up the Sentry using the log channel so will recommend you follow this approach as it will be more reliable.
To use the log channel, you will need to add a new channel to your config/logging.php configuration file.
'channels' => [
    // ...
    'sentry' => [
        'driver' => 'sentry',
        'level'  => null,
        'bubble' => true,
    ],
],
You can see two extra configuration values in the above code snippet, level and bubble.
The level, allows you to control the minimum error level that will be sent to the sentry. Laravel uses Monolog for handling errors, so you can take a look at the available levels in their documentation.
The bubble allows/prevents errors from being reported to other channels after the error being handled by Sentry.
Configuring Channel
To configure your application to use the Sentry as a log channel, simply change the LOG_CHANNEL value to below.
LOG_CHANNEL=sentry
From now on all errors will be logged to Sentry.
In my application, I like to use the stack option which will enable our application to log errors to multiple channels. I usually use the daily and sentry as my stack because I firstly like to log errors to a local file and then send it to Sentry. This enables me to keep track of errors in a log file and it will be never missed.
So for my above approach, update the .env file to below.
LOG_CHANNEL=stack
and in the config/logging.php file update the stack channel as below.
    'channels' => [
        'stack' => [
            'driver'   => 'stack',
            'channels' => ['daily', 'sentry']
        ],
        'daily' => [
            'driver' => 'daily',
            'path'   => storage_path('logs/laravel.log'),
            'level'  => 'debug',
            'days'   => 28,
        ],
        'sentry' => [
            'driver' => 'sentry',
            'level'  => 'debug',
            'bubble' => true,
        ],
    ...
],
Testing Error Logging
By now we have integrated the Sentry into our application, now we will test if everything is set up properly. For this, the Sentry package provides a nice command for testing the integration.
In your console run the below command.
php artisan sentry:test
If everything is set up properly, you will see an output like below.
[Sentry] DSN discovered!
[Sentry] Generating test Event
[Sentry] Sending test Event
[Sentry] Event sent with ID: 31e6f44928284d67b891bf4b5415fbbb
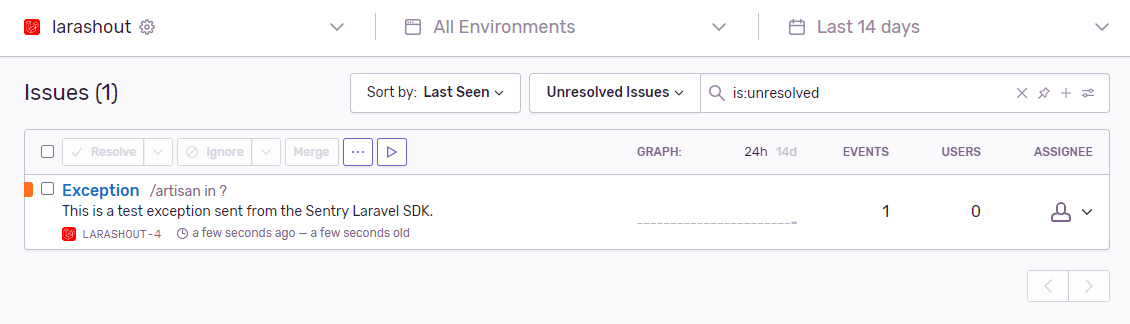
You will also see an issue will be added to your Sentry dashboard on the Sentry website for this test.
We can also test it by throwing an exception, For example, add the below route in your routes/web.php file and visit the route in the browser.
Route::get('/sentry-test', function () {
    throw new Exception("Sentry Test Exception");
});
You will receive an email alert if you have set up that in the Sentry account area and will also see it on the Sentry dashboard like below.

Adding User Context to Error Logs
If you have spent some time on Sentry or are already using it, you will have noticed that Sentry provides a lot of information about your application.
It would be nice to know which error occurred for which user so we can reach the users to inform them that error has been resolved.
To add which user was active at the time of the error, we will need to create a middleware to pass current user information to Sentry.
Run the below command to generate a middleware class.
php artisan make:middleware SentryUser
This will generate a middleware class at app/Http/Middleware.
Open the newly created class and replace it with the below content.
namespace AppHttpMiddleware;

    use Auth;
    use Closure;
    use SentryStateScope;

    class SentryUser
    {
        /**
         * Handle an incoming request.
         *
         * @param IlluminateHttpRequest $request
         * @param Closure                 $next
         *
         * @return mixed
         */
        public function handle($request, Closure $next)
        {
            if(Auth::check() && app()->bound('sentry'))
            {
                SentryconfigureScope(function (Scope $scope): void {
                    $scope->setUser([
                        'id'    => Auth::user()->id,
                        'email' => Auth::user()->email,
                        'name'  => Auth::user()->name,
                    ]);
                });
            }

            return $next($request);
        }
    }
The pretty easy stuff is happening in this middleware class, firstly we check if there is a user authenticated and Sentry is available from the Laravel container. Then, we simply pass the details of the current logged in user to Sentry. The array can be altered according to your need to pass any additional information to Sentry.
Now to use this middleware, we will need to register this middleware in your Laravel application, open the app/Http/Kernel.php file and add it to the $middlewareGroups array like below.
protected $middlewareGroups = [
    'web' => [
        // ...
        AppHttpMiddlewareSentryUser::class
    ]
];
Now when an error is logged with Sentry and a user is authenticated, you should see the user information displayed with the error details in your Sentry dashboard.
Final Words
Hopefully, this post will help you to integrate the Sentry into your application for better error logging and log alerts. Sentry offers so many features such as release tracking, detailed control over notifications, removing sensitive data captured by Sentry (known as data scrubbing), etc. – check out the documentation for more details.
![]()
Admin・ 12 Oktober 2021
6 min read ・ 2332 views
Sentry Laravel 8 — Every time during the development process of a system and until the system is used in public (production), it cannot be separated from the application monitoring process or monitoring the system to avoid unwanted things such as bugs or errors. If our system is made with Laravel, there is software or platform that is very helpful in the monitoring process. The service in question is sentry.
What’s Sentry ?
Sentry is more than software for error monitoring. Sentry is also a software that can be used for performance monitoring. The Sentry platform can assist developers in diagnosing, repairing and optimizing the performance of the code that has been created. With Sentry, developers can save time and energy. Currently, Sentry supports more than 30 programming languages such as PHP, Go, Python, Javascript and many more.
And in this article, I will share how to use Sentry for monitoring and error tracking in Laravel 8. ✍
Sentry Laravel 8
- What’s Sentry ?
- Using Sentry in Laravel 8
- Step 1: Get Started
- Step 2: Install Laravel
- Step 3: Install Sentry-Laravel Package
- Step 4: Add Sentry Reporting
- Step 5: Setup Sentry
- Testing
- Conclusion
Using Sentry in Laravel 8
Alright, after getting a little acquainted with Sentry, now is the time for us to implement or use sentry for application monitoring or error tracking in Laravel 8. For implementation using sentry in Laravel 8, let’s start from the beginning by registering a new account on Sentry.io then installing Latest Laravel.
Step 1: Get Started

Ok, in this first step, we start by creating a Sentry account by visiting the official website or you can click here. To register a new account on sentry, there are several options such as register with email, Google account, Github or with Azure DevOps.

For example, here I register a sentry account using a google account. Later a page will appear or appear as shown above. In this step, we can click the New Account button.

Then, fill in the name, organization, click the checkbox «I agree to the Terms of Service and the Privacy Policy» and click Continue.

Then, select the platform project that you want to integrate with Sentry. Because in this article we will integrate with Laravel, so at this step we can select Laravel and then click the Create Project button.
After clicking Create Project, you will be directed to the onboarding page.
Step 2: Install Laravel
//via Laravel Installer
composer global require laravel/installer
laravel new laravel-sentry

//via Composer
composer create-project laravel/laravel laravel-sentry
Okay, after successfully registering a sentry account, let’s continue by installing laravel which we will integrate with sentry to find out or monitoring or error tracking. For laravel installation, you can use the laravel installer or use composer like the example above.
Please choose one method you want to use for laravel installation. From the two examples of laravel installation commands above, they will both generate or generate a laravel project with the name laravel-sentry.
If you have successfully installed laravel, don’t forget to go to the laravel project directory with the cd laravel-sentry command.
Step 3: Install Sentry-Laravel Package
composer require sentry/sentry-laravelRun the composer command as above to install the setry-laravel package in the laravel project we just installed.
Step 4: Add Sentry Reporting
 public function register()
    {
        $this->reportable(function (Throwable $e) {
            if (app()->bound('sentry') && $this->shouldReport($e)) {
            app('sentry')->captureException($e);
            }

            parent::report($e);
        });
    }
Open the file in App/Exceptions/Handler.php, then in the register function add the sentry reporting code. So the function register in the file will be like the code above.
Step 5: Setup Sentry
php artisan sentry:publish --dsn=https://aa17ad6a62d1409bb41d81a233b65@o1030163.ingest.sentry.io/5997394Then the next step is to setup sentry in laravel by running the command as above. * The command above, obtained when registering and creating project sentry in the first step.
If the above command is executed, it will create a config/sentry.php file and add DNS in the .env file as below.
SENTRY_LARAVEL_DSN=https://aa17ad6a62d1409bb41d81a233b@o1030163.ingest.sentry.io/5997394
SENTRY_TRACES_SAMPLE_RATE=1
Testing
Okay, after going through the processes starting from registering a sentry account, creating a sentry project, installing laravel to integrating sentry in laravel, and now it’s time for a trial.
Route::get('/debug-sentry', function () {
    throw new Exception('My first Sentry error!');
});
Open the routes/web.php file, then add a new route with the code as above. If it has been added, now try to run laravel project with the command php artisan serve.
Then open the laravel project in a browser by accessing the URL laravel-sentry.test/debug-sentry or 127.0.0.1:8000/debug-sentry.

Now try to open the issue page on each sentry account, then there will be a new issue like the picture above. If it appears or appears like the image above, it means that sentry has been successfully integrated in Laravel and we can monitor our system or project to perform performance monitoring or error tracking.
Conclusion
Until the end of this article, we have successfully integrated sentry in Laravel 8 to perform performance monitoring or error tracking. With sentry, we can easily find out the performance of our system or can also find out if there are bugs or errors in the system.
Hopefully this article can be useful, see you in the next article and Happy Coding. 👨💻 🚀
💻 Full Documentation: Sentry for Laravel
Introduction
I’m going to assume you’re already familiar with the Laravel PHP framework and the basics of error logging. Whilst the framework does come with plenty of options out the box for how and where to log errors, if you’re using one of the simple file or system based channels (as defined via your config/logging.php / .env files), you could be doing something better.
Wouldn’t it be great to get an instant alert when there is a problem with your web app? If you work in a team, surely it would be even better for that alert to go straight to the right person to resolve the issue?
Are you fed up reading through long log files to try and trace the cause of an issue? Imagine being able to browse your complete history of errors from a user-friendly web based UI with all the supporting data you need.
This is where Sentry comes in. It’s a cloud based error tracking tool (with free and paid plans) — visit the website to learn more about the full set of features. One of which is the fact it’s super easy to integrate with Laravel, so let’s get started:
Installation
I’m assuming you’re using Laravel 5.6 (which supports various log channels) or above and that you are using package discovery. At the time of writing, everything also works in the current latest version (5.8).
First up, you’ll of course need to register for an account with Sentry (the free plan will be enough to get you started) and create a project. This is an easy process, and there is even an option for a Laravel project (which tailors their documentation to your project). Once you’ve done that, come back here!
You’ll need to install their Laravel package to your project via Composer:
composer require sentry/sentry-laravel
Next up, we’ll need up publish the Sentry Laravel config file by running:
php artisan vendor:publish --provider="SentryLaravelServiceProvider"
When you created your project in Sentry, you will have been given a DSN string (this is like an API key), if you haven’t already copied it, you should be able to find it in the settings area. You’ll need to add that to your .env file e.g:
SENTRY_LARAVEL_DSN=https://xxxxx@sentry.io/0000000
Whilst the current Sentry Laravel documentation recommends starting by hooking into Laravel to capture errors via the Exception handler, there is a better way — using log channels. To start, you’ll need to add a new channel in your config/logging.php file:
'channels' => [
    // ...
    'sentry' => [
        'driver' => 'sentry',
        'level'  => null,
        'bubble' => true,
    ],
],
Aside from «driver», you’ll notice two other options in the channel config.
There first, «level», allows you to control the minimum error level that will be sent to Sentry. Laravel uses Monolog for handling errors, so you can take a look at the available levels in their documentation.
The second, «bubble», is useful when working with the stack driver to allow / prevent errors being reported to other channels after being handled by Sentry.
Configuring channels
You’ll now need to configure your application to use the new «sentry» error logging channel. The first option (called «default») in your config/logging.php file defines which logging channel is used, and is probably pointing to the LOG_CHANNEL option in your .env file. You can easily change this to sentry (LOG_CHANNEL=sentry) and all your errors will now be logged with Sentry.
However, I like to use the «stack» channel, which allows errors to be logged with multiple channels. I usually like to use both the «daily» and «sentry» channels in my stack. This provides some redundancy — by logging to a local file first, errors won’t be totally lost if their is ever an issue reporting to Sentry. To follow my approach, you should update your .env file to contain:
LOG_CHANNEL=stack
And your config/logging.php should contain:
'default' => env('LOG_CHANNEL', 'stack'),

// ...

'channels' => [

    'stack' => [
        'driver'   => 'stack',
        'channels' => ['daily', 'sentry']
    ],
    'daily' => [
        'driver' => 'daily',
        'path'   => storage_path('logs/laravel.log'),
        'level'  => 'debug',
        'days'   => 28,
    ],
    'sentry' => [
        'driver' => 'sentry',
        'level'  => 'debug',
        'bubble' => true,
    ],
],
Don’t forget to take a read over the Laravel logging documentation to fully understand everything that is happening above, and to see the full range of configuration options.
Time for a test
The Sentry Laravel package comes with a handy artisan command for testing your integration:
php artisan sentry:test
After you run this, you should receive an email alert (depending on your settings in Sentry) and be able to see it in your Sentry dashboard.
You can also test it by throwing an exception of your own. For example, you can add a simple route closure to your routes/web.php file, then visit it in your browser:
Route::get('/debug-sentry', function () {
    throw new Exception("My test Exception");
});
Again, you should receive an email alert and see the exception logged in your Sentry dashboard.
Adding user context
As you’ve probably seen, Sentry provides a lot of detailed information for errors including a full stack trace and some environment details. But imagine knowing which errors have occurred for which users. You could reach out to them to let the problem has been fixed, even if they didn’t report the issue.
To tell Sentry which user was active at the time, you’ll need to create some custom middleware:
php artisan make:middleware SentryUserContext
And then add the following to the newly created app/Http/Middleware/SentryUserContext.php file:
namespace AppHttpMiddleware;

use Auth;
use Closure;
use SentryStateScope;

class SentryUserContext
{
    /**
     * Handle an incoming request.
     *
     * @param IlluminateHttpRequest $request
     * @param Closure                 $next
     *
     * @return mixed
     */
    public function handle($request, Closure $next)
    {
        if(Auth::check() && app()->bound('sentry'))
        {
            SentryconfigureScope(function (Scope $scope): void {
                $scope->setUser([
                    'id'    => Auth::user()->id,
                    'email' => Auth::user()->email,
                    'name'  => Auth::user()->name,
                ]);
            });
        }

        return $next($request);
    }
}
You’ll then need to register the middleware against all of your routes. The easiest way to do this is to add it to the relevant sections (e.g. «web» and «api») in the $middlewareGroups property in your app/Http/Kernel.php file. For example:
protected $middlewareGroups = [
    'web' => [
        // ...
        AppHttpMiddlewareSentryUserContext::class
    ]
];
There are several other ways of registering middleware, so check the Laravel documentation for middleware to see if there is a better approach for your particular application.
Let’s look back and explain what’s happening in the middleware — it’s pretty easy. First off we check that there is a user authenticated (in the default guard) and that Sentry is available from the container (this should have been done automatically through package discovery).
Then, we simply pass the details of the current user to Sentry — giving the ID, email and name. This array could be tailored to include other useful info relevant to your app (e.g. subscription package).
Now when an error is logged with Sentry and a user is authenticated with you app, you should see the user details displayed with the error details in your Sentry dashboard. There are more tools available in the dashboard, such us filtering your error list by user to see which errors they’ve experienced, but I’ll leave that for you to discover.
Further reading
Hopefully that’s enough to get you started with a better error logging setup for your Laravel application. There is so much more that Sentry can do for you (release tracking, detailed control over notifications, removing sensitive data captured by Sentry (known as data scrubbing) etc) — check out the documentation for more details.
If you need help with anything I’ve mentioned — feel free to get in contact.
In this article, we will take a look at what error monitoring is and its benefits to both you and your system’s users. We will then take a look at how to use Honeybadger in your Laravel applications for error monitoring, uptime checking, and queue monitoring.
Bugs and Errors in Code
Bugs and errors are an inevitable part of any web application. As web developers, we often make mistakes (big and small) that can go unnoticed during review stages and can often lead to bugs being deployed to live systems. For our users, these bugs can cause confusion and frustration. In the worst-case scenario, if users experience too many errors, they might decide to leave your site/application completely and go elsewhere.
Infrastructure Errors
There can be a lot of moving parts in a web application, depending on the features it provides. For example, your application’s infrastructure might consist of a load balancer, multiple application servers, databases, cache servers, and queue worker servers. With all of this infrastructure, many things can go wrong. For example, here are a few different infrastructure-related errors that I’ve experienced while working with different teams on projects:
- One of your application servers might run out of storage space and stop serving web requests.
- Your hosting provider might experience some downtime, resulting in your databases no longer working.
- Some changes might be made to your network’s firewall that prevent connections to your Redis cache server.
- An error within one of your queue servers might cause the queues to stop processing jobs.
As you can see, there’s a lot that can go wrong in web applications. Sometimes, the issues might be trivial and can be resolved in a couple of minutes. However, there are other times when the issues take a lot of debugging or troubleshooting to figure out. The most important part of fixing any issue, though, is being notified whenever these errors occur and being given as much information as possible to help fix it. This is where error reporting steps in.
Disadvantages of Human Error Reporting
Generally, there are two ways that you can be informed about errors and bugs in your systems: by humans or by an automated system.
When it comes to relying on the humans using your applications to report errors, there are a few key issues:
- It can be frustrating to users because they have to fill out a support ticket to report the bug.
- They might not give a meaningful bug report that can be used to track down the issue. For example, they might not provide information about the steps taken to reproduce the error.
- They might not even report the bug. This can sometimes be caused by a psychological phenomenon known as the “diffusion of responsibility”, where the user might not submit a bug report because they assume that someone else has already sent one.
- The user might not even realize there’s a bug in the system. Therefore, they won’t report it, and you likely won’t find it. Thus, it could stay in your application unnoticed for awhile.
As well as relying on your users, you (as a developer) can perform your own form of human error monitoring. For example, you could periodically check through your server and application logs to see if any errors have occurred. In Laravel, this can be made easier by using packages, such as Laravel Telescope. Nonetheless, it’s still a manual and potentially tedious task that you’ll need to perform routinely. The main issue that comes with this type of process is that errors can go unnoticed until you choose to check the logs.
So, as you can see, human error reporting has some disadvantages that can cause frustration for your users and yourself. However, although it has flaws, it’s important to remember that allowing your users to report errors and submit support tickets is something that your system should always provide. These reports can be useful for picking up ‘logic errors’ rather than ‘runtime errors’. For example, let’s say that your system displays all of your user’s invoices, but this month’s total is wrong. This is a ‘logic error’ and likely caused by a bug in your code that calculated something wrong. But, because the invoice was generated (albeit with an incorrect value), this likely wouldn’t have caused an exception that would have been detected by an automated error reporting system.
Advantages of Automated Error Reporting
As you can see, there are many flaws in relying solely on users to report bugs in your system. So, this is why having an automated error reporting system set up for your application or website is a must-have. It can help you understand any exceptions that your code might be throwing and helps you to check that your infrastructure is working as expected.
When it comes to diagnosing the cause of an error or bug, information is key because the more information you have, the easier it is to resolve the issue. This is true regardless of whether the information is in the form of a stack trace showing the exact lines of code that your application ran before failing or the parameters sent in a web request.
In addition to having extra information, having an automated error reporting system can give you a chance to get ahead of your users. For example, let’s imagine that an exception was thrown while trying to load a page. You could be notified instantly and would be able to start an investigation before the user has a chance to report the bug. If they do choose to report it, this can lead to some reassuring and impressive customer service because you’d be able to tell them that you’re already aware of the problem and putting a fix in place.
Furthermore, let’s imagine that your web application sends a report every morning to your customers via email. To implement a feature like this, you’d likely have some queue workers and scheduled jobs to perform this task. I think you would agree that it would be much better to have an automated system in place to let you know as soon as possible when your scheduler or queue workers stop working. It could give you a chance to rectify the issue so that the reports would continue to be sent out, and the customer would never be aware of the fact that it was ever actually broken.
Error Monitoring Using Honeybadger
One of the error monitoring platforms that we can use is Honeybadger. It’s a system that integrates really well with Laravel projects and provides three useful features, which we will cover:
- Error monitoring — This taps into your Laravel application and reports any errors or exceptions thrown by it. These errors are then recorded so that we can go to the Honeybadger site and find information about the error. In this article, we’ll cover how to set up the error monitoring and then take a look at the information that is available to us for each type of error.
- Uptime monitoring — This part can send requests to your application to make sure it’s still running and reachable by your customers. In this article, we’ll cover how to set up uptime monitoring for single-server Laravel applications and applications that are spread across multiple app servers.
- Check-ins — This part is really useful for monitoring your scheduler and queues to ensure that they’re still running as expected. In this article, we’ll explain how to set up check-ins to make sure that your Laravel queue worker is running.
Installing and Configuring Honeybadger in Laravel
Now that we have explored what error monitoring is and its benefits, we can take a look at how to implement it in our own Laravel application using Honeybadger. To get started, you’ll need to head over to the Honeybadger site and sign up.
Once you’ve signed up, you can run the following command in your Laravel project’s root:
composer require honeybadger-io/honeybadger-laravel
Once the package is installed, you’ll need to add the following method to your app/Exceptions/Handler.php file:
public function report(Throwable $exception)
{
    if (app()->bound('honeybadger') && $this->shouldReport($exception)) {
        app('honeybadger')->notify($exception, app('request'));
    }

    parent::report($exception);
}
After you’ve added this, you’ll then need to run the following installation command:
php artisan honeybadger:install YOUR-API-KEY-HERE
Make sure to include your Honeybadger API key when you run this command. After running this command, you should have the following:
- A
HONEYBADGER_API_KEYfield in your.envand.env.examplefile. - A new
config/honeybadger.phpconfig file. - A test exception that you should be able to see on Honeybadger.
If all of this is completed successfully, it means that you’ve installed Honeybadger, and you’re ready to get started using it.
Error reporting and monitoring bugs
Now that we have Honeybadger set up in your Laravel application, let’s take a look at the error reporting side of things.
To get started, you can trigger a test exception (like the installation command did) using the following command:
php artisan honeybadger:test
After running this command, it will send a test notification to Honeybadger to simulate what would happen if an exception was thrown in a live system. So, if you wanted to SSH into your production server after first adding Honeybadger to your live deployment, you could run this command to make sure it is connected correctly.
However, so that we can dive into the error details a bit more, we’ll create a basic bug and cause an exception. For this example, we’ll make a request as an authenticated user to a controller method and purposely pass incorrect parameters to a method. To do this, let’s take a look at some controller methods that will always cause an error:
namespace AppHttpControllers;

use IlluminateHttpJsonResponse;

class ErrorController extends Controller
{
    public function __invoke()
    {
        $answer = $this->addNumbers(1, 'INVALID');

        return response()->json([
            'answer' => $answer
        ]);
    }

    private function addNumbers(int $numberOne, int $numberTwo): int
    {
        return $numberOne + $numberTwo;
    }
}
As you can see in the basic example above, we have a method that adds two integers together and then returns the answer in a JSON response. However, we are purposely passing a string to the method to cause a failure.
To call this method, I’ve created a new route:
Route::get('error', ErrorController::class);
Now, when we go to the /error route in our browser, the following exception is thrown:
AppHttpControllersErrorController::addNumbers():
Argument #2 ($numberTwo) must be of type int, string given,
called in /var/www/html/app/Http/Controllers/ErrorController.php on line 11
As you would expect, the error is also logged on Honeybadger for us. Let’s take a dive into some information that Honeybadger provides about the exception and how it can be useful for us:
- Backtrace — We can see the backtrace that shows the methods and lines of code that were run before the exception was thrown. This can be particularly useful if you have a method that is called in a lot of different places in your application because you can figure out exactly where it was called from.
- URL — We can see the URL that the request was made to. In our case, the URL was
http://localhost/error. - Browser — We can see the browser and operating system that the request was made using. We can also see whether the user was accessing the site via a desktop or mobile device. This is particularly helpful if you are trying to determine whether a bug only happens in a particular browser.
- Breadcrumbs — We can see the important events that led up to the exception being thrown, such as the request being made and any database queries that were executed. The database queries part is particularly useful if you need to identify any errors that you might have in your queries.
- Session & cookie data — We can see any session data or cookies used in the request. This can be particularly useful if you are trying to pinpoint a bug that might have been caused by a value in a cookie that you have set in a previous request.
In addition to being able to see the errors, Honeybadger also allows us to perform a few actions to manage our reported errors:
- Update status — You can toggle the status of your errors between ‘unresolved’ and ‘resolved’. This can be useful because you can toggle an error report to be ‘resolved’ after you’ve fixed the bug and deployed your fix to your live system.
- Add tags — You can add tags to your bugs so that you can group them together. For example, let’s imagine that you keep getting bugs reported that are related to a particular new feature that you’ve released. You could tag all the errors related to that particular feature so that they’re easy to filter from the rest of your bugs.
- Add comments — You can add comments to your errors. This can be particularly useful if you have a hunch as to what might have caused the issue, so if another team member chooses to fix the bug, they’ll have a bit more information. It can also be useful for review purposes if you review past bugs and want to find out what the issue was and how it was fixed.
- Assign to a team member — If you’re working as part of a team, you can assign bugs to other team members. This can be useful because it can make it obvious who is working on a bug and can prevent multiple developers from trying to fix the same issue.
- Create a public URL — You can create a public URL to share the bug. This can be useful if you want to share your error with someone outside your team that might not have access to Honeybadger. For example, you might want to pass the information on to someone who maintains a third-party API or package and want to give as much data as possible about a bug that their API/package is causing.
- Search Stack Overflow — From the error report, you can open up a new tab that will search Stack Overflow for your exception. This can be particularly useful when trying to see if anyone else has experienced the same error before and has found a solution.
Uptime Monitoring
Another powerful feature of Honeybadger is uptime monitoring. This feature allows you to set up an HTTP request that is sent periodically to ensure that your site or application is still running as expected.
Basic Checks
When we set up our check, we need to provide some information, such as the URL for the request to be made to and how often it should be made. To give an idea of how we could set up a check for our website, let’s take a look at an example.
Let’s imagine that we have a website with the following URL: https://example.com. It’s possible that you might want to make a call to a URL on your website or application and assume that the site is reachable if the page returns a HTTP 200 response. To do this, we could set up a check:
- Name: My homepage check
- URL:
https://example.com - Match type: HTTP Success
- Request method: GET
- Frequency: Every 5 minutes
As you can likely see, this check will run every 5 minutes and will send a GET request to https://example.com. If we get a successful response back, the check will pass. Otherwise, the check will fail, and we’ll be notified so that we are aware that the site is down.
Advanced Checks
There might be times when you want to run a bit more than just a basic GET uptime check. For example, you might want to send a POST request to a route that triggers off some code and only returns a successful response if the code is executed correctly. The code can do anything, such as adding an item to the cache to make sure it’s still reachable or creating a file to make sure your file storage is still writable. So, you could essentially bundle in other system health checks into this check. If this is the case, you’ll likely want to protect the route so that the code can’t be triggered inadvertently. To protect the route, Honeybadger provides a Honeybadger-Token header that is sent in the request. So, you could store the expected token in your .env file, and then, in your Laravel app’s controller, you could assert that the tokens match.
Checks for Applications Running on Multiple Servers
If your Laravel app is running on multiple application servers, and the web traffic is sent through a load balancer, you might want to set up multiple checks. Let’s imagine that we have our application hosted at https://example.com. We’ll assume that the site has two application servers with the following URLs: https://app1.example.com and https://app2.example.com.
If we were to set up a basic GET request to https://example.com, we would be able to visibly confirm whether the site is reachable. However, without adding some extra checks, this wouldn’t necessarily tell us that both of our app servers are running. For example, if our load balancer was configured to route traffic to any server that is running and ignore any servers that weren’t running, how would we know if one of the servers was down?
One way to tackle this issue is to set up three different uptime monitoring checks:
GETtohttps://example.comGETtohttps://app1.example.comGETtohttps://app2.example.com
After running these checks, you’d have more confidence that both of the app servers are running and that the load balancer is routing traffic as expected.
Public Status Page
One of the useful features that Honeybadger provides is public status pages. By enabling public status pages for your projects, you can provide a page that your users can go to and check that your site or application is up and running. If your application is experiencing a bit of downtime, this feature can be a simple way to keep users informed of your site’s health for full transparency.
Check-ins
Another powerful feature that Honeybadger offers is check-ins. This feature is extremely useful for helping to ensure that your scheduled tasks and queue workers are still running. For example, let’s assume that you have an application that generates and emails a report to your users at the end of each day. To implement a feature like this, you’ll likely have a scheduled command that runs at the end of each day and then triggers a queued job that generates and sends the email.
If your queues or scheduler stop running, how would you know? Of course, your users would likely submit a bug report if their emails didn’t arrive when expected. However, as we mentioned earlier, this doesn’t look great for your customer service or provide any confidence that your system is stable. So, this is where check-ins can be useful.
To get started with check-ins, you’ll first need to create one on the Honeybadger website. You can create a check-in and specify how often you expect a check-in. After creating it, you are provided with a small unique code that you can use.
Thanks to the honeybadger-io/honeybadger-laravel package that we installed earlier, we can use the following handy command to make our check-ins much simpler in our Laravel applications:
php artisan honeybadger:checkin YOUR-CHECK-IN-CODE-HERE
Let’s assume that your check-in’s code was ABC123, you could run the following command:
php artisan honeybadger:checkin ABC123
So, based on this, if we wanted to test that our scheduler was working, we could add the following block of code to our app/Console/Kernel.php:
protected function schedule(Schedule $schedule)
{
    $schedule->command('honeybadger:checkin ABC123')->everyFiveMinutes();
}
If the scheduler is working as expected, this would trigger a check-in every five minutes. If the scheduler stopped running for any reason, we would be alerted if the check-in didn’t happen as expected.
You can also create separate check-ins for each of your queue workers. For example, let’s assume that we have three different queues: default, email, and long-running.
If we wanted to ensure that each of the queues are running, we could add the following blocks of code to our app/Console/Kernel.php:
protected function schedule(Schedule $schedule)
    {
        $schedule->call(
            fn() => Artisan::queue('honeybadger:checkin ABC123')->onQueue('default')
        )->everyFiveMinutes();

        $schedule->call(
            fn() => Artisan::queue('honeybadger:checkin DEF456')->onQueue('sms')
        )->everyFiveMinutes();

        $schedule->call(
            fn() => Artisan::queue('honeybadger:checkin GHI789')->onQueue('long-running')
        )->everyFiveMinutes();
}
Let’s take a quick look at the code above so that we can understand what is happening. We are specifying in our scheduler that every five minutes, three different callbacks should be run. Inside each of the callbacks, we queue the honeybadger:checkin Artisan command, with each callback using a different queue. Therefore, if the command runs successfully and checks in, we can be sure that the queue has active workers running on it and processing jobs.
Setting the User URL
In your project’s settings in Honeybadger, you can set a ‘User URL’. To give this a bit of context, let’s say that your Laravel applications has an /admin/users/{user} route that you can go to in your browser and get details about a user. You could set your project’s user URL to https://example.com/admin/users/[user_id]. By doing this, if a user is authenticated when the error is thrown, instead of Honeybadger showing just their ID, you’ll be able to click it and go to their page. For example, if the user’s ID is 3, you could click their ID and be taken to https://example.com/admin/users/3. As you can imagine, this is a handy feature that makes it easier to find information about your users to make the debugging and troubleshooting process quicker.
Opening Your Project Code from Honeybadger
One feature that you can use in Honeybadger is opening your IDE or editor from the backtrace. You can set this up by going to your user settings and adding the local path to your projects. You can then choose which editor to open your project in, such as Atom, Visual Studio Code, or Sublime. Once you’ve done this, whenever a bug is reported, you’ll be able to open the project in your editor on the exact line that the error was caused on.
Filtering Out Sensitive Information
When you’re building an application, you might need to comply with some data protection regulations, such as the General Data Protection Regulation (GDPR). Alternatively, you may have some legal obligations set out in contracts with your clients that specify the types of personal information you are permitted to send to external services, such as Honeybadger. If this is the case, you can make use of request filtering to comply with these different rules and regulations. To do this, you can simply add the names of the fields that you want to ignore to your config/honeybadger.php file.
For example, let’s imagine that we don’t want to send the email address field from a request to Honeybadger if an error occurs; we could update it as follows:
return [

    // ...

        'request' => [
            'filter' => [
                'email',
            ],
        ],

    // ...

]
Now, whenever an exception is thrown that is caused by a web request containing an email field, rather than the field’s value being shown in the error report, you will see [REDACTED] instead.
Conclusion
Hopefully, this article has helped you understand what error reporting is and how you can benefit from using it in your projects. It should have also given you an overview of how to get started with error reporting, uptime monitoring, and queue monitoring using Honeybadger in your Laravel applications. Although this article has covered a lot of the cool features that Honeybadger offers, there’s still a lot more that is definitely worth checking out to help with error monitoring, such as integrations with Slack, GitHub, and Trello, as well as SMS and browser alerts and public error dashboards.
- Введение
- Конфигурирование
-
Обработчик исключений
- Отчет об исключениях
- Игнорирование исключений по типу
- Отображение исключений
- Отчетные и отображаемые исключения
-
HTTP-исключения
- Пользовательские страницы ошибок HTTP
Введение
Когда вы запускаете новый проект Laravel, обработка ошибок и исключений уже настроена для вас. Класс AppExceptionsHandler – это то место, где все исключения, созданные вашим приложением, регистрируются и затем отображаются пользователю. В этой документации мы углубимся в этот класс.
Конфигурирование
Параметр debug в конфигурационном файле config/app.php определяет, сколько информации об ошибке фактически отобразится пользователю. По умолчанию этот параметр установлен, чтобы учесть значение переменной окружения APP_DEBUG, которая содержится в вашем файле .env.
Во время локальной разработки вы должны установить для переменной окружения APP_DEBUG значение true. Во время эксплуатации приложения это значение всегда должно быть false. Если в рабочем окружении будет установлено значение true, вы рискуете раскрыть конфиденциальные значения конфигурации конечным пользователям вашего приложения.
Обработчик исключений
Отчет об исключениях
Все исключения обрабатываются классом AppExceptionsHandler. Этот класс содержит метод register, в котором вы можете зарегистрировать свои отчеты об исключениях и замыкания рендеринга. Мы подробно рассмотрим каждую из этих концепций. Отчеты об исключениях используются для регистрации исключений или отправки их во внешнюю службу, например Flare, Bugsnag или Sentry. По умолчанию исключения будут регистрироваться в соответствии с вашей конфигурацией логирования. Однако вы можете регистрировать исключения как хотите.
Например, если вам нужно сообщать о различных типах исключений по-разному, вы можете использовать метод reportable для регистрации замыкания, которое должно быть выполнено, когда необходимо сообщить об исключении конкретного типа. Laravel определит о каком типе исключения сообщает замыкание с помощью типизации аргументов:
use AppExceptionsInvalidOrderException;

/**
 * Зарегистрировать замыкания, обрабатывающие исключения приложения.
 *
 * @return void
 */
public function register()
{
    $this->reportable(function (InvalidOrderException $e) {
        //
    });
}
Когда вы регистрируете собственные замыкания для создания отчетов об исключениях, используя метод reportable, Laravel по-прежнему регистрирует исключение, используя конфигурацию логирования по умолчанию для приложения. Если вы хотите остановить распространение исключения в стек журналов по умолчанию, вы можете использовать метод stop при определении замыкания отчета или вернуть false из замыкания:
$this->reportable(function (InvalidOrderException $e) {
    //
})->stop();

$this->reportable(function (InvalidOrderException $e) {
    return false;
});
Чтобы настроить отчет об исключениях для переданного исключения, вы можете рассмотреть возможность использования отчетных исключений.
Глобальное содержимое журнала
Если доступно, Laravel автоматически добавляет идентификатор текущего пользователя в каждое сообщение журнала исключения в качестве контекстных данных. Вы можете определить свои собственные глобальные контекстные данные, переопределив метод context класса AppExceptionsHandler вашего приложения. Эта информация будет включена в каждое сообщение журнала исключения, написанное вашим приложением:
/**
 * Получить переменные контекста по умолчанию для ведения журнала.
 *
 * @return array
 */
protected function context()
{
    return array_merge(parent::context(), [
        'foo' => 'bar',
    ]);
}
Контекст журнала исключений
Хотя добавление контекста в каждое сообщение журнала может быть полезно, иногда конкретное исключение может иметь уникальный контекст, который вы хотели бы включить в свои журналы. Определив метод context для конкретного исключения вашего приложения, вы можете указать любые данные, относящиеся к этому исключению, которые должны быть добавлены в запись журнала исключения:
<?php

namespace AppExceptions;

use Exception;

class InvalidOrderException extends Exception
{
    // ...

    /**
     * Получить контекстную информацию исключения.
     *
     * @return array
     */
    public function context()
    {
        return ['order_id' => $this->orderId];
    }
}
Помощник report
По желанию может потребоваться сообщить об исключении, но продолжить обработку текущего запроса. Помощник report позволяет вам быстро сообщить об исключении через обработчик исключений, не отображая страницу с ошибкой для пользователя:
public function isValid($value)
{
    try {
        // Проверка `$value` ...
    } catch (Throwable $e) {
        report($e);

        return false;
    }
}
Игнорирование исключений по типу
При создании приложения будут некоторые типы исключений, которые вы просто хотите игнорировать и никогда не сообщать о них. Обработчик исключений вашего приложения содержит свойство $dontReport, которое инициализируется пустым массивом. Ни о каких классах, добавленных в это свойство, никогда не будет сообщено; однако у них все еще может быть собственная логика отображения:
use AppExceptionsInvalidOrderException;

/**
 * Список типов исключений, о которых не следует сообщать.
 *
 * @var array
 */
protected $dontReport = [
    InvalidOrderException::class,
];
За кулисами Laravel уже игнорирует для вас некоторые типы ошибок, такие как исключения, возникающие из-за ошибок 404 HTTP «не найдено» или 419 HTTP-ответ, сгенерированный при недопустимом CSRF-токене.
Отображение исключений
По умолчанию обработчик исключений Laravel будет преобразовывать исключения в HTTP-ответ за вас. Однако вы можете зарегистрировать свое замыкание для отображения исключений конкретного типа. Вы можете сделать это с помощью метода renderable обработчика исключений.
Замыкание, переданное методу renderable, должно вернуть экземпляр IlluminateHttpResponse, который может быть сгенерирован с помощью функции response. Laravel определит, какой тип исключения отображает замыкание с помощью типизации аргументов:
use AppExceptionsInvalidOrderException;

/**
 * Зарегистрировать замыкания, обрабатывающие исключения приложения.
 *
 * @return void
 */
public function register()
{
    $this->renderable(function (InvalidOrderException $e, $request) {
        return response()->view('errors.invalid-order', [], 500);
    });
}
Вы также можете использовать метод renderable чтобы переопределить отображение для встроенных исключений Laravel или Symfony, таких, как NotFoundHttpException. Если замыкание, переданное методу renderable не возвращает значения, будет использоваться отрисовка исключений Laravel по умолчанию:
use SymfonyComponentHttpKernelExceptionNotFoundHttpException;

/**
 * Зарегистрировать замыкания, обрабатывающие исключения приложения.
 *
 * @return void
 */
public function register()
{
    $this->renderable(function (NotFoundHttpException $e, $request) {
        if ($request->is('api/*')) {
            return response()->json([
                'message' => 'Record not found.'
            ], 404);
        }
    });
}
Отчетные и отображаемые исключения
Вместо проверки типов исключений в методе register обработчика исключений вы можете определить методы report и render непосредственно для ваших исключений. Если эти методы существуют, то они будут автоматически вызываться фреймворком:
<?php

namespace AppExceptions;

use Exception;

class InvalidOrderException extends Exception
{
    /**
     * Отчитаться об исключении.
     *
     * @return bool|null
     */
    public function report()
    {
        //
    }

    /**
     * Преобразовать исключение в HTTP-ответ.
     *
     * @param  IlluminateHttpRequest  $request
     * @return IlluminateHttpResponse
     */
    public function render($request)
    {
        return response(...);
    }
}
Если ваше исключение расширяет исключение, которое уже доступно для визуализации, например встроенное исключение Laravel или Symfony, вы можете вернуть false из метода render исключения, чтобы отобразить HTTP-ответ исключения по умолчанию:
/**
 * Преобразовать исключение в HTTP-ответ.
 *
 * @param  IlluminateHttpRequest  $request
 * @return IlluminateHttpResponse
 */
public function render($request)
{
    // Определить, требуется ли для исключения пользовательское отображение...

    return false;
}
Если ваше исключение содержит пользовательскую логику отчетности, которая необходима только при выполнении определенных условий, то вам может потребоваться указать Laravel когда сообщать об исключении, используя конфигурацию обработки исключений по умолчанию. Для этого вы можете вернуть false из метода report исключения:
/**
 * Сообщить об исключении.
 *
 * @return bool|null
 */
public function report()
{
    // Определить, требуется ли для исключения пользовательская отчетность ...

    return false;
}
Вы можете указать любые требуемые зависимости метода
report, и они будут автоматически внедрены в метод контейнером служб Laravel.
HTTP-исключения
Некоторые исключения описывают коды HTTP-ошибок с сервера. Например, это может быть ошибка «страница не найдена» (404), «неавторизованный доступ» (401) или даже ошибка 500, сгенерированная разработчиком. Чтобы создать такой ответ из любой точки вашего приложения, вы можете использовать глобальный помощник abort:
abort(404);
Пользовательские страницы ошибок HTTP
Laravel позволяет легко отображать пользовательские страницы ошибок для различных кодов состояния HTTP. Например, если вы хотите настроить страницу ошибок для кодов HTTP-состояния 404, создайте файл resources/views/errors/404.blade.php. Это представление будет отображено для всех ошибок 404, сгенерированных вашим приложением. Шаблоны в этом каталоге должны быть названы в соответствии с кодом состояния HTTP, которому они соответствуют. Экземпляр SymfonyComponentHttpKernelExceptionHttpException, вызванный функцией abort, будет передан в шаблон как переменная $exception:
<h2>{{ $exception->getMessage() }}</h2>
Вы можете опубликовать стандартные шаблоны страниц ошибок Laravel с помощью команды vendor:publish Artisan. После публикации шаблонов вы можете настроить их по своему вкусу:
php artisan vendor:publish --tag=laravel-errors