Contents
Introduction
This document describes how to troubleshoot a packet over SONET (POS) router interface that has a line protocol status of «down».
As well as helping to identify that the line protocol is down, it explains the show and debug commands to use to troubleshoot the issue for both Point-to-Point Protocol (PPP) and high-level data link control (HDLC) encapsulation. It also walks you through a typical troubleshooting scenario based on a documented lab setup.
Interpret the show interface pos Command
For the purposes of document, the output of show interface pos is as this output shows. Note the highlighted parts of the display and comments:
RTR12410-2#show interface pos 6/0
   POS6/0 is up, line protocol is down

!--- The line protocol is down
.
     Hardware is Packet over SONET
  MTU 4470 bytes, BW 2488000 Kbit, DLY 100 usec, rely 255/255, load 1/255
     Encapsulation HDLC, crc 32, loopback not set

!--- The loopback has not been set.

     Keepalive set (10 sec)

!--- The keepalive is set as every ten seconds.

     Scramble disabled
  Last input never, output 00:00:05, output hang never
  Last clearing of "show interface" counters never
  Queueing strategy: fifo
  Output queue 0/40, 0 drops; input queue 0/75, 0 drops
  5 minute input rate 0 bits/sec, 0 packets/sec
  5 minute output rate 0 bits/sec, 0 packets/sec
     0 packets input, 0 bytes, 0 no buffer
     Received 0 broadcasts, 0 runts, 0 giants, 0 throttles
              0 parity
     0 input errors, 0 CRC, 0 frame, 0 overrun, 0 ignored, 0 abort
     3 packets output, 1074 bytes, 0 underruns
     0 output errors, 0 applique, 1 interface resets
     0 output buffer failures, 0 output buffers swapped out
     2 carrier transitions
The Cisco IOS® Command Reference states that the line protocol field status «indicates whether the software processes that handle the line protocol consider the line usable (that is, keepalives are successful) or whether it has been taken down by an administrator.»
Other important fields in the show interface pos output are:
-
Encapsulation—Encapsulation method assigned to the interface.
-
loopback—Indicates whether loopback is set.
-
keepalive—Indicates whether keepalives are set.
POS Protocol Stack Overview
This diagram illustrates the protocol stack used on a POS interface.
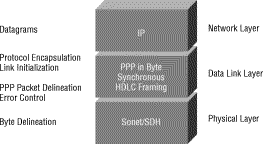
POS interfaces support multiple encapsulations — HDLC, PPP and Frame Relay. Thus, packet over SONET is more accurately PPP over SONET or HDLC over SONET. This document does not cover Frame Relay encapsulation.
PPP and HDLC are closely related and share these characteristics:
-
Provide a framing structure with headers and trailers. The trailer provides error checking.
-
Provide frame delineation, which defines for a receiver exactly where a packet and frame begins and ends. In HDLC and PPP, frame delineation is provided by means of a special interframe fill pattern or idle pattern. The pattern is 0x7E, or 0111 1110.
-
Define a minimum and maximum packet length.
-
Transport IP packets and provide a method for receivers to determine the precise type of packet inside the arriving frame.
However, although closely related, PPP and HDLC are not the same, and different debug commands are used to troubleshoot line protocol problems.
Use debug Commands
The output of various debug privileged EXEC commands provides diagnostic information related to protocol status and network activity for many internetworking events.
 Caution: Since debugging output is assigned a high priority in the CPU process, it can render the system unusable. For this reason, use debug commands only to troubleshoot specific problems or during troubleshooting sessions with Cisco technical support staff. Moreover, it is best to use debug commands during periods of low network traffic and fewer users. Debugging during these periods decreases the likelihood that increased debug command processing overhead affects system use. When you finish using a debug command, remember to disable it with its specific no debug command or with the no debug all command.
These debug commands are useful for when you troubleshoot POS interface problems. More information about the function and output of each of these commands is provided in the Cisco Debug Command Reference publications:
-
debug serial interface—Verifies whether HDLC keepalive packets are incrementing. If they are not, a possible timing problem exists on the interface card or in the network.
-
debug ppp negotiation—Shows PPP packets transmitted during PPP startup, where PPP options are negotiated.
-
debug ppp packet—Shows PPP packets being sent and received. This command displays low-level packet dumps.
-
debug ppp errors—Shows PPP errors (such as illegal or malformed frames) associated with PPP connection negotiation and operation.
Refer to Troubleshooting Serial Line Problems for more information.
Line Protocol Is Down With HDLC
HDLC is the default encapsulation type on a POS router interface. HDLC is an international standard, but vendor implementations vary one or more fields or the header or trailer in size and format. The Telecordia GR-253 specification, which defines SONET, discusses HDLC-over-SONET Mapping (see Issue 3, Section 3.4.2.3, pp.3-59.) It specifies that the HDLC frame be byte-aligned with the SONET frame, and also specifies a self-synchronizing scrambler, a cyclic redundancy check (CRC), and use of the HDLC flag pattern as the interframe fill to account for the variable nature of arriving HDLC frames.
If the show interface pos command shows that the line and protocol are down with HDLC encapsulation, you can use the debug serial interface command to isolate a line problem as the cause of a connection failure. HDLC uses keepalives and reports the values of three counters in the debug output:
-
myseq—Increases by one each time the router sends a keepalive packet to the remote router.
-
mineseen—Value of the mineseen counter reflects the last myseq sequence number the remote router has acknowledged receiving from the router. The remote router stores this value in its yourseen counter and sends that value in a keepalive packet to the router.
-
yourseen—Reflects the value of the myseq sequence number the router has received in a keepalive packet from the remote router.
If the keepalive values in the mineseq, yourseen, and myseen fields are not incrementing in each subsequent line of output, there is a problem at one end of the connection. When the difference in the values in the myseq and mineseen fields exceeds three, the line goes down and the interface is reset.
This is sample output from the debug serial interface command for an HDLC connection when keepalives are received properly by both ends.
hswan-12008-2a#debug serial interface
Serial network interface debugging is on
hswan-12008-2a#
Oct 31 11:47:16: POS4/0: HDLC myseq 180, mineseen 0*, yourseen 1, line up
Oct 31 11:47:17: %LINEPROTO-5-UPDOWN: Line protocol on Interface POS4/0,
changed state to up

!--- Local router sees a remote keepalive with a sequence number of 1.

Oct 31 11:47:26: POS4/0: HDLC myseq 181, mineseen 181*, yourseen 2, line up
Oct 31 11:47:36: POS4/0: HDLC myseq 182, mineseen 182*, yourseen 3, line up
Oct 31 11:47:46: POS4/0: HDLC myseq 183, mineseen 183*, yourseen 4, line up
Oct 31 11:47:56: POS4/0: HDLC myseq 184, mineseen 184*, yourseen 5, line up
Oct 31 11:48:06: POS4/0: HDLC myseq 185, mineseen 185*, yourseen 6, line up

!--- Keepalives are sent every 10 seconds by default. !--- Both sides report incrementing sequence numbers.
This is sample output from the debug serial interface command for an HDLC connection when the remote interface is shut and the local interface misses more than three keepalives.
hswan-12008-2a#
Oct 31 11:49:46: POS4/0: HDLC myseq 195, mineseen 192, yourseen 13, line down
Oct 31 11:49:47: %LINEPROTO-5-UPDOWN: Line protocol on Interface POS4/0,
changed state to down

!--- The local router has failed to receive three keepalives and !--- brings down the line protocol. Note the difference between !--- "myseq 195" and "mineseen 192".

Oct 31 11:49:56: POS4/0: HDLC myseq 196, mineseen 192, yourseen 13, line down
Oct 31 11:50:06: POS4/0: HDLC myseq 197, mineseen 192, yourseen 13, line down
Oct 31 11:50:16: POS4/0: HDLC myseq 198, mineseen 192, yourseen 13, line down
Oct 31 11:50:26: POS4/0: HDLC myseq 199, mineseen 192, yourseen 13, line down
Oct 31 11:50:36: POS4/0: HDLC myseq 200, mineseen 0*, yourseen 1, line up
Oct 31 11:50:37: %LINEPROTO-5-UPDOWN: Line protocol on Interface POS4/0,
changed state to up

!--- After you execute the no shut command on the remote router, !--- the local router receives a keepalive again and brings up !--- the line protocol.

Oct 31 11:50:46: POS4/0: HDLC myseq 201, mineseen 201*, yourseen 2, line up
Oct 31 11:50:56: POS4/0: HDLC myseq 202, mineseen 202*, yourseen 3, line up
Oct 31 11:51:06: POS4/0: HDLC myseq 203, mineseen 203*, yourseen 4, line up
Oct 31 11:51:16: POS4/0: HDLC myseq 204, mineseen 204*, yourseen 5, line up
Oct 31 11:51:26: POS4/0: HDLC myseq 205, mineseen 205*, yourseen 6, line up
Oct 31 11:51:36: POS4/0: HDLC myseq 206, mineseen 206*, yourseen 7, line up

!--- After the shut/no shut, the remote router re-initialized its !--- sequence number.
Line Protocol Is Down With PPP
RFC 1661 ![]() defines PPP as a protocol. POS interfaces support PPP in High-Level Data Link Control (HDLC)-like framing, as specified in RFC 1662
defines PPP as a protocol. POS interfaces support PPP in High-Level Data Link Control (HDLC)-like framing, as specified in RFC 1662 ![]() , for data encapsulation at Layer 2. The frame format for PPP in HDLC-like framing is shown in this figure.
, for data encapsulation at Layer 2. The frame format for PPP in HDLC-like framing is shown in this figure.

RFC 2615 specifies the use of PPP encapsulation over SONET or SDH links. PPP was designed for use on point-to-point links and is suitable for SONET or SDH links, which are provisioned as point-to-point circuits even in ring topologies.
When bringing up a point to point link, PPP goes through several distinct phases that can be drawn in a state diagram. When an external event, such as carrier detection or network administrator configuration, indicates that the physical layer is ready to be used, PPP proceeds to the link establishment phase. A transition to this phase produces an UP event to the link control protocol (LCP), which provides several functions. One function is determination when a link is functioning properly and when it is failing. In order to establish communication over a point-to-point link, each end of the PPP link must first send LCP packets to configure and test the data link.
Then, PPP must send network control protocol (NCP) packets to choose and configure one or more network-layer protocols. Once each of the chosen network-layer protocols has been configured, datagrams from each network-layer protocol can be sent over the link.
This table lists the three classes of LCP packets:
| LCP Packet Class | LCP Packet Types | Purpose |
|---|---|---|
| Link Configuration | Configure-Request, Configure-Ack, Configure-Nak and Configure-Reject | Used to establish and configure a link. |
| Link Termination | Terminate-Request and Terminate-Ack | Used to terminate a link. |
| Link Maintenance | Code-Reject, Protocol-Reject, Echo-Request, Echo-Reply, and Discard-Request | Used to manage and debug a link. |
Link Configuration
LCP is used to establish the connection through an exchange of Configure packets. This exchange is complete, and the LCP Opened state entered, once a Configure-Ack packet has been both sent and received.
This sample output captures the LCP link configuration stage on a POS interface:
4d01h: PO3/1 LCP: State is Open
4d01h: PO3/1 PPP: I pkt type 0x8021, datagramsize 14 LCP_UP
(0x639FCAD8) id 0 (0s.) queued 1/1/2
4d01h: PO3/1 PPP: Phase is UP
4d01h: PO3/1 IPCP: O CONFREQ [Closed] id 152 len 10
4d01h: PO3/1 IPCP:    Address 172.16.1.1 (0x0306AC100101)
4d01h: PO3/1 PPP: I pkt type 0x8021, datagramsize 14
4d01h: PO3/1 IPCP: I CONFREQ [REQsent] id 1 len 10
4d01h: PO3/1 IPCP:    Address 172.16.1.2 (0x0306AC100102)
4d01h: PO3/1 IPCP: O CONFACK [REQsent] id 1 len 10
4d01h: PO3/1 IPCP:    Address 172.16.1.2 (0x0306AC100102)
4d01h: PO3/1 IPCP: I CONFACK [ACKsent] id 152 len 10
4d01h: PO3/1 IPCP:    Address 172.16.1.1 (0x0306AC100101)
4d01h: PO3/1 IPCP: State is Open
4d01h: PO3/1 IPCP: Install route to 172.16.1.2
4d01h: %LINEPROTO-5-UPDOWN: Line protocol on Interface POS3/1,
changed state to up
Note: A POS interface configured with PPP encapsulation continually tries to establish a PPP session. Thus, you see the line protocol come up briefly on a periodic basis when there is a sustained problem, even when the fiber is removed.
Link Maintenance (With Keepalives)
LCP Echo-Request and Echo-Reply packets provide a Layer 2 loopback mechanism for both directions of the link. On reception of an Echo-Request in the LCP Opened state, an Echo-Reply must be transmitted.
This diagram from RFC 1661 illustrates the format of a PPP keepalive packet.
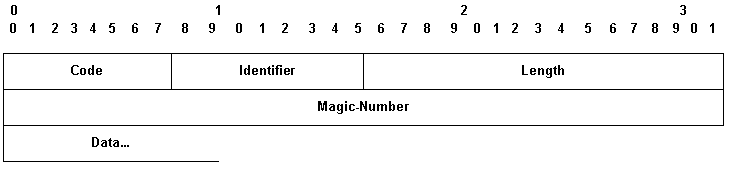
These LCP packets include these key fields:
-
Code—9 for Echo-Request and 10 for Echo-Reply.
-
Identifier—On transmission, the Identifier field must be changed whenever the content of the Data field changes and whenever a valid reply has been received for a previous request. For retransmissions, the Identifier may remain unchanged. On reception, the Identifier field of the Echo-Request is copied into the Identifier field of the Echo-Reply packet.
-
Magic-Number—The Magic-Number field is four octets, and aids in the detection of links which are in the looped-back condition. Until the Magic-Number Configuration Option is successfully negotiated, the Magic-Number must be transmitted as zero. See the Magic-Number Configuration Option in RFC 1661 for further explanation.
-
Data—The Data field is zero or more octets, and contains uninterpreted data for use by the sender. The data may consist of any binary value. The end of the field is indicated by the Length.
Here is an example of debug ppp negotiation when keepalives are enabled:
4d01h: PO3/1 LCP: O ECHOREQ [Open] id 1 len 12 magic 0x1A45933B
4d01h: PO3/1 PPP: I pkt type 0xC021, datagramsize 16
4d01h: PO3/1 LCP: I ECHOREP [Open] id 1 len 12 magic 0x00000002
4d01h: PO3/1 LCP: Received id 1, sent id 1, line up
Link Termination
PPP can terminate the link at any time. Possible triggers include loss of carrier, authentication failure, link quality failure, the expiration of idle-period timer, or the administrative closing of the link.
LCP uses Terminate packets to close the link. The sender of the Terminate-Request should disconnect after receiving a Terminate-Ack, or after the Restart counter expires. The receiver of a Terminate-Request should wait for the peer to disconnect, and must not disconnect until at least one Restart time has passed after sending a Terminate-Ack.
Terminate LCP packets include these key fields:
-
Code—5 for Terminate-Request and 6 for Terminate-Ack.
-
Identifier—On transmission, the Identifier field must be changed whenever the content of the Data field changes, and whenever a valid reply has been received for a previous request. For retransmissions, the Identifier can remain unchanged. On reception, the Identifier field of the Terminate-Request is copied into the Identifier field of the Terminate-Ack packet.
The Data field is zero or more octets, and contains uninterpreted data for use by the sender. The data can consist of any binary value. The end of the field is indicated by the Length.
Here is an example of debug ppp negotiation output when you receive a TERMREQ packet:
4d01h: PO3/1 PPP: I pkt type 0xC021, datagramsize 8
4d01h: PO3/1 LCP: I TERMREQ [Open] id 4 len 4
4d01h: PO3/1 LCP: O TERMACK [Open] id 4 len 4
4d01h: PO3/1 PPP: I pkt type 0xC021, datagramsize 18
4d01h: PO3/1 IPCP: State is Closed
4d01h: PO3/1 PPP: Phase is TERMINATING
4d01h: PO3/1 LCP: I CONFREQ [TERMsent] id 1 len 14
4d01h: PO3/1 LCP:    MRU 1500 (0x010405DC)
4d01h: PO3/1 LCP:    MagicNumber 0x00000002 (0x050600000002)
4d01h: PO3/1 LCP: Dropping packet, state is TERMsent

!--- While in the TERMsent state, PPP should drop all other packets.

4d01h: PO3/1 IPCP: Remove route to 172.16.1.2
4d01h: %LINEPROTO-5-UPDOWN: Line protocol on Interface POS3/1,
changed state to down
Sample Troubleshooting Sequence
This section describes a sample troubleshooting scenario for a POS link using PPP encapsulation. It uses these configurations:
| Router A Configuration |
|---|
interface POS1/0 ip address 1.1.1.6 255.255.255.0 no ip directed-broadcast encapsulation ppp crc 16 clock source internal |
| Router B Configuration |
|---|
interface POS2/0 ip address 1.1.1.5 255.255.255.0 no ip directed-broadcast encapsulation ppp crc 16 |
Note: These debugs were captured on two routers in a back-to-back lab setup. Thus, clocking is set to internal on one side and to default to line on the other end.
debug ppp negotiation
This output illustrates the packet exchange captured with debug ppp negotiation during LCP’s link establishment phase.
| Router A Debug Output |
|---|
Router A Debug Output
(1)

!--- The router sends an outgoing confreq.

hswan-12008-2a#
*Nov  7 08:27:00: %LINK-3-UPDOWN: Interface POS1/0, changed state to up
*Nov  7 08:27:00: PO1/0 PPP: Treating connection as a dedicated line
*Nov  7 08:27:00: PO1/0 PPP: Phase is ESTABLISHING, Active Open
*Nov  7 08:27:00: PO1/0 LCP: O CONFREQ [Closed] id 7 len 14
*Nov  7 08:27:00: PO1/0 LCP:    MRU 4470 (0x01041176)
*Nov  7 08:27:00: PO1/0 LCP:    MagicNumber 0x4F46AF4D (0x05064F46AF4D)
|
(4)

!--- Router A receives an incoming confreq from router B.

*Nov  7 08:27:00: PO1/0 LCP: I CONFREQ [REQsent] id 45 len 14
*Nov  7 08:27:00: PO1/0 LCP: MRU 4470 (0x01041176)
*Nov  7 08:27:00: PO1/0 LCP: MagicNumber 0x2631E6D2 (0x05062631E6D2)
|
(5)

!--- Router A responds with a confack and receives a !--- confack from Router B. The LCP state is open.

*Nov  7 08:27:00: PO1/0 LCP: O CONFACK [REQsent] id 45 len 14
*Nov  7 08:27:00: PO1/0 LCP:    MRU 4470 (0x01041176)
*Nov  7 08:27:00: PO1/0 LCP:    MagicNumber 0x2631E6D2 (0x05062631E6D2)
*Nov  7 08:27:00: PO1/0 LCP: I CONFACK [ACKsent] id 7 len 14
Nov  7 08:27:00: PO1/0 LCP:    MRU 4470 (0x01041176)
*Nov  7 08:27:00: PO1/0 LCP: MagicNumber 0x4F46AF4D (0x05064F46AF4D)
*Nov  7 08:27:00: PO1/0 LCP: State is Open
*Nov  7 08:27:00: PO1/0 PPP: Phase is UP
|
(7)

!--- Router A begins the IPCP stage and negotiates an IP address. !--- In this setup, the peer router already has an address and !--- sends it in a confreq. If the peer router accepts the address, !--- it responds with a confack.

*Nov  7 08:27:00: PO1/0 IPCP: O CONFREQ [Closed] id 7 len 10
*Nov  7 08:27:00: PO1/0 IPCP: Address 1.1.1.6 (0x030601010106)
*Nov  7 08:27:00: PO1/0 CDPCP: O CONFREQ [Closed] id 7 len 4
*Nov  7 08:27:00: PO1/0 IPCP: I CONFREQ [REQsent] id 9 len 10
*Nov  7 08:27:00: PO1/0 IPCP: Address 1.1.1.5 (0x030601010105)
*Nov  7 08:27:00: PO1/0 IPCP: O CONFACK [REQsent] id 9 len 10
*Nov  7 08:27:00: PO1/0 IPCP: Address 1.1.1.5 (0x030601010105)
*Nov  7 08:27:00: PO1/0 CDPCP: I CONFREQ [REQsent] id 9 len 4
*Nov  7 08:27:00: PO1/0 CDPCP: O CONFACK [REQsent] id 9 len 4
*Nov  7 08:27:00: PO1/0 IPCP: I CONFACK [ACKsent] id 7 len 10
*Nov  7 08:27:00: PO1/0 IPCP: Address 1.1.1.6 (0x030601010106)
*Nov  7 08:27:00: PO1/0 IPCP: State is Open
*Nov  7 08:27:00: PO1/0 CDPCP: I CONFACK [ACKsent] id 7 len 4
*Nov  7 08:27:00: PO1/0 CDPCP: State is Open
*Nov  7 08:27:00: PO1/0 IPCP: Install route to 1.1.1.5
*Nov  7 08:27:01: %LINEPROTO-5-UPDOWN: Line protocol on
Interface POS1/0, changed state to up
|
| Router B Debug Output |
|---|
(2)

!--- Router B receives an incoming confrq from Router A.

hswan-12008-2b#
Nov  7 10:29:19.043: PO2/0 LCP: I CONFREQ [Open] id 7 len 14
Nov  7 10:29:19.043: PO2/0 LCP:    MRU 4470 (0x01041176)
Nov  7 10:29:19.043: PO2/0 LCP:    MagicNumber 0x4F46AF4D (0x05064F46AF4D)
Nov  7 10:29:19.043: PO2/0 IPCP: State is Closed
Nov  7 10:29:19.043: PO2/0 CDPCP: State is Closed
Nov  7 10:29:19.043: PO2/0 PPP: Phase is TERMINATING
Nov  7 10:29:19.043: PO2/0 PPP: Phase is ESTABLISHING
|
(3)

!--- Router B sends its own LCP confreq.

Nov  7 10:29:19.043: PO2/0 LCP: O CONFREQ [Open] id 45 len 14
Nov  7 10:29:19.043: PO2/0 LCP:    MRU 4470 (0x01041176)
Nov  7 10:29:19.043: PO2/0 LCP:    MagicNumber 0x2631E6D2 (0x05062631E6D2)
|
(6)

!--- Router B responds with a confack and receives a confack from Router A.

The LCP state is open.
Nov  7 10:29:19.043: PO2/0 LCP: O CONFACK [Open] id 7 len 14
Nov  7 10:29:19.043: PO2/0 LCP:    MRU 4470 (0x01041176)
Nov  7 10:29:19.043: PO2/0 LCP:    MagicNumber 0x4F46AF4D (0x05064F46AF4D)
Nov  7 10:29:19.043: PO2/0 IPCP: Remove route to 1.1.1.6
Nov  7 10:29:19.047: PO2/0 LCP: I CONFACK [ACKsent] id 45 len 14
Nov  7 10:29:19.047: PO2/0 LCP:    MRU 4470 (0x01041176)
Nov  7 10:29:19.047: PO2/0 LCP:    MagicNumber 0x2631E6D2 (0x05062631E6D2)
Nov  7 10:29:19.047: PO2/0 LCP: State is Open
Nov  7 10:29:19.047: PO2/0 PPP: Phase is UP
|
(8)

!--- Router B also begins the IPCP stage and negotiates an IP address.

Nov  7 10:29:19.047: PO2/0 IPCP: O CONFREQ [Closed] id 9 len 10
Nov  7 10:29:19.047: PO2/0 IPCP:    Address 1.1.1.5 (0x030601010105)
Nov  7 10:29:19.047: PO2/0 CDPCP: O CONFREQ [Closed] id 9 len 4
Nov  7 10:29:19.047: PO2/0 IPCP: I CONFREQ [REQsent] id 7 len 10
Nov  7 10:29:19.047: PO2/0 IPCP:    Address 1.1.1.6 (0x030601010106)
Nov  7 10:29:19.047: PO2/0 IPCP: O CONFACK [REQsent] id 7 len 10
Nov  7 10:29:19.047: PO2/0 IPCP:    Address 1.1.1.6 (0x030601010106)
Nov  7 10:29:19.047: PO2/0 CDPCP: I CONFREQ [REQsent] id 7 len 4
Nov  7 10:29:19.047: PO2/0 CDPCP: O CONFACK [REQsent] id 7 len 4
Nov  7 10:29:19.047: PO2/0 IPCP: I CONFACK [ACKsent] id 9 len 10
Nov  7 10:29:19.047: PO2/0 IPCP:    Address 1.1.1.5 (0x030601010105)
Nov  7 10:29:19.047: PO2/0 IPCP: State is Open
Nov  7 10:29:19.047: PO2/0 CDPCP: I CONFACK [ACKsent] id 9 len 4
Nov  7 10:29:19.047: PO2/0 CDPCP: State is Open
Nov  7 10:29:19.047: PO2/0 IPCP: Install route to 1.1.1.6
*Nov  7 10:29:19.048: %LINEPROTO-5-UPDOWN: Line protocol on
Interface POS2/0, changed state to up
|
debug ppp packet
This output illustrates the packet exchange captured with debug ppp packet while a link is being established. This debug captures the value of the protocol field in the PPP packet. RFC 1661 defines the Protocol field as one or two octets. The value in this field identifies the datagram encapsulated in the Information field of the packet.
Protocol field values in the «0***» to «3***» range identify the network-layer protocol of specific packets, and values in the «8***» to «b***» range identify packets belonging to the associated Network Control Protocols (NCPs), if any. Protocol field values in the «c***» to «f***» range identify packets as link-layer Control Protocols (such as LCP). There also are various vendor-specific values. Click here for a complete list of PPP protocol field values ![]() .
.
| Router A Debug Output |
|---|
(1) *Nov 7 10:19:58: PO1/0 PPP: I pkt type 0xC021, datagramsize 18 !--- 0xC021 identifies LCP. *Nov 7 10:19:58: PO1/0 LCP: I CONFREQ [Closed] id 7 len 14 *Nov 7 10:19:58: PO1/0 LCP: MRU 4470 (0x01041176) *Nov 7 10:19:58: PO1/0 LCP: MagicNumber 0x269933F4 (0x0506269933F4) *Nov 7 10:19:58: PO1/0 LCP: O CONFREQ [Closed] id 57 len 14^Z *Nov 7 10:19:58: PO1/0 LCP: MRU 4470 (0x01041176) *Nov 7 10:19:58: PO1/0 LCP: MagicNumber 0x4FAE1B0C (0x05064FAE1B0C) *Nov 7 10:19:58: PO1/0 LCP: O CONFACK [REQsent] id 7 len 14 *Nov 7 10:19:58: PO1/0 LCP: MRU 4470 (0x01041176) *Nov 7 10:19:58: PO1/0 LCP: MagicNumber 0x269933F4 (0x0506269933F4) *Nov 7 10:19:58: %LINK-3-UPDOWN: Interface POS1/0, changed state to up *Nov 7 10:19:58: PO1/0 PPP: I pkt type 0xC021, datagramsize 18 *Nov 7 10:19:58: PO1/0 LCP: I CONFACK [ACKsent] id 57 len 14ppp *Nov 7 10:19:58: PO1/0 PPP: I pkt type 0x8021, datagramsize 14 !--- 0x8021 identifies IPCP, PPP internet protcol control protocol. *Nov 7 10:19:58: PO1/0 LCP: MRU 4470 (0x01041176) *Nov 7 10:19:58: PO1/0 PPP: I pkt type 0x8207, datagramsize 8 !--- 0x8207 identifies Cisco discovery protocol control. *Nov 7 10:19:58: PO1/0 LCP: MagicNumber 0x4FAE1B0C (0x05064FAE1B0C) *Nov 7 10:19:58: PO1/0 IPCP: O CONFREQ [Closed] id 15 len 10 *Nov 7 10:19:58: PO1/0 IPCP: Address 1.1.1.6 (0x030601010106) *Nov 7 10:19:58: PO1/0 CDPCP: O CONFREQ [Closed] id 13 len 4 *Nov 7 10:19:58: PO1/0 IPCP: I CONFREQ [REQsent] id 14 len 10packet *Nov 7 10:19:58: PO1/0 IPCP: Address 1.1.1.5 (0x030601010105) *Nov 7 10:19:58: PO1/0 IPCP: O CONFACK [REQsent] id 14 len 10 *Nov 7 10:19:58: PO1/0 IPCP: Address 1.1.1.5 (0x030601010105) *Nov 7 10:19:58: PO1/0 PPP: I pkt type 0x8021, datagramsize 14 *Nov 7 10:19:58: PO1/0 CDPCP: I CONFREQ [REQsent] id 15 len 4 *Nov 7 10:19:58: PO1/0 CDPCP: O CONFACK [REQsent] id 15 len 4 *Nov 7 10:19:58: PO1/0 IPCP: I CONFACK [ACKsent] id 15 len 10 *Nov 7 10:19:58: PO1/0 PPP: I pkt type 0x8207, datagramsize 8 *Nov 7 10:19:58: PO1/0 IPCP: Address 1.1.1.6 (0x030601010106) *Nov 7 10:19:58: PO1/0 CDPCP: I CONFACK [ACKsent] id 13 len 4 *Nov 7 10:19:59: PO1/0 PPP: I pkt type 0x0207, datagramsize 376 !--- 0x0207 identifies Cisco Discovery Protocol (CDP). *Nov 7 10:19:59: PO1/0 PPP: I pkt type 0x0207, datagramsize 376 *Nov 7 10:19:59: PO1/0 PPP: I pkt type 0x0207, datagramsize 376 *Nov 7 10:19:59: %LINEPROTO-5-UPDOWN: Line protocol on Interface POS1/0, changed state to up |
(3)

!--- ECHOREQand ECHOREP packets for PPP keepalives use packet type values !--- of 0xC021.

*Nov  7 10:20:05: PO1/0 PPP: I pkt type 0xC021, datagramsize 16
*Nov  7 10:20:05: PO1/0 LCP: I ECHOREQ [Open] id 1 len 12 magic 0x269933F4
*Nov  7 10:20:05: PO1/0 LCP: O ECHOREP [Open] id 1 len 12 magic 0x4FAE1B0C
*Nov  7 10:20:07: PO1/0 LCP: O ECHOREQ [Open] id 1 len 12 magic 0x4FAE1B0C
*Nov  7 10:20:07: PO1/0 PPP: I pkt type 0xC021, datagramsize 16
*Nov  7 10:20:07: PO1/0 PPP: O pkt type 0x0207, datagramsize 376
*Nov  7 10:20:07: PO1/0 LCP: I ECHOREP [Open] id 1 len 12 magic 0x269933F4
*Nov  7 10:20:07: PO1/0 LCP: Received id 1, sent id 1, line up
|
| Router B Debug Output |
|---|
(2) Nov 7 12:22:16.947: PO2/0 PPP: I pkt type 0xC021, datagramsize 18 Nov 7 12:22:16.947: PO2/0 LCP: I CONFREQ [REQsent] id 57 len 14 Nov 7 12:22:16.947: PO2/0 LCP: MRU 4470 (0x01041176) Nov 7 12:22:16.947: PO2/0 PPP: I pkt type 0xC021, datagramsize 18 Nov 7 12:22:16.947: PO2/0 LCP: MagicNumber 0x4FAE1B0C (0x05064FAE1B0C) Nov 7 12:22:16.947: PO2/0 LCP: O CONFACK [REQsent] id 57 len 14 Nov 7 12:22:16.947: PO2/0 LCP: MRU 4470 (0x01041176) Nov 7 12:22:16.947: PO2/0 LCP: MagicNumber 0x4FAE1B0C (0x05064FAE1B0C) Nov 7 12:22:16.947: PO2/0 LCP: I CONFACK [ACKsent] id 7 len 14 Nov 7 12:22:16.947: PO2/0 LCP: MRU 4470 (0x01041176) Nov 7 12:22:16.947: PO2/0 LCP: MagicNumber 0x269933F4 (0x0506269933F4) Nov 7 12:22:16.947: PO2/0 IPCP: O CONFREQ [Closed] id 14 len 10 Nov 7 12:22:16.947: PO2/0 IPCP: Address 1.1.1.5 (0x030601010105) Nov 7 12:22:16.947: PO2/0 CDPCP: O CONFREQ [Closed] id 15 len 4 Nov 7 12:22:16.947: PO2/0 PPP: I pkt type 0x8021, datagramsize 14 Nov 7 12:22:16.951: PO2/0 PPP: I pkt type 0x8207, datagramsize 8 Nov 7 12:22:16.951: PO2/0 IPCP: I CONFREQ [REQsent] id 15 len 10 Nov 7 12:22:16.951: PO2/0 IPCP: Address 1.1.1.6 (0x030601010106) Nov 7 12:22:16.951: PO2/0 IPCP: O CONFACK [REQsent] id 15 len 10 Nov 7 12:22:16.951: PO2/0 IPCP: Address 1.1.1.6 (0x030601010106) Nov 7 12:22:16.951: PO2/0 PPP: I pkt type 0x8021, datagramsize 14 Nov 7 12:22:16.951: PO2/0 CDPCP: I CONFREQ [REQsent] id 13 len 4 Nov 7 12:22:16.951: PO2/0 CDPCP: O CONFACK [REQsent] id 13 len 4 Nov 7 12:22:16.951: PO2/0 PPP: I pkt type 0x8207, datagramsize 8 Nov 7 12:22:16.951: PO2/0 IPCP: I CONFACK [ACKsent] id 14 len 10 Nov 7 12:22:16.951: PO2/0 IPCP: Address 1.1.1.5 (0x030601010105) Nov 7 12:22:16.951: PO2/0 CDPCP: I CONFACK [ACKsent] id 15 len 4 Nov 7 12:22:17.947: %LINEPROTO-5-UPDOWN: Line protocol on Interface POS2/0, changed state to up |
(4)

!--- ECHOREQ and ECHOREP packets for PPP keepalives use packet type !--- values of 0xC021.

Nov  7 12:22:17.947: PO2/0 PPP: O pkt type 0x0207, datagramsize 376
Nov  7 12:22:17.947: PO2/0 PPP: O pkt type 0x0207, datagramsize 376
Nov  7 12:22:17.947: PO2/0 PPP: O pkt type 0x0207, datagramsize 376
Nov  7 12:22:23.403: PO2/0 LCP: O ECHOREQ [Open] id 1 len 12 magic 0x269933F4
Nov  7 12:22:23.403: PO2/0 PPP: I pkt type 0xC021, datagramsize 16
Nov  7 12:22:23.403: PO2/0 LCP: I ECHOREP [Open] id 1 len 12 magic 0x4FAE1B0C
Nov  7 12:22:23.403: PO2/0 LCP: Received id 1, sent id 1, line up
Nov  7 12:22:25.595: PO2/0 PPP: I pkt type 0xC021, datagramsize 16
|
Troubleshooting Notes
A POS interface with PPP or HDLC encapsulation supports two mechanisms to alert you of a link failure: Layer 2 keepalives and SONET-layer alarms. Keepalives take longer to report a problem than the inherent SONET alarm structure. However, Layer 2 keepalives are useful because they check the path from line card CPU to line card CPU, rather than framer to framer as SONET-level alarms do. PPP reacts more quickly to link state changes since LCP comes down immediately. In contrast, HDLC must time out the keepalives.
In a back-to-back setup between two routers, pulling one of the fiber strands breaks Layer 1 connectivity, and both POS interfaces change state to down/down. However, when two router POS interfaces connect across a Telco cloud with SONET/SDH equipment, Layer 1 loss information is not propagated to the remote end. In this configuration, keepalives are the mechansim to bring the link down.
Consider this setup.
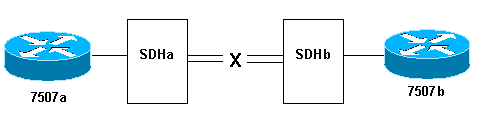
Here is what happens when you pull the transmit fiber strand on the link from SDHb to SDHa:
-
Router 7507a does not receive any keepalives.
-
Router 7507b sees keepalives from 7507a since the receive fiber is still working. Use debug serial interface to confirm this.
Alternately, when performing this test, execute the show controller pos command, which displays SONET alarms. You should see a path alarm indication signal (P-AIS) on router 7507a and a path remote defect indication (P-RDI) on 7507b.
Loopback Tests
If the output of the show interfaces pos command indicates that the serial line is up but the line protocol is down, use loopback tests to determine the source of the problem. Perform a local loop test first, and then a remote test. Refer to Understanding Loopback Modes on Cisco Routers for guidance.
Note: Change the encapsulation from PPP to HDLC when you use loopbacks. The line protocol on an interface configured with PPP comes up only when all LCP and NCP sessions are negotiated successfully.
Line Protocol Status With APS
A POS interface configured for automatic protection switching (APS) brings down the line protocol if the interface is the protect channel and not the working channel. Consider this sample topology:
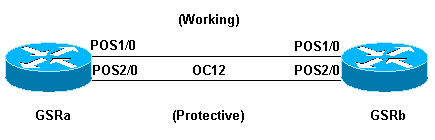
This sample log output was captured after the fiber cabling on GSRb’s POS 1/0 interface was removed. Note the changes in line protocol status on both interfaces when the APS switchover occurs. Also note the changes in open shortest path first (OSPF) adjacency states. (Refer to the APS Technology Support Page for more information.)
*Sep  5 17:41:46: %SONET-4-ALARM:  POS1/0: SLOS
*Sep  5 17:41:46: %SONET-4-ALARM:  POS2/0: APS enabling channel
*Sep  5 17:41:46: %SONET-6-APSREMSWI: POS2/0: Remote APS status now Protect
*Sep  5 17:41:46: %SONET-4-ALARM:  POS1/0: APS disabling channel
*Sep  5 17:41:46: %LINEPROTO-5-UPDOWN: Line protocol on Interface POS2/0,
changed state to up
*Sep  5 17:41:46: %LINEPROTO-5-UPDOWN: Line protocol on Interface POS1/0,
changed state to down
*Sep  5 17:41:48: %LINK-3-UPDOWN: Interface POS1/0, changed state to down
*Sep  5 17:41:48: %OSPF-5-ADJCHG: Process 1, Nbr 192.168.100.100 on POS1/0
from FULL to DOWN, Neighbor Down: Interface down or detached
*Sep  5 17:41:56: %OSPF-5-ADJCHG: Process 1, Nbr 192.168.100.100 on POS2/0
from LOADING to FULL, Loading Done
Avoid configuring APS on a POS interface with PPP encapsulation. PPP is not aware of APS. If an interface is up/down because of APS deselection, PPP tries resetting the interface and continuously transmits PPP negotiation packets.
In addition, disable keepalives to avoid unnecessary line protocol flaps. Keepalives are disabled automatically on most POS router hardware.
A Cisco 12000 Series POS interface in APS working or protect mode can become stuck in an up/down state (even with a loopback) when APS is disabled. Another card inserted in the same slot experiences this problem. Move the card to a new slot to restore proper line-protocol status. This problem is resolved in Cisco IOS Software Release 12.0(19)S under Cisco bug ID CSCdt43759 (registered customers only) .
Use these steps as a workaround:
-
Configure the aps protect command.
-
Issue the aps force 1 command.
-
Configure the no aps protect command.
Known Issues
Note these caveats when you troubleshoot line protocol problems with POS interfaces:
-
A PA-POS interface might reset continuously after the encapsulation is changed from PPP to HDLC. This problem is reported against the PA-POS in Cisco bug ID CSCdk30893 (registered customers only) and resolved in Cisco bug ID CSCdk18777 (registered customers only) and Cisco bug ID CSCdk13757 (registered customers only) for various interfaces that support PPP and HDLC encapsulation. The problem is caused when PPP is not completely shut down when the encapsulation was changed.
-
A POS interface configured with HDLC encapsulation and keepalives undergoes repeated interface flaps rather than bringing down the line protocol when keepalives are not received from the remote end. This problem is resolved in Cisco bug ID CSCdp86387 (registered customers only) .
Related Information
- Optical Technology Support
- Technical Support & Documentation — Cisco Systems
Table Of Contents
Troubleshooting Serial Lines
Troubleshooting Using the show interfaces serial Command
Serial Lines: show interfaces serial Status Line Conditions
Serial Lines: Increasing Output Drops on Serial Link
Serial Lines: Increasing Input Drops on Serial Link
Serial Lines: Increasing Input Errors in Excess of 1 Percent of Total Interface Traffic
Serial Lines: Troubleshooting Serial Line Input Errors
Serial Lines: Increasing Interface Resets on Serial Link
Serial Lines: Increasing Carrier Transitions Count on Serial Link
Using the show controllers Command
Using debug Commands
Using Extended ping Tests
Troubleshooting Clocking Problems
Clocking Overview
Clocking Problem Causes
Detecting Clocking Problems
Isolating Clocking Problems
Clocking Problem Solutions
Inverting the Transmit Clock
Adjusting Buffers
Tuning System Buffers
Implementing Hold Queue Limits
Using Priority Queuing to Reduce Bottlenecks
Special Serial Line Tests
CSU and DSU Loopback Tests
CSU and DSU Local Loopback Tests for HDLC or PPP Links
CSU and DSU Remote Loopback Tests for HDLC or PPP Links
Detailed Information on the show interfaces serial Command
show interfaces serial
Syntax Description
Command Mode
Usage Guidelines
Sample Displays
Troubleshooting T1 Problems
Troubleshooting Using the show controller t1 Command
show controller t1 Conditions
Is the Controller Administratively Down?
Is the Line Up?
If Receiver Has Loss of Frame
If Receiver Has Loss of Signal
If the Line Is in Loopback Mode
If the Controller Displays Any Alarms
Receive (RX) Alarm Indication Signal (AIS) (Blue)
Receive (Rx) Remote Alarm Indication (Yellow)
Transmitter Sending Remote Alarm (Red)
Transmit (Tx) Remote Alarm Indication (Yellow)
Transmit (Tx) AIS (Blue)
Troubleshooting Error Events
Slip Secs Counter Is Increasing
Framing Loss Seconds Counter Is Increasing
Line Code Violations Are Increasing
Verify that isdn switchtype and pri-group Are Configured Correctly
Verifying the Signaling Channel
Troubleshooting a PRI
Troubleshooting Using the show isdn status Command
Using debug q921
Performing Hardware Loopback Plug Test
Performing the Loopback Plug Test
Troubleshooting E1 Problems
Troubleshooting Using the show controller e1 Command
Show controller e1 Conditions
Troubleshooting E1 Error Events
Verifying That isdn switchtype and pri-group Are Configured Correctly
Verifying the Signaling Channel
Troubleshooting a PRI
Troubleshooting Using the show isdn status Command
Using debug q921
Troubleshooting Serial Lines
This chapter presents general troubleshooting information and a discussion of tools and techniques for troubleshooting serial connections. The chapter consists of the following sections:
•![]() Troubleshooting Using the show interfaces serial Command
Troubleshooting Using the show interfaces serial Command
•![]() Using the show controllers Command
Using the show controllers Command
•![]() Using debug Commands
Using debug Commands
•![]() Using Extended ping Tests
Using Extended ping Tests
•![]() Troubleshooting Clocking Problems
Troubleshooting Clocking Problems
•![]() Adjusting Buffers
Adjusting Buffers
•![]() Special Serial Line Tests
Special Serial Line Tests
•![]() Detailed Information on the show interfaces serial Command
Detailed Information on the show interfaces serial Command
•![]() Troubleshooting T1 Problems
Troubleshooting T1 Problems
•![]() Troubleshooting E1 Problems
Troubleshooting E1 Problems
Troubleshooting Using the show interfaces serial Command
The output of the show interfaces serial exec command displays information specific to serial interfaces. Figure 15-1 shows the output of the show interfaces serial exec command for a High-Level Data Link Control (HDLC) serial interface.
This section describes how to use the show interfaces serial command to diagnose serial line connectivity problems in a wide-area network (WAN) environment. The following sections describe some of the important fields of the command output.
Other fields shown in the display are described in detail in the section «Detailed Information on the show interfaces serial Command,» later in this chapter.
Serial Lines: show interfaces serial Status Line Conditions
You can identify five possible problem states in the interface status line of the show interfaces serial display (see Figure 15-1):
•![]() Serial x is down, line protocol is down
Serial x is down, line protocol is down
•![]() Serial x is up, line protocol is down
Serial x is up, line protocol is down
•![]() Serial x is up, line protocol is up (looped)
Serial x is up, line protocol is up (looped)
•![]() Serial x is up, line protocol is down (disabled)
Serial x is up, line protocol is down (disabled)
•![]() Serial x is administratively down, line protocol is down
Serial x is administratively down, line protocol is down
Figure 15-1 Output of the HDLC show interface serial Command
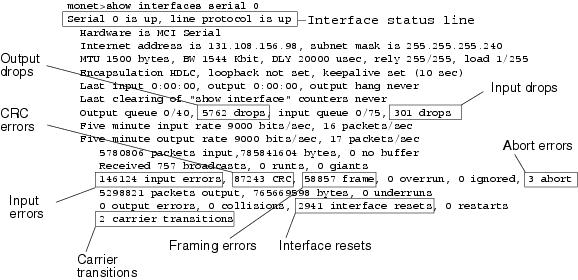
Table 15-1 shows the interface status conditions, possible problems associated with the conditions, and solutions to those problems.
|
Status Line |
Possible Problem |
Solution |
|---|---|---|
|
Serial x is up, line protocol is up |
— |
This is the proper status line condition. No action is required. |
|
Serial x is down, line protocol is down (DTE1 mode) |
The router is not sensing a CD2 signal (that is, the CD is not active). A telephone company problem has occurred—line is down or is not connected to CSU3 /DSU4 . Cabling is faulty or incorrect. Hardware failure has occurred (CSU/DSU). |
1.
2.
3.
4.
5.
6. |
|
Serial x is up, line protocol is down (DTE mode) |
A local or remote router is misconfigured. Keepalives are not being sent by the remote router. A leased-line or other carrier service problem has occurred (noisy line or misconfigured or failed switch). A timing problem has occurred on the cable (SCTE5 not set on CSU/DSU). A local or remote CSU/DSU has failed. Router hardware (local or remote) has failed. |
1. If the line protocol comes up, a telephone company problem or a failed remote router is the likely problem.
2.
3.
4. |
|
Serial x is up, line protocol is down (DTE mode) (continued) |
Caution: Because debugging output is assigned high priority in the CPU process, it can render the system unusable. For this reason, use debug commands only to troubleshoot specific problems or during troubleshooting sessions with Cisco technical support staff. Moreover, it is best to use debug commands during periods of lower network traffic and fewer users. Debugging during these periods decreases the likelihood that increased debug command processing overhead will affect system use.
5.
6.
7. |
|
|
Serial x is up, line protocol is down (DCE6 mode) |
The clockrate interface configuration command is missing. The DTE device does not support or is not set up for SCTE mode (terminal timing). The remote CSU or DSU has failed. |
1. Syntax: clock rate bps Syntax Description:
• |
|
Serial x is up, line protocol is down (DCE mode) (continued) |
The clockrate interface configuration command is missing. The DTE device does not support or is not set up for SCTE mode (terminal timing). The remote CSU or DSU has failed. |
2.
3.
4.
5. |
|
Serial x is up, line protocol is up (looped) |
A loop exists in the circuit. The sequence number in the keepalive packet changes to a random number when a loop is initially detected. If the same random number is returned over the link, a loop exists. |
1.
2.
3.
4.
5. |
|
Serial x is up, line protocol is down (disabled) |
A high error rate has occurred due to a telephone company service problem. A CSU or DSU hardware problem has occurred. Router hardware (interface) is bad. |
1.
2.
3. |
|
Serial x is administrat-ively down, line protocol is down |
The router configuration includes the shutdown interface configuration command. A duplicate IP address exists. |
1.
2.
3.
4. |
1 DTE = data terminal equipment
2 CD = carrier detect
3 CSU = channel service unit
4 DSU = digital service unit
5 SCTE = serial clock transmit external
6 DCE = data circuit-terminating equipment or data communications equipment
7 CTS = clear-to-send
8 DSR = data-set ready
Serial Lines: Increasing Output Drops on Serial Link
Output drops appear in the output of the show interfaces serial command (refer to Figure 15-1) when the system is attempting to hand off a packet to a transmit buffer but no buffers are available.
Symptom: Increasing output drops on serial link
Table 15-2 outlines the possible problem that might cause this symptom and describes solutions to that problem.
|
Possible Problem |
Solution |
|---|---|
|
Input rate to serial interface exceeds bandwidth available on serial link |
1. |
|
Input rate to serial interface exceeds bandwidth available on serial link (continued) |
2.
3.
4. Note: Output drops are acceptable under certain conditions. For instance, if a link is known to be overused (with no way to remedy the situation), it is often considered preferable to drop packets than to hold them. This is true for protocols that support flow control and can retransmit data (such as TCP/IP and Novell IPX2 ). However, some protocols, such as DECnet and local-area transport, are sensitive to dropped packets and accommodate retransmission poorly, if at all. |
1 SAP = Service Advertising Protocol
2 IPX = Internetwork Packet Exchange
Serial Lines: Increasing Input Drops on Serial Link
Input drops appear in the output of the show interfaces serial exec command (refer to Figure 15-1) when too many packets from that interface are still being processed in the system.
Symptom: Increasing number of input drops on serial link
Table 15-3 outlines the possible problem that might cause this symptom and describes solutions to that problem.
|
Possible Problem |
Solution |
|---|---|
|
Input rate exceeds the capacity of the router, or input queues exceed the size of output queues |
Note: Input drop problems are typically seen when traffic is being routed between faster interfaces (such as Ethernet, Token Ring, and FDDI1 ) and serial interfaces. When traffic is light, there is no problem. As traffic rates increase, backups start occurring. Routers drop packets during these congested periods. |
|
Input rate exceeds the capacity of the router, or input queues exceed the size of output queues (continued) |
1.
2. |
1 FDDI = Fiber Distributed Data Interface
Serial Lines: Increasing Input Errors in Excess of 1 Percent of Total Interface Traffic
If input errors appear in the show interfaces serial output (refer to Figure 15-1), there are several possible sources of those errors. The most likely sources are summarized in Table 15-4.

Note ![]() Any input error value for cyclic redundancy check (CRC) errors, framing errors, or aborts above 1 percent of the total interface traffic suggests some kind of link problem that should be isolated and repaired.
Any input error value for cyclic redundancy check (CRC) errors, framing errors, or aborts above 1 percent of the total interface traffic suggests some kind of link problem that should be isolated and repaired.
Symptom: Increasing number of input errors in excess of 1 percent of total interface traffic
|
Possible Problem |
Solution |
|---|---|
|
The following problems can result in this symptom:
•
•
• |
Note: Cisco strongly recommends against the use of data converters when you are connecting a router to a WAN or a serial network.
1. |
|
•
•
•
•
• |
2.
3. |
Serial Lines: Troubleshooting Serial Line Input Errors
Table 15-5 describes the various types of input errors displayed by the show interfaces serial command (see Figure 15-1), possible problems that might be causing the errors, and solutions to those problems.
|
Input Error Type |
Possible Problem |
Solution |
|---|---|---|
|
CRC errors (CRC) |
CRC errors occur when the CRC calculation does not pass (indicating that data is corrupted) for one of the following reasons:
•
•
• |
1.
2.
3.
4. |
|
CRC errors (CRC) (continued) |
•
• |
5. |
|
Framing errors (frame) |
A framing error occurs when a packet does not end on an 8-bit byte boundary for one of the following reasons:
•
•
•
• |
1.
2.
3.
4.
5. |
|
Aborted transmission (abort) |
Aborts indicate an illegal sequence of 1 bit (more than seven in a row) The following are possible reasons for this to occur:
•
•
•
•
•
• |
1.
2.
3.
4.
5.
6. |
1 ESF = Extended Superframe Format
2 B8ZS = binary eight-zero substitution
Serial Lines: Increasing Interface Resets on Serial Link
Interface resets that appear in the output of the show interfaces serial exec command (see Figure 15-1) are the result of missed keepalive packets.
Symptom: Increasing interface resets on serial link
Table 15-6 outlines the possible problems that might cause this symptom and describes solutions to those problems.
|
Possible Problem |
Solution |
|---|---|
|
The following problems can result in this symptom:
•
•
• |
When interface resets are occurring, examine other fields of the show interfaces serial command output to determine the source of the problem. Assuming that an increase in interface resets is being recorded, examine the following fields:
1.
2.
3. |
Serial Lines: Increasing Carrier Transitions Count on Serial Link
Carrier transitions appear in the output of the show interfaces serial exec command whenever there is an interruption in the carrier signal (such as an interface reset at the remote end of a link).
Symptom: Increasing carrier transitions count on serial link
Table 15-7 outlines the possible problems that might cause this symptom and describes solutions to those problems.
|
Possible Problem |
Solution |
|---|---|
|
The following problems can result in this symptom:
•
• |
1.
2.
3. |
Using the show controllers Command
The show controllers exec command is another important diagnostic tool when troubleshooting serial lines. The command syntax varies, depending on platform:
•![]() For serial interfaces on Cisco 7000 series routers, use the show controllers cbus exec command.
For serial interfaces on Cisco 7000 series routers, use the show controllers cbus exec command.
•![]() For Cisco access products, use the show controllers exec command.
For Cisco access products, use the show controllers exec command.
•![]() For the AGS, CGS, and MGS, use the show controllers mci exec command.
For the AGS, CGS, and MGS, use the show controllers mci exec command.
Figure 15-2 shows the output from the show controllers cbus exec command. This command is used on Cisco 7000 series routers with the Fast Serial Interface Processor (FSIP) card. Check the command output to make certain that the cable to the channel service unit/digital service unit (CSU/DSU) is attached to the proper interface. You can also check the microcode version to see whether it is current.
Figure 15-2 show controllers cbus Command Output
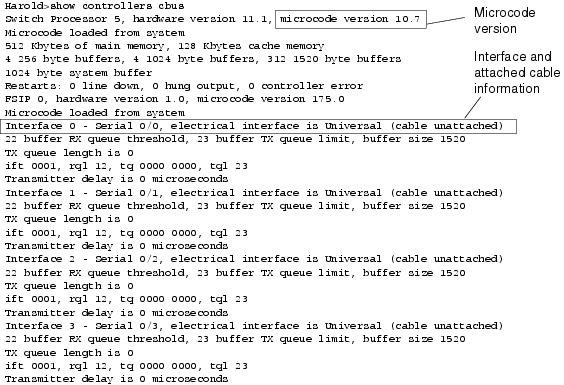
On access products such as the Cisco 2000, Cisco 2500, Cisco 3000, and Cisco 4000 series access servers and routers, use the show controllers exec command. Figure 15-3 shows the show controllers command output from the Basic Rate Interface (BRI) and serial interfaces on a Cisco 2503 access server. (Note that some output is not shown.)
The show controllers output indicates the state of the interface channels and whether a cable is attached to the interface. In Figure 15-3, serial interface 0 has an RS-232 DTE cable attached. Serial interface 1 has no cable attached.
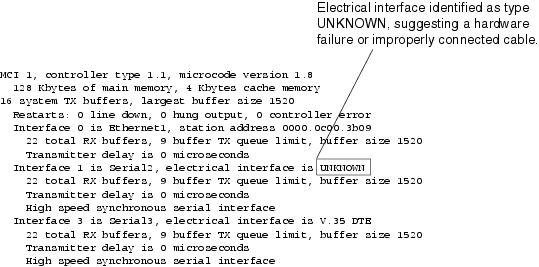
Figure 15-4 shows the output of the show controllers mci command. This command is used on AGS, CGS, and MGS routers only. If the electrical interface is displayed as UNKNOWN (instead of V.35, EIA/TIA-449, or some other electrical interface type), an improperly connected cable is the likely problem. A bad applique or a problem with the internal wiring of the card is also possible. If the electrical interface is unknown, the corresponding display for the show interfaces serial exec command will show that the interface and line protocol are down.
Figure 15-3 show controllers Command Output
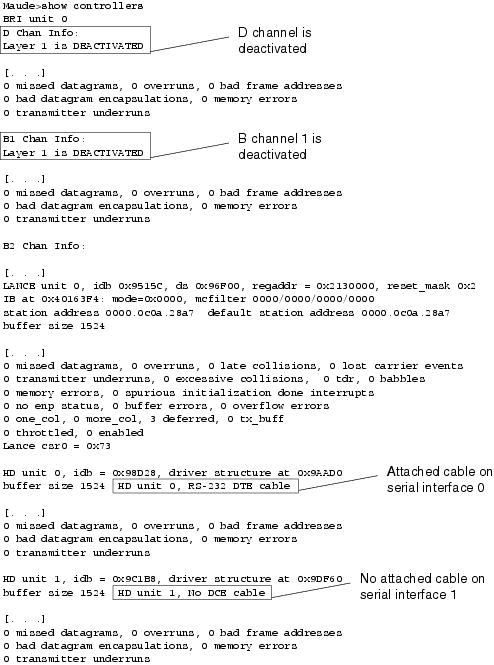
Figure 15-4 show controllers mci Command Output
Using debug Commands
The output of the various debug privileged exec commands provides diagnostic information relating to protocol status and network activity for many internetworking events.

Caution ![]() Because debugging output is assigned high priority in the CPU process, it can render the system unusable. For this reason, use debug commands only to troubleshoot specific problems or during troubleshooting sessions with Cisco technical support staff. Moreover, it is best to use debug commands during periods of lower network traffic and fewer users. Debugging during these periods decreases the likelihood that increased debug command processing overhead will affect system use. When you finish using a debug command, remember to disable it with its specific no debug command or with the no debug all command.
Because debugging output is assigned high priority in the CPU process, it can render the system unusable. For this reason, use debug commands only to troubleshoot specific problems or during troubleshooting sessions with Cisco technical support staff. Moreover, it is best to use debug commands during periods of lower network traffic and fewer users. Debugging during these periods decreases the likelihood that increased debug command processing overhead will affect system use. When you finish using a debug command, remember to disable it with its specific no debug command or with the no debug all command.
Following are some debug commands that are useful when troubleshooting serial and WAN problems. More information about the function and output of each of these commands is provided in the Debug Command Reference publication:
•![]() debug serial interface—Verifies whether HDLC keepalive packets are incrementing. If they are not, a possible timing problem exists on the interface card or in the network.
debug serial interface—Verifies whether HDLC keepalive packets are incrementing. If they are not, a possible timing problem exists on the interface card or in the network.
•![]() debug x25 events—Detects X.25 events, such as the opening and closing of switched virtual circuits (SVCs). The resulting cause and diagnostic information is included with the event report.
debug x25 events—Detects X.25 events, such as the opening and closing of switched virtual circuits (SVCs). The resulting cause and diagnostic information is included with the event report.
•![]() debug lapb—Outputs Link Access Procedure, Balanced (LAPB) or Level 2 X.25 information.
debug lapb—Outputs Link Access Procedure, Balanced (LAPB) or Level 2 X.25 information.
•![]() debug arp—Indicates whether the router is sending information about or learning about routers (with ARP packets) on the other side of the WAN cloud. Use this command when some nodes on a TCP/IP network are responding, but others are not.
debug arp—Indicates whether the router is sending information about or learning about routers (with ARP packets) on the other side of the WAN cloud. Use this command when some nodes on a TCP/IP network are responding, but others are not.
•![]() debug frame-relay lmi—Obtains Local Management Interface (LMI) information useful for determining whether a Frame Relay switch and a router are sending and receiving LMI packets.
debug frame-relay lmi—Obtains Local Management Interface (LMI) information useful for determining whether a Frame Relay switch and a router are sending and receiving LMI packets.
•![]() debug frame-relay events—Determines whether exchanges are occurring between a router and a Frame Relay switch.
debug frame-relay events—Determines whether exchanges are occurring between a router and a Frame Relay switch.
•![]() debug ppp negotiation—Shows Point-to-Point Protocol (PPP) packets transmitted during PPP startup, where PPP options are negotiated.
debug ppp negotiation—Shows Point-to-Point Protocol (PPP) packets transmitted during PPP startup, where PPP options are negotiated.
•![]() debug ppp packet—Shows PPP packets being sent and received. This command displays low-level packet dumps.
debug ppp packet—Shows PPP packets being sent and received. This command displays low-level packet dumps.
•![]() debug ppp errors—Shows PPP errors (such as illegal or malformed frames) associated with PPP connection negotiation and operation.
debug ppp errors—Shows PPP errors (such as illegal or malformed frames) associated with PPP connection negotiation and operation.
•![]() debug ppp chap—Shows PPP Challenge Handshake Authentication Protocol (CHAP) and Password Authentication Protocol (PAP) packet exchanges.
debug ppp chap—Shows PPP Challenge Handshake Authentication Protocol (CHAP) and Password Authentication Protocol (PAP) packet exchanges.
•![]() debug serial packet—Shows Switched Multimegabit Data Service (SMDS) packets being sent and received. This display also prints error messages to indicate why a packet was not sent or was received erroneously. For SMDS, the command dumps the entire SMDS header and some payload data when an SMDS packet is transmitted or received.
debug serial packet—Shows Switched Multimegabit Data Service (SMDS) packets being sent and received. This display also prints error messages to indicate why a packet was not sent or was received erroneously. For SMDS, the command dumps the entire SMDS header and some payload data when an SMDS packet is transmitted or received.
Using Extended ping Tests
The ping command is a useful test available on Cisco internetworking devices as well as on many host systems. In TCP/IP, this diagnostic tool is also known as an Internet Control Message Protocol (ICMP) echo request.
Note ![]() The ping command is particularly useful when high levels of input errors are being registered in the show interfaces serial display. See Figure 15-1.
The ping command is particularly useful when high levels of input errors are being registered in the show interfaces serial display. See Figure 15-1.
Cisco internetworking devices provide a mechanism to automate the sending of many ping packets in sequence. Figure 15-5 illustrates the menu used to specify extended ping options. This example specifies 20 successive pings. However, when testing the components on your serial line, you should specify a much larger number, such as 1000 pings. Also increase the datagram size to a larger number, such as 1500.
Figure 15-5 Extended ping Specification Menu
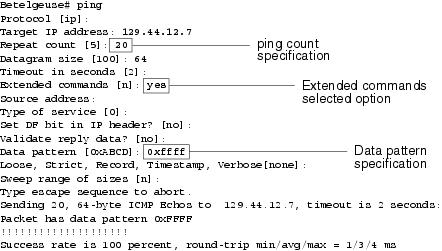
In general, perform serial line ping tests as follows:
Step 1 ![]() Put the CSU or DSU into local loopback mode.
Put the CSU or DSU into local loopback mode.
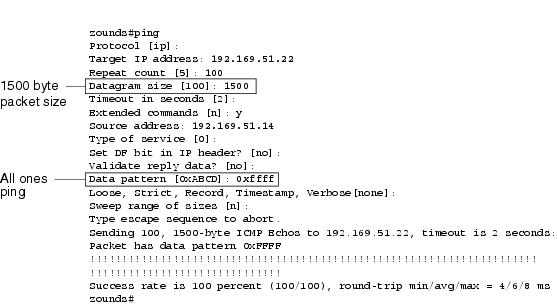
Step 2 ![]() Configure the extended ping command to send different data patterns and packet sizes. Figure 15-6 and Figure 15-7 illustrate two useful ping tests, an all-zeros 1500-byte ping and an all-ones 1500-byte ping, respectively.
Configure the extended ping command to send different data patterns and packet sizes. Figure 15-6 and Figure 15-7 illustrate two useful ping tests, an all-zeros 1500-byte ping and an all-ones 1500-byte ping, respectively.
Step 3 ![]() Examine the show interfaces serial command output (see Figure 15-1) and determine whether input errors have increased. If input errors have not increased, the local hardware (DSU, cable, router interface card) is probably in good condition.
Examine the show interfaces serial command output (see Figure 15-1) and determine whether input errors have increased. If input errors have not increased, the local hardware (DSU, cable, router interface card) is probably in good condition.
Assuming that this test sequence was prompted by the appearance of a large number of CRC and framing errors, a clocking problem is likely. Check the CSU or DSU for a timing problem. See the section «Troubleshooting Clocking Problems,» next.
Step 4 ![]() If you determine that the clocking configuration is correct and is operating properly, put the CSU or DSU into remote loopback mode.
If you determine that the clocking configuration is correct and is operating properly, put the CSU or DSU into remote loopback mode.
Step 5 ![]() Repeat the ping test and look for changes in the input error statistics.
Repeat the ping test and look for changes in the input error statistics.
Step 6 ![]() If input errors increase, there is a problem either in the serial line or on the CSU/DSU. Contact the WAN service provider and swap the CSU or DSU. If problems persist, contact your technical support representative.
If input errors increase, there is a problem either in the serial line or on the CSU/DSU. Contact the WAN service provider and swap the CSU or DSU. If problems persist, contact your technical support representative.
Figure 15-6 All-Zeros 1500-Byte ping Test
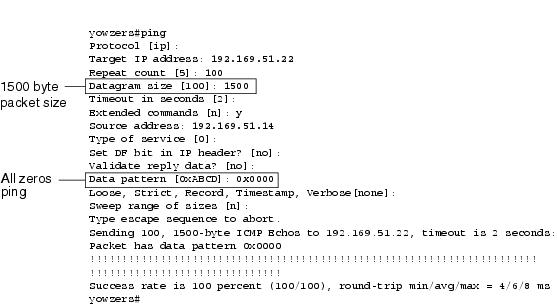
Figure 15-7 All-Ones 1500-Byte ping Test
Troubleshooting Clocking Problems
Clocking conflicts in serial connections can lead either to chronic loss of connection service or to degraded performance. This section discusses the important aspects of clocking problems: clocking problem causes, how to detect clocking problems, how to isolate clocking problems, and clocking problem solutions.
Clocking Overview
The CSU/DSU derives the data clock from the data that passes through it. To recover the clock, the CSU/DSU hardware must receive at least one 1-bit value for every 8 bits of data that pass through it; this is known as ones density. Maintaining ones density allows the hardware to recover the data clock reliably.
Newer T1 implementations commonly use Extended Superframe Format (ESF) framing with binary eight-zero substitution (B8ZS) coding. B8ZS provides a scheme by which a special code is substituted whenever eight consecutive zeros are sent through the serial link. This code is then interpreted at the remote end of the connection. This technique guarantees ones density independent of the data stream.
Older T1 implementations use D4 (also known as Superframe Format [SF]) framing and Alternate Mark Inversion (AMI) coding. AMI does not utilize a coding scheme like B8ZS. This restricts the type of data that can be transmitted because ones density is not maintained independent of the data stream.
Another important element in serial communications is serial clock transmit external (SCTE) terminal timing. SCTE is the clock echoed back from the data terminal equipment (DTE) device (for example, a router) to the data communications equipment (DCE) device (for example, the CSU/DSU).
When the DCE device uses SCTE instead of its internal clock to sample data from the DTE, it can better sample the data without error even if there is a phase shift in the cable between the CSU/DSU and the router. Using SCTE is highly recommended for serial transmissions faster than 64 kbps. If your CSU/DSU does not support SCTE, see the section «Inverting the Transmit Clock,» later in this chapter.
Clocking Problem Causes
In general, clocking problems in serial WAN interconnections can be attributed to one of the following causes:
•![]() Incorrect DSU configuration
Incorrect DSU configuration
•![]() Incorrect CSU configuration
Incorrect CSU configuration
•![]() Cables out of specification (longer than 50 feet [15.24 meters] or unshielded)
Cables out of specification (longer than 50 feet [15.24 meters] or unshielded)
•![]() Noisy or poor patch panel connections
Noisy or poor patch panel connections
•![]() Several cables connected in a row
Several cables connected in a row
Detecting Clocking Problems
To detect clocking conflicts on a serial interface, look for input errors as follows:
Step 1 ![]() Use the show interfaces serial exec command on the routers at both ends of the link.
Use the show interfaces serial exec command on the routers at both ends of the link.
Step 2 ![]() Examine the command output for CRC, framing errors, and aborts.
Examine the command output for CRC, framing errors, and aborts.
Step 3 ![]() If either of these steps indicates errors exceeding an approximate range of 0.5 percent to 2.0 percent of traffic on the interface, clocking problems are likely to exist somewhere in the WAN.
If either of these steps indicates errors exceeding an approximate range of 0.5 percent to 2.0 percent of traffic on the interface, clocking problems are likely to exist somewhere in the WAN.
Step 4 ![]() Isolate the source of the clocking conflicts, as outlined in the following section, «Isolating Clocking Problems.»
Isolate the source of the clocking conflicts, as outlined in the following section, «Isolating Clocking Problems.»
Step 5 ![]() Bypass or repair any faulty patch panels.
Bypass or repair any faulty patch panels.
Isolating Clocking Problems
After you determine that clocking conflicts are the most likely cause of input errors, use the following procedure to isolate the source of those errors:
Step 1 ![]() Perform a series of ping tests and loopback tests (both local and remote), as described in the section «CSU and DSU Loopback Tests,» earlier in this chapter.
Perform a series of ping tests and loopback tests (both local and remote), as described in the section «CSU and DSU Loopback Tests,» earlier in this chapter.
Step 2 ![]() Determine which end of the connection is the source of the problem, or whether the problem is in the line. In local loopback mode, run different patterns and sizes in the ping tests (for example, use 1500-byte datagrams). Using a single pattern and packet size may not force errors to materialize, particularly when a serial cable to the router or CSU/DSU is the problem.
Determine which end of the connection is the source of the problem, or whether the problem is in the line. In local loopback mode, run different patterns and sizes in the ping tests (for example, use 1500-byte datagrams). Using a single pattern and packet size may not force errors to materialize, particularly when a serial cable to the router or CSU/DSU is the problem.
Step 3 ![]() Use the show interfaces serial exec command, and determine whether input errors counts are increasing and where they are accumulating.
Use the show interfaces serial exec command, and determine whether input errors counts are increasing and where they are accumulating.
If input errors are accumulating on both ends of the connection, clocking of the CSU is the most likely problem.
If only one end is experiencing input errors, there is probably a DSU clocking or cabling problem.
Aborts on one end suggest that the other end is sending bad information or that there is a line problem.
Note ![]() Always refer to the show interfaces serial command output (see Figure 15-1). Log any changes in error counts, or note if the error count does not change.
Always refer to the show interfaces serial command output (see Figure 15-1). Log any changes in error counts, or note if the error count does not change.
Clocking Problem Solutions
Table 15-8 outlines suggested remedies for clocking problems, based on the source of the problem.
|
Possible Problem |
Solution |
|---|---|
|
Incorrect CSU configuration |
1.
2.
3. |
|
Incorrect DSU configuration |
1.
2. (For any interface that is connected to a line of 128 kbps or faster, SCTE must be enabled. If your DSU does not support SCTE, see the section «Inverting the Transmit Clock,» later in this chapter.)
3. Check with your leased-line provider for information on its framing and coding schemes.
4. |
|
Cable to router out of specification |
If the cable is longer than 50 feet (15.24 meters), use a shorter cable. If the cable is unshielded, replace it with shielded cable. |
Inverting the Transmit Clock
If you are attempting serial connections at speeds greater than 64 kbps with a CSU/DSU that does not support SCTE, you might have to invert the transmit clock on the router. Inverting the transmit clock compensates for phase shifts between the data and clock signals.
The specific command used to invert the transmit clock varies between platforms. On a Cisco 7000 series router, enter the invert-transmit-clock interface configuration command. For Cisco 4000 series routers, use the dte-invert-txc interface configuration command.
To ensure that you are using the correct command syntax for your router, refer to the user guide for your router or access server and to the Cisco IOS configuration guides and command references.
Note ![]() On older platforms, inverting the transmit clock might require that you move a physical jumper.
On older platforms, inverting the transmit clock might require that you move a physical jumper.
Adjusting Buffers
Excessively high bandwidth utilization greater than 70 percent results in reduced overall performance and can cause intermittent failures. For example, DECnet file transmissions might be failing because of packets being dropped somewhere in the network.
If the situation is bad enough, you must increase the bandwidth of the link. However, increasing the bandwidth might not be necessary or immediately practical. One way to resolve marginal serial line overutilization problems is to control how the router uses data buffers.
Caution ![]() In general, do not adjust system buffers unless you are working closely with a Cisco technical support representative. You can severely affect the performance of your hardware and your network if you incorrectly adjust the system buffers on your router.
In general, do not adjust system buffers unless you are working closely with a Cisco technical support representative. You can severely affect the performance of your hardware and your network if you incorrectly adjust the system buffers on your router.
Use one of the following three options to control how buffers are used:
•![]() Adjust parameters associated with system buffers.
Adjust parameters associated with system buffers.
•![]() Specify the number of packets held in input or output queues (hold queues).
Specify the number of packets held in input or output queues (hold queues).
•![]() Prioritize how traffic is queued for transmission (priority output queuing).
Prioritize how traffic is queued for transmission (priority output queuing).
The configuration commands associated with these options are described in the Cisco IOS configuration guides and command references.
The following section focuses on identifying situations in which these options are likely to apply and defining how you can use these options to help resolve connectivity and performance problems in serial/WAN interconnections.
Tuning System Buffers
There are two general buffer types on Cisco routers: hardware buffers and system buffers. Only the system buffers are directly configurable by system administrators. The hardware buffers are specifically used as the receive and transmit buffers associated with each interface and (in the absence of any special configuration) are dynamically managed by the system software itself.
The system buffers are associated with the main system memory and are allocated to different-size memory blocks. A useful command for determining the status of your system buffers is the show buffers exec command. Figure 15-8 shows the output from the show buffers command.
Figure 15-8 show buffers Command Output
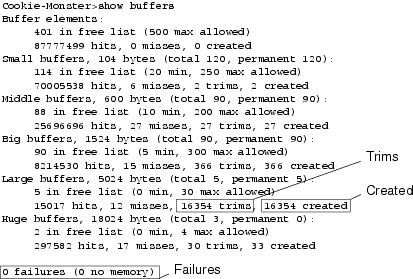
In the show buffers output, the following is true:
•![]() total identifies the total number of buffers in the pool, including used and unused buffers.
total identifies the total number of buffers in the pool, including used and unused buffers.
•![]() permanent identifies the permanent number of allocated buffers in the pool. These buffers are always in the pool and cannot be trimmed away.
permanent identifies the permanent number of allocated buffers in the pool. These buffers are always in the pool and cannot be trimmed away.
•![]() in free list identifies the number of buffers currently in the pool that are available for use.
in free list identifies the number of buffers currently in the pool that are available for use.
•![]() min identifies the minimum number of buffers that the route processor (RP) should attempt to keep in the free list:
min identifies the minimum number of buffers that the route processor (RP) should attempt to keep in the free list:
–![]() The min parameter is used to anticipate demand for buffers from the pool at any given time.
The min parameter is used to anticipate demand for buffers from the pool at any given time.
–![]() If the number of buffers in the free list falls below the min value, the RP attempts to create more buffers for that pool.
If the number of buffers in the free list falls below the min value, the RP attempts to create more buffers for that pool.
•![]() max allowed identifies the maximum number of buffers allowed in the free list:
max allowed identifies the maximum number of buffers allowed in the free list:
–![]() The max allowed parameter prevents a pool from monopolizing buffers that it doesn’t need anymore, and frees this memory back to the system for further use.
The max allowed parameter prevents a pool from monopolizing buffers that it doesn’t need anymore, and frees this memory back to the system for further use.
–![]() If the number of buffers in the free list is greater than the max allowed value, the RP should attempt to trim buffers from the pool.
If the number of buffers in the free list is greater than the max allowed value, the RP should attempt to trim buffers from the pool.
•![]() hits identifies the number of buffers that have been requested from the pool. The hits counter provides a mechanism for determining which pool must meet the highest demand for buffers.
hits identifies the number of buffers that have been requested from the pool. The hits counter provides a mechanism for determining which pool must meet the highest demand for buffers.
•![]() misses identifies the number of times that a buffer has been requested and that the RP detected that additional buffers were required. (In other words, the number of buffers in the free list has dropped below min.) The misses counter represents the number of times that the RP has been forced to create additional buffers.
misses identifies the number of times that a buffer has been requested and that the RP detected that additional buffers were required. (In other words, the number of buffers in the free list has dropped below min.) The misses counter represents the number of times that the RP has been forced to create additional buffers.
•![]() trims identifies the number of buffers that the RP has trimmed from the pool when the number of buffers in the free list exceeded the number of max allowed buffers.
trims identifies the number of buffers that the RP has trimmed from the pool when the number of buffers in the free list exceeded the number of max allowed buffers.
•![]() created identifies the number of buffers that has been created in the pool. The RP creates buffers when demand for buffers has increased until the number of buffers in the free list is less than min buffers or a miss occurs because of zero buffers in the free list.
created identifies the number of buffers that has been created in the pool. The RP creates buffers when demand for buffers has increased until the number of buffers in the free list is less than min buffers or a miss occurs because of zero buffers in the free list.
•![]() failures identifies the number of failures to grant a buffer to a requester even after attempting to create an additional buffer. The number of failures represents the number of packets that have been dropped due to buffer shortage.
failures identifies the number of failures to grant a buffer to a requester even after attempting to create an additional buffer. The number of failures represents the number of packets that have been dropped due to buffer shortage.
•![]() no memory identifies the number of failures caused by insufficient memory to create additional buffers.
no memory identifies the number of failures caused by insufficient memory to create additional buffers.
The show buffers command output in Figure 15-8 indicates high numbers in the Trims and Created fields for large buffers. If you are receiving high numbers in these fields, you can increase your serial link performance by increasing the max free value configured for your system buffers. trims identifies the number of buffers that the RP has trimmed from the pool when the number of buffers in free list exceeded the number of max allowed buffers.
Use the buffers max free number global configuration command to increase the number of free system buffers. The value that you configure should be approximately 150 percent of the figure indicated in the total field of the show buffers command output. Repeat this process until the show buffers output no longer indicates trims and created buffers.
If the show buffers command output shows a large number of failures in the (no memory) field (see the last line of output in Figure 15-8), you must reduce the usage of the system buffers or increase the amount of shared or main memory (physical RAM) on the router. Call your technical support representative for assistance.
Implementing Hold Queue Limits
Hold queues are buffers used by each router interface to store outgoing or incoming packets. Use the hold-queue interface configuration command to increase the number of data packets queued before the router will drop packets. Increase these queues by small increments (for instance, 25 percent) until you no longer see drops in the show interfaces output. The default output hold queue limit is 100 packets.
Note ![]() The hold-queue command is used for process-switched packets and periodic updates generated by the router.
The hold-queue command is used for process-switched packets and periodic updates generated by the router.
Use the hold-queue command to prevent packets from being dropped and to improve serial link performance under the following conditions:
•![]() You have an application that cannot tolerate drops, and the protocol is capable of tolerating longer delays. DECnet is an example of a protocol that meets both criteria. Local-area transport (LAT) does not meet this criteria because it does not tolerate delays.
You have an application that cannot tolerate drops, and the protocol is capable of tolerating longer delays. DECnet is an example of a protocol that meets both criteria. Local-area transport (LAT) does not meet this criteria because it does not tolerate delays.
•![]() The interface is very slow (bandwidth is low or anticipated utilization is likely to sporadically exceed available bandwidth).
The interface is very slow (bandwidth is low or anticipated utilization is likely to sporadically exceed available bandwidth).
Note ![]() When you increase the number specified for an output hold queue, you might need to increase the number of system buffers. The value used depends on the size of the packets associated with the traffic anticipated for the network.
When you increase the number specified for an output hold queue, you might need to increase the number of system buffers. The value used depends on the size of the packets associated with the traffic anticipated for the network.
Using Priority Queuing to Reduce Bottlenecks
Priority queuing is a list-based control mechanism that allows traffic to be prioritized on an interface-by-interface basis. Priority queuing involves two steps:
Step 1 ![]() Create a priority list by protocol type and level of priority.
Create a priority list by protocol type and level of priority.
Step 2 ![]() Assign the priority list to a specific interface.
Assign the priority list to a specific interface.
Both of these steps use versions of the priority-list global configuration command. In addition, further traffic control can be applied by referencing access-list global configuration commands from priority-list specifications. For examples of defining priority lists and for details about command syntax associated with priority queuing, refer to the Cisco IOS configuration guides and command references.
Note ![]() Priority queuing automatically creates four hold queues of varying size. This overrides any hold queue specification included in your configuration.
Priority queuing automatically creates four hold queues of varying size. This overrides any hold queue specification included in your configuration.
Use priority queuing to prevent packets from being dropped and to improve serial link performance under the following conditions:
•![]() When the interface is slow, a variety of traffic types are being transmitted, and you want to improve terminal traffic performance
When the interface is slow, a variety of traffic types are being transmitted, and you want to improve terminal traffic performance
•![]() If you have a serial link that is intermittently experiencing very heavy loads (such as file transfers occurring at specific times), and priority queuing will help select which types of traffic should be discarded at high traffic periods
If you have a serial link that is intermittently experiencing very heavy loads (such as file transfers occurring at specific times), and priority queuing will help select which types of traffic should be discarded at high traffic periods
In general, start with the default number of queues when implementing priority queues. After enabling priority queuing, monitor output drops with the show interfaces serial exec command. If you notice that output drops are occurring in the traffic queue that you have specified to be high priority, increase the number of packets that can be queued (using the queue-limit keyword option of the priority-list global configuration command). The default queue-limit arguments are 20 packets for the high-priority queue, 40 for medium, 60 for normal, and 80 for low.
Note ![]() When bridging Digital Equipment Corporation (Digital) LAT traffic, the router must drop very few packets, or LAT sessions can terminate unexpectedly. A high-priority queue depth of about 100 (specified with the queue-limit keyword) is a typical working value when your router is dropping output packets and the serial lines are subjected to about 50 percent bandwidth utilization. If the router is dropping packets and is at 100 percent utilization, you need another line.
When bridging Digital Equipment Corporation (Digital) LAT traffic, the router must drop very few packets, or LAT sessions can terminate unexpectedly. A high-priority queue depth of about 100 (specified with the queue-limit keyword) is a typical working value when your router is dropping output packets and the serial lines are subjected to about 50 percent bandwidth utilization. If the router is dropping packets and is at 100 percent utilization, you need another line.
Another tool to relieve congestion when bridging Digital LAT is LAT compression. You can implement LAT compression with the interface configuration command bridge-group group lat-compression.
Special Serial Line Tests
In addition to the basic diagnostic capabilities available on routers, a variety of supplemental tools and techniques can be used to determine the conditions of cables, switching equipment, modems, hosts, and remote internetworking hardware. For more information, consult the documentation for your CSU, DSU, serial analyzer, or other equipment.
CSU and DSU Loopback Tests
If the output of the show interfaces serial exec command indicates that the serial line is up but the line protocol is down, use the CSU/DSU loopback tests to determine the source of the problem. Perform the local loop test first, and then perform the remote test. Figure 15-9 illustrates the basic topology of the CSU/DSU local and remote loopback tests.
Figure 15-9 CSU/DSU Local and Remote Loopback Tests
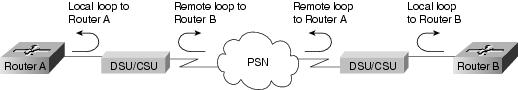
Note ![]() These tests are generic in nature and assume attachment of the internetworking system to a CSU or DSU. However, the tests are essentially the same for attachment to a multiplexer with built-in CSU/DSU functionality. Because there is no concept of a loopback in X.25 or Frame Relay packet-switched network (PSN) environments, loopback tests do not apply to X.25 and Frame Relay networks.
These tests are generic in nature and assume attachment of the internetworking system to a CSU or DSU. However, the tests are essentially the same for attachment to a multiplexer with built-in CSU/DSU functionality. Because there is no concept of a loopback in X.25 or Frame Relay packet-switched network (PSN) environments, loopback tests do not apply to X.25 and Frame Relay networks.
CSU and DSU Local Loopback Tests for HDLC or PPP Links
Following is a general procedure for performing loopback tests in conjunction with built-in system diagnostic capabilities:
Step 1 ![]() Place the CSU/DSU in local loop mode (refer to your vendor documentation). In local loop mode, the use of the line clock (from the T1 service) is terminated, and the DSU is forced to use the local clock.
Place the CSU/DSU in local loop mode (refer to your vendor documentation). In local loop mode, the use of the line clock (from the T1 service) is terminated, and the DSU is forced to use the local clock.
Step 2 ![]() Use the show interfaces serial exec command to determine whether the line status changes from «line protocol is down» to «line protocol is up (looped),» or whether it remains down.
Use the show interfaces serial exec command to determine whether the line status changes from «line protocol is down» to «line protocol is up (looped),» or whether it remains down.
Step 3 ![]() If the line protocol comes up when the CSU or DSU is in local loopback mode, this suggests that the problem is occurring on the remote end of the serial connection. If the status line does not change state, there is a possible problem in the router, connecting cable, or CSU/DSU.
If the line protocol comes up when the CSU or DSU is in local loopback mode, this suggests that the problem is occurring on the remote end of the serial connection. If the status line does not change state, there is a possible problem in the router, connecting cable, or CSU/DSU.
Step 4 ![]() If the problem appears to be local, use the debug serial interface privileged exec command.
If the problem appears to be local, use the debug serial interface privileged exec command.
Step 5 ![]() Take the CSU/DSU out of local loop mode. When the line protocol is down, the debug serial interface command output will indicate that keepalive counters are not incrementing.
Take the CSU/DSU out of local loop mode. When the line protocol is down, the debug serial interface command output will indicate that keepalive counters are not incrementing.
Step 6 ![]() Place the CSU/DSU in local loop mode again. This should cause the keepalive packets to begin to increment. Specifically, the values for mineseen and yourseen keepalives will increment every 10 seconds. This information will appear in the debug serial interface output.
Place the CSU/DSU in local loop mode again. This should cause the keepalive packets to begin to increment. Specifically, the values for mineseen and yourseen keepalives will increment every 10 seconds. This information will appear in the debug serial interface output.
If the keepalives do not increment, there may be a timing problem on the interface card or on the network. For information on correcting timing problems, refer to the section «Troubleshooting Clocking Problems,» earlier in this chapter.
Step 7 ![]() Check the local router and CSU/DSU hardware, and any attached cables. Make certain that the cables are within the recommended lengths (no more than 50 feet [15.24 meters], or 25 feet [7.62 meters] for a T1 link). Make certain that the cables are attached to the proper ports. Swap faulty equipment, as necessary.
Check the local router and CSU/DSU hardware, and any attached cables. Make certain that the cables are within the recommended lengths (no more than 50 feet [15.24 meters], or 25 feet [7.62 meters] for a T1 link). Make certain that the cables are attached to the proper ports. Swap faulty equipment, as necessary.
Figure 15-10 shows the output from the debug serial interface command for an HDLC serial connection, with missed keepalives causing the line to go down and the interface to reset.
Figure 15-10 debug serial interface Command Output
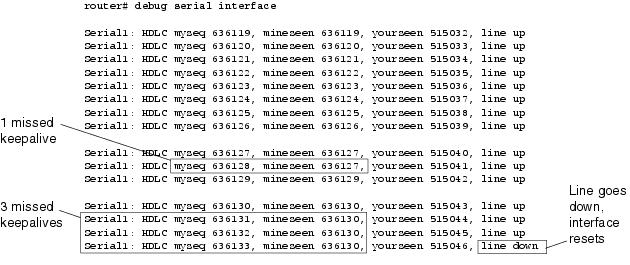
CSU and DSU Remote Loopback Tests for HDLC or PPP Links
If you determine that the local hardware is functioning properly, but you still encounter problems when attempting to establish connections over the serial link, try using the remote loopback test to isolate the problem’s cause.
Note ![]() This remote loopback test assumes that HDLC encapsulation is being used and that the preceding local loop test was performed immediately before this test.
This remote loopback test assumes that HDLC encapsulation is being used and that the preceding local loop test was performed immediately before this test.
The following are the steps required to perform loopback testing:
Step 1 ![]() Put the remote CSU or DSU into remote loopback mode (refer to the vendor documentation).
Put the remote CSU or DSU into remote loopback mode (refer to the vendor documentation).
Step 2 ![]() Using the show interfaces serial exec command, determine whether the line protocol remains up, with the status line indicating «Serial x is up, line protocol is up (looped),» or goes down, with the status line indicating «line protocol is down.»
Using the show interfaces serial exec command, determine whether the line protocol remains up, with the status line indicating «Serial x is up, line protocol is up (looped),» or goes down, with the status line indicating «line protocol is down.»
Step 3 ![]() If the line protocol remains up (looped), the problem is probably at the remote end of the serial connection (between the remote CSU/DSU and the remote router). Perform both local and remote tests at the remote end to isolate the problem source.
If the line protocol remains up (looped), the problem is probably at the remote end of the serial connection (between the remote CSU/DSU and the remote router). Perform both local and remote tests at the remote end to isolate the problem source.
Step 4 ![]() If the line status changes to «line protocol is down» when remote loopback mode is activated, make certain that ones density is being properly maintained. The CSU/DSU must be configured to use the same framing and coding schemes used by the leased-line or other carrier service (for example, ESF and B8ZS).
If the line status changes to «line protocol is down» when remote loopback mode is activated, make certain that ones density is being properly maintained. The CSU/DSU must be configured to use the same framing and coding schemes used by the leased-line or other carrier service (for example, ESF and B8ZS).
Step 5 ![]() If problems persist, contact your WAN network manager or the WAN service organization.
If problems persist, contact your WAN network manager or the WAN service organization.
Detailed Information on the show interfaces serial Command
This section covers the show interfaces serial command’s parameters, syntax description, sample output display, and field descriptions.
show interfaces serial
To display information about a serial interface, use the show interfaces serial privileged exec command:
show interfaces serial [number] [accounting]
show interfaces serial [number [:channel-group] [accounting] (Cisco 4000 series)
show interfaces serial [slot | port [:channel-group]] [accounting] (Cisco 7500 series)
show interfaces serial [type slot | port-adapter | port] [serial] (ports on VIP cards in the Cisco 7500 series)
show interfaces serial [type slot | port-adapter | port] [:t1-channel] [accounting | crb] (CT3IP in Cisco 7500 series)
Syntax Description
•![]() Number—(Optional) Port number.
Number—(Optional) Port number.
•![]() accounting—(Optional) Displays the number of packets of each protocol type that have been sent through the interface.
accounting—(Optional) Displays the number of packets of each protocol type that have been sent through the interface.
•![]() :channel-group—(Optional) On the Cisco 4000 series with an NPM or a Cisco 7500 series with a MIP, specifies the T1 channel-group number in the range of 0 to 23, defined with the channel-group controller configuration command.
:channel-group—(Optional) On the Cisco 4000 series with an NPM or a Cisco 7500 series with a MIP, specifies the T1 channel-group number in the range of 0 to 23, defined with the channel-group controller configuration command.
•![]() slot—Refer to the appropriate hardware manual for slot information.
slot—Refer to the appropriate hardware manual for slot information.
•![]() port—Refer to the appropriate hardware manual for port information.
port—Refer to the appropriate hardware manual for port information.
•![]() port-adapter—Refer to the appropriate hardware manual for information about port adapter compatibility.
port-adapter—Refer to the appropriate hardware manual for information about port adapter compatibility.
•![]() :t1-channel—(Optional) For the CT3IP, the T1 channel is a number between 1 and 28.
:t1-channel—(Optional) For the CT3IP, the T1 channel is a number between 1 and 28.
T1 channels on the CT3IP are numbered 1 to 28 rather than the more traditional zero-based scheme (0 to 27) used with other Cisco products. This is to ensure consistency with telco numbering schemes for T1 channels within channelized T3 equipment.
•![]() crb—(Optional) Shows interface routing and bridging information.
crb—(Optional) Shows interface routing and bridging information.
Command Mode
Privileged exec
Usage Guidelines
This command first appeared in Cisco IOS Release 10.0 for the Cisco 4000 series. It first appeared in Cisco IOS Release 11.0 for the Cisco 7000 series, and it was modified in Cisco IOS Release 11.3 to include the CT3IP.
Sample Displays
The following is sample output from the show interfaces command for a synchronous serial interface:
Router# show interfaces serial
Serial 0 is up, line protocol is up
Internet address is 150.136.190.203, subnet mask is 255.255.255.0
MTU 1500 bytes, BW 1544 Kbit, DLY 20000 usec, rely 255/255, load 1/255
Encapsulation HDLC, loopback not set, keepalive set (10 sec)
Last input 0:00:07, output 0:00:00, output hang never
Output queue 0/40, 0 drops; input queue 0/75, 0 drops
Five minute input rate 0 bits/sec, 0 packets/sec
Five minute output rate 0 bits/sec, 0 packets/sec
16263 packets input, 1347238 bytes, 0 no buffer
Received 13983 broadcasts, 0 runts, 0 giants
2 input errors, 0 CRC, 0 frame, 0 overrun, 0 ignored, 2 abort
22146 packets output, 2383680 bytes, 0 underruns
0 output errors, 0 collisions, 2 interface resets, 0 restarts
Table 15-9 describes significant fields shown in the output.
|
Field |
Description |
|---|---|
|
Serial…is {up | down}…is administratively down |
Indicates whether the interface hardware is currently active (whether carrier detect is present) or whether it has been taken down by an administrator. |
|
line protocol is {up | down} |
Indicates whether the software processes that handle the line protocol consider the line usable (that is, whether keepalives are successful), or whether it has been taken down by an administrator. |
|
Hardware is |
Specifies the hardware type. |
|
Internet address is |
Specifies the Internet address and subnet mask. |
|
MTU |
Specifies the maximum transmission unit of the interface. |
|
BW |
Indicates the value of the bandwidth parameter that has been configured for the interface (in kilobits per second). The bandwidth parameter is used to compute IGRP metrics only. If the interface is attached to a serial line with a line speed that does not match the default (1536 or 1544 for T1, and 56 for a standard synchronous serial line), use the bandwidth command to specify the correct line speed for this serial line.
|
|
DLY |
Gives the delay of the interface in microseconds. |
|
rely |
Expresses reliability of the interface as a fraction of 255 (255/255 is 100 percent reliability), calculated as an exponential average over 5 minutes. |
|
load |
Expresses load on the interface as a fraction of 255 (255/255 is completely saturated), calculated as an exponential average over five minutes. |
|
Encapsulation |
Gives the encapsulation method assigned to the interface. |
|
loopback |
Indicates whether loopback is set. |
|
keepalive |
Indicates whether keepalives are set. |
|
Last input |
Gives the number of hours, minutes, and seconds since the last packet was successfully received by an interface. Useful for knowing when a dead interface failed. |
|
Last output |
Gives the number of hours, minutes, and seconds since the last packet was successfully transmitted by an interface. |
|
output hang |
Gives the number of hours, minutes, and seconds (or never) since the interface was last reset because of a transmission that took too long. When the number of hours in any of the last fields exceeds 24, the number of days and hours is printed. If that field overflows, asterisks are printed. |
|
Output queue, drops input queue, drops |
Gives the number of packets in output and input queues. Each number is followed by a slash, the maximum size of the queue, and the number of packets because the queue is full. |
|
5 minute input rate 5 minute output rate |
Gives the average number of bits and packets transmitted per second in the past 5 minutes. The 5-minute input and output rates should be used only as an approximation of traffic per second during a given 5-minute period. These rates are exponentially weighted averages with a time constant of 5 minutes. A period of four time constants must pass before the average will be within 2 percent of the instantaneous rate of a uniform stream of traffic over that period. |
|
packets input |
Gives the total number of error-free packets received by the system. |
|
bytes |
Gives the total number of bytes, including data and MAC encapsulation, in the error-free packets received by the system. |
|
no buffer |
Gives the number of received packets discarded because there was no buffer space in the main system. Compare with ignored count. Broadcast storms on Ethernet networks and bursts of noise on serial lines are often responsible for no input buffer events. |
|
Received…broadcasts |
Gives the total number of broadcast or multicast packets received by the interface. |
|
runts |
Gives the number of packets that are discarded because they are smaller than the medium’s minimum packet size. |
|
Giants |
Gives the number of packets that are discarded because they exceed the medium’s maximum packet size. |
|
input errors |
Gives the total number of no buffer, runts, giants, CRCs, frame, overrun, ignored, and abort counts. Other input-related errors can also increment the count, so this sum might not balance with the other counts. |
|
CRC |
The Cyclic Redundancy Check (CRC) counter is incremented by the originating station or far-end device when the checksum calculated from the data received does not match the checksum from the transmitted data. On a serial link, CRCs usually indicate noise, gain hits, or other transmission problems on the data link. |
|
frame |
Gives the number of packets received incorrectly, having a CRC error and a noninteger number of octets. On a serial line, this is usually the result of noise or other transmission problems. |
|
overrun |
Gives the number of times that the serial receiver hardware was incapable of handing received data to a hardware buffer because the input rate exceeded the receiver’s capability to handle the data. |
|
ignored |
Gives the number of received packets ignored by the interface because the interface hardware ran low on internal buffers. Broadcast storms and bursts of noise can cause the ignored count to be increased. |
|
abort |
Indicates an illegal sequence of 1 bit on a serial interface. This usually indicates a clocking problem between the serial interface and the data link equipment. |
|
carrier transitions |
Gives the number of times that the carrier detect signal of a serial interface has changed state. For example, if data carrier detect (DCD) goes down and comes up, the carrier transition counter will increment two times. This indicates modem or line problems if the carrier detect line is changing state often. |
|
packets output |
Gives the total number of messages transmitted by the system. |
|
bytes output |
Gives the total number of bytes, including data and MAC encapsulation, transmitted by the system. |
|
underruns |
Gives the number of times that the transmitter has been running faster than the router can handle. This might never be reported on some interfaces. |
|
output errors |
Gives the sum of all errors that prevented the final transmission of datagrams out of the interface being examined. Note that this might not balance with the sum of the enumerated output errors because some datagrams can have more than one error, and others can have errors that do not fall into any of the specifically tabulated categories. |
|
collisions |
Gives the number of messages retransmitted because of an Ethernet collision. This usually is the result of an overextended LAN (Ethernet or transceiver cable too long, more than two repeaters between stations, or too many cascaded multiport transceivers). Some collisions are normal. However, if your collision rate climbs to around 4 percent or 5 percent, you should consider verifying that there is no faulty equipment on the segment, or moving some existing stations to a new segment. A packet that collides is counted only once in output packets. |
|
interface resets |
Gives the number of times that an interface has been completely reset. This can happen if packets queued for transmission were not sent within several seconds. On a serial line, this can be caused by a malfunctioning modem that is not supplying the transmit clock signal, or by a cable problem. If the system notices that the carrier detect line of a serial interface is up but the line protocol is down, it periodically resets the interface in an effort to restart it. Interface resets can also occur when an interface is looped back or shut down. |
|
restarts |
Gives the number of times that the controller was restarted because of errors. |
|
alarm indications, remote alarms, rx LOF, rx LOS |
Gives the number of CSU/DSU alarms, and the number of occurrences of receive loss of frame and receive loss of signal. |
|
BER inactive, NELR inactive, FELR inactive |
Shows the status of G.703-E1 counters for bit error rate (BER) alarm, near-end loop remote (NELR), and far-end loop remote (FELR). Note that you cannot set the NELR or FELR. |
Troubleshooting T1 Problems
This section describes the techniques and procedures to troubleshoot T1 circuits for dial-in customers.
Troubleshooting Using the show controller t1 Command
The show controller t1 exec command provides information to logically troubleshoot physical layer and data link layer problems. This section describes how to logically troubleshoot using the show controller t1 command.
This command displays the controller status that is specific to the controller hardware. The information displayed is generally useful for diagnostic tasks performed by technical support personnel.
The NPM or MIP can query the port adapters to determine their current status. Issue a show controller t1 command to display statistics about the T1 link.
If you specify a slot and port number, statistics for each 15-minute period will be displayed.
Most T1 errors are caused by misconfigured lines. Ensure that linecoding, framing, and clock source are configured according to what the service provider recommends.
show controller t1 Conditions
The t1 controller can be in three states:
•![]() Administratively down
Administratively down
•![]() Down
Down
•![]() Up
Up
Is the Controller Administratively Down?
The controller is administratively down when it has been manually shut down. You should restart the controller to correct this error.
Step 1 ![]() Enter enable mode.
Enter enable mode.
Step 2 ![]() Enter global configuration mode.
Enter global configuration mode.
maui-nas-03#configure terminal
Enter configuration commands, one per line. End with CNTL/Z.
Step 3 ![]() Enter controller configuration mode.
Enter controller configuration mode.
maui-nas-03(config)#controller t1 0
maui-nas-03(config-controlle)#
Step 4 ![]() Restart the controller.
Restart the controller.
maui-nas-03(config-controlle)#shutdown
maui-nas-03(config-controlle)#no shutdown
Is the Line Up?
If the T1 controller and line are not up, check to see if you are seeing one of the following messages in the show controller t1 exec output:
Receiver has loss of frame.
or
Receiver has loss of signal.
If Receiver Has Loss of Frame
Step 1 ![]() Check to see whether the framing format configured on the port matches the framing format of the line. You can check the framing format of the controller from the running configuration or the show controller t1 command output.
Check to see whether the framing format configured on the port matches the framing format of the line. You can check the framing format of the controller from the running configuration or the show controller t1 command output.
To change the framing format, use the framing {SF | ESF} command in the controller configuration mode, as shown here:
maui-nas-03#configure terminal
Enter configuration commands, one per line. End with CNTL/Z.
maui-nas-03(config)#controller t1 0
maui-nas-03(config-controlle)#framing esf
Step 2 ![]() Try the other framing format to see if the alarm clears.
Try the other framing format to see if the alarm clears.
Step 3 ![]() Change the line build out setting using the cablelength {long | short} command.
Change the line build out setting using the cablelength {long | short} command.
Line build out (LBO) compensates for the loss in decibels based on the distance from the device to the first repeater in the circuit. A longer distance from the device to the repeater requires that the signal strength on the circuit be boosted to compensate for loss over that distance.
To configure transmit and receive levels for a cable length (line build out) longer than 655 feet for a T1 trunk with a channel service unit (CSU) interface, use the cablelength long controller configuration command. To configure transmit attenuation for a cable length (line build out) of 655 feet or shorter for a T1 trunk with a DSX-1 interface, use the cablelength short controller configuration command.
Consult your service provider and the Cisco IOS command reference for details on buildout settings.
If this does not fix the problem, proceed to the next section.
If Receiver Has Loss of Signal
Step 1 ![]() Make sure that the cable between the interface port and the T1 service provider’s equipment or T1 terminal equipment is connected correctly. Check to see if the cable is hooked up to the correct ports. Correct the cable connections, if necessary.
Make sure that the cable between the interface port and the T1 service provider’s equipment or T1 terminal equipment is connected correctly. Check to see if the cable is hooked up to the correct ports. Correct the cable connections, if necessary.
Step 2 ![]() Check cable integrity. Look for breaks or other physical abnormalities in the cable. Ensure that the pinouts are set correctly. If necessary, replace the cable.
Check cable integrity. Look for breaks or other physical abnormalities in the cable. Ensure that the pinouts are set correctly. If necessary, replace the cable.
Step 3 ![]() Check the cable connectors. A reversal of the transmit and receive pairs or an open receive pair can cause errors. Set the receive pair to lines 1 and 2; the transmit pair should be lines 4 and 5.
Check the cable connectors. A reversal of the transmit and receive pairs or an open receive pair can cause errors. Set the receive pair to lines 1 and 2; the transmit pair should be lines 4 and 5.
The pins on an RJ-48 jack are numbered from 1 through 8. Pin 1 is the leftmost pin when looking at the jack with the metal pins facing you. Refer to Figure 15-11.
Figure 15-11 RJ-45 Cable

Step 4 ![]() Try using a rollover cable.
Try using a rollover cable.
Run the show controller t1 exec command after each step to see whether the controller exhibits any errors.
If the Line Is in Loopback Mode
Check to see whether the line is in loopback mode from the show controller t1 output. A line should be in loopback mode only for testing purposes.
To turn off loopback, use the no loopback command in the controller configuration mode, as shown here:
maui-nas-03(config-controlle)#no loopback
If the Controller Displays Any Alarms
Check the show controller command output to see if there are alarms displayed by the controller.
We will now discuss various alarms and the procedure necessary to correct them.
Receive (RX) Alarm Indication Signal (AIS) (Blue)
A received alarm indication signal (AIS) means that an alarm is occurring on the line upstream of the equipment connected to the port. The AIS failure is declared when an AIS defect is detected at the input and still exists after the loss of frame failure is declared (caused by the unframed nature of the «all-ones» signal). The AIS failure is cleared when the loss of frame failure is cleared.
Step 1 ![]() Check to see whether the framing format configured on the port matches the framing format of the line. If not, change the framing format on the controller to match that of the line.
Check to see whether the framing format configured on the port matches the framing format of the line. If not, change the framing format on the controller to match that of the line.
Step 2 ![]() Contact your service provider to check for misconfiguration within the telco.
Contact your service provider to check for misconfiguration within the telco.
Receive (Rx) Remote Alarm Indication (Yellow)
A received remote alarm indication means that the far-end equipment has a problem with the signal that it is receiving from its upstream equipment.
For SF links, the far-end alarm failure is declared when bit 6 of all the channels has been zero for at least 335 ms. The failure is cleared when bit 6 of at least one channel is not zero for a period usually less than 1 second and always less than 5 seconds. The far-end alarm failure is not declared for SF links when a loss of signal is detected.
For ESF links, the far-end alarm failure is declared if the yellow alarm signal pattern occurs in at least seven out of ten contiguous 16-bit pattern intervals. The failure is cleared if the yellow alarm signal pattern does not occur in ten contiguous 16-bit signal pattern intervals.
Step 1 ![]() Insert an external loopback cable into the port. To create a loopback plug, refer to the section «Performing Hardware Loopback Plug Test,» later in this chapter.
Insert an external loopback cable into the port. To create a loopback plug, refer to the section «Performing Hardware Loopback Plug Test,» later in this chapter.
Step 2 ![]() Check to see if there are any alarms. If you do not see any alarms, then the local hardware is probably in good condition. In that case, do the following:
Check to see if there are any alarms. If you do not see any alarms, then the local hardware is probably in good condition. In that case, do the following:
•![]() Check the cabling. Refer to the section «If Receiver Has Loss of Signal» for more information.
Check the cabling. Refer to the section «If Receiver Has Loss of Signal» for more information.
•![]() Check the settings at the remote end, and verify that they match your port settings.
Check the settings at the remote end, and verify that they match your port settings.
•![]() If the problem persists, contact your service provider.
If the problem persists, contact your service provider.
Step 3 ![]() Remove the loopback plug, and reconnect your T1 line
Remove the loopback plug, and reconnect your T1 line
Step 4 ![]() Check the cabling. Refer to the section «Loss of Signal» for more information.
Check the cabling. Refer to the section «Loss of Signal» for more information.
Step 5 ![]() Power-cycle the router.
Power-cycle the router.
Step 6 ![]() Connect the T1 line to a different port. Configure the port with the same settings as that of the line. If the problem does not persist, then the fault lies with the one port:
Connect the T1 line to a different port. Configure the port with the same settings as that of the line. If the problem does not persist, then the fault lies with the one port:
•![]() Reconnect the T1 line to the original port.
Reconnect the T1 line to the original port.
•![]() Proceed to the «Troubleshooting Error Events» section, later in this chapter.
Proceed to the «Troubleshooting Error Events» section, later in this chapter.
If the problem persists, then do the following:
•![]() Perform a hardware loop test, as described in the section «Performing Hardware Loopback Plug Test.»
Perform a hardware loop test, as described in the section «Performing Hardware Loopback Plug Test.»
•![]() Replace the T1 controller card.
Replace the T1 controller card.
•![]() Proceed to «Troubleshooting Error Events,» the next section.
Proceed to «Troubleshooting Error Events,» the next section.
Transmitter Sending Remote Alarm (Red)
A red alarm is declared when the CSU cannot synchronize with the framing pattern on the T1 line.
Step 1 ![]() Check to see whether the framing format configured on the port matches the framing format of the line. If not, change the framing format on the controller to match that of the line.
Check to see whether the framing format configured on the port matches the framing format of the line. If not, change the framing format on the controller to match that of the line.
Step 2 ![]() Check the settings at the remote end, and verify that they match your port settings.
Check the settings at the remote end, and verify that they match your port settings.
Step 3 ![]() Contact your service provider.
Contact your service provider.
Transmit (Tx) Remote Alarm Indication (Yellow)
A transmitted remote alarm indication at the interface indicates that the interface has a problem with the signal it is receiving from the far-end equipment.
Step 1 ![]() Check the settings at the remote end, and verify that they match your port settings.
Check the settings at the remote end, and verify that they match your port settings.
Step 2 ![]() A Tx RAI should be accompanied by some other alarm that indicates the nature of the problem that the T1 port/card is having with the signal from the far-end equipment.
A Tx RAI should be accompanied by some other alarm that indicates the nature of the problem that the T1 port/card is having with the signal from the far-end equipment.
Troubleshoot that condition to resolve the Tx RAI.
Transmit (Tx) AIS (Blue)
Step 1 ![]() Check to see whether the framing format configured on the port matches the framing format of the line. If not, correct the mismatch.
Check to see whether the framing format configured on the port matches the framing format of the line. If not, correct the mismatch.
Step 2 ![]() Power-cycle the router.
Power-cycle the router.
Step 3 ![]() Connect the T1 line to a different port. Configure the port with the same settings as that of the line.
Connect the T1 line to a different port. Configure the port with the same settings as that of the line.
If the problem persists, then do the following:
•![]() Perform a hardware loop test, as described in the section «Performing a Hardware Loop Test.»
Perform a hardware loop test, as described in the section «Performing a Hardware Loop Test.»
•![]() Replace the T1 controller card.
Replace the T1 controller card.
•![]() Proceed to the «Troubleshooting Error Events» section, next.
Proceed to the «Troubleshooting Error Events» section, next.
Troubleshooting Error Events
The show controller t1 exec command provides error messages that can be used to troubleshoot problems. We will now discuss several error messages and how to correct the errors.
To see whether the error counters are increasing, execute the show controller t1 command repeatedly. Note the values of the counters for the current interval.
Consult your service provider for framing and linecoding settings. A good rule of thumb is to use B8ZS linecoding with ESF framing and AMI linecoding with SF framing.
Slip Secs Counter Is Increasing
The presence of slips on a T1 line indicates a clocking problem. The T1 provider (telco) will provide the clocking that the customer premises equipment (CPE) will need to synchronize to.
Step 1 ![]() Verify that the clock source is derived from the network. This can be ascertained by looking for «Clock Source Is Line Primary.»
Verify that the clock source is derived from the network. This can be ascertained by looking for «Clock Source Is Line Primary.»
Note: If there are multiple T1s into an access server, only one can be the primary, while the other T1s derive the clock from the primary. In that case, verify that the T1 line designated as the primary clock source is configured correctly.
Step 2 ![]() Set the T1 clock source correctly from the controller configuration mode.
Set the T1 clock source correctly from the controller configuration mode.
maui-nas-03(config-controlle)#clock source line primary
Framing Loss Seconds Counter Is Increasing
Step 1 ![]() Check to see whether the framing format configured on the port matches the framing format of the line. You can check this by looking for «Framing is {ESF|SF}» in the show controller t1 output.
Check to see whether the framing format configured on the port matches the framing format of the line. You can check this by looking for «Framing is {ESF|SF}» in the show controller t1 output.
Step 2 ![]() To change the framing format, use the framing {SF | ESF} command in the controller configuration mode, as shown here:
To change the framing format, use the framing {SF | ESF} command in the controller configuration mode, as shown here:
maui-nas-03(config-controlle)#framing esf
Step 3 ![]() Change the line build out using the cablelength {long | short} command.
Change the line build out using the cablelength {long | short} command.
Consult your service provider and the Cisco IOS command reference for details on buildout settings.
Line Code Violations Are Increasing
Step 1 ![]() Check to see whether the linecoding configured on the port matches the framing format of the line. You can check this by looking for «Line Code is {B8ZS|AMI}» in the show controller t1 output.
Check to see whether the linecoding configured on the port matches the framing format of the line. You can check this by looking for «Line Code is {B8ZS|AMI}» in the show controller t1 output.
Step 2 ![]() To change the linecoding, use the linecode {ami | b8zs} command in the controller configuration mode, as shown here:
To change the linecoding, use the linecode {ami | b8zs} command in the controller configuration mode, as shown here:
maui-nas-03(config-controlle)#linecode b8zs
Step 3 ![]() Change the line build out using the cablelength {long | short} command.
Change the line build out using the cablelength {long | short} command.
Consult your service provider and the Cisco IOS command reference for details on buildout settings.
Verify that isdn switchtype and pri-group Are Configured Correctly
Use the show running-config command to check if isdn switchtype and pri-group timeslots are configured correctly. Contact your service provider for correct values.
To change the isdn switchtype and pri-group, enter these lines:
maui-nas-03#configure terminal
maui-nas-03(config)#isdn switch-type primary-5ess
maui-nas-03(config)#controller t1 0
maui-nas-03(config-controlle)#pri-group timeslots 1-24
Verifying the Signaling Channel
If the error counters do not increase but the problem persists, verify that the signaling channel is up and configured correctly.
Step 1 ![]() Run the show interface serial x:23 command, where x should be replaced by the interface number.
Run the show interface serial x:23 command, where x should be replaced by the interface number.
Step 2 ![]() Check to see if the interface is up. If the interface is not up, use the no shutdown command to bring the interface up.
Check to see if the interface is up. If the interface is not up, use the no shutdown command to bring the interface up.
maui-nas-03#config terminal
Enter configuration commands, one per line. End with CNTL/Z.
maui-nas-03(config)#interface serial 0:23
maui-nas-03(config-if)#no shutdown
Step 3 ![]() Ensure that encapsulation is PPP. If the interface is not using PPP, then use the encapsulation ppp command in the interface configuration mode to correct it.
Ensure that encapsulation is PPP. If the interface is not using PPP, then use the encapsulation ppp command in the interface configuration mode to correct it.
maui-nas-03(config-if)#encapsulation ppp
Step 4 ![]() Check to see whether loopback is set. Loopback should be set only for testing purposes. Use the no loopback command to remove loopbacks.
Check to see whether loopback is set. Loopback should be set only for testing purposes. Use the no loopback command to remove loopbacks.
maui-nas-03(config-if)#no loopback
Step 5 ![]() Power-cycle the router.
Power-cycle the router.
Step 6 ![]() If the problem persists, contact your service provider or Cisco TAC.
If the problem persists, contact your service provider or Cisco TAC.
Troubleshooting a PRI
Whenever troubleshooting a PRI, you need to check whether the T1 is running cleanly on both ends. If Layer 1 problems have been resolved, as described previously, we must look to Layer 2 and 3 problems.
Troubleshooting Using the show isdn status Command
The show isdn status command is used to display a snapshot of all ISDN interfaces. It displays the status of Layers 1, 2, and 3.
Step 1 ![]() Verify that Layer 1 is active.
Verify that Layer 1 is active.
The Layer 1 status should always say ACTIVE unless the T1 is down.
If show isdn status indicates that Layer 1 is DEACTIVATED, then there is a problem with the physical connectivity on the T1 line. Refer to the previous section «Is the Controller Administratively Down?»
Also verify that the T1 is not administratively down. Use the no shutdown command to bring up the T1 controller.
Step 2 ![]() Check whether Layer 2 state is MULTIPLE_FRAME_ESTABLISHED.
Check whether Layer 2 state is MULTIPLE_FRAME_ESTABLISHED.
The desired Layer 2 State is MULTIPLE_FRAME_ESTABLISHED, which indicates that we are exchanging Layer 2 frames and have finished Layer 2 initialization.
If Layer 2 is not MULTIPLE_FRAME_ESTABLISHED, use the show controller t1 exec command to diagnose the problem. Refer to the section «Troubleshooting Using the show controller t1 Command.»
Because show isdn status is a snapshot of the current status, it is possible that Layer 2 is bouncing up and down despite indicating MULTIPLE_FRAME_ESTABLISHED. Use debug isdn q921 to verify that Layer 2 is stable.
Using debug q921
The debug isdn q921 command displays data link layer (Layer 2) access procedures that are taking place at the router on the D-channel.
Ensure that you are configured to view debug messages by using the logging console or terminal monitor command as necessary.
Note ![]() In a production environment, verify that console logging is disabled. Enter the show logging command. If logging is enabled, the access server might intermittently freeze up as soon as the console port gets overloaded with log messages. Enter the no logging console command.
In a production environment, verify that console logging is disabled. Enter the show logging command. If logging is enabled, the access server might intermittently freeze up as soon as the console port gets overloaded with log messages. Enter the no logging console command.
Note ![]() If debug isdn q921 is turned on and you do not receive any debug outputs, place a call or reset the controller to get debug outputs.
If debug isdn q921 is turned on and you do not receive any debug outputs, place a call or reset the controller to get debug outputs.
Step 1 ![]() Verify that Layer 2 is stable. You should observe the debug outputs for messages indicating that the service is not bouncing up and down. If you see the following types of debug outputs, the line is not stable:
Verify that Layer 2 is stable. You should observe the debug outputs for messages indicating that the service is not bouncing up and down. If you see the following types of debug outputs, the line is not stable:
Mar 20 10:06:07.882: %ISDN-6-LAYER2DOWN: Layer 2 for Interface Se0:23, TEI 0 changed
to down
Mar 20 10:06:09.882: %LINK-3-UPDOWN: Interface Serial0:23, changed state to down
Mar 20 10:06:21.274: %DSX1-6-CLOCK_CHANGE: Controller 0  clock is now selected as
clock source
Mar 20 10:06:21.702: %ISDN-6-LAYER2UP: Layer 2 for Interface Se0:23, TEI 0 changed to
up
Mar 20 10:06:22.494: %CONTROLLER-5-UPDOWN: Controller T1 0, changed state to up
Mar 20 10:06:24.494: %LINK-3-UPDOWN: Interface Serial0:23, changed state to up
If Layer 2 does not appear to be stable, refer to the section «Troubleshooting Error Events.»
Step 2 ![]() Verify that you are seeing only SAPI messages in both transmit (TX) and receive (RX) sides.
Verify that you are seeing only SAPI messages in both transmit (TX) and receive (RX) sides.
Mar 20 10:06:52.505: ISDN Se0:23: TX -> RRf sapi = 0 tei = 0 nr = 0
Mar 20 10:06:52.505: ISDN Se0:23: RX <- RRf sapi = 0 tei = 0 nr = 0
Mar 20 10:07:22.505: ISDN Se0:23: TX -> RRp sapi = 0 tei = 0 nr = 0
Mar 20 10:07:22.509: ISDN Se0:23: RX <- RRp sapi = 0 tei = 0 nr = 0
Mar 20 10:07:22.509: ISDN Se0:23: TX -> RRf sapi = 0 tei = 0 nr = 0
Mar 20 10:07:22.509: ISDN Se0:23: RX <- RRf sapi = 0 tei = 0 nr = 0
Step 3 ![]() Verify that you are not seeing SABME messages, which indicates that Layer 2 is trying to reinitialize. This is usually seen when we are transmitting poll requests (RRp) and not getting a response from the switch (RRf), or vice versa. The following are example of SABME messages:
Verify that you are not seeing SABME messages, which indicates that Layer 2 is trying to reinitialize. This is usually seen when we are transmitting poll requests (RRp) and not getting a response from the switch (RRf), or vice versa. The following are example of SABME messages:
Mar 20 10:06:21.702: ISDN Se0:23: RX <- SABMEp sapi = 0 tei = 0
Mar 20 10:06:22.494: ISDN Se0:23: TX -> SABMEp sapi = 0 tei = 0
If you are seeing SABME messages, do the following:
•![]() Use the show running-config command to check whether isdn switchtype and pri-group timeslots are configured correctly. Contact your service provider for correct values.
Use the show running-config command to check whether isdn switchtype and pri-group timeslots are configured correctly. Contact your service provider for correct values.
•![]() To change the isdn switchtype and pri-group, enter these lines:
To change the isdn switchtype and pri-group, enter these lines:
maui-nas-03#configure terminal
maui-nas-03(config)#isdn switch-type primary-5ess
maui-nas-03(config)#controller t1 0
maui-nas-03(config-controlle)#pri-group timeslots 1-24
Step 4 ![]() Verify that the D-channel is up using the show interfaces serial x:23 command.
Verify that the D-channel is up using the show interfaces serial x:23 command.
If the D-channel is not up, then use no shutdown command to bring it up:
maui-nas-03(config)#interface serial 0:23
maui-nas-03(config-if)#no shutdown
Step 5 ![]() Check to see whether encapsulation is PPP. If not, use the encapsulation ppp command to set encapsulation.
Check to see whether encapsulation is PPP. If not, use the encapsulation ppp command to set encapsulation.
maui-nas-03(config-if)#encapsulation ppp
Step 6 ![]() Check to see whether the interface is in loopback mode. For normal operation, the interface should not be in loopback mode.
Check to see whether the interface is in loopback mode. For normal operation, the interface should not be in loopback mode.
maui-nas-03(config-if)#no loopback
Step 7 ![]() Power-cycle the router.
Power-cycle the router.
Step 8 ![]() If the problem persists, contact your service provider or Cisco TAC.
If the problem persists, contact your service provider or Cisco TAC.
Performing Hardware Loopback Plug Test
The hardware loopback plug test can be used to test whether the router has any faults. If a router passes a hardware loopback plug test, then the problem exists elsewhere on the line.
To create a loopback plug, follow these steps:
Step 1 ![]() Use wire cutters to cut a working RJ-45 or RJ-48 cable so that there are 5 inches of cable and the connector attached to it.
Use wire cutters to cut a working RJ-45 or RJ-48 cable so that there are 5 inches of cable and the connector attached to it.
Step 2 ![]() Strip the wires.
Strip the wires.
Step 3 ![]() Twist the wires from pins 1 and 4 together.
Twist the wires from pins 1 and 4 together.
Step 4 ![]() Twist the wires from pins 2 and 5 together.
Twist the wires from pins 2 and 5 together.
Leave the rest of the wires alone.
The pins on an RJ-45/48 jack are numbered from 1 through 8. Pin 1 is the left-most pin when looking at the jack with the metal pins facing you.
Performing the Loopback Plug Test
Step 1 ![]() Insert the plug into the T1 port in question.
Insert the plug into the T1 port in question.
Step 2 ![]() Save your router configuration using the write memory command.
Save your router configuration using the write memory command.
Building configuration...
Step 3 ![]() Set the encapsulation to HDLC.
Set the encapsulation to HDLC.
maui-nas-03#config terminal
Enter configuration commands, one per line. End with CNTL/Z.
maui-nas-03(config)#interface serial 0
maui-nas-03(config-if)#enc
maui-nas-03(config-if)#encapsulation HDLC
maui-nas-03(config-if)#^Z
Step 4 ![]() Use the show running-config command to check whether the interface has an IP address.
Use the show running-config command to check whether the interface has an IP address.
If the interface does not have an IP address, obtain a unique address and assign it to the interface with a subnet mask of 255.255.255.0
maui-nas-03(config)#ip address 172.22.53.1 255.255.255.0
Step 5 ![]() Clear the interface counters using the clear counters command.
Clear the interface counters using the clear counters command.
maui-nas-03#clear counters
Clear "show interface" counters on all interfaces [confirm]
Step 6 ![]() Perform the extended ping test as described in the «Using Extended ping Tests» section, earlier in this chapter.
Perform the extended ping test as described in the «Using Extended ping Tests» section, earlier in this chapter.
Troubleshooting E1 Problems
This section describes the techniques and procedures to troubleshoot E1 circuits for dial-in customers.
Troubleshooting Using the show controller e1 Command
The show e1 controller exec command provides information to logically troubleshoot physical layer and data link layer problems. This section describes how to logically troubleshoot using the show controller e1 command.
This command displays the controller status that is specific to the controller hardware. The information displayed is generally useful for diagnostic tasks performed by technical support personnel only.
The NPM or MIP can query the port adapters to determine their current status. Issue a show controller e1 command to display statistics about the E1 link.
If you specify a slot and port number, statistics for each 15-minute period will be displayed.
Most E1 errors are caused by misconfigured lines. Ensure that linecoding, framing, clock source, and line termination (balanced or unbalanced) are configured according to what the service provider recommended.
Show controller e1 Conditions
The E1 controller can be in three states:
•![]() Administratively down
Administratively down
•![]() Down
Down
•![]() Up
Up
Is the Controller Administratively Down?
The controller is administratively down when it has been manually shut down. You should restart the controller to correct this error.
Step 1 ![]() Enter enable mode.
Enter enable mode.
Step 2 ![]() Enter global configuration mode.
Enter global configuration mode.
maui-nas-03#configure terminal
Enter configuration commands, one per line. End with CNTL/Z.
Step 3 ![]() Enter controller configuration mode.
Enter controller configuration mode.
maui-nas-03(config)#controller e1 0
maui-nas-03(config-controlle)#
Step 4 ![]() Restart the controller.
Restart the controller.
maui-nas-03(config-controlle)#shutdown
maui-nas-03(config-controlle)#no shutdown
Is the Line Up?
If the E1 line is not up, check to see that the line configuration is correct and matches the settings of the remote end.
Check the framing of the line and the remote end. For E1 lines, the framing is either CRC4 or noCRC4.
Check the linecoding of the line and the remote end. The linecoding is either AMI or HDB3.
Check whether the line termination is set for balanced or unbalanced (75 ohm or 120 ohm).
Consult your service provider for more information regarding the correct settings. Make any changes as necessary to both local or remote end devices.
If the E1 controller and line are not up, check to see whether you are seeing one of the following messages in the show controller e1 exec output:
Receiver has loss of frame.
or
Receiver has loss of signal.
If Receiver Has Loss of Frame
Step 1 ![]() Check to see whether the framing format configured on the port matches the framing format of the line. You can check the framing format of the controller from the running configuration or the show controller e1 command output.
Check to see whether the framing format configured on the port matches the framing format of the line. You can check the framing format of the controller from the running configuration or the show controller e1 command output.
To change the framing format, use the framing {CRC4 | no CRC4} command in the controller configuration mode, as shown here:
maui-nas-03#configure terminal
Enter configuration commands, one per line. End with CNTL/Z.
maui-nas-03(config)#controller E1 0
maui-nas-03(config-controlle)#framing CRC4
Step 2 ![]() Try the other framing format to see if the alarm clears.
Try the other framing format to see if the alarm clears.
If this does not fix the problem, proceed to the receiver has loss of signal section below.
Step 3 ![]() Check the framing format on the remote end.
Check the framing format on the remote end.
Step 4 ![]() Check the linecoding on the remote end.
Check the linecoding on the remote end.
If Receiver Has Loss of Signal
Step 1 ![]() Make sure that the cable between the interface port and the E1 service provider’s equipment or E1 terminal equipment is connected correctly. Check to see whether the cable is hooked up to the correct ports. Correct the cable connections if necessary.
Make sure that the cable between the interface port and the E1 service provider’s equipment or E1 terminal equipment is connected correctly. Check to see whether the cable is hooked up to the correct ports. Correct the cable connections if necessary.
Step 2 ![]() Check cable integrity. Look for breaks or other physical abnormalities in the cable. Ensure that the pinouts are set correctly. If necessary, replace the cable.
Check cable integrity. Look for breaks or other physical abnormalities in the cable. Ensure that the pinouts are set correctly. If necessary, replace the cable.
Step 3 ![]() Check the cable connectors. A reversal of the transmit and receive pairs or an open receive pair can cause errors. Set the receive pair to lines 1 and 2; the transmit pair should be lines 4 and 5.
Check the cable connectors. A reversal of the transmit and receive pairs or an open receive pair can cause errors. Set the receive pair to lines 1 and 2; the transmit pair should be lines 4 and 5.
The pins on a RJ-48 jack are numbered from 1 through 8. Pin 1 is the leftmost pin when looking at the jack with the metal pins facing you. Refer to Figure 15-12 for more information.
Figure 15-12 RJ-45 Cable

Step 4 ![]() Try using a rollover cable.
Try using a rollover cable.
Step 5 ![]() Check to see whether there are far-end block errors. If so, the problem exists with the receive lead on the local end. Contact TAC for more assistance.
Check to see whether there are far-end block errors. If so, the problem exists with the receive lead on the local end. Contact TAC for more assistance.
Run the show controller e1 exec command after each step to check whether the controller exhibits any errors.
If the Line Is in Loopback Mode
Check to see whether the line is in loopback mode from the show controller e1 output. A line should be in loopback mode only for testing purposes.
To turn off loopback, use the no loopback command in the controller configuration mode, as shown here:
maui-nas-03(config-controlle)#no loopback
If the Controller Displays Any Alarms
Check the show controller command output to see whether any alarms are displayed by the controller.
We will now discuss various alarms and the procedure necessary to correct them.
Receiver (Rx) Has Remote Alarm
A received remote alarm means that an alarm is occurring on the line upstream of the equipment connected to the port.
Step 1 ![]() Check to see whether the framing format configured on the port matches the framing format of the line. If not, change the framing format on the controller to match that of the line.
Check to see whether the framing format configured on the port matches the framing format of the line. If not, change the framing format on the controller to match that of the line.
Step 2 ![]() Check the linecoding setting on the remote-end equipment. Contact your service provider for the correct settings. Correct any misconfigurations, as necessary.
Check the linecoding setting on the remote-end equipment. Contact your service provider for the correct settings. Correct any misconfigurations, as necessary.
Step 3 ![]() Insert an external loopback cable into the port. To create a loopback plug, refer to the section «Performing Hardware Loopback Plug Test,» earlier in the chapter.
Insert an external loopback cable into the port. To create a loopback plug, refer to the section «Performing Hardware Loopback Plug Test,» earlier in the chapter.
Step 4 ![]() Check to see whether there are any alarms. If you do not see any alarms, then the local hardware is probably in good condition. In that case, do the following:
Check to see whether there are any alarms. If you do not see any alarms, then the local hardware is probably in good condition. In that case, do the following:
•![]() Check the cabling. Refer to the section «Loss of Signal» for more information.
Check the cabling. Refer to the section «Loss of Signal» for more information.
•![]() Check the settings at the remote end, and verify that they match your port settings.
Check the settings at the remote end, and verify that they match your port settings.
•![]() If the problem persists, contact your service provider.
If the problem persists, contact your service provider.
Step 5 ![]() Remove the loopback plug and reconnect your E1 line.
Remove the loopback plug and reconnect your E1 line.
Step 6 ![]() Check the cabling. Refer to the section «Loss of Signal» for more information.
Check the cabling. Refer to the section «Loss of Signal» for more information.
Step 7 ![]() Power-cycle the router.
Power-cycle the router.
Step 8 ![]() Connect the E1 line to a different port. Configure the port with the same settings as that of the line. If the problem does not persist, then the fault lies with the port:
Connect the E1 line to a different port. Configure the port with the same settings as that of the line. If the problem does not persist, then the fault lies with the port:
•![]() Reconnect the E1 line to the original port.
Reconnect the E1 line to the original port.
•![]() Proceed to the «Troubleshooting E1 Error Events» section.
Proceed to the «Troubleshooting E1 Error Events» section.
If the problem persists, then do the following:
•![]() Perform a hardware loop test, as described in the section «Performing a Hardware Loop Test,»
Perform a hardware loop test, as described in the section «Performing a Hardware Loop Test,»
•![]() Replace the E1 controller card.
Replace the E1 controller card.
•![]() Proceed to the «Troubleshooting E1 Error Events» section.
Proceed to the «Troubleshooting E1 Error Events» section.
Transmitter Sending Remote Alarm (Red)
A red alarm is declared when the CSU cannot synchronize with the framing pattern on the E1 line.
Step 1 ![]() Check to see whether the framing format configured on the port matches the framing format of the line. If not, change the framing format on the controller to match that of the line.
Check to see whether the framing format configured on the port matches the framing format of the line. If not, change the framing format on the controller to match that of the line.
Step 2 ![]() Check the settings at the remote end, and verify that they match your port settings.
Check the settings at the remote end, and verify that they match your port settings.
Step 3 ![]() Insert an external loopback cable into the port. To create a loopback plug, refer to the section «Performing Hardware Loopback Plug Test,» earlier in the chapter.
Insert an external loopback cable into the port. To create a loopback plug, refer to the section «Performing Hardware Loopback Plug Test,» earlier in the chapter.
Step 4 ![]() Check to see whether there are any alarms. If you do not see any alarms, then the local hardware is probably in good condition. In that case, do the following:
Check to see whether there are any alarms. If you do not see any alarms, then the local hardware is probably in good condition. In that case, do the following:
•![]() Check the cabling. Refer to the section «Loss of Signal» for more information.
Check the cabling. Refer to the section «Loss of Signal» for more information.
•![]() If the problem persists, contact your service provider.
If the problem persists, contact your service provider.
Step 5 ![]() Connect the E1 line to a different port. Configure the port with the same settings as that of the line. If the problem does not persist, then the fault lies with the port:
Connect the E1 line to a different port. Configure the port with the same settings as that of the line. If the problem does not persist, then the fault lies with the port:
•![]() Reconnect the E1 line to the original port.
Reconnect the E1 line to the original port.
•![]() Proceed to the «Troubleshooting E1 Error Events» section.
Proceed to the «Troubleshooting E1 Error Events» section.
If the problem persists, then do the following:
•![]() Perform a hardware loop test, as described in the section «Performing a Hardware Loop Test.»
Perform a hardware loop test, as described in the section «Performing a Hardware Loop Test.»
•![]() Replace the E1 controller card.
Replace the E1 controller card.
•![]() Proceed to the «Troubleshooting E1 Error Events» section.
Proceed to the «Troubleshooting E1 Error Events» section.
•![]() Contact your service provider.
Contact your service provider.
Troubleshooting E1 Error Events
The show controller e1 exec command provides error messages that can be used to troubleshoot problems. We will now discuss several error messages and how to correct the errors.
To see whether the error counters are increasing, execute the show controller e1 command repeatedly. Note the values of the counters for the current interval.
Consult your service provider for framing and linecoding settings.
Slip Secs Counter Is Increasing
The presence of slips on E1 lines indicates a clocking problem. The E1 provider (telco) will provide the clocking that the customer premises equipment (CPE) will need to synchronize to.
Step 1 ![]() Verify that the clock source is derived from the network. This can be ascertained by looking for «Clock Source is Line Primary.»
Verify that the clock source is derived from the network. This can be ascertained by looking for «Clock Source is Line Primary.»
Note ![]() If there are multiple E1s into an access server, only one can be the primary, while the other E1s derive the clock from the primary. In that case, verify that the E1 line designated as the primary clock source is configured correctly.
If there are multiple E1s into an access server, only one can be the primary, while the other E1s derive the clock from the primary. In that case, verify that the E1 line designated as the primary clock source is configured correctly.
Step 2 ![]() Set the E1 clock source correctly from the controller configuration mode.
Set the E1 clock source correctly from the controller configuration mode.
maui-nas-03(config-controlle)#clock source line primary
Framing Loss Seconds Counter Is Increasing
Step 1 ![]() Check to see whether the framing format configured on the port matches the framing format of the line. You can check this by looking for «Framing is {CRC4|no CRC4}» in the show controller e1 output.
Check to see whether the framing format configured on the port matches the framing format of the line. You can check this by looking for «Framing is {CRC4|no CRC4}» in the show controller e1 output.
Step 2 ![]() To change the framing format, use the framing {CRC4 | no CRC4} command in the controller configuration mode, as shown here:
To change the framing format, use the framing {CRC4 | no CRC4} command in the controller configuration mode, as shown here:
maui-nas-03(config-controlle)#framing crc4
Line Code Violations Are Increasing
Step 1 ![]() Check to see whether the linecoding configured on the port matches the framing format of the line. You can check this by looking for «Line Code is {AMI/HDB3}» in the show controller e1 output.
Check to see whether the linecoding configured on the port matches the framing format of the line. You can check this by looking for «Line Code is {AMI/HDB3}» in the show controller e1 output.
Step 2 ![]() To change the linecoding, use the linecode {ami | hdb3} command in the controller configuration mode, as shown here:
To change the linecoding, use the linecode {ami | hdb3} command in the controller configuration mode, as shown here:
maui-nas-03(config-controlle)#linecode ami
Verifying That isdn switchtype and pri-group Are Configured Correctly
Use the show running-config command to check whether isdn switchtype and pri-group timeslots are configured correctly. Contact your service provider for correct values.
To change the isdn switchtype and pri-group, use these lines:
maui-nas-03#configure terminal
maui-nas-03(config)#isdn switch-type primary-net5
maui-nas-03(config)#controller e1 0
maui-nas-03(config-controlle)#pri-group timeslots 1-31
Verifying the Signaling Channel
If the error counters do not increase but the problem persists, verify that the signaling channel is up and configured correctly.
Step 1 ![]() Run the show interface serial x:15 command, where x should be replaced by the interface number.
Run the show interface serial x:15 command, where x should be replaced by the interface number.
Step 2 ![]() Check to see whether the interface is up. If the interface is not up, use the no shutdown command to bring up the interface.
Check to see whether the interface is up. If the interface is not up, use the no shutdown command to bring up the interface.
maui-nas-03#config terminal
Enter configuration commands, one per line. End with CNTL/Z.
maui-nas-03(config)#interface serial 0:15
maui-nas-03(config-if)#no shutdown
Step 3 ![]() Ensure that encapsulation is PPP. If the interface is not using PPP, then use the encapsulation ppp command in the interface configuration mode to correct it.
Ensure that encapsulation is PPP. If the interface is not using PPP, then use the encapsulation ppp command in the interface configuration mode to correct it.
maui-nas-03(config-if)#encapsulation ppp
Step 4 ![]() Check to see whether loopback is set. Loopback should be set only for testing purposes. Use the no loopback command to remove loopbacks.
Check to see whether loopback is set. Loopback should be set only for testing purposes. Use the no loopback command to remove loopbacks.
maui-nas-03(config-if)#no loopback
Step 5 ![]() Power-cycle the router.
Power-cycle the router.
Step 6 ![]() If the problem persists, contact your service provider or Cisco TAC.
If the problem persists, contact your service provider or Cisco TAC.
Troubleshooting a PRI
Whenever troubleshooting a PRI, you need to check whether the E1 is running cleanly on both ends. If Layer 1 problems have been resolved, as described previously, we must look to Layer 2 and 3 problems.
Troubleshooting Using the show isdn status Command
The show isdn status command is used to display a snapshot of all ISDN interfaces. It displays the status of Layers 1, 2, and 3.
Step 1 ![]() Verify that Layer 1 is active.
Verify that Layer 1 is active.
The Layer 1 status should always say ACTIVE unless the E1 is down.
If show isdn status indicates that Layer 1 is DEACTIVATED, then there is a problem with the physical connectivity on the E1 line. Refer to the section «Is the Controller Administratively Down?»
Also verify that the E1 is not administratively down. Use the no shutdown command to bring up the E1 controller.
Step 2 ![]() Check whether Layer 2 state is MULTIPLE_FRAME_ESTABLISHED.
Check whether Layer 2 state is MULTIPLE_FRAME_ESTABLISHED.
The desired Layer 2 state is MULTIPLE_FRAME_ESTABLISHED, which indicates that the startup protocol between ISDN switch and end device has been established and that we are exchanging Layer 2 frames.
If Layer 2 is not MULTIPLE_FRAME_ESTABLISHED, use the show controller E1 exec command to diagnose the problem. Refer to the previous section «Troubleshooting Using the show controller e1 Command,» and the upcoming section «Troubleshooting E1 Error Events.»
Because show isdn status is a snapshot of the current status, it is possible that Layer 2 is bouncing up and down despite indicating Mulitple_Frame_Established. Use debug isdn q921 to verify that Layer 2 is stable.
Using debug q921
The debug isdn q921 command displays data link layer (Layer 2) access procedures that are taking place at the router on the D-channel.
Ensure that you are configured to view debug messages by using the logging console or terminal monitor commands, as necessary.
Note ![]() In a production environment, verify that console logging is disabled. Enter the show logging command. If logging is enabled, the access server might intermittently freeze up as soon as the console port gets overloaded with log messages. Enter the no logging console command.
In a production environment, verify that console logging is disabled. Enter the show logging command. If logging is enabled, the access server might intermittently freeze up as soon as the console port gets overloaded with log messages. Enter the no logging console command.
Note ![]() If debug isdn q921 is turned on and you do not receive any debug outputs, place a call or reset the controller to get debug outputs.
If debug isdn q921 is turned on and you do not receive any debug outputs, place a call or reset the controller to get debug outputs.
Step 1 ![]() Verify that Layer 2 is stable. You should observe the debug outputs for messages indicating that the service is not bouncing up and down. If you see the following types of debug outputs, the line is not stable:
Verify that Layer 2 is stable. You should observe the debug outputs for messages indicating that the service is not bouncing up and down. If you see the following types of debug outputs, the line is not stable:
Mar 20 10:06:07.882: %ISDN-6-LAYER2DOWN: Layer 2 for Interface Se0:15, TEI 0 changed
to down
Mar 20 10:06:09.882: %LINK-3-UPDOWN: Interface Serial0:15, changed state to down
Mar 20 10:06:21.274: %DSX1-6-CLOCK_CHANGE: Controller 0  clock is now selected as
clock source
Mar 20 10:06:21.702: %ISDN-6-LAYER2UP: Layer 2 for Interface Se0:15, TEI 0 changed to
up
Mar 20 10:06:22.494: %CONTROLLER-5-UPDOWN: Controller E1 0, changed state to up
Mar 20 10:06:24.494: %LINK-3-UPDOWN: Interface Serial0:15, changed state to up
If Layer 2 does not appear to be stable refer to the «Troubleshooting Error Events» section, earlier in this chapter.
Step 2 ![]() Verify that you are seeing only SAPI messages in both transmit (TX) and receive (RX) sides.
Verify that you are seeing only SAPI messages in both transmit (TX) and receive (RX) sides.
Mar 20 10:06:52.505: ISDN Se0:15: TX -> RRf sapi = 0 tei = 0 nr = 0
Mar 20 10:06:52.505: ISDN Se0:15: RX <- RRf sapi = 0 tei = 0 nr = 0
Mar 20 10:07:22.505: ISDN Se0:15: TX -> RRp sapi = 0 tei = 0 nr = 0
Mar 20 10:07:22.509: ISDN Se0:15: RX <- RRp sapi = 0 tei = 0 nr = 0
Mar 20 10:07:22.509: ISDN Se0:15: TX -> RRf sapi = 0 tei = 0 nr = 0
Mar 20 10:07:22.509: ISDN Se0:15: RX <- RRf sapi = 0 tei = 0 nr = 0
Step 3 ![]() Verify that you are not seeing SABME messages, which indicates that Layer 2 is trying to reinitialize. This is usually seen when we are transmitting poll requests (RRp) and not getting a response from the switch (RRf), or vice versa. The following are examples of SABME messages. We should get a response from ISDN switch for our SABME messages (UA frame received):
Verify that you are not seeing SABME messages, which indicates that Layer 2 is trying to reinitialize. This is usually seen when we are transmitting poll requests (RRp) and not getting a response from the switch (RRf), or vice versa. The following are examples of SABME messages. We should get a response from ISDN switch for our SABME messages (UA frame received):
Mar 20 10:06:21.702: ISDN Se0:15: RX <- SABMEp sapi = 0 tei = 0
Mar 20 10:06:22.494: ISDN Se0:15: TX -> SABMEp sapi = 0 tei = 0
If you are seeing SABME messages, do the following:
•![]() Use the show running-config command to check whether isdn switchtype and pri-group timeslots are configured correctly. Contact your service provider for correct values.
Use the show running-config command to check whether isdn switchtype and pri-group timeslots are configured correctly. Contact your service provider for correct values.
•![]() To change the isdn switchtype and pri-group, use these lines:
To change the isdn switchtype and pri-group, use these lines:
maui-nas-03#configure terminal
maui-nas-03(config)#isdn switch-type primary-net5
maui-nas-03(config)#controller e1 0
maui-nas-03(config-controlle)#pri-group timeslots 1-31
Step 4 ![]() Verify that the D-channel is up using the show interfaces serial x:15 command.
Verify that the D-channel is up using the show interfaces serial x:15 command.
If the D-channel is not up, then use no shutdown command to bring it up:
maui-nas-03(config)#interface serial 0:15
maui-nas-03(config-if)#no shutdown
Step 5 ![]() Check to see whether encapsulation is PPP. If not, use the encapsulation ppp command to set encapsulation.
Check to see whether encapsulation is PPP. If not, use the encapsulation ppp command to set encapsulation.
maui-nas-03(config-if)#encapsulation ppp
Step 6 ![]() Check to see whether the interface is in loopback mode. For normal operation, the interface should not be in loopback mode.
Check to see whether the interface is in loopback mode. For normal operation, the interface should not be in loopback mode.
maui-nas-03(config-if)#no loopback
Step 7 ![]() Power-cycle the router.
Power-cycle the router.
Step 8 ![]() If the problem persists, contact your service provider or Cisco TAC.
If the problem persists, contact your service provider or Cisco TAC.
I wonder what can cause that the first line output of the command «show interfaces» will be: «fastEthernet is up, line protocol is down».
Cisco ethernet interfaces are normally down / down if they don’t have a link. If you’re seeing up / down, the most likely causes are:
- Cable fault
- Speed mismatch (I personally haven’t seen a duplex mismatch bring an intf up / down)
- is cable that connected to the local interface, but not connected to the far end switch, will cause that situation?
If the cable is bad…
- is good cable that connected to both switches, but one switch had it’s interface in «administratively down» state, will cause that situation?
I haven’t seen that recently. For example, I have a c3560c in my lab and shutdown fa0/12… then I connected a good cable between the fa0/11 and fa0/12 ports…
sw1#sh ip int brief | i 0/1[1-9]
FastEthernet0/11       unassigned      YES unset  down                  down
FastEthernet0/12       unassigned      YES unset  administratively down down
sw1#
That said, I do have vague memories of seeing up / down when the remote interface was shut on other platforms in the past, but I don’t remember seeing it recently
If the cable is faulty, it could cause up / down status
Testing your cabling:
If you have a Cisco switch, you can test your cabling on the up / down interface like this… the following is good tdr output for the command when nothing is connected to the other end of the cable.
sw1#test cable-diagnostic tdr interface Fa0/6
TDR test started on interface Fa0/6
A TDR test can take a few seconds to run on an interface
Use 'show cable-diagnostics tdr' to read the TDR results.
sw1#
sw1#show cable-diagnostics tdr interface fa0/6
TDR test last run on: February 12 04:45:37

Interface Speed Local pair Pair length        Remote pair Pair status
--------- ----- ---------- ------------------ ----------- --------------------
Fa0/6     auto  Pair A     31   +/- 1  meters N/A         Open
                Pair B     31   +/- 1  meters N/A         Open
                Pair C     N/A                N/A         Not Supported
                Pair D     N/A                N/A         Not Supported
sw1#
Note: FastEthernet interfaces by-definition can only test two of the four pairs. GigabitEthernet interfaces can test all four pairs.
Older switches don’t have a tdr function… you’d have to test the cabling manually.
It is pretty unusual to find an Ethernet interface on a Cisco device which looks like it is working at Layer 1, so you get a Green link light on the Cisco device, but where it is not working at Layer 2 – so you can see no incoming Ethernet packets.
Of course I had just such an instance yesterday when VOIP phones were not picking up an IP address from the DHCP server running on a Cisco switch. Other devices clearly where, including same make/model VOIP phones in other parts of the network.
What was common was that all the phones with problems were connected eventually back to port G1/0/12 on the Cisco switch which had the DHCP server. This had a link light…
I looked at the interface:
Switch#sh int g1/0/12
GigabitEthernet1/0/12 is up, line protocol is down (monitoring)
  Hardware is Gigabit Ethernet, address is 5017.ff29.9c0c (bia 5017.ff29.9c0c)
  MTU 1500 bytes, BW 100000 Kbit/sec, DLY 100 usec,
     reliability 255/255, txload 1/255, rxload 1/255
  Encapsulation ARPA, loopback not set
  Keepalive set (10 sec)
  Full-duplex, 100Mb/s, media type is 10/100/1000BaseTX
  input flow-control is off, output flow-control is unsupported
  ARP type: ARPA, ARP Timeout 04:00:00
  Last input never, output 04:41:16, output hang never
  Last clearing of "show interface" counters never
  Input queue: 0/75/0/0 (size/max/drops/flushes); Total output drops: 0
  Queueing strategy: fifo
  Output queue: 0/40 (size/max)
  5 minute input rate 0 bits/sec, 0 packets/sec
  5 minute output rate 0 bits/sec, 0 packets/sec
     0 packets input, 0 bytes, 0 no buffer
     Received 0 broadcasts (0 multicasts)
     0 runts, 0 giants, 0 throttles
     0 input errors, 0 CRC, 0 frame, 0 overrun, 0 ignored
     0 watchdog, 0 multicast, 0 pause input
     0 input packets with dribble condition detected
So this interface has Line Protocol down, why?
I didn’t really focus on the word ‘monitoring’. Maybe it was a duplex or speed issue causing the non-passage of packets – but the negotiated value (Full-duplex, 100Mb/s) was right.
Maybe it was the cable. I decided to do a TDR test, because this was a modern day IOS and I could!
Switch#test cable-diagnostics tdr int g1/0/12
TDR test started on interface Gi1/0/12
A TDR test can take a few seconds to run on an interface
Use 'show cable-diagnostics tdr' to read the TDR results.

Switch#show cable-diagnostics tdr int g1/0/12
TDR test last run on: September 22 15:28:12

Interface Speed Local pair Pair length        Remote pair Pair status
--------- ----- ---------- ------------------ ----------- --------------------
Gi1/0/12  100M  Pair A     N/A                N/A         Not Completed
                Pair B     N/A                N/A         Not Completed
                Pair C     N/A                N/A         Not Completed
                Pair D     N/A                N/A         Not Completed
Okay, err, so no results. So I wondered whether I had used this switch for something else and forgotten to reset it – sometimes I do this when I need a couple of ports to monitor something. So I did a search in the config:
Switch#sh run | inc moni
monitor session 1 source interface Gi1/0/1
monitor session 1 destination interface Gi1/0/12
Bingo!
So I switched this off:
Switch#conf t
Enter configuration commands, one per line.  End with CNTL/Z.
Switch(config)#no monitor session 1
Switch(config)#exit

Switch#sh run | inc moni
Switch#
and immediately the line protocol came up.
Sep 22 15:38:33.746: %LINK-3-UPDOWN: Interface GigabitEthernet1/0/12, changed state to up
Sep 22 15:38:33.750: %LINEPROTO-5-UPDOWN: Line protocol on Interface GigabitEthernet1/0/12, line protocol is up (connected)
which was easily confirmed by looking at the interface again:
Switch#sh int g1/0/12
  Hardware is Gigabit Ethernet, address is 5017.ff29.9c0c (bia 5017.ff29.9c0c)
  MTU 1500 bytes, BW 100000 Kbit/sec, DLY 100 usec,
     reliability 255/255, txload 1/255, rxload 1/255
  Encapsulation ARPA, loopback not set
  Keepalive set (10 sec)
  Full-duplex, 100Mb/s, media type is 10/100/1000BaseTX
  input flow-control is off, output flow-control is unsupported
  ARP type: ARPA, ARP Timeout 04:00:00
  Last input 00:00:05, output 00:00:00, output hang never
  Last clearing of "show interface" counters never
  Input queue: 0/75/0/0 (size/max/drops/flushes); Total output drops: 0
  Queueing strategy: fifo
  Output queue: 0/40 (size/max)
  5 minute input rate 3000 bits/sec, 3 packets/sec
  5 minute output rate 4000 bits/sec, 3 packets/sec
     268 packets input, 33790 bytes, 0 no buffer
     Received 44 broadcasts (4 multicasts)
     0 runts, 0 giants, 0 throttles
     0 input errors, 0 CRC, 0 frame, 0 overrun, 0 ignored
     0 watchdog, 4 multicast, 0 pause input
     0 input packets with dribble condition detected
     94229 packets output, 75993256 bytes, 0 underruns
     0 output errors, 0 collisions, 1 interface resets
     1 unknown protocol drops
     0 babbles, 0 late collision, 0 deferred
     0 lost carrier, 0 no carrier, 0 pause output
     0 output buffer failures, 0 output buffers swapped out
Lesson – always factory reset switches before you use them for some other purpose.
Наверное, каждому из читателей, встречавшемуся с устройствами фирмы Cisco, доводилось выполнять на них команду show interfaces … Сегодня мы немного поковыряемся в выводе данной команды и разберем возможные состояния интерфейсов и протоколов линии(line protocol).
Для начало разберемся с тем , что такое состояние интерфейса и что такое состояние протокола линии. Состояние интерфейса, грубо говоря, сигнализирует о состоянии работы интерфейса нашего устройства на физическом уровне, состояние протокола линии обычно сигнализирует о состоянии работы данного интерфейса на канальном уровне. Данные состояния выводятся вместе при выполнении команд show interfaces на устройствах фирмы Cisco и имеют следующий вид (первая часть вывода свидетельствует о состоянии интерфейса, вторая, как легко догадаться, о состоянии протокола линии):
FastEthernet0/1 is up, line protocol is up (connected)
Рассмотрим, какие пары значений могут принимать данные состояния:
Состояние интерфейса – UP, состояние протокола линии – UP:
Думаю именно это состояние желает увидеть каждый сетевик, выполняя на циске команду show interfaces, так как именно оно свидетельствует о том, что интерфейс работает нормально.
Проиллюстрируем данную ситуацию в Packet Tracer. Соберем следующую схему:
 |
| Воспроизводим ситуацию Интерфейс — UP, протокол — UP |
Потом, выполним на коммутаторе следующую команду:
Switch#show interfaces fastEthernet 0/1
Часть её результата будет такова:
FastEthernet0/1 is up, line protocol is up (connected)
Hardware is Lance, address is 00d0.ffd8.7701 (bia 00d0.ffd8.7701)
……………………………………………………
Как можно заметить в данной ситуации интерфейс работает нормально и имеет состояния UP как на интерфейсе, так и на протоколе линии.
Состояние интерфейса – Administratively Down, состояние протокола линии – Down:
Данное состояние можно наблюдать на устройствах фирмы Cisco, в том случае если используемый порт был административно отключен с помощью команды shutdown. Продемонстрируем данный случай, для этого выполним на схеме из предыдущего примера следующие команды:
Switch(config)#interface fastEthernet 0/1
Switch(config-if)#shutdown
После чего опять посмотрим состояния интерфейса:
FastEthernet0/1 is administratively down, line protocol is down (disabled)
Hardware is Lance, address is 00d0.ffd8.7701 (bia 00d0.ffd8.7701)
……………………………………………………
Как и ожидалось интерфейс административно отключен.
Состояние интерфейса – Down, состояние протокола линии – Down(Err—disabled):
Такое состояние обычно встречается в том случае если на порте были произведены настройки безопасности для определенного mac адреса (подключиться к данному порту можно только с определенных mac адресов), а к нему подключились с устройства имеющего другой mac адрес.
Продемонстрируем данный случай. Будем использовать схему из предыдущих примеров, но коммутатор сконфигурируем следующим образом.
Switch(config)#interface fastEthernet 0/1
Switch(config-if)#switchport mode access
Switch(config-if)#switchport port-security
Switch(config-if)#switchport port-security violation shut
Switch(config-if)#switchport port-security mac-address 00E0.F795.C477
Switch(config-if)#exit
Switch(config)#interface vlan 1
Switch(config-if)#ip address 1.1.1.1 255.255.255.0
Switch(config-if)#no shut
После этого подключим к порту коммутатора компьютер имеющий адрес 1.1.1.2 c маской 255.255.255.0 и MAC адресом 00E0.F795.C472. После чего попробуем с компьютера пропиговать наш коммутатор. Как вы можете заметить пинги не прошли, а порт коммутатора заблокировался. Теперь попробуем посмотреть, что нам выдаст show interfaces fastEthernet 0/1.
FastEthernet0/1 is down, line protocol is down (err—disabled)
Hardware is Lance, address is 00d0.ffd8.7701 (bia 00d0.ffd8.7701)
……………………………………………………
По данному результату можно посмотреть состояния интерфейса при блокировки порта настройками безопасности.
Состояние интерфейса – Down, состояние протокола линии – Down:
Такое состояние может наблюдаться в том случае если к порту ничего не подключено, или же подключено но с помощью неисправного кабеля. Думаю что данная ситуация не нуждается в демонстрации =).
Состояние интерфейса – UP, состояние протокола линии – Down:
Честно говоря такую комбинацию состояний довольно трудно встретить в локальных сетях построенных на Ethernet коммутаторах, но она может возникнуть на интерфейсах маршрутизаторов, использующих последовательные каналы, при несогласовании протоколов канального уровня.
Рассмотрим это на следующем примере. Соберем в Cisco Packet Tracer следующую схему (в каждый маршрутизатор установлено по плате WIC-1T, порты которых соединены между собой):
 |
| Воспроизводим ситуацию Интерфейс — UP, протокол — Down |
Сконфигурируем один из маршрутизаторов следующим образом:
Router(config)#interface Serial0/3/0
Router(config-if) ip address 1.1.1.1 255.255.255.0
Router(config-if) encapsulation ppp
Router(config-if) clock rate 64000
Router(config-if)no shut
А другой:
Router(config)#interface Serial0/3/0
Router(config-if) ip address 1.1.1.2 255.255.255.0
Router(config-if) encapsulation hdlc
Router(config-if)no shut
Если после применения данной конфигурации вы попробуете пропинговать с одно маршрутизатора другой, то у вас ничего не выйдет. Дело в том что в данных конфигурациях для соединенных интерфейсов мы указали разные протоколы канального уровня. И как следствие связь не была установлена. Если же мы теперь выполним команду show interfaces serial 0/3/0 на одном из маршрутизаторов, то получим вполне предсказуемый результат:
Serial0/3/0 is up, line protocol is down (disabled)
Hardware is HD64570
Internet address is 1.1.1.1/24
MTU 1500 bytes, BW 128 Kbit, DLY 20000 usec,
……………………………………………………
Состояние интерфейса – Down, состояние протокола линии – UP:
Как легко догадаться такой комбинации состояний не существует. Так как если связь на физическом уровне не осуществляется, то о связи на канальном уровне не может быть и речи.
Пока что это все.
P.S.
В статье использовались материалы из книги Уэнделл Одом «Официальное руководство Cisco по подготовке к сертификационным экзаменам CCENT/CCNA ICND1 640-822″
Часть 1
Содержание
Устранение неполадок Gigabit Ethernet
Сравнение подключенного и неподключенного состояний
Устранение неполадок Gigabit Ethernet
Если устройство А подключено к устройству Б через соединение Gigabit, которое не удается активировать, выполните следующую процедуру.
Пошаговая процедура
-
Убедитесь, что на устройствах А и Б используются одинаковые конвертеры GBIC: коротковолновые (SX), длинноволновые (LX), дальней связи (LH), с растянутыми волнами (ZX) или медная неэкранированная витая пара (TX). Для установления соединения на обоих устройствах должны использоваться конвертеры GBIC одного типа. Конвертер SX GBIC необходимо подключать к конвертеру SX GBIC. Конвертер SX GBIC не может быть связан с конвертером LX GBIC. Дополнительные сведения можно получить в выполняющей абонентское обслуживание компьютеров организации или в документе Примечание по установке переходного соединительного кабеля.
-
Проверьте соответствие расстояния и типа кабеля, подключенного к конвертеру GBIC, по приведенной ниже таблице.
Спецификации кабелей портов 1000BASE-T и 1000BASE-X
GBIC
Длина волны (нм)
Тип меди/волокна
Внутренний диаметр1 (микроны)
Удельная полоса пропускания (МГц/км)
Длина кабеля2
WS-G5483 1000Base — T (медный)
Категория 5 UTP Категория
Категория 5e UTP
6 UTP
328 футов (100 м)
WS-G5484 1000BASE-SX3
850
MMF
62.5
62.5
50.0
50.0
160
200
400
500
220 м
275 м
500 м
550 м
WS-G5486 1000BASE-LX/LH
1310
MMF4
SMF
62.5
50.0
50.0
8.3/9/10
500
400
500
—
550 м
550 м
550 м
10 км
WS-G5487 1000BASE-ZX5
1550
MMF
SMF6
8.3/9/10
8.3/9/10
43,5 мили (70 км)7
62,1 мили (100 км)
-
Числа, приведенные для многомодового оптоволоконного кабеля, относятся к диаметру сердцевины. Для одномодового оптоволоконного кабеля, 8,3 микрон относятся к диаметру сердцевины. Значения в 9 и 10 микрон относятся к диаметру волнового поля, который является диаметром несущей свет части оптоволокна. Эта область состоит из сердцевины оптоволокна и небольшой части окружающего оптического покрытия. Диаметр волнового поля является функцией диаметра сердцевины, длины волны лазера, разницы показателей преломления сердцевины и оптического покрытия.
-
Длина зависит от потерь в оптоволокне. Многослойность и нестандартность оптоволоконного кабеля приводят к уменьшению дальности прокладки кабеля.
-
Использовать только вместе с многомодовым волокном.
-
При использовании конвертера LX/LH GBIC с многомодовым волокном диаметром 62,5 микрона необходимо установить переходной соединительный кабель (CAB-GELX-625 или эквивалентный) между конвертером GBIC и многомодовым кабелем на концах передачи и приема данного соединения. Переходной соединительный кабель требуется для соединений на расстояниях менее 328 футов (100 м) или более 984 футов (300 м). Переходной соединительный кабель предотвращает перегрузку приемника в случае короткого многомодового волокна и снижает задержку сигнала при дифференциальном включении в случае длинного многомодового волокна. Дополнительные сведения см. в документе Примечание по установке переходного соединительного кабеля.
-
Использовать только вместе с одномодовым волокном.
-
Одномодовый оптоволоконный кабель со смещенной дисперсией.
-
Для конвертеров ZX GBIC минимальная дальность соединения (при наличии на каждом конце соединения аттенюаторов на 8 дБ) составляет 10 км (6,2 мили). Без аттенюаторов минимальная дальность соединения равна 40 км (24,9 мили).
-
-
Если у любого из устройств есть несколько портов Gigabit, соедините эти порты между собой. Это позволяет проверить каждое устройство и убедиться, что интерфейс Gigabit функционирует правильно. Например, есть коммутатор с двумя портами Gigabit. Подключите один порт Gigabit к другому. Активно ли данное соединение? Если да, то данные порты функционируют правильно. STP блокирует данный порт и предотвращает возникновение петель (приемный порт один (RX) соединяется с передающим портом два (TX), а порт один TX — с портом два RX).
-
Если произошел сбой одного соединения или не удалось выполнить шаг 3 с разъемами SC, закольцуйте порт на себя (порт один RX соединяется с портом один TX). Активен ли данный порт? Если нет, обратитесь в центр технической поддержки (TAC), так как, возможно, это неисправный порт.
-
Если шаги 3 и 4 успешны, но соединение между устройствами А и Б не удается установить, закольцуйте порты с помощью кабеля, соединяющего два устройства. Проверьте исправность кабелей.
-
Убедитесь, что каждое устройство поддерживает спецификацию 802.3z для автоматического согласования Gigabit. В интерфейсе Gigabit Ethernet есть процедура автоматического согласования, обеспечивающая более широкие возможности, чем та, которая используется в 10/100 Ethernet (спецификация автоматического согласования Gigabit: IEEE Std 802.3z-1998). При включении согласования соединений система выполняет автоматическое согласование дуплексного режима, режима управления потоком и сведений об удаленных ошибках. Следует либо включить, либо отключить согласование сразу на обоих концах соединения. На обоих концах соединения необходимо задать одно и то же значение, иначе соединение установить не удастся. Проблемы могут возникнуть при подключении к устройствам, произведенным до ратификации стандарта IEEE 802.3z. Если любое из устройств не поддерживает автоматическое согласование Gigabit, отключите автоматическое согласование Gigabit. Это вызовет принудительную активацию соединения.
 Предупреждение: При отключении автоматического согласования скрываются сбросы соединений и проблемы на физическом уровне. Отключение автоматического согласования требуется, только если используются конечные устройства, не поддерживающие стандарт IEEE 802.3z (например старые сетевые платы Gigabit). Отключать автоматическое согласование между коммутаторами следует только в случае крайней необходимости, так как при этом проблемы физического уровня могут остаться необнаруженными, что ведет к образованию петель STP. В качестве альтернативы убедитесь, что у вас выполнена легализация ПО, обратитесь к поставщику и обновите свое программное и аппаратное обеспечение до поддержки автоматического согласования IEEE 802.3z Gigabit.
 Предупреждение: При отключении автоматического согласования скрываются сбросы соединений и проблемы на физическом уровне. Отключение автоматического согласования требуется, только если используются конечные устройства, не поддерживающие стандарт IEEE 802.3z (например старые сетевые платы Gigabit). Отключать автоматическое согласование между коммутаторами следует только в случае крайней необходимости, так как при этом проблемы физического уровня могут остаться необнаруженными, что ведет к образованию петель STP. В качестве альтернативы убедитесь, что у вас выполнена легализация ПО, обратитесь к поставщику и обновите свое программное и аппаратное обеспечение до поддержки автоматического согласования IEEE 802.3z Gigabit.
Об устранении неполадки, описанной в сообщении об ошибке: %SYS-4-PORT_GBICBADEEPROM: / %SYS-4-PORT_GBICNOTSUPP, см. в документе Распространенные сообщения об ошибках CatOS на коммутаторах серии Catalyst 6000/6500.
Системные требования к GigabitEthernet, конвертерам интерфейса Gigabit (GBIC), неплотному спектральному мультиплексированию (CWDM) и подключаемым модулям малого форм-фактора (SFP) см . в следующих документах.
-
Системные требования для реализации Gigabit Ethernet на коммутаторах Catalyst
-
Матрица совместимости коммутатора — конвертера интерфейса Catalyst GigaStack Gigabit
-
Матрица совместимости модулей приемопередатчиков Cisco Gigabit Ethernet
-
Документация по GBIC, SFP и CWDM
Сведения об общей конфигурации и устранении неполадок см. в документе Настройка и устранение неполадок автоматического согласования Ethernet 10/100/1000 MB в полудуплексном и дуплексном режимах.
Сравнение подключенного и неподключенного состояний
На большинстве коммутаторов Cisco порт по умолчанию находится в неподключенном состоянии. Это означает, что в данный момент он ни к чему не подключен, однако соединение будет установлено в случае надежного подключения к другому действующему устройству. При подключении исправного кабеля к двум портам коммутатора в неподключенном состоянии, индикатор соединения для обоих портов начинает гореть зеленым цветом, а состояние портов должно отображать установленные подключения. Это означает, что данный порт активен на уровне 1 (L1).
Для CatOS можно использовать команду show port , чтобы проверить, находится ли порт в подключенном или неподключенном состоянии, либо в другом состоянии, которое может вызвать сбой подключения, например, disabled (отключен) или errdisable (отключен из-за ошибки).
Switch> (enable) sh port status 3/1 Port Name Status Vlan Duplex Speed Type----- -------------------- ---------- ---------- ------ ----- ------------3/1 disabled 1 auto auto 10/100BaseTX!--- The show port status {mod/port} command show the port is disabled.!--- Use the set port enable {mod/port}command to try and re-enable it.
Для Cisco IOS можно использовать команду show interfaces чтобы убедиться, что интерфейс — «up, line protocol is up (connected)». Первое «up» относится к состоянию физического уровня интерфейса. Сообщение «line protocol up» показывает состояние уровня канала передачи данных для данного интерфейса и означает, что интерфейс может отправлять и принимать запросы keepalive.
Router#show interfaces fastEthernet 6/1 FastEthernet6/1 is down, line protocol is down (notconnect)!--- The interface is down and line protocol is down.!--- Reasons: In this case,!--- 1) A cable is not properly connected or not connected at all to this port.!--- 2) The connected cable is faulty.!--- 3) Other end of the cable is not connected to an active port or device.!--- Note: For gigabit connections, GBICs need to be matched on each!--- side of the connection.!--- There are different types of GBICs, depending on the cable and!--- distances involved: short wavelength (SX),!--- long-wavelength/long-haul (LX/LH) and extended distance (ZX).!--- An SX GBIC needs to connect with an SX GBIC;!--- an SX GBIC does not link with an LX GBIC. Also, some gigabit!--- connections require conditioning cables, !--- depending on the lengths involved.
Router#show interfaces fastEthernet 6/1 FastEthernet6/1 is up, line protocol is down (notconnect)!--- The interface is up (or not in a shutdown state), but line protocol down.!--- Reason: In this case, the device on the other side of the wire is a!--- CatOS switch with its port disabled.
Router#sh interfaces fas 6/1 status Port Name Status Vlan Duplex Speed Type Fa6/1notconnect 1 auto auto 10/100BaseTX!--- The show interfaces card-type [slot/port] status command is the equivalent!--- of show port status for CatOS.
Если команда show port показывает подключенные порты или команда show interfaces показывает активный протокол линии (подключен), но в выходных данных любой из этих команд наблюдается увеличение ошибок, то совет по устранению неполадки см. в разделе «Основные сведения о выходных данных счетчиков портов и интерфейсов для CatOS и Cisco IOS» или «Распространенные проблемы портов и интерфейсов» данного документа.
Часть 3 Часть 4