This simple margin of error (MOE) calculator can be employed to compute the MOE of a survey in accordance with the sample proportion and size, and the desired confidence level.
You can use the calculator to compute the MOE in four simple steps:
- Use the drop-down menu to select the confidence level
- Input the sample size and then the proportion percentage
- If required, provide details of the population size
- Click on the «Calculate» button to generate the outputs.
The Margin of Error in Statistics
The majority of surveys that are conducted for research purposes are based on information that is collected from a sample population as opposed to the full population (a census). As the sample is only representative of the full population, it is likely that some error will occur, not in terms of the calculation, but in terms of the sampling. That is, a sampling error will emerge because the researchers did not include everyone that exists within a given population. The MOE measures the maximum amount by which the sample results may differ from the full population. As most responses to survey questions can be presented in terms of percentages, it makes sense that the MOE is also presented as a percentage.
Margin of Error Formula
The Margin of Error (MOE) Calculator uses the following formulas:
1. MOE = z * √p * (1 — p) / √n
2. MOE (with finite population correction) = z * √p * (1 — p) / √(N — 1) * n / (N — n)
Where:
MOE is the margin of error,
z is the z-score associated with a level of confidence,
p is the sample proportion, expressed as a decimal,
n is the sample size,
N is the population size.
To estimate the sample size, take a look at our sample size calculator.
Margin of Error Calculation Example: A market research agency conducted a survey to identify how many mobile phone users use their devices to access social media. They surveyed 1000 mobile phone users and found that 540 regularly used their devices to access their social media profiles.
Let’s assume that we require a 95% level of confidence; as such, the z-score = 1.96.
The sample population, p, is 540 / 1000 = 0.54. (The sample size, n, was 1000.)
As such, the margin of error in this survey is as follows:
MOE = z * √p * (1 — p) / √n
MOE = 1.96 * √0.54 * (1 — 0.54) / √1000
MOE = 0.977 / 31.623 * 100 = 3.089%
These results indicate that the market research company can conclude with 95% confidence that 54% of mobile phone users use their device to access social media, give or take 3%.
What is margin of error and what does it mean for your survey data?
Will your survey results ever perfectly match the population you’re studying? Probably not.
But you can get a good idea of how close you are by using a margin of error calculator. This handy tool will help you to find margin of error and will tell you if the amount of people you’re surveying is enough for you to feel confident about the accuracy of the data you collect.
Calculate your margin of error
Population Size
The total number of people whose opinion or behavior your sample will represent.
Confidence Level (%)
The probability that your sample accurately reflects the attitudes of your population. The industry standard is 95%.
Sample size
The number of people who took your survey.
Margin of error
What is margin of error in a survey?
Margin of error, also called confidence interval, tells you how much you can expect your survey results to reflect the views from the overall population. Remember that surveying is a balancing act where you use a smaller group (your survey respondents) to represent a much larger one (the target market or total population.)
You can think of margin of error as a way of measuring how effective your survey is. The smaller the margin of error, the more confidence you may have in your results. The bigger the margin of error, the farther they can stray from the views of the total population.
As the name implies, the margin of error is a range of values above and below the actual results from a survey. For example, a 60% “yes” response with a margin of error of 5% means that between 55% and 65% of the general population think that the answer is “yes.”
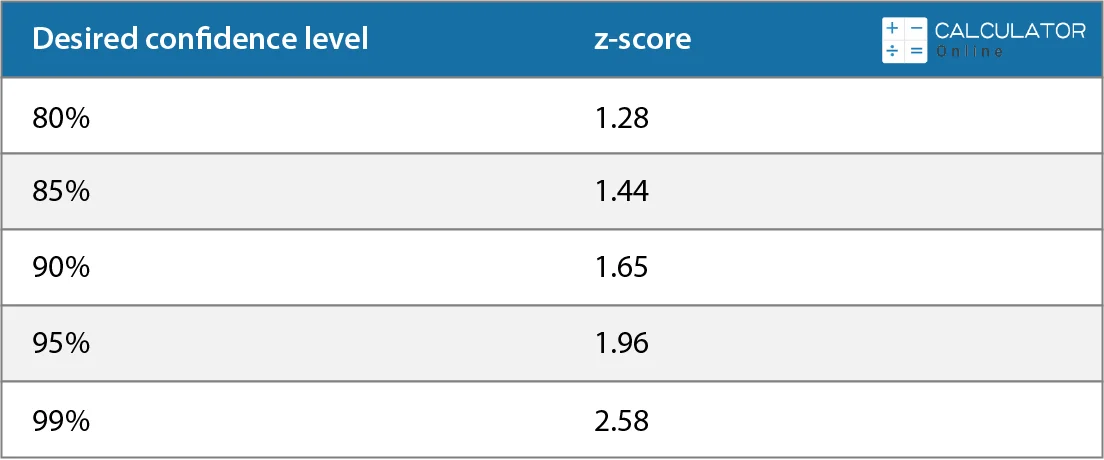
How to calculate margin of error
n = sample size • σ = population standard deviation • z = z-score
| Desired confidence level | z-score |
| 80% | 1.28 |
| 85% | 1.44 |
| 90% | 1.65 |
| 95% | 1.96 |
| 99% | 2.58 |
Let’s see the margin of error formula at work with an example.
Imagine you are trying to decide between Name A and Name B for a new product and your target market consists of 400,000 potential customers. This is your total population.
You decide to survey 600 of those potential customers. This is your sample size.
When you get the results, 60% of respondents say they prefer Name A. You need to input a confidence level in the margin of error calculator.
This number expresses how certain you are that the sample accurately reflects the attitudes of the total population. Researchers commonly set it at 90%, 95% or 99%. (Do not confuse confidence level with confidence interval, which is just a synonym for margin of error.)
Try inputting the numbers from this example in the margin of error calculator above. The calculator gives you a margin of error of 4%.
Remember 60% of your respondents chose Name A? This margin of error means that now you know with 95% likelihood that 56% to 64% of the total population–your target market–prefer Name A for your product.
We get to 56 and 64 by adding and subtracting the margin of error from your sample’s response.
How sample size affects margin of error
If your margin of error looks too big, you will want to increase the size of the sample so that the attitudes of the population surveyed match those of the total population more closely.
What this means is you will need to send your survey to more people.
5 steps to increase your data’s reliability
Now that you know how margin of error is calculated and how it affects your results, let’s review the steps that you need to follow to use these concepts in your survey design.
Get more responses
SurveyMonkey Audience has millions of respondents who are ready to take your survey.
Created by Maria Kluziak
Reviewed by
Bogna Szyk and Jack Bowater
Last updated:
Nov 10, 2022
The margin of error calculator is a useful tool that will allow you to save time when calculating random sampling errors in your research. If you:
- Need to get the margin of error calculated quickly;
- Want to learn how to calculate margin of error;
- Are looking for the margin of error formula; or
- Don’t quite know what is a margin of error yet, and you want to read a quick summary to help you grasp the subject…
…This calculator is just what you need!
What is margin of error?
Margin of error is a statistic that states by how many percent the results of a survey may differ from reality. In other words, it’s a way of expressing the number of random sampling errors in a result. It is typically defined as the range of a confidence interval for a particular statistic.
In essence, one can think about it as a way of measuring how effective a survey will be. The smaller the margin of error, the more likely that your results reflect the reality of the entire population, rather than just the sample group. It’s an important and useful statistical tool, and understanding its value will help you conduct research in a more precise and confident manner.
How to use the margin of error calculator?
To use the margin of error calculator, follow these few simple steps:
- Start by deciding whether you want to include the Finite Population Correction factor (FPC) in your calculations. Not sure if it’s appropriate? The general rule states that you should account for FPC when the sample size is five or more percent of the entire population. This is important, as the size of the sample impacts the metrics drawn from the data, such as the variance and the standard deviation of the sampling distribution. The sample size calculator can help you make sure you get it right.
- Input the sample size, and, if you’re calculating with FPC, the population size.
- Choose the confidence level you are aiming for. The calculator will use this to find the appropriate Z-score.
- The last thing to do is to calculate the sample proportion (known as p̂, or p-hat). To do that, input the number of people who gave the answer you are interested in for your survey. For example, if 100 people took your survey and 57 of them answered «yes» to the question you asked, you would input 57 into this field, and the value of p̂ would be 0.57 (57 / 100).
With all these values, the margin of error calculator will provide you with your MOE in no time.
How to calculate margin of error?
Now that you know what is margin of error is, you might want to expand that knowledge. Sure, our calculator can do the work for you, but we understand that you may feel more confident in your research if you are able to do the calculations on your own.
So how to calculate margin of error? Although it may sound difficult at first, in reality, it’s quite a straightforward task. The simple margin of error formula is as follows:
MOE=zpˆ(1−pˆ)nscriptsize
mathrm{MOE} = z sqrt{frac{^{p}(1-^{p})}{n}}
Where:
- zz — Z-score;
- pˆ^{p} — Sample proportion; and
- nn — Sample size.
The formula for the margin of error with Finite Population Correction is as follows:
MOE with FPC=zpˆ(1−pˆ)(P−1)(nP−n)scriptsize
mathrm{MOE with FPC } = z sqrt{frac{^{p}(1-^{p})}{(P-1)(frac{n}{P-n})}}
Where PP stands for the population size.
Using the margin of error formula — example
For clarity’s sake, let’s go through an example.
Let’s imagine we’re surveying 400 people, who represent a population of 5000. After getting the results, we learn that 260 of those people answered «yes» to the survey. As we are quite confident in our research, our confidence level is 96%.
As 400 is 8% of 5000 (feel free to use the percentage calculator to double-check), we have to opt for the margin of error formula which includes FPC.
To sum up, the numbers we are working with are:
- confidence level = 96%, which corresponds to a Z-score of 2.05 (check the next paragraph if you need more information on Z-scores), so:
- z = 2.05
- P = 5000
- n = 400
- p̂ = 260/400 = 0.65
By inputting the above values into the formula, we get the following calculation:
2.050.65(1−0.65)(5000−1)(4005000−400)=4.69%scriptsize
2.05 sqrt{frac{0.65 (1 — 0.65)}{(5000-1)(frac{400}{5000-400})}} = 4.69%
The result tells us that our data will be within 4.69 percentage points of the real population value 96% of the time.
So what about those Z-scores?
You can’t really understand how to calculate the margin of error if you ignore the concept of the Z-score.
In short, Z-score is a numerical statistic that measures the value’s relationship to the mean (average) of a group of values, measured in terms of standard deviations from the mean. A Z-score of 0 indicates a value identical to the mean, a Z-score of 1 would indicate a value exactly one standard deviation from the mean, and so on and so forth. Feel free to visit the Z-score calculator to learn more about this important quantity.
What is of interest in this margin of error calculator is which Z-score corresponds to a certain confidence level. A confidence level can be defined as the probability that the value of a parameter falls within a specified range of values.
Different science areas traditionally make use of varying confidence levels. For example, in psychological research, it is most common to opt for a confidence level of 95% (corresponding Z-score of 1.96). In medical research, on the other hand, it is not uncommon to go for higher levels, such as 98% or even 99%. After all, there is not much margin for errors in healing people.
Luckily, the relationship between confidence levels and Z-scores is formalised, and you generally don’t need to calculate the Z-score based on a confidence level on your own — there exist widely available resources, such as tables, that tell you precisely what Z-score corresponds to your desired confidence levels. Below you will find an excerpt from such a table, containing some of the confidence levels most widely used in various areas of statistical research.
Z-scores of some of the most common confidence levels:
|
Confidence level |
Z-score |
|---|---|
|
70% |
1.04 |
|
75% |
1.15 |
|
80% |
1.28 |
|
85% |
1.44 |
|
90% |
1.645 |
|
92% |
1.75 |
|
95% |
1.96 |
|
96% |
2.05 |
|
98% |
2.33 |
|
99% |
2.58 |
Calculate MOE with Finite Population Correction?
Data
FPC factor should be included when the sample is at least 5% of the population. Use the percentage calculator to check the relation between sample and population size, and choose «No» in the first field of this calculator if it is less than 5%.
Sample proportion calculation
Number of people who gave the desired answer
AveragePercentagePercentage change… 29 more
Calculating margin of error becomes easy with the ease of our statistic tool known as statistics margin of error calculator. The tool helps to calculate margin of error based on the Confidence Level (α), Proportion Percentage (p), Sample Size (n), and Population size (N).
Well, give a read to this post to learn about how to find margin of error, the margin of error formula, and much more! So, let’s start with the basic term of the margin of error definition!
What Is Margin of Error (Statistics)?
A margin of error (MOE) is a statistical measurement of the difference between survey results and the population value, expressed as a percentage. In simple words, a MOE tells how many percentages points your results will differ from the real population value. For instance, a 95% confidence interval with a 4 percent margin of error indicates that your statistic will be within 4% points of the real population value 95% of the time.
According to the technical term, the margin of error is said to be as the range of values below and above the sample statistic in a confidence interval. Simply, the confidence interval (α) is a way to reveal what the uncertainty is with certain statistics (that is from a poll or survey). Sometimes margin of error is also known as confidence interval! So, if you seeking the way to find the margin of error for a confidence interval, then you ought to use margin of error confidence interval calculator to get instant results!
The Margin of Error Formula:
The formula’s for margin of error statistics are taken into account to find MOE!
MOE = z * √p * (1 – p) / √n
Our smart margin of error calculator also uses the above margin of error equation.
(MOE) Margin of Error (with finite population correction) = z * √p * (1 – p) / √(N – 1) * n / (N – n)
Where:
- MOE indicates the margin of error,
- z indicates the z-score associated with a level of confidence,
- p indicates the sample proportion, expressed as a decimal,
- n indicates the sample size,
- N is the population size
Example Problem:
Calculate margin of error for the probability expectation p = 0.3, confidence interval 95% & the sample size n = 1000?
Solution:
Given Values:
Probability p = 0.3
Confidence level = 95%
So, the z-score is 1.96 for 95% confidence interval
z = 1.96
Sample size n = 1000
Now, Step by step calculation:
Formula to find ME = z √(p(1-p)/n)
Substitute the values in the above formula
= 1.96 x √(0.3 x 0.7/1000)
ME = 0.028
About Margin of Error Calculator:
Our simple but highly accurate margin of error calculator can help to calculate margin of error of a survey in accordance with the sample size, proportion percentage, population size, and the desired confidence level. You can readily perform the margin of error calculation with this handy tool. Read on!
How to Find Margin of Error With This MOE Calculator:
The tool is very free and simple to use as it is fully loaded with a user-friendly interface, you just need to enter values into the given fields to attain your result! You can compute the MOE within just five simple steps:
- First of all, you ought to select the confidence level from the drop-down menu
- Right after, you have to enter the proportion percentage
- Very next, you ought to enter the sample size
- Then, you have to enter the population size, if required
- Once done, hit the calculate button to generate the MOE value
How to Calculate Margin of Error?
Margin of Error = z * σ/ √n
Where;
n = sample size
σ = population standard deviation
z = z-score
- First, there is a need to get the population standard deviation (σ) and sample size (n)
- Then, there is a need to take the square root of the sample size
- Right after, divide it by the population standard deviation
- Then, there is a need to multiply the result by the z-score consistent with the confidence interval according to the given (z-score) table
FAQ’s:
What is the acceptable margin of error?
Typically, an “acceptable” margin of error will be taken into account by survey researchers that fall between 4% and 8% at the 95% confidence level. You can be able to compute the margin of error at different sample sizes to figure out what sample size will yield results reliable at the desired level.
How do you make the margin of error smaller?
- Increase the sample size
- Reduce variability
- Use a one-sided confidence interval
- Lower the confidence level
What is margin of error in surveys?
The (MOE) is a statistics that expressing the amount of random sampling error in a survey’s outcomes! According to optimistic studies, larger the margin of error, the less confidence one should have that the poll’s/survey reported outcomes are close to the ‘true’ figures that said to be as the figures for the whole population.
What is the purpose of margin of error?
By the definition of margin of error statistics, it is referring to the degree of error in results attained from random sampling surveys. Keep in mind, according to statistic term the higher margin of error referred to as less likelihood of relying on the results of a survey that is the confidence on the outcomes will be lower to represent a population.
What is the margin of error in Slovin’s formula?
Solvin’s formula will be taken into account to calculate the sample size (n) given the population size (N) and margin of error (e). It is determined as n = N (1+Ne2). If a sample is taken from a population, and then a formula should be utilized to take into account confidence levels and margin of error.
Why is margin of error important?
The margin of error around an estimate is immensely important as it assists you to draw conclusions about the data. Remember that a small difference between two estimations may not be statistically significant if the confidence intervals of such both estimates overlap.
How sample size affects margin of error?
Your margin of error assists you to understand whether the sample of your survey is appropriate. If the margin of error looks too big, then you have to increase the size of the sample, in this way the attitudes of the population surveyed match those of the total population more closely.
Final Words:
Enter the values into the above margin of error confidence interval calculator to find (MOE). Maybe you think what you have to do if your answer is inside the margin of error. The only real and best way to reduce the margin of error is to increase your sample size. There is a need to run your survey for a longer period to attain more responses. Good Luck!
Calculator for Margin Of Error
This calculator calculates the margin of error for surveys based on sample size and proportion. It also allows you to set the desired level of confidence.
You can use this calculator to calculate the MOE with just four steps
You can choose the level of confidence by using the drop-down list
First, determine the sample size. Next, calculate the percentage.
If necessary, please provide details on the population size
To generate the outputs click on the «Calculate” button
Statistics: The Margin for Error
Research surveys are most often based on information collected from a subset of the population. This is in contrast to a full population (a census). Since the sample is representative of the whole population, there are likely to be errors not in the calculation but in the sampling. The sampling error is due to the fact that not all individuals within a population were included by researchers. The MOE represents the maximum deviation between sample results and the full population. It makes sense that the MOE also appears as a percentage.
What is the margin for error in a survey?
The margin of Error, also known as a confidence interval, is a statistical measure of the difference between survey data and population value. It’s expressed in percentages. The margin of error, also known as a confidence interval, is the statistical measurement of the difference between survey results and the population value.
A survey requires a small group (your respondents) to represent a larger group (the target market, or total population). The margin of error is a measure of how effective your survey is. Your results should be more representative of the population than the margin of error. The larger the margin of error is, the more they could be off the view of the entire population.
Where is the margin for error applied?
The margin of error can be used when there is a probability sample or random sample. This means the sample has not been drawn from the entire population. Every member of that population has a probability of being included.
It’s unacceptable if the sample has not been randomly selected, as in the case of an opt-in panel.
A Research Panel Sample is typically a standard quota sample. This means that participants are chosen for their unique characteristics. Respondents volunteer to be part of the panel in exchange for benefits.
Margins of error are a commonly used term but they have a specific application in survey and market research data.
Here are a few scenarios in which there is a margin of error:
A sports team maintains a complete list of all people who have purchased tickets to their games in recent years. The margin of error for the percentage of fans can be calculated if they randomly select the population to survey.
An organization has a complete staff list. They survey a random sample of these employees to determine if they prefer an additional day of vacation or a small amount of bonus pay. They can report on the margin of error in determining which option they prefer.
Other types of error
The margin of errors in the level you place on your results. This determines the sampling error which you should expect based on the sample size. However, there are other types of survey errors that could affect your results. These include coverage error where the sample doesn’t reach the population that you are interested in, non-response, which occurs when respondents opt not to participate in your survey, as well as measurement error which may be due to issues with the questionnaire.

Article author
Parmis Kazemi
Parmis is a content creator who has a passion for writing and creating new things. She is also highly interested in tech and enjoys learning new things.
Margin Of Error Calculator English
Published: Mon Dec 20 2021
In category Mathematical calculators
Add Margin Of Error Calculator to your own website