errorbar
Line plot with error bars
Syntax
Description
errorbar( createsy,err)
a line plot of the data in y and draws a vertical
error bar at each data point. The values in err determine
the lengths of each error bar above and below the data points, so
the total error bar lengths are double the err values.
example
errorbar( plots x,y,err)y versus x and
draws a vertical error bar at each data point.
errorbar(x,y,neg,pos)
draws a vertical error bar at each data point, where neg
determines the length below the data point and pos determines
the length above the data point, respectively.
example
errorbar(___, sets the orientationornt)
of the error bars. Specify ornt as
"horizontal" for horizontal error bars or
"both" for both horizontal and vertical error bars. The
default for ornt is "vertical", which
draws vertical error bars. Use this option after any of the previous input
argument combinations.
example
errorbar(x,y,yneg,ypos,xneg,xpos)
plots y versus x and draws both horizontal
and vertical error bars. yneg and ypos set
the lower and upper lengths of the vertical error bars, respectively. Similarly,
xneg and xpos set the left and right
lengths of the horizontal error bars.
example
errorbar(___, sets the lineLineSpec)
style, marker symbol, and color. For example, "--ro" plots a
dashed, red line with circle markers. The line style affects only the line and
not the error bars.
example
errorbar(___, modifies theName,Value)
appearance of the line and error bars using one or more name-value pair
arguments. For example, "CapSize",10 sets the lengths of the
caps at the end of each error bar to 10 points.
errorbar( createsax,___)
the plot in the axes specified by ax instead of
in the current axes. Specify the axes as the first input argument.
example
e = errorbar(___)ErrorBar object for each plotted line. Use
e to modify properties of a specific ErrorBar object after it is created. For a list of
properties, see ErrorBar Properties.
Examples
collapse all
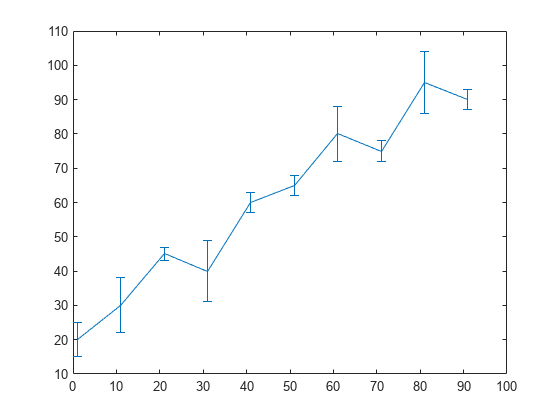
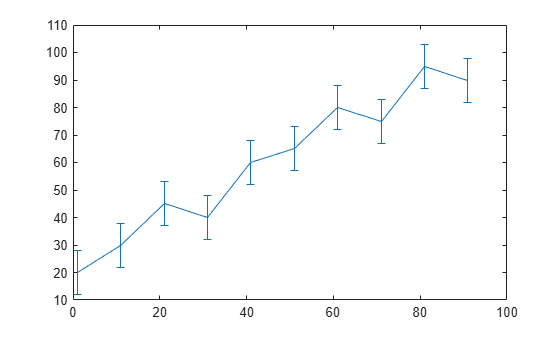
Plot Vertical Error Bars of Equal Length
Create vectors x and y. Plot y versus x. At each data point, display vertical error bars that are equal in length.
x = 1:10:100;
y = [20 30 45 40 60 65 80 75 95 90];
err = 8*ones(size(y));
errorbar(x,y,err)

Plot Vertical Error Bars that Vary in Length
Create a line plot with error bars at each data point. Vary the lengths of the error bars.
x = 1:10:100;
y = [20 30 45 40 60 65 80 75 95 90];
err = [5 8 2 9 3 3 8 3 9 3];
errorbar(x,y,err)
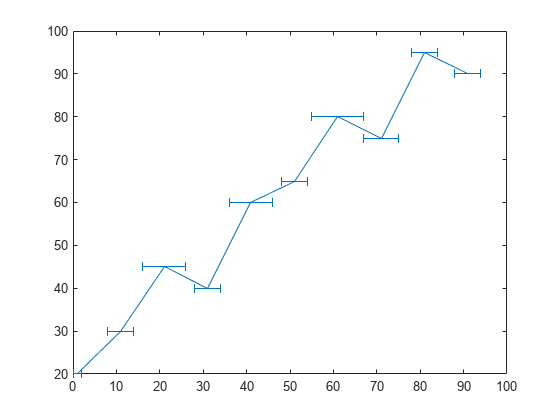
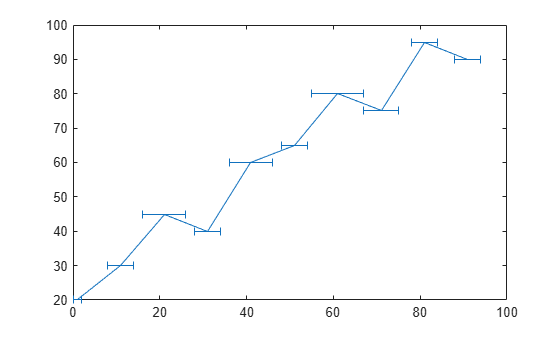
Plot Horizontal Error Bars
Create a line plot with horizontal error bars at each data point.
x = 1:10:100;
y = [20 30 45 40 60 65 80 75 95 90];
err = [1 3 5 3 5 3 6 4 3 3];
errorbar(x,y,err,'horizontal')
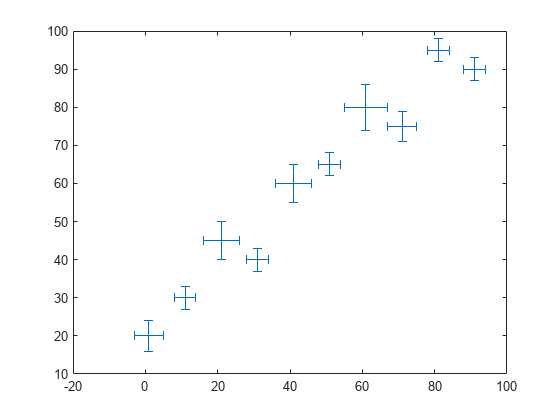
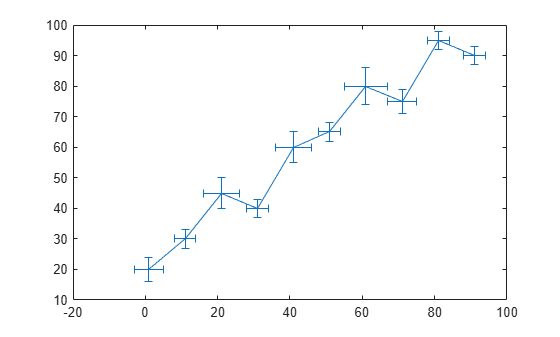
Plot Vertical and Horizontal Error Bars
Create a line plot with both vertical and horizontal error bars at each data point.
x = 1:10:100;
y = [20 30 45 40 60 65 80 75 95 90];
err = [4 3 5 3 5 3 6 4 3 3];
errorbar(x,y,err,'both')

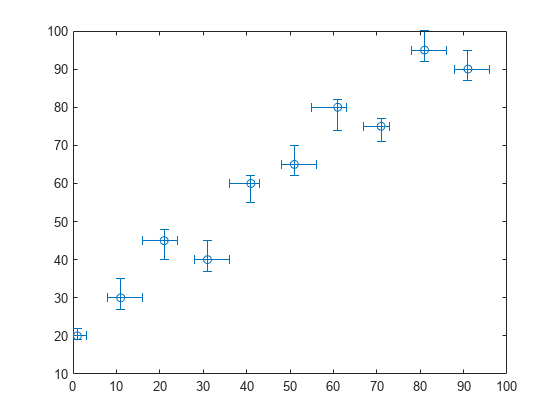
Plot Error Bars with No Line
Plot vectors y versus x. At each data point, display a circle marker with both vertical and horizontal error bars. Do not display the line that connects the data points by omitting the line style option for the linespec input argument.
x = 1:10:100;
y = [20 30 45 40 60 65 80 75 95 90];
err = [4 3 5 3 5 3 6 4 3 3];
errorbar(x,y,err,"both","o")

Alternatvely, omit the markers and plot the error bars by themselves. To do this, specify the LineStyle name-value argument as "none".
errorbar(x,y,err,"both","LineStyle","none")
Control Error Bars Lengths in All Directions
Display both vertical and horizontal error bars at each data point. Control the lower and upper lengths of the vertical error bars using the yneg and ypos input argument options, respectively. Control the left and right lengths of the horizontal error bars using the xneg and xpos input argument options, respectively.
x = 1:10:100;
y = [20 30 45 40 60 65 80 75 95 90];
yneg = [1 3 5 3 5 3 6 4 3 3];
ypos = [2 5 3 5 2 5 2 2 5 5];
xneg = [1 3 5 3 5 3 6 4 3 3];
xpos = [2 5 3 5 2 5 2 2 5 5];
errorbar(x,y,yneg,ypos,xneg,xpos,'o')
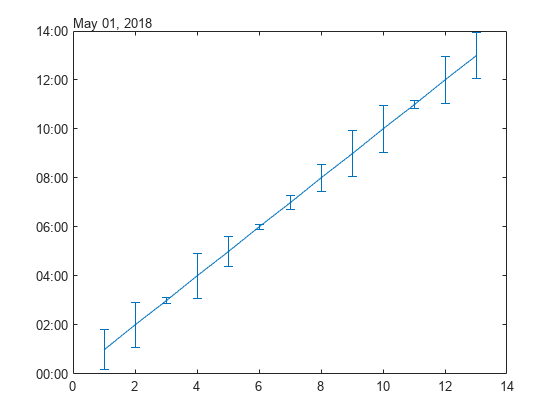
Plot Datetime Values with Error Bars
Create a plot of datetime values with error bars in duration units.
x = 1:13;
y = datetime(2018,5,1,1:13,0,0);
err = hours(rand(13,1));
errorbar(x,y,err)
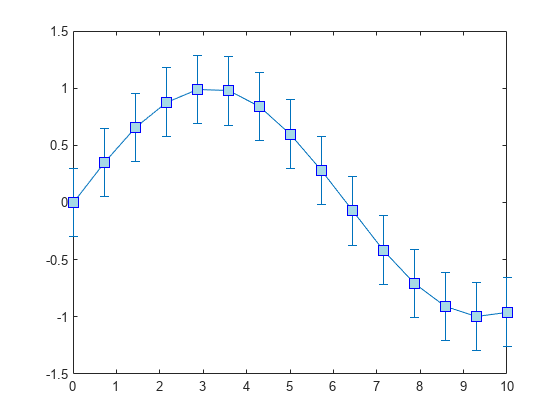
Add Colored Markers to Each Data Point
Create a line plot with error bars. At each data point, display a marker. Change the appearance of the marker using name-value arguments. Use MarkerSize to specify the marker size in points. Use MarkerEdgeColor and MarkerFaceColor to specify the marker outline and fill colors, respectively. You can specify colors by name, such as «blue", as RGB triplets, or hexadecimal color codes.
x = linspace(0,10,15);
y = sin(x/2);
err = 0.3*ones(size(y));
errorbar(x,y,err,"-s","MarkerSize",10,...
    "MarkerEdgeColor","blue","MarkerFaceColor",[0.65 0.85 0.90])
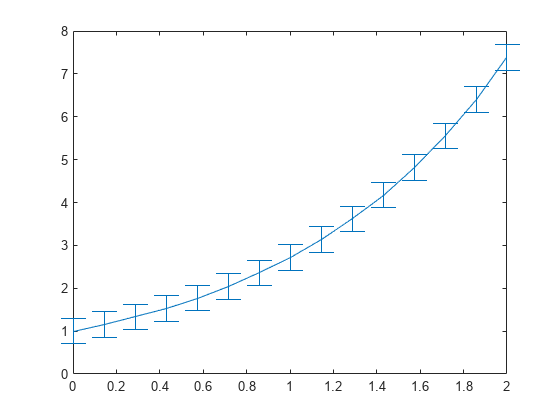
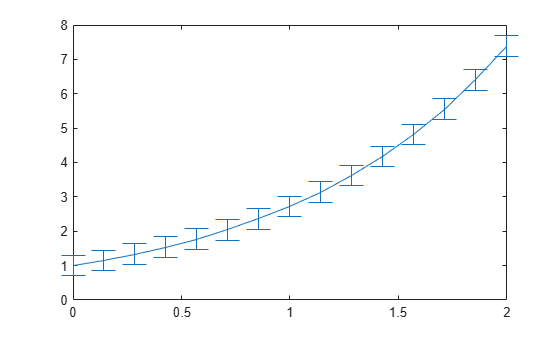
Change Cap Size and Prevent Overlap With Plot Box
Control the size of the caps at the end of each error bar by setting the CapSize property to a positive value in points.
x = linspace(0,2,15);
y = exp(x);
err = 0.3*ones(size(y));
e = errorbar(x,y,err,'CapSize',18);
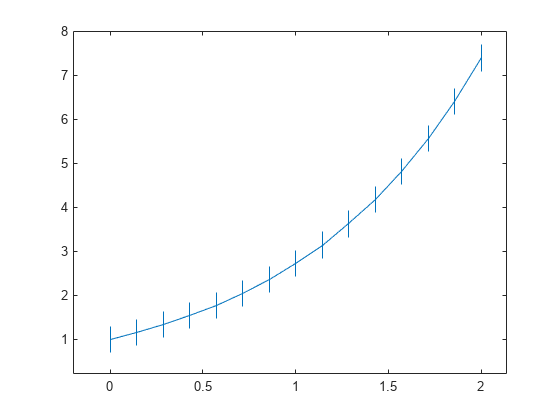
To remove the caps, set the cap size to zero. Then add a margin of padding around the inside of the plot box by calling the axis padded command. Adding this margin keeps the error bars from overlapping with the plot box.
e.CapSize = 0;
axis padded
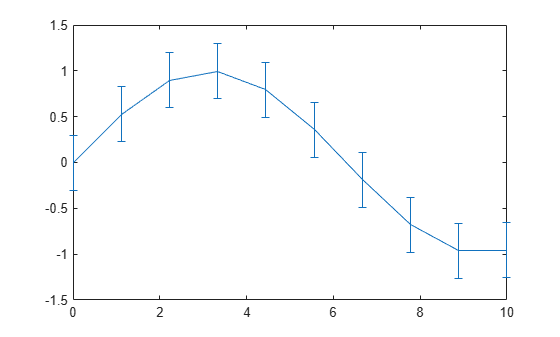
Modify Error Bars After Creation
Create a line plot with error bars. Assign the errorbar object to the variable e.
x = linspace(0,10,10);
y = sin(x/2);
err = 0.3*ones(size(y));
e = errorbar(x,y,err)
e =
  ErrorBar with properties:

             Color: [0 0.4470 0.7410]
         LineStyle: '-'
         LineWidth: 0.5000
            Marker: 'none'
             XData: [0 1.1111 2.2222 3.3333 4.4444 5.5556 6.6667 7.7778 ... ]
             YData: [0 0.5274 0.8962 0.9954 0.7952 0.3558 -0.1906 ... ]
    XNegativeDelta: [1x0 double]
    XPositiveDelta: [1x0 double]
    YNegativeDelta: [0.3000 0.3000 0.3000 0.3000 0.3000 0.3000 0.3000 ... ]
    YPositiveDelta: [0.3000 0.3000 0.3000 0.3000 0.3000 0.3000 0.3000 ... ]

  Show all properties
Use e to access properties of the errorbar object after it is created.
e.Marker = '*';
e.MarkerSize = 10;
e.Color = 'red';
e.CapSize = 15;

Input Arguments
collapse all
y — y-coordinates
vector | matrix
y-coordinates, specified as a vector or matrix. The
size and shape of y depend on the size and shape of your
data and the type of plot you want to make. This table describes the most
common types of plots you can create.
| Type of Plot | Coordinates and Error Bar Lengths |
|---|---|
| One line with error bars |
Specify all coordinates and error bar lengths y = 1:5; err = [0.3 0.1 0.3 0.1 0.3]; errorbar(y,err) xlim([0.9 5.1]) Optionally specify x = [0; 1; 2; 3; 4]; y = 1:5; err = [0.3 0.1 0.3 0.1 0.3]; errorbar(x,y,err) xlim([-0.1 4.1]) |
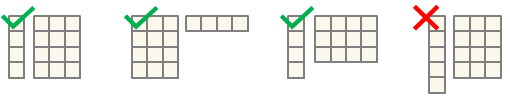
| Multiple lines with error bars |
Specify one or more of the coordinate inputs or MATLAB® plots one line for each column in the
For example, plot five lines that y = [1 2 3 4 5;
2 3 4 5 6];
err = [0.2 0.1 0.3 0.1 0.2;
0.1 0.3 0.4 0.3 0.1];
errorbar(y,err)
xlim([0.95 2.05])
Using the same x = [0 1 2 3 4;
10 11 12 13 14];
y = [1 2 3 4 5];
err = [0.2 0.1 0.3 0.1 0.2;
0.1 0.3 0.4 0.3 0.1];
errorbar(x,y,err)
xlim([-0.5 14.5])
|
Data Types: single | double | int8 | int16 | int32 | int64 | uint8 | uint16 | uint32 | uint64 | logical | categorical | datetime | duration
x — x-coordinates
vector | matrix
x-coordinates, specified as a vector or matrix. The
size and shape of x depend on the size and shape of your
data and the type of plot you want to make. This table describes the most
common types of plots you can create.
| Type of Plot | Coordinates and Error Bar Lengths |
|---|---|
| One line with error bars |
Specify all coordinates and error bar lengths x = 0:4; y = [1; 2; 3; 4; 5]; err = [0.2 0.1 0.3 0.1 0.2]; errorbar(x,y,err) xlim([-0.1 4.1]) |
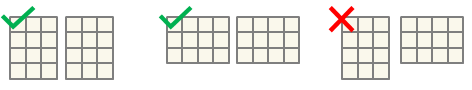
| Multiple lines with error bars |
Specify one or more of the coordinate inputs or MATLAB plots one line for each column in the
Otherwise, MATLAB plots one line for each row in the x = [1 1 1 1 1;
2 2 2 2 2];
y = [1 2 3 4 5;
2 3 4 5 6];
err = [0.2 0.1 0.3 0.1 0.2;
0.1 0.3 0.4 0.3 0.1];
errorbar(x,y,err)
xlim([0.95 2.05])
Using the same x = 0:4;
y = [1 2 3 4 5;
2 3 4 5 6];
err = [0.2 0.1 0.3 0.1 0.2;
0.1 0.3 0.4 0.3 0.1];
errorbar(x,y,err)
xlim([-0.1 4.1])
|
Data Types: single | double | int8 | int16 | int32 | int64 | uint8 | uint16 | uint32 | uint64 | logical | categorical | datetime | duration
err — Error bar lengths for symmetrical error bars
vector | matrix
Error bar lengths for symmetrical error bars, specified as a vector or
matrix. If you do not want to draw an error bar at a particular data point,
then specify the length as NaN. The size and shape of
err depend on the size and shape of the coordinate
inputs and how you want to distribute the error bars. This table describes
the most common types of plots you can create.
| Type of Plot | x and y |
err |
|---|---|---|
| One line with error bars |
|
Specify a row or column vector of the same x = [0; 1; 2; 3; 4]; y = 1:5; err = [0.2 0.1 0.3 0.1 0.2]; errorbar(x,y,err) xlim([-0.1 4.1]) |
| Multiple lines with error bars | At least one of x ory is a matrix |
Specify a vector that is the same length as one When you x = 1:5;
y = [1 2 3 4 5;
2 3 4 5 6];
err = [0.2 0.1 0.3 0.1 0.2];
errorbar(x,y,err)
xlim([0.90 5.1])
To display different error bars for each x = 1:5;
y = [1 2 3 4 5;
2 3 4 5 6];
err = [0.2 0.1 0.3 0.1 0.2;
0.1 0.3 0.4 0.3 0.1];
errorbar(x,y,err)
xlim([0.90 5.1])
|
The data type of the error bar lengths must be compatible with the corresponding plot data. For example, if you plot datetime values, the error bars for those values must be duration values.
Data Types: single | double | int8 | int16 | int32 | int64 | uint8 | uint16 | uint32 | uint64 | logical | duration
neg,pos — Error bar lengths in negative and positive directions
pair of vectors | pair of matrices | vector and matrix
Error bar lengths in the negative and positive directions, specified as
two comma-separated vectors, matrices, or a vector and a matrix. The
negative direction is either below or to the left of the data points,
depending on the orientation of the error bars. The positive direction is
either above or to the right of the data points.
If you want to omit the negative or positive part of the error bar at a
particular data point, then specify the length at that point as
NaN. To omit the negative or positive part at all
data points, specify an empty array for neg or
pos.
The size and shape of neg and pos
depend on the size and shape of the coordinate inputs and how you want to
distribute the error bars. This table describes the most common types of
plots you can create.
| Type of Plot | x and y |
neg and pos |
|---|---|---|
| One line with error bars |
|
Specify row or column vectors of the same length as x = [0; 1; 2; 3; 4]; y = 1:5; neg = [0.2; 0.1; 0.3; 0.05; 0.3]; pos = [0.1 0.05 0.1 0.2 0.3]; errorbar(x,y,neg,pos) xlim([-0.1 4.1]) |
| Multiple lines with error bars | At least one of x ory is a matrix |
Specify vectors that are the same length as one of When you specify vectors, those x = 0:4;
y = [1 2 3 4 5;
6 7 8 9 10];
neg = [0.2; 0.1; 0.3; 0.05; 0.3];
pos = [0.1 0.05 0.1 0.2 0.3];
errorbar(x,y,neg,pos)
xlim([-0.1 4.1])
To display different positive and negative x = 0:4;
y = [1 2 3 4 5;
6 7 8 9 10];
neg = [0.2 0.1 0.3 0.05 0.3;
3 5 3 2 2];
pos = [0.2 0.3 0.4 0.1 0.2;
4 3 3 7 3];
errorbar(x,y,neg,pos)
xlim([-0.1 4.1])
|
The data type of the error bar lengths must be compatible with the corresponding plot data. For example, if you plot datetime values, the error bars for those values must be duration values.
Data Types: single | double | int8 | int16 | int32 | int64 | uint8 | uint16 | uint32 | uint64 | logical | duration
yneg,ypos — Vertical error bar lengths in negative and positive directions
pair of vectors | pair of matrices | vector and matrix
Vertical error bar lengths in the negative and positive directions,
specified as two comma-separated vectors, matrices, or a vector and a
matrix. The negative direction is below data points, and the positive
direction is above data points.
If you want to omit the negative or positive part of the error bar at a
particular data point, then specify the length at that point as
NaN. To omit the negative or positive part at all
data points, specify an empty array for yneg or
ypos.
The size and shape of yneg and ypos
depend on the size and shape of the coordinate inputs and how you want to
distribute the error bars. This table describes the most common types of
plots you can create.
| Type of Plot | x and y |
yneg andypos |
|---|---|---|
| One line with error bars |
|
Specify row or column vectors of the same length as x = [0; 1; 2; 3; 4]; y = 1:5; yneg = [0.2; 0.1; 0.3; 0.05; 0.3]; ypos = [0.1 0.05 0.1 0.2 0.3]; xneg = [0.1; 0.1; 0.1; 0.1; 0.1]; xpos = [0.1 0.1 0.1 0.1 0.1]; errorbar(x,y,yneg,ypos,xneg,xpos) xlim([-0.2 4.2]) |
| Multiple lines with error bars | At least one of x ory is a matrix |
Specify vectors that are the same length as one of When you specify vectors, those x = 0:4;
y = [1 2 3 4 5;
6 7 8 9 10];
yneg = [0.2; 0.3; 0.3; 0.1; 0.3];
ypos = [0.1 0.4 0.1 0.2 0.3];
errorbar(x,y,yneg,ypos,[],[])
xlim([-0.2 4.2])
To display different positive and negative x = 0:4;
y = [1 2 3 4 5;
6 7 8 9 10];
yneg = [0.3 1 0.2 0.5 0.3;
0.3 0.2 0.3 1 0.5];
ypos = [1 0.4 0.3 0.2 0.3;
0.4 0.5 0.2 0.4 1];
errorbar(x,y,yneg,ypos,[],[])
xlim([-0.2 4.2])
|
The data type of the error bar lengths must be compatible with the corresponding plot data. For example, if you plot datetime values, the error bars for those values must be duration values.
Data Types: single | double | int8 | int16 | int32 | int64 | uint8 | uint16 | uint32 | uint64 | logical | duration
xneg,xpos — Horizontal error bar lengths in negative and positive directions
pair of vectors | pair of matrices | vector and matrix
Horizontal error bar lengths in the negative and positive directions,
specified as two comma-separated vectors, matrices, or a vector and a
matrix. The negative direction is to the left of the data points, and the
positive direction is to the right of the data points.
If you want to omit the negative or positive part of the error bar at a
particular data point, specify the length at that point as
NaN. To omit the negative or positive part at all
data points, then specify an empty array for xneg or
xpos.
The size and shape of xneg and xpos
depends on the size and shape of the coordinate inputs and how you want to
distribute the error bars. This table describes the most common types of
plots you can create.
| Type of Plot | x and y |
xneg andxpos |
|---|---|---|
| One line with error bars |
|
Specify row or column vectors of the same length as x = [0; 1; 2; 3; 4]; y = 1:5; yneg = [0.2; 0.1; 0.3; 0.05; 0.3]; ypos = [0.1 0.05 0.1 0.2 0.3]; xneg = [0.1; 0.1; 0.1; 0.1; 0.1]; xpos = [0.1 0.1 0.1 0.1 0.1]; errorbar(x,y,yneg,ypos,xneg,xpos) xlim([-0.2 4.2]) |
| Multiple lines with error bars | At least one of x ory is a matrix |
Specify vectors that are the same length as one of When you specify vectors, those x = 0:4;
y = [1 2 3 4 5;
6 7 8 9 10];
xneg = [0.2; 0.3; 0.3; 0.1; 0.3];
xpos = [0.1 0.4 0.1 0.2 0.3];
errorbar(x,y,[],[],xneg,xpos)
xlim([-0.5 4.5])
ylim([0.5 10.5])
To display different positive and negative x = 0:4;
y = [1 2 3 4 5;
6 7 8 9 10];
xneg = [0.3 1 0.2 0.5 0.3;
0.3 0.2 0.3 1 0.5];
xpos = [1 0.4 0.3 0.2 0.3;
0.4 0.5 0.2 0.4 1];
errorbar(x,y,[],[],xneg,xpos)
xlim([-0.5 5.5])
ylim([0.5 10.5])
|
The data type of the error bar lengths must be compatible with the corresponding plot data. For example, if you plot datetime values, the error bars for those values must be duration values.
Data Types: single | double | int8 | int16 | int32 | int64 | uint8 | uint16 | uint32 | uint64 | logical | duration
ornt — Error bar orientation
"vertical" (default) | "horizontal" | "both"
Error bar orientation, specified as one of these values:
-
"vertical"— Vertical error
bars -
"horizontal"— Horizontal error
bars -
"both"— Vertical and horizontal
error bars
Example: errorbar(x,y,err,"horizontal")
LineSpec — Line style, marker, and color
string | character vector
Line style, marker, and color, specified as a string or character vector containing symbols.
The symbols can appear in any order. You do not need to specify all three
characteristics (line style, marker, and color). For example, if you omit the line style
and specify the marker, then the plot shows only the marker and no line.
Example: "--or" is a red dashed line with circle markers
| Line Style | Description | Resulting Line |
|---|---|---|
"-" |
Solid line |
|
"--" |
Dashed line |
|
":" |
Dotted line |
|
"-." |
Dash-dotted line |
|
| Marker | Description | Resulting Marker |
|---|---|---|
"o" |
Circle |
|
"+" |
Plus sign |
|
"*" |
Asterisk |
|
"." |
Point |
|
"x" |
Cross |
|
"_" |
Horizontal line |
|
"|" |
Vertical line |
|
"square" |
Square |
|
"diamond" |
Diamond |
|
"^" |
Upward-pointing triangle |
|
"v" |
Downward-pointing triangle |
|
">" |
Right-pointing triangle |
|
"<" |
Left-pointing triangle |
|
"pentagram" |
Pentagram |
|
"hexagram" |
Hexagram |
|
| Color Name | Short Name | RGB Triplet | Appearance |
|---|---|---|---|
"red" |
"r" |
[1 0 0] |
|
"green" |
"g" |
[0 1 0] |
|
"blue" |
"b" |
[0 0 1] |
|
"cyan"
|
"c" |
[0 1 1] |
|
"magenta" |
"m" |
[1 0 1] |
|
"yellow" |
"y" |
[1 1 0] |
|
"black" |
"k" |
[0 0 0] |
|
"white" |
"w" |
[1 1 1] |
|
ax — Axes object
current axes (default) | axes object
Axes object. If you do not specify the axes, then errorbar plots
into the current axes.
Name-Value Arguments
Specify optional pairs of arguments as
Name1=Value1,...,NameN=ValueN, where Name is
the argument name and Value is the corresponding value.
Name-value arguments must appear after other arguments, but the order of the
pairs does not matter.
Before R2021a, use commas to separate each name and value, and enclose
Name in quotes.
Example: errorbar(y,err,"LineWidth",2) specifies a line width of 2
points.
The properties listed here are only a subset. For a complete
list, see ErrorBar Properties.
CapSize — Length of caps at end of error bars
6 (default) | nonnegative value in points
Length of caps at end of error bars, specified as a nonnegative value in points. To remove the
caps from the error bars, set CapSize to
0.
Example: errorbar(x,y,err,"CapSize",10)
Line width, specified as a positive value in points, where 1 point = 1/72 of an inch. If the
line has markers, then the line width also affects the marker
edges.
The line width cannot be thinner than the width of a pixel. If you set the line width
to a value that is less than the width of a pixel on your system, the line displays as
one pixel wide.
More About
collapse all
Specifying Coordinates as Combinations of Vectors and Matrices
errorbar accepts combinations of vectors
and matrices for plotting multiple sets of coordinates in the same axes.
Specify a vector and a matrix when the coordinates in one dimension are shared.
The length of the vector must match one of the dimensions of the matrix. The rows
(or columns) of the matrix are plotted against the vector. For example, you can
specify the x-coordinates as an m-element
vector and the y-coordinates as an
m-by-n matrix. MATLAB displays n plots in the same axes that share the
same x-coordinates.
Specify two matrices when the coordinates are different among all the plots in
both dimensions. Both matrices must have the same size and orientation. The columns
of the matrices are plotted against each other.
Extended Capabilities
GPU Arrays
Accelerate code by running on a graphics processing unit (GPU) using Parallel Computing Toolbox™.
Usage notes and limitations:
-
This function accepts GPU arrays, but does not run on a GPU.
For more information, see Run MATLAB Functions on a GPU (Parallel Computing Toolbox).
Distributed Arrays
Partition large arrays across the combined memory of your cluster using Parallel Computing Toolbox™.
Usage notes and limitations:
-
This function operates on distributed arrays, but executes in the client MATLAB.
For more information, see Run MATLAB Functions with Distributed Arrays (Parallel Computing Toolbox).
Version History
Introduced before R2006a
expand all
R2022b: Plot multiple data sets at once using matrices
The errorbar function now accepts the same combinations of
matrices and vectors as the plot function does. As a result,
you can plot multiple data sets at once rather than calling the
hold function between plotting commands.
Line plot with error bars
Syntax
Description
errorbar( createsy,err)
a line plot of the data in y and draws a vertical
error bar at each data point. The values in err determine
the lengths of each error bar above and below the data points, so
the total error bar lengths are double the err values.
example
errorbar( plots x,y,err)y versus x and
draws a vertical error bar at each data point.
errorbar(x,y,neg,pos)
draws a vertical error bar at each data point, where neg
determines the length below the data point and pos determines
the length above the data point, respectively.
example
errorbar(___, sets the orientationornt)
of the error bars. Specify ornt as
"horizontal" for horizontal error bars or
"both" for both horizontal and vertical error bars. The
default for ornt is "vertical", which
draws vertical error bars. Use this option after any of the previous input
argument combinations.
example
errorbar(x,y,yneg,ypos,xneg,xpos)
plots y versus x and draws both horizontal
and vertical error bars. yneg and ypos set
the lower and upper lengths of the vertical error bars, respectively. Similarly,
xneg and xpos set the left and right
lengths of the horizontal error bars.
example
errorbar(___, sets the lineLineSpec)
style, marker symbol, and color. For example, "--ro" plots a
dashed, red line with circle markers. The line style affects only the line and
not the error bars.
example
errorbar(___, modifies theName,Value)
appearance of the line and error bars using one or more name-value pair
arguments. For example, "CapSize",10 sets the lengths of the
caps at the end of each error bar to 10 points.
errorbar( createsax,___)
the plot in the axes specified by ax instead of
in the current axes. Specify the axes as the first input argument.
example
e = errorbar(___)ErrorBar object for each plotted line. Use
e to modify properties of a specific ErrorBar object after it is created. For a list of
properties, see ErrorBar Properties.
Examples
collapse all
Plot Vertical Error Bars of Equal Length
Create vectors x and y. Plot y versus x. At each data point, display vertical error bars that are equal in length.
x = 1:10:100;
y = [20 30 45 40 60 65 80 75 95 90];
err = 8*ones(size(y));
errorbar(x,y,err)
Plot Vertical Error Bars that Vary in Length
Create a line plot with error bars at each data point. Vary the lengths of the error bars.
x = 1:10:100;
y = [20 30 45 40 60 65 80 75 95 90];
err = [5 8 2 9 3 3 8 3 9 3];
errorbar(x,y,err)

Plot Horizontal Error Bars
Create a line plot with horizontal error bars at each data point.
x = 1:10:100;
y = [20 30 45 40 60 65 80 75 95 90];
err = [1 3 5 3 5 3 6 4 3 3];
errorbar(x,y,err,'horizontal')
Plot Vertical and Horizontal Error Bars
Create a line plot with both vertical and horizontal error bars at each data point.
x = 1:10:100;
y = [20 30 45 40 60 65 80 75 95 90];
err = [4 3 5 3 5 3 6 4 3 3];
errorbar(x,y,err,'both')
Plot Error Bars with No Line
Plot vectors y versus x. At each data point, display a circle marker with both vertical and horizontal error bars. Do not display the line that connects the data points by omitting the line style option for the linespec input argument.
x = 1:10:100;
y = [20 30 45 40 60 65 80 75 95 90];
err = [4 3 5 3 5 3 6 4 3 3];
errorbar(x,y,err,"both","o")

Alternatvely, omit the markers and plot the error bars by themselves. To do this, specify the LineStyle name-value argument as "none".
errorbar(x,y,err,"both","LineStyle","none")

Control Error Bars Lengths in All Directions
Display both vertical and horizontal error bars at each data point. Control the lower and upper lengths of the vertical error bars using the yneg and ypos input argument options, respectively. Control the left and right lengths of the horizontal error bars using the xneg and xpos input argument options, respectively.
x = 1:10:100;
y = [20 30 45 40 60 65 80 75 95 90];
yneg = [1 3 5 3 5 3 6 4 3 3];
ypos = [2 5 3 5 2 5 2 2 5 5];
xneg = [1 3 5 3 5 3 6 4 3 3];
xpos = [2 5 3 5 2 5 2 2 5 5];
errorbar(x,y,yneg,ypos,xneg,xpos,'o')

Plot Datetime Values with Error Bars
Create a plot of datetime values with error bars in duration units.
x = 1:13;
y = datetime(2018,5,1,1:13,0,0);
err = hours(rand(13,1));
errorbar(x,y,err)

Add Colored Markers to Each Data Point
Create a line plot with error bars. At each data point, display a marker. Change the appearance of the marker using name-value arguments. Use MarkerSize to specify the marker size in points. Use MarkerEdgeColor and MarkerFaceColor to specify the marker outline and fill colors, respectively. You can specify colors by name, such as «blue", as RGB triplets, or hexadecimal color codes.
x = linspace(0,10,15);
y = sin(x/2);
err = 0.3*ones(size(y));
errorbar(x,y,err,"-s","MarkerSize",10,...
    "MarkerEdgeColor","blue","MarkerFaceColor",[0.65 0.85 0.90])

Change Cap Size and Prevent Overlap With Plot Box
Control the size of the caps at the end of each error bar by setting the CapSize property to a positive value in points.
x = linspace(0,2,15);
y = exp(x);
err = 0.3*ones(size(y));
e = errorbar(x,y,err,'CapSize',18);
To remove the caps, set the cap size to zero. Then add a margin of padding around the inside of the plot box by calling the axis padded command. Adding this margin keeps the error bars from overlapping with the plot box.
e.CapSize = 0;
axis padded

Modify Error Bars After Creation
Create a line plot with error bars. Assign the errorbar object to the variable e.
x = linspace(0,10,10);
y = sin(x/2);
err = 0.3*ones(size(y));
e = errorbar(x,y,err)
e =
  ErrorBar with properties:

             Color: [0 0.4470 0.7410]
         LineStyle: '-'
         LineWidth: 0.5000
            Marker: 'none'
             XData: [0 1.1111 2.2222 3.3333 4.4444 5.5556 6.6667 7.7778 ... ]
             YData: [0 0.5274 0.8962 0.9954 0.7952 0.3558 -0.1906 ... ]
    XNegativeDelta: [1x0 double]
    XPositiveDelta: [1x0 double]
    YNegativeDelta: [0.3000 0.3000 0.3000 0.3000 0.3000 0.3000 0.3000 ... ]
    YPositiveDelta: [0.3000 0.3000 0.3000 0.3000 0.3000 0.3000 0.3000 ... ]

  Show all properties
Use e to access properties of the errorbar object after it is created.
e.Marker = '*';
e.MarkerSize = 10;
e.Color = 'red';
e.CapSize = 15;
Input Arguments
collapse all
y — y-coordinates
vector | matrix
y-coordinates, specified as a vector or matrix. The
size and shape of y depend on the size and shape of your
data and the type of plot you want to make. This table describes the most
common types of plots you can create.
| Type of Plot | Coordinates and Error Bar Lengths |
|---|---|
| One line with error bars |
Specify all coordinates and error bar lengths y = 1:5; err = [0.3 0.1 0.3 0.1 0.3]; errorbar(y,err) xlim([0.9 5.1]) Optionally specify x = [0; 1; 2; 3; 4]; y = 1:5; err = [0.3 0.1 0.3 0.1 0.3]; errorbar(x,y,err) xlim([-0.1 4.1]) |
| Multiple lines with error bars |
Specify one or more of the coordinate inputs or MATLAB® plots one line for each column in the
For example, plot five lines that y = [1 2 3 4 5;
2 3 4 5 6];
err = [0.2 0.1 0.3 0.1 0.2;
0.1 0.3 0.4 0.3 0.1];
errorbar(y,err)
xlim([0.95 2.05])
Using the same x = [0 1 2 3 4;
10 11 12 13 14];
y = [1 2 3 4 5];
err = [0.2 0.1 0.3 0.1 0.2;
0.1 0.3 0.4 0.3 0.1];
errorbar(x,y,err)
xlim([-0.5 14.5])
|
Data Types: single | double | int8 | int16 | int32 | int64 | uint8 | uint16 | uint32 | uint64 | logical | categorical | datetime | duration
x — x-coordinates
vector | matrix
x-coordinates, specified as a vector or matrix. The
size and shape of x depend on the size and shape of your
data and the type of plot you want to make. This table describes the most
common types of plots you can create.
| Type of Plot | Coordinates and Error Bar Lengths |
|---|---|
| One line with error bars |
Specify all coordinates and error bar lengths x = 0:4; y = [1; 2; 3; 4; 5]; err = [0.2 0.1 0.3 0.1 0.2]; errorbar(x,y,err) xlim([-0.1 4.1]) |
| Multiple lines with error bars |
Specify one or more of the coordinate inputs or MATLAB plots one line for each column in the
Otherwise, MATLAB plots one line for each row in the x = [1 1 1 1 1;
2 2 2 2 2];
y = [1 2 3 4 5;
2 3 4 5 6];
err = [0.2 0.1 0.3 0.1 0.2;
0.1 0.3 0.4 0.3 0.1];
errorbar(x,y,err)
xlim([0.95 2.05])
Using the same x = 0:4;
y = [1 2 3 4 5;
2 3 4 5 6];
err = [0.2 0.1 0.3 0.1 0.2;
0.1 0.3 0.4 0.3 0.1];
errorbar(x,y,err)
xlim([-0.1 4.1])
|
Data Types: single | double | int8 | int16 | int32 | int64 | uint8 | uint16 | uint32 | uint64 | logical | categorical | datetime | duration
err — Error bar lengths for symmetrical error bars
vector | matrix
Error bar lengths for symmetrical error bars, specified as a vector or
matrix. If you do not want to draw an error bar at a particular data point,
then specify the length as NaN. The size and shape of
err depend on the size and shape of the coordinate
inputs and how you want to distribute the error bars. This table describes
the most common types of plots you can create.
| Type of Plot | x and y |
err |
|---|---|---|
| One line with error bars |
|
Specify a row or column vector of the same x = [0; 1; 2; 3; 4]; y = 1:5; err = [0.2 0.1 0.3 0.1 0.2]; errorbar(x,y,err) xlim([-0.1 4.1]) |
| Multiple lines with error bars | At least one of x ory is a matrix |
Specify a vector that is the same length as one When you x = 1:5;
y = [1 2 3 4 5;
2 3 4 5 6];
err = [0.2 0.1 0.3 0.1 0.2];
errorbar(x,y,err)
xlim([0.90 5.1])
To display different error bars for each x = 1:5;
y = [1 2 3 4 5;
2 3 4 5 6];
err = [0.2 0.1 0.3 0.1 0.2;
0.1 0.3 0.4 0.3 0.1];
errorbar(x,y,err)
xlim([0.90 5.1])
|
The data type of the error bar lengths must be compatible with the corresponding plot data. For example, if you plot datetime values, the error bars for those values must be duration values.
Data Types: single | double | int8 | int16 | int32 | int64 | uint8 | uint16 | uint32 | uint64 | logical | duration
neg,pos — Error bar lengths in negative and positive directions
pair of vectors | pair of matrices | vector and matrix
Error bar lengths in the negative and positive directions, specified as
two comma-separated vectors, matrices, or a vector and a matrix. The
negative direction is either below or to the left of the data points,
depending on the orientation of the error bars. The positive direction is
either above or to the right of the data points.
If you want to omit the negative or positive part of the error bar at a
particular data point, then specify the length at that point as
NaN. To omit the negative or positive part at all
data points, specify an empty array for neg or
pos.
The size and shape of neg and pos
depend on the size and shape of the coordinate inputs and how you want to
distribute the error bars. This table describes the most common types of
plots you can create.
| Type of Plot | x and y |
neg and pos |
|---|---|---|
| One line with error bars |
|
Specify row or column vectors of the same length as x = [0; 1; 2; 3; 4]; y = 1:5; neg = [0.2; 0.1; 0.3; 0.05; 0.3]; pos = [0.1 0.05 0.1 0.2 0.3]; errorbar(x,y,neg,pos) xlim([-0.1 4.1]) |
| Multiple lines with error bars | At least one of x ory is a matrix |
Specify vectors that are the same length as one of When you specify vectors, those x = 0:4;
y = [1 2 3 4 5;
6 7 8 9 10];
neg = [0.2; 0.1; 0.3; 0.05; 0.3];
pos = [0.1 0.05 0.1 0.2 0.3];
errorbar(x,y,neg,pos)
xlim([-0.1 4.1])
To display different positive and negative x = 0:4;
y = [1 2 3 4 5;
6 7 8 9 10];
neg = [0.2 0.1 0.3 0.05 0.3;
3 5 3 2 2];
pos = [0.2 0.3 0.4 0.1 0.2;
4 3 3 7 3];
errorbar(x,y,neg,pos)
xlim([-0.1 4.1])
|
The data type of the error bar lengths must be compatible with the corresponding plot data. For example, if you plot datetime values, the error bars for those values must be duration values.
Data Types: single | double | int8 | int16 | int32 | int64 | uint8 | uint16 | uint32 | uint64 | logical | duration
yneg,ypos — Vertical error bar lengths in negative and positive directions
pair of vectors | pair of matrices | vector and matrix
Vertical error bar lengths in the negative and positive directions,
specified as two comma-separated vectors, matrices, or a vector and a
matrix. The negative direction is below data points, and the positive
direction is above data points.
If you want to omit the negative or positive part of the error bar at a
particular data point, then specify the length at that point as
NaN. To omit the negative or positive part at all
data points, specify an empty array for yneg or
ypos.
The size and shape of yneg and ypos
depend on the size and shape of the coordinate inputs and how you want to
distribute the error bars. This table describes the most common types of
plots you can create.
| Type of Plot | x and y |
yneg andypos |
|---|---|---|
| One line with error bars |
|
Specify row or column vectors of the same length as x = [0; 1; 2; 3; 4]; y = 1:5; yneg = [0.2; 0.1; 0.3; 0.05; 0.3]; ypos = [0.1 0.05 0.1 0.2 0.3]; xneg = [0.1; 0.1; 0.1; 0.1; 0.1]; xpos = [0.1 0.1 0.1 0.1 0.1]; errorbar(x,y,yneg,ypos,xneg,xpos) xlim([-0.2 4.2]) |
| Multiple lines with error bars | At least one of x ory is a matrix |
Specify vectors that are the same length as one of When you specify vectors, those x = 0:4;
y = [1 2 3 4 5;
6 7 8 9 10];
yneg = [0.2; 0.3; 0.3; 0.1; 0.3];
ypos = [0.1 0.4 0.1 0.2 0.3];
errorbar(x,y,yneg,ypos,[],[])
xlim([-0.2 4.2])
To display different positive and negative x = 0:4;
y = [1 2 3 4 5;
6 7 8 9 10];
yneg = [0.3 1 0.2 0.5 0.3;
0.3 0.2 0.3 1 0.5];
ypos = [1 0.4 0.3 0.2 0.3;
0.4 0.5 0.2 0.4 1];
errorbar(x,y,yneg,ypos,[],[])
xlim([-0.2 4.2])
|
The data type of the error bar lengths must be compatible with the corresponding plot data. For example, if you plot datetime values, the error bars for those values must be duration values.
Data Types: single | double | int8 | int16 | int32 | int64 | uint8 | uint16 | uint32 | uint64 | logical | duration
xneg,xpos — Horizontal error bar lengths in negative and positive directions
pair of vectors | pair of matrices | vector and matrix
Horizontal error bar lengths in the negative and positive directions,
specified as two comma-separated vectors, matrices, or a vector and a
matrix. The negative direction is to the left of the data points, and the
positive direction is to the right of the data points.
If you want to omit the negative or positive part of the error bar at a
particular data point, specify the length at that point as
NaN. To omit the negative or positive part at all
data points, then specify an empty array for xneg or
xpos.
The size and shape of xneg and xpos
depends on the size and shape of the coordinate inputs and how you want to
distribute the error bars. This table describes the most common types of
plots you can create.
| Type of Plot | x and y |
xneg andxpos |
|---|---|---|
| One line with error bars |
|
Specify row or column vectors of the same length as x = [0; 1; 2; 3; 4]; y = 1:5; yneg = [0.2; 0.1; 0.3; 0.05; 0.3]; ypos = [0.1 0.05 0.1 0.2 0.3]; xneg = [0.1; 0.1; 0.1; 0.1; 0.1]; xpos = [0.1 0.1 0.1 0.1 0.1]; errorbar(x,y,yneg,ypos,xneg,xpos) xlim([-0.2 4.2]) |
| Multiple lines with error bars | At least one of x ory is a matrix |
Specify vectors that are the same length as one of When you specify vectors, those x = 0:4;
y = [1 2 3 4 5;
6 7 8 9 10];
xneg = [0.2; 0.3; 0.3; 0.1; 0.3];
xpos = [0.1 0.4 0.1 0.2 0.3];
errorbar(x,y,[],[],xneg,xpos)
xlim([-0.5 4.5])
ylim([0.5 10.5])
To display different positive and negative x = 0:4;
y = [1 2 3 4 5;
6 7 8 9 10];
xneg = [0.3 1 0.2 0.5 0.3;
0.3 0.2 0.3 1 0.5];
xpos = [1 0.4 0.3 0.2 0.3;
0.4 0.5 0.2 0.4 1];
errorbar(x,y,[],[],xneg,xpos)
xlim([-0.5 5.5])
ylim([0.5 10.5])
|
The data type of the error bar lengths must be compatible with the corresponding plot data. For example, if you plot datetime values, the error bars for those values must be duration values.
Data Types: single | double | int8 | int16 | int32 | int64 | uint8 | uint16 | uint32 | uint64 | logical | duration
ornt — Error bar orientation
"vertical" (default) | "horizontal" | "both"
Error bar orientation, specified as one of these values:
-
"vertical"— Vertical error
bars -
"horizontal"— Horizontal error
bars -
"both"— Vertical and horizontal
error bars
Example: errorbar(x,y,err,"horizontal")
LineSpec — Line style, marker, and color
string | character vector
Line style, marker, and color, specified as a string or character vector containing symbols.
The symbols can appear in any order. You do not need to specify all three
characteristics (line style, marker, and color). For example, if you omit the line style
and specify the marker, then the plot shows only the marker and no line.
Example: "--or" is a red dashed line with circle markers
| Line Style | Description | Resulting Line |
|---|---|---|
"-" |
Solid line |
|
"--" |
Dashed line |
|
":" |
Dotted line |
|
"-." |
Dash-dotted line |
|
| Marker | Description | Resulting Marker |
|---|---|---|
"o" |
Circle |
|
"+" |
Plus sign |
|
"*" |
Asterisk |
|
"." |
Point |
|
"x" |
Cross |
|
"_" |
Horizontal line |
|
"|" |
Vertical line |
|
"square" |
Square |
|
"diamond" |
Diamond |
|
"^" |
Upward-pointing triangle |
|
"v" |
Downward-pointing triangle |
|
">" |
Right-pointing triangle |
|
"<" |
Left-pointing triangle |
|
"pentagram" |
Pentagram |
|
"hexagram" |
Hexagram |
|
| Color Name | Short Name | RGB Triplet | Appearance |
|---|---|---|---|
"red" |
"r" |
[1 0 0] |
|
"green" |
"g" |
[0 1 0] |
|
"blue" |
"b" |
[0 0 1] |
|
"cyan"
|
"c" |
[0 1 1] |
|
"magenta" |
"m" |
[1 0 1] |
|
"yellow" |
"y" |
[1 1 0] |
|
"black" |
"k" |
[0 0 0] |
|
"white" |
"w" |
[1 1 1] |
|
ax — Axes object
current axes (default) | axes object
Axes object. If you do not specify the axes, then errorbar plots
into the current axes.
Name-Value Arguments
Specify optional pairs of arguments as
Name1=Value1,...,NameN=ValueN, where Name is
the argument name and Value is the corresponding value.
Name-value arguments must appear after other arguments, but the order of the
pairs does not matter.
Before R2021a, use commas to separate each name and value, and enclose
Name in quotes.
Example: errorbar(y,err,"LineWidth",2) specifies a line width of 2
points.
The properties listed here are only a subset. For a complete
list, see ErrorBar Properties.
CapSize — Length of caps at end of error bars
6 (default) | nonnegative value in points
Length of caps at end of error bars, specified as a nonnegative value in points. To remove the
caps from the error bars, set CapSize to
0.
Example: errorbar(x,y,err,"CapSize",10)
Line width, specified as a positive value in points, where 1 point = 1/72 of an inch. If the
line has markers, then the line width also affects the marker
edges.
The line width cannot be thinner than the width of a pixel. If you set the line width
to a value that is less than the width of a pixel on your system, the line displays as
one pixel wide.
More About
collapse all
Specifying Coordinates as Combinations of Vectors and Matrices
errorbar accepts combinations of vectors
and matrices for plotting multiple sets of coordinates in the same axes.
Specify a vector and a matrix when the coordinates in one dimension are shared.
The length of the vector must match one of the dimensions of the matrix. The rows
(or columns) of the matrix are plotted against the vector. For example, you can
specify the x-coordinates as an m-element
vector and the y-coordinates as an
m-by-n matrix. MATLAB displays n plots in the same axes that share the
same x-coordinates.

Specify two matrices when the coordinates are different among all the plots in
both dimensions. Both matrices must have the same size and orientation. The columns
of the matrices are plotted against each other.

Extended Capabilities
GPU Arrays
Accelerate code by running on a graphics processing unit (GPU) using Parallel Computing Toolbox™.
Usage notes and limitations:
-
This function accepts GPU arrays, but does not run on a GPU.
For more information, see Run MATLAB Functions on a GPU (Parallel Computing Toolbox).
Distributed Arrays
Partition large arrays across the combined memory of your cluster using Parallel Computing Toolbox™.
Usage notes and limitations:
-
This function operates on distributed arrays, but executes in the client MATLAB.
For more information, see Run MATLAB Functions with Distributed Arrays (Parallel Computing Toolbox).
Version History
Introduced before R2006a
expand all
R2022b: Plot multiple data sets at once using matrices
The errorbar function now accepts the same combinations of
matrices and vectors as the plot function does. As a result,
you can plot multiple data sets at once rather than calling the
hold function between plotting commands.
Line plot with error bars
Syntax
Description
errorbar( createsy,err)
a line plot of the data in y and draws a vertical
error bar at each data point. The values in err determine
the lengths of each error bar above and below the data points, so
the total error bar lengths are double the err values.
example
errorbar( plots x,y,err)y versus x and
draws a vertical error bar at each data point.
errorbar(x,y,neg,pos)
draws a vertical error bar at each data point, where neg
determines the length below the data point and pos determines
the length above the data point, respectively.
example
errorbar(___, sets the orientationornt)
of the error bars. Specify ornt as
"horizontal" for horizontal error bars or
"both" for both horizontal and vertical error bars. The
default for ornt is "vertical", which
draws vertical error bars. Use this option after any of the previous input
argument combinations.
example
errorbar(x,y,yneg,ypos,xneg,xpos)
plots y versus x and draws both horizontal
and vertical error bars. yneg and ypos set
the lower and upper lengths of the vertical error bars, respectively. Similarly,
xneg and xpos set the left and right
lengths of the horizontal error bars.
example
errorbar(___, sets the lineLineSpec)
style, marker symbol, and color. For example, "--ro" plots a
dashed, red line with circle markers. The line style affects only the line and
not the error bars.
example
errorbar(___, modifies theName,Value)
appearance of the line and error bars using one or more name-value pair
arguments. For example, "CapSize",10 sets the lengths of the
caps at the end of each error bar to 10 points.
errorbar( createsax,___)
the plot in the axes specified by ax instead of
in the current axes. Specify the axes as the first input argument.
example
e = errorbar(___)ErrorBar object for each plotted line. Use
e to modify properties of a specific ErrorBar object after it is created. For a list of
properties, see ErrorBar Properties.
Examples
collapse all
Plot Vertical Error Bars of Equal Length
Create vectors x and y. Plot y versus x. At each data point, display vertical error bars that are equal in length.
x = 1:10:100;
y = [20 30 45 40 60 65 80 75 95 90];
err = 8*ones(size(y));
errorbar(x,y,err)

Plot Vertical Error Bars that Vary in Length
Create a line plot with error bars at each data point. Vary the lengths of the error bars.
x = 1:10:100;
y = [20 30 45 40 60 65 80 75 95 90];
err = [5 8 2 9 3 3 8 3 9 3];
errorbar(x,y,err)

Plot Horizontal Error Bars
Create a line plot with horizontal error bars at each data point.
x = 1:10:100;
y = [20 30 45 40 60 65 80 75 95 90];
err = [1 3 5 3 5 3 6 4 3 3];
errorbar(x,y,err,'horizontal')

Plot Vertical and Horizontal Error Bars
Create a line plot with both vertical and horizontal error bars at each data point.
x = 1:10:100;
y = [20 30 45 40 60 65 80 75 95 90];
err = [4 3 5 3 5 3 6 4 3 3];
errorbar(x,y,err,'both')
Plot Error Bars with No Line
Plot vectors y versus x. At each data point, display a circle marker with both vertical and horizontal error bars. Do not display the line that connects the data points by omitting the line style option for the linespec input argument.
x = 1:10:100;
y = [20 30 45 40 60 65 80 75 95 90];
err = [4 3 5 3 5 3 6 4 3 3];
errorbar(x,y,err,"both","o")

Alternatvely, omit the markers and plot the error bars by themselves. To do this, specify the LineStyle name-value argument as "none".
errorbar(x,y,err,"both","LineStyle","none")

Control Error Bars Lengths in All Directions
Display both vertical and horizontal error bars at each data point. Control the lower and upper lengths of the vertical error bars using the yneg and ypos input argument options, respectively. Control the left and right lengths of the horizontal error bars using the xneg and xpos input argument options, respectively.
x = 1:10:100;
y = [20 30 45 40 60 65 80 75 95 90];
yneg = [1 3 5 3 5 3 6 4 3 3];
ypos = [2 5 3 5 2 5 2 2 5 5];
xneg = [1 3 5 3 5 3 6 4 3 3];
xpos = [2 5 3 5 2 5 2 2 5 5];
errorbar(x,y,yneg,ypos,xneg,xpos,'o')

Plot Datetime Values with Error Bars
Create a plot of datetime values with error bars in duration units.
x = 1:13;
y = datetime(2018,5,1,1:13,0,0);
err = hours(rand(13,1));
errorbar(x,y,err)

Add Colored Markers to Each Data Point
Create a line plot with error bars. At each data point, display a marker. Change the appearance of the marker using name-value arguments. Use MarkerSize to specify the marker size in points. Use MarkerEdgeColor and MarkerFaceColor to specify the marker outline and fill colors, respectively. You can specify colors by name, such as «blue", as RGB triplets, or hexadecimal color codes.
x = linspace(0,10,15);
y = sin(x/2);
err = 0.3*ones(size(y));
errorbar(x,y,err,"-s","MarkerSize",10,...
    "MarkerEdgeColor","blue","MarkerFaceColor",[0.65 0.85 0.90])

Change Cap Size and Prevent Overlap With Plot Box
Control the size of the caps at the end of each error bar by setting the CapSize property to a positive value in points.
x = linspace(0,2,15);
y = exp(x);
err = 0.3*ones(size(y));
e = errorbar(x,y,err,'CapSize',18);

To remove the caps, set the cap size to zero. Then add a margin of padding around the inside of the plot box by calling the axis padded command. Adding this margin keeps the error bars from overlapping with the plot box.
e.CapSize = 0;
axis padded

Modify Error Bars After Creation
Create a line plot with error bars. Assign the errorbar object to the variable e.
x = linspace(0,10,10);
y = sin(x/2);
err = 0.3*ones(size(y));
e = errorbar(x,y,err)

e =
  ErrorBar with properties:

             Color: [0 0.4470 0.7410]
         LineStyle: '-'
         LineWidth: 0.5000
            Marker: 'none'
             XData: [0 1.1111 2.2222 3.3333 4.4444 5.5556 6.6667 7.7778 ... ]
             YData: [0 0.5274 0.8962 0.9954 0.7952 0.3558 -0.1906 ... ]
    XNegativeDelta: [1x0 double]
    XPositiveDelta: [1x0 double]
    YNegativeDelta: [0.3000 0.3000 0.3000 0.3000 0.3000 0.3000 0.3000 ... ]
    YPositiveDelta: [0.3000 0.3000 0.3000 0.3000 0.3000 0.3000 0.3000 ... ]

  Show all properties
Use e to access properties of the errorbar object after it is created.
e.Marker = '*';
e.MarkerSize = 10;
e.Color = 'red';
e.CapSize = 15;

Input Arguments
collapse all
y — y-coordinates
vector | matrix
y-coordinates, specified as a vector or matrix. The
size and shape of y depend on the size and shape of your
data and the type of plot you want to make. This table describes the most
common types of plots you can create.
| Type of Plot | Coordinates and Error Bar Lengths |
|---|---|
| One line with error bars |
Specify all coordinates and error bar lengths y = 1:5; err = [0.3 0.1 0.3 0.1 0.3]; errorbar(y,err) xlim([0.9 5.1]) Optionally specify x = [0; 1; 2; 3; 4]; y = 1:5; err = [0.3 0.1 0.3 0.1 0.3]; errorbar(x,y,err) xlim([-0.1 4.1]) |
| Multiple lines with error bars |
Specify one or more of the coordinate inputs or MATLAB® plots one line for each column in the
For example, plot five lines that y = [1 2 3 4 5;
2 3 4 5 6];
err = [0.2 0.1 0.3 0.1 0.2;
0.1 0.3 0.4 0.3 0.1];
errorbar(y,err)
xlim([0.95 2.05])
Using the same x = [0 1 2 3 4;
10 11 12 13 14];
y = [1 2 3 4 5];
err = [0.2 0.1 0.3 0.1 0.2;
0.1 0.3 0.4 0.3 0.1];
errorbar(x,y,err)
xlim([-0.5 14.5])
|
Data Types: single | double | int8 | int16 | int32 | int64 | uint8 | uint16 | uint32 | uint64 | logical | categorical | datetime | duration
x — x-coordinates
vector | matrix
x-coordinates, specified as a vector or matrix. The
size and shape of x depend on the size and shape of your
data and the type of plot you want to make. This table describes the most
common types of plots you can create.
| Type of Plot | Coordinates and Error Bar Lengths |
|---|---|
| One line with error bars |
Specify all coordinates and error bar lengths x = 0:4; y = [1; 2; 3; 4; 5]; err = [0.2 0.1 0.3 0.1 0.2]; errorbar(x,y,err) xlim([-0.1 4.1]) |
| Multiple lines with error bars |
Specify one or more of the coordinate inputs or MATLAB plots one line for each column in the
Otherwise, MATLAB plots one line for each row in the x = [1 1 1 1 1;
2 2 2 2 2];
y = [1 2 3 4 5;
2 3 4 5 6];
err = [0.2 0.1 0.3 0.1 0.2;
0.1 0.3 0.4 0.3 0.1];
errorbar(x,y,err)
xlim([0.95 2.05])
Using the same x = 0:4;
y = [1 2 3 4 5;
2 3 4 5 6];
err = [0.2 0.1 0.3 0.1 0.2;
0.1 0.3 0.4 0.3 0.1];
errorbar(x,y,err)
xlim([-0.1 4.1])
|
Data Types: single | double | int8 | int16 | int32 | int64 | uint8 | uint16 | uint32 | uint64 | logical | categorical | datetime | duration
err — Error bar lengths for symmetrical error bars
vector | matrix
Error bar lengths for symmetrical error bars, specified as a vector or
matrix. If you do not want to draw an error bar at a particular data point,
then specify the length as NaN. The size and shape of
err depend on the size and shape of the coordinate
inputs and how you want to distribute the error bars. This table describes
the most common types of plots you can create.
| Type of Plot | x and y |
err |
|---|---|---|
| One line with error bars |
|
Specify a row or column vector of the same x = [0; 1; 2; 3; 4]; y = 1:5; err = [0.2 0.1 0.3 0.1 0.2]; errorbar(x,y,err) xlim([-0.1 4.1]) |
| Multiple lines with error bars | At least one of x ory is a matrix |
Specify a vector that is the same length as one When you x = 1:5;
y = [1 2 3 4 5;
2 3 4 5 6];
err = [0.2 0.1 0.3 0.1 0.2];
errorbar(x,y,err)
xlim([0.90 5.1])
To display different error bars for each x = 1:5;
y = [1 2 3 4 5;
2 3 4 5 6];
err = [0.2 0.1 0.3 0.1 0.2;
0.1 0.3 0.4 0.3 0.1];
errorbar(x,y,err)
xlim([0.90 5.1])
|
The data type of the error bar lengths must be compatible with the corresponding plot data. For example, if you plot datetime values, the error bars for those values must be duration values.
Data Types: single | double | int8 | int16 | int32 | int64 | uint8 | uint16 | uint32 | uint64 | logical | duration
neg,pos — Error bar lengths in negative and positive directions
pair of vectors | pair of matrices | vector and matrix
Error bar lengths in the negative and positive directions, specified as
two comma-separated vectors, matrices, or a vector and a matrix. The
negative direction is either below or to the left of the data points,
depending on the orientation of the error bars. The positive direction is
either above or to the right of the data points.
If you want to omit the negative or positive part of the error bar at a
particular data point, then specify the length at that point as
NaN. To omit the negative or positive part at all
data points, specify an empty array for neg or
pos.
The size and shape of neg and pos
depend on the size and shape of the coordinate inputs and how you want to
distribute the error bars. This table describes the most common types of
plots you can create.
| Type of Plot | x and y |
neg and pos |
|---|---|---|
| One line with error bars |
|
Specify row or column vectors of the same length as x = [0; 1; 2; 3; 4]; y = 1:5; neg = [0.2; 0.1; 0.3; 0.05; 0.3]; pos = [0.1 0.05 0.1 0.2 0.3]; errorbar(x,y,neg,pos) xlim([-0.1 4.1]) |
| Multiple lines with error bars | At least one of x ory is a matrix |
Specify vectors that are the same length as one of When you specify vectors, those x = 0:4;
y = [1 2 3 4 5;
6 7 8 9 10];
neg = [0.2; 0.1; 0.3; 0.05; 0.3];
pos = [0.1 0.05 0.1 0.2 0.3];
errorbar(x,y,neg,pos)
xlim([-0.1 4.1])
To display different positive and negative x = 0:4;
y = [1 2 3 4 5;
6 7 8 9 10];
neg = [0.2 0.1 0.3 0.05 0.3;
3 5 3 2 2];
pos = [0.2 0.3 0.4 0.1 0.2;
4 3 3 7 3];
errorbar(x,y,neg,pos)
xlim([-0.1 4.1])
|
The data type of the error bar lengths must be compatible with the corresponding plot data. For example, if you plot datetime values, the error bars for those values must be duration values.
Data Types: single | double | int8 | int16 | int32 | int64 | uint8 | uint16 | uint32 | uint64 | logical | duration
yneg,ypos — Vertical error bar lengths in negative and positive directions
pair of vectors | pair of matrices | vector and matrix
Vertical error bar lengths in the negative and positive directions,
specified as two comma-separated vectors, matrices, or a vector and a
matrix. The negative direction is below data points, and the positive
direction is above data points.
If you want to omit the negative or positive part of the error bar at a
particular data point, then specify the length at that point as
NaN. To omit the negative or positive part at all
data points, specify an empty array for yneg or
ypos.
The size and shape of yneg and ypos
depend on the size and shape of the coordinate inputs and how you want to
distribute the error bars. This table describes the most common types of
plots you can create.
| Type of Plot | x and y |
yneg andypos |
|---|---|---|
| One line with error bars |
|
Specify row or column vectors of the same length as x = [0; 1; 2; 3; 4]; y = 1:5; yneg = [0.2; 0.1; 0.3; 0.05; 0.3]; ypos = [0.1 0.05 0.1 0.2 0.3]; xneg = [0.1; 0.1; 0.1; 0.1; 0.1]; xpos = [0.1 0.1 0.1 0.1 0.1]; errorbar(x,y,yneg,ypos,xneg,xpos) xlim([-0.2 4.2]) |
| Multiple lines with error bars | At least one of x ory is a matrix |
Specify vectors that are the same length as one of When you specify vectors, those x = 0:4;
y = [1 2 3 4 5;
6 7 8 9 10];
yneg = [0.2; 0.3; 0.3; 0.1; 0.3];
ypos = [0.1 0.4 0.1 0.2 0.3];
errorbar(x,y,yneg,ypos,[],[])
xlim([-0.2 4.2])
To display different positive and negative x = 0:4;
y = [1 2 3 4 5;
6 7 8 9 10];
yneg = [0.3 1 0.2 0.5 0.3;
0.3 0.2 0.3 1 0.5];
ypos = [1 0.4 0.3 0.2 0.3;
0.4 0.5 0.2 0.4 1];
errorbar(x,y,yneg,ypos,[],[])
xlim([-0.2 4.2])
|
The data type of the error bar lengths must be compatible with the corresponding plot data. For example, if you plot datetime values, the error bars for those values must be duration values.
Data Types: single | double | int8 | int16 | int32 | int64 | uint8 | uint16 | uint32 | uint64 | logical | duration
xneg,xpos — Horizontal error bar lengths in negative and positive directions
pair of vectors | pair of matrices | vector and matrix
Horizontal error bar lengths in the negative and positive directions,
specified as two comma-separated vectors, matrices, or a vector and a
matrix. The negative direction is to the left of the data points, and the
positive direction is to the right of the data points.
If you want to omit the negative or positive part of the error bar at a
particular data point, specify the length at that point as
NaN. To omit the negative or positive part at all
data points, then specify an empty array for xneg or
xpos.
The size and shape of xneg and xpos
depends on the size and shape of the coordinate inputs and how you want to
distribute the error bars. This table describes the most common types of
plots you can create.
| Type of Plot | x and y |
xneg andxpos |
|---|---|---|
| One line with error bars |
|
Specify row or column vectors of the same length as x = [0; 1; 2; 3; 4]; y = 1:5; yneg = [0.2; 0.1; 0.3; 0.05; 0.3]; ypos = [0.1 0.05 0.1 0.2 0.3]; xneg = [0.1; 0.1; 0.1; 0.1; 0.1]; xpos = [0.1 0.1 0.1 0.1 0.1]; errorbar(x,y,yneg,ypos,xneg,xpos) xlim([-0.2 4.2]) |
| Multiple lines with error bars | At least one of x ory is a matrix |
Specify vectors that are the same length as one of When you specify vectors, those x = 0:4;
y = [1 2 3 4 5;
6 7 8 9 10];
xneg = [0.2; 0.3; 0.3; 0.1; 0.3];
xpos = [0.1 0.4 0.1 0.2 0.3];
errorbar(x,y,[],[],xneg,xpos)
xlim([-0.5 4.5])
ylim([0.5 10.5])
To display different positive and negative x = 0:4;
y = [1 2 3 4 5;
6 7 8 9 10];
xneg = [0.3 1 0.2 0.5 0.3;
0.3 0.2 0.3 1 0.5];
xpos = [1 0.4 0.3 0.2 0.3;
0.4 0.5 0.2 0.4 1];
errorbar(x,y,[],[],xneg,xpos)
xlim([-0.5 5.5])
ylim([0.5 10.5])
|
The data type of the error bar lengths must be compatible with the corresponding plot data. For example, if you plot datetime values, the error bars for those values must be duration values.
Data Types: single | double | int8 | int16 | int32 | int64 | uint8 | uint16 | uint32 | uint64 | logical | duration
ornt — Error bar orientation
"vertical" (default) | "horizontal" | "both"
Error bar orientation, specified as one of these values:
-
"vertical"— Vertical error
bars -
"horizontal"— Horizontal error
bars -
"both"— Vertical and horizontal
error bars
Example: errorbar(x,y,err,"horizontal")
LineSpec — Line style, marker, and color
string | character vector
Line style, marker, and color, specified as a string or character vector containing symbols.
The symbols can appear in any order. You do not need to specify all three
characteristics (line style, marker, and color). For example, if you omit the line style
and specify the marker, then the plot shows only the marker and no line.
Example: "--or" is a red dashed line with circle markers
| Line Style | Description | Resulting Line |
|---|---|---|
"-" |
Solid line |
|
"--" |
Dashed line |
|
":" |
Dotted line |
|
"-." |
Dash-dotted line |
|
| Marker | Description | Resulting Marker |
|---|---|---|
"o" |
Circle |
|
"+" |
Plus sign |
|
"*" |
Asterisk |
|
"." |
Point |
|
"x" |
Cross |
|
"_" |
Horizontal line |
|
"|" |
Vertical line |
|
"square" |
Square |
|
"diamond" |
Diamond |
|
"^" |
Upward-pointing triangle |
|
"v" |
Downward-pointing triangle |
|
">" |
Right-pointing triangle |
|
"<" |
Left-pointing triangle |
|
"pentagram" |
Pentagram |
|
"hexagram" |
Hexagram |
|
| Color Name | Short Name | RGB Triplet | Appearance |
|---|---|---|---|
"red" |
"r" |
[1 0 0] |
|
"green" |
"g" |
[0 1 0] |
|
"blue" |
"b" |
[0 0 1] |
|
"cyan"
|
"c" |
[0 1 1] |
|
"magenta" |
"m" |
[1 0 1] |
|
"yellow" |
"y" |
[1 1 0] |
|
"black" |
"k" |
[0 0 0] |
|
"white" |
"w" |
[1 1 1] |
|
ax — Axes object
current axes (default) | axes object
Axes object. If you do not specify the axes, then errorbar plots
into the current axes.
Name-Value Arguments
Specify optional pairs of arguments as
Name1=Value1,...,NameN=ValueN, where Name is
the argument name and Value is the corresponding value.
Name-value arguments must appear after other arguments, but the order of the
pairs does not matter.
Before R2021a, use commas to separate each name and value, and enclose
Name in quotes.
Example: errorbar(y,err,"LineWidth",2) specifies a line width of 2
points.
The properties listed here are only a subset. For a complete
list, see ErrorBar Properties.
CapSize — Length of caps at end of error bars
6 (default) | nonnegative value in points
Length of caps at end of error bars, specified as a nonnegative value in points. To remove the
caps from the error bars, set CapSize to
0.
Example: errorbar(x,y,err,"CapSize",10)
Line width, specified as a positive value in points, where 1 point = 1/72 of an inch. If the
line has markers, then the line width also affects the marker
edges.
The line width cannot be thinner than the width of a pixel. If you set the line width
to a value that is less than the width of a pixel on your system, the line displays as
one pixel wide.
More About
collapse all
Specifying Coordinates as Combinations of Vectors and Matrices
errorbar accepts combinations of vectors
and matrices for plotting multiple sets of coordinates in the same axes.
Specify a vector and a matrix when the coordinates in one dimension are shared.
The length of the vector must match one of the dimensions of the matrix. The rows
(or columns) of the matrix are plotted against the vector. For example, you can
specify the x-coordinates as an m-element
vector and the y-coordinates as an
m-by-n matrix. MATLAB displays n plots in the same axes that share the
same x-coordinates.

Specify two matrices when the coordinates are different among all the plots in
both dimensions. Both matrices must have the same size and orientation. The columns
of the matrices are plotted against each other.

Extended Capabilities
GPU Arrays
Accelerate code by running on a graphics processing unit (GPU) using Parallel Computing Toolbox™.
Usage notes and limitations:
-
This function accepts GPU arrays, but does not run on a GPU.
For more information, see Run MATLAB Functions on a GPU (Parallel Computing Toolbox).
Distributed Arrays
Partition large arrays across the combined memory of your cluster using Parallel Computing Toolbox™.
Usage notes and limitations:
-
This function operates on distributed arrays, but executes in the client MATLAB.
For more information, see Run MATLAB Functions with Distributed Arrays (Parallel Computing Toolbox).
Version History
Introduced before R2006a
expand all
R2022b: Plot multiple data sets at once using matrices
The errorbar function now accepts the same combinations of
matrices and vectors as the plot function does. As a result,
you can plot multiple data sets at once rather than calling the
hold function between plotting commands.
Improve Article
Save Article
Improve Article
Save Article
Error bars are a way of plotting errors on each point in a data set as vertical bars in a linear plot. MATLAB provides a simple function to plot the error bars for a given data; the errorbar() function.
Syntax:
errorbar(x,y,errors,…)
Where,
- x – contains x data
- y- contains y data
- error – contains errors for every point in y with respect to x.
Now, let us see the same in implementation with some examples.
Let us create error bars of equal length first.
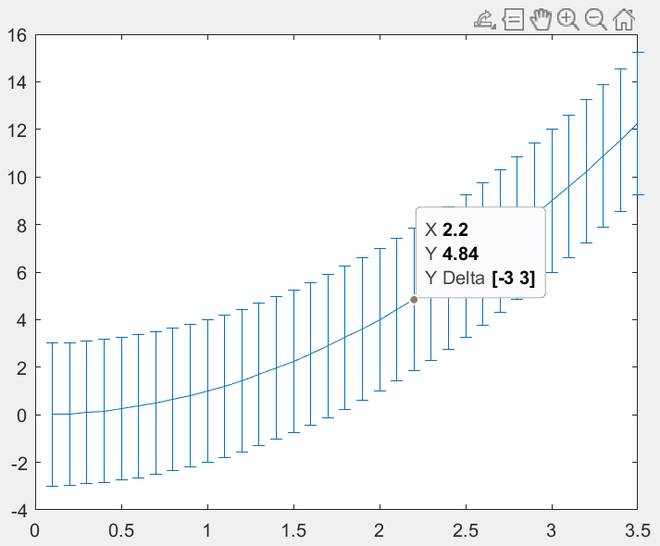
Example 1:
Matlab
x = 0.1*[1:35];
y = x.^2;
error = 3*ones(size(y));
errorbar(x,y,error)
Output:
We can change the error bars from vertical to horizontal.
Example 2:
Matlab
x = 1:2:23;
y = x.^2;
error = 3*ones(size(y));
errorbar(x,y,error,'horizontal')
Output:

MATLAB allows us to print both vertical and horizontal error bars together, of the same length.
Example 3:
Matlab
x = 0.1*[1:2:23];
y = x.^2;
error = 0.23*ones(size(y));
errorbar(x,y,error,'both')
Output:

We can have variable lengths of error bars on either side of the y curve. See the following implementation for the same.
Example 4:
Matlab
x = [1 3 5.5 6 6.9 7.5 7.9];
y = 0.003*x.^3;
error_pos = [1 0.5 1 0.2 0.3 0.23 0.7];
error_neg = [0.7 0.23 0.3 0.2 1 0.5 1];
errorbar(x,y,error_neg,error_pos)
Output:

We can plot both vertical and horizontal error bars of variable lengths.
Example 5:
Matlab
x = [1 3 5.5 6 6.9 7.5 7.9];
y = 0.003*x.^3;
y_error_pos = [1 0.5 1 0.2 0.3 0.23 0.7];
y_error_neg = [0.7 0.23 0.3 0.2 1 0.5 1];
x_error_pos = [0.7 0.23 0.3 0.2 1 0.5 1];
x_error_neg = [1 0.5 1 0.2 0.3 0.23 0.7];
errorbar(x,y,y_error_neg,y_error_pos,x_error_neg,x_error_pos,'o')
Output:
The ‘o’ option plots a circle at (x, y) point instead of a continuous line.

We can also get the properties of the error bar created by making it an object like below:
Example 6:
Matlab
x = [1 3 5.5 6 6.9 7.5 7.9];
y = 0.003*x.^3;
y_error_pos = [1 0.5 1 0.2 0.3 0.23 0.7];
y_error_neg = [0.7 0.23 0.3 0.2 1 0.5 1];
x_error_pos = [0.7 0.23 0.3 0.2 1 0.5 1];
x_error_neg = [1 0.5 1 0.2 0.3 0.23 0.7];
err = errorbar(x,y,y_error_neg,y_error_pos,x_error_neg,x_error_pos,'o')
Output:
The plot would be:

And the properties will be displayed in the terminal.

График линии со столбцами погрешности
Синтаксис
Описание
errorbar( построил график данных в y,err)y и чертит вертикальное значение погрешности в каждой точке данных. Значения в err определите длины каждого значения погрешности выше и ниже точек данных, таким образом, длины панели полной погрешности удваивают err значения.
пример
errorbar( графики x,y,err)y по сравнению с x и чертит вертикальное значение погрешности в каждой точке данных.
errorbar( чертит вертикальное значение погрешности в каждой точке данных, где x,y,neg,pos)neg определяет длину ниже точки данных и pos определяет длину выше точки данных, соответственно.
пример
errorbar(___, устанавливает ориентацию значения погрешности. Задайте ornt)ornt как 'horizontal' для горизонтального значения погрешности или 'both' и для горизонтального и для вертикального значения погрешности. Значение по умолчанию для ornt 'vertical', который чертит вертикальное значение погрешности. Используйте эту опцию после любой из предыдущих комбинаций входных аргументов.
пример
errorbar( графики x,y,yneg,ypos,xneg,xpos)y по сравнению с x и чертит и горизонтальное и вертикальное значение погрешности. yneg и ypos входные параметры устанавливают более низкие и верхние длины вертикального значения погрешности, соответственно. xneg и xpos входные параметры устанавливают левые и правые длины горизонтального значения погрешности.
пример
errorbar(___, устанавливает стиль линии, символ маркера и цвет. Например, LineSpec)'--ro' строит пунктирное, красную линию с круговыми маркерами. Стиль линии влияет только на линию а не значение погрешности.
пример
errorbar(___, изменяет внешний вид линии и значения погрешности с помощью одного или нескольких аргументов пары «имя-значение». Например, Name,Value)'CapSize',10 устанавливает длины дна в конце каждого значения погрешности к 10 точкам.
errorbar( создает график в осях, заданных ax,___)ax вместо в текущей системе координат. Задайте оси как первый входной параметр.
пример
e = errorbar(___)ErrorBar возразите когда y вектор. Если y матрица, затем она возвращает один ErrorBar объект для каждого столбца в y. Используйте e изменить свойства определенного ErrorBar объект после того, как это создается. Для списка свойств смотрите ErrorBar Properties.
Примеры
свернуть все
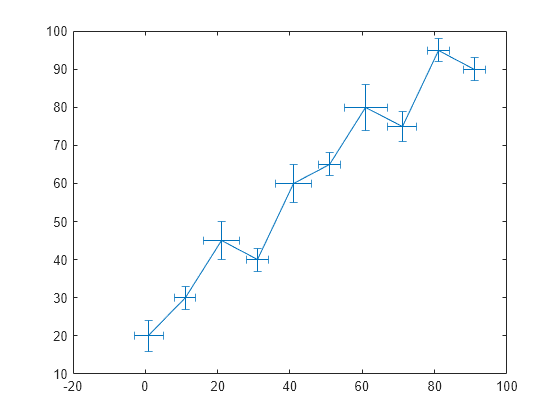
Графическое изображение вертикального значения погрешности равной длины
Создайте векторы x и y. Постройте y по сравнению с x. В каждой точке данных отобразите вертикальное значение погрешности, которое равно в длине.
x = 1:10:100;
y = [20 30 45 40 60 65 80 75 95 90];
err = 8*ones(size(y));
errorbar(x,y,err)

Постройте график Вертикального Значения погрешности, которое Отличается по Длине
Создайте график линии со столбцами погрешности в каждой точке данных. Варьируйтесь длины значения погрешности.
x = 1:10:100;
y = [20 30 45 40 60 65 80 75 95 90];
err = [5 8 2 9 3 3 8 3 9 3];
errorbar(x,y,err)

Графическое изображение горизонтального значения погрешности
Постройте график с горизонтальным значением погрешности в каждой точке данных.
x = 1:10:100;
y = [20 30 45 40 60 65 80 75 95 90];
err = [1 3 5 3 5 3 6 4 3 3];
errorbar(x,y,err,'horizontal')

Графическое изображение вертикального и горизонтального значения погрешности
Постройте график и с вертикальным и с горизонтальным значением погрешности в каждой точке данных.
x = 1:10:100;
y = [20 30 45 40 60 65 80 75 95 90];
err = [4 3 5 3 5 3 6 4 3 3];
errorbar(x,y,err,'both')

Графическое изображение значения погрешности без строки
Векторы графика y по сравнению с x. В каждой точке данных отобразите круговой маркер и с вертикальным и с горизонтальным значением погрешности. Не отображайте линию, которая соединяет точки данных путем исключения опции стиля линии для linespec входной параметр.
x = 1:10:100;
y = [20 30 45 40 60 65 80 75 95 90];
err = [4 3 5 3 5 3 6 4 3 3];
errorbar(x,y,err,'both','o')

Управление длинами значения погрешности во всех направлениях
Отобразите и вертикальное и горизонтальное значение погрешности в каждой точке данных. Управляйте более низкими и верхними длинами вертикального значения погрешности с помощью yneg и ypos опции входного параметра, соответственно. Управляйте левыми и правыми длинами горизонтального значения погрешности с помощью xneg и xpos опции входного параметра, соответственно.
x = 1:10:100;
y = [20 30 45 40 60 65 80 75 95 90];
yneg = [1 3 5 3 5 3 6 4 3 3];
ypos = [2 5 3 5 2 5 2 2 5 5];
xneg = [1 3 5 3 5 3 6 4 3 3];
xpos = [2 5 3 5 2 5 2 2 5 5];
errorbar(x,y,yneg,ypos,xneg,xpos,'o')

Постройте значения Datetime со значением погрешности
Создайте график значений datetime со значением погрешности в модулях длительности.
x = 1:13;
y = datetime(2018,5,1,1:13,0,0);
err = hours(rand(13,1));
errorbar(x,y,err)

Добавление цветных маркеров к каждой точке данных
Создайте график линии со столбцами погрешности. В каждой точке данных отобразите маркер. Управляйте внешним видом аргументов пары «имя-значение» использования маркера. Используйте MarkerSize задавать размер маркера в точках. Используйте MarkerEdgeColor и MarkerFaceColor задавать схему маркера и внутренние цвета, соответственно. Выберите цвета любому вектор символов названия цвета, такие как 'red', или триплет RGB.
x = linspace(0,10,15);
y = sin(x/2);
err = 0.3*ones(size(y));
errorbar(x,y,err,'-s','MarkerSize',10,...
    'MarkerEdgeColor','red','MarkerFaceColor','red')

Управление размером прописной буквы значения погрешности
Управляйте размером дна в конце каждого значения погрешности путем установки CapSize свойство к положительному значению в точках.
x = linspace(0,2,15);
y = exp(x);
err = 0.3*ones(size(y));
errorbar(x,y,err,'CapSize',18)

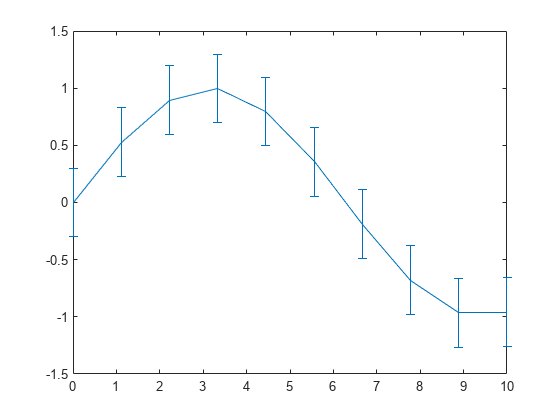
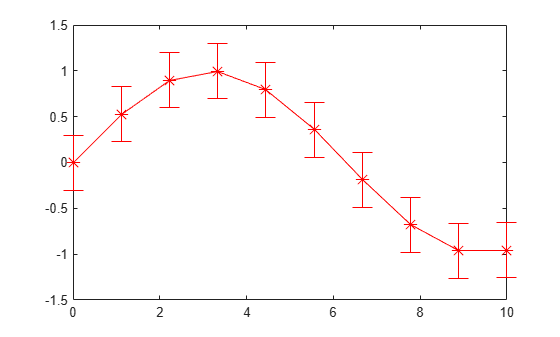
Изменение значения погрешности после создания
Создайте график линии со столбцами погрешности. Присвойте объект errorbar переменной e.
x = linspace(0,10,10);
y = sin(x/2);
err = 0.3*ones(size(y));
e = errorbar(x,y,err)

e =
  ErrorBar with properties:

             Color: [0 0.4470 0.7410]
         LineStyle: '-'
         LineWidth: 0.5000
            Marker: 'none'
             XData: [0 1.1111 2.2222 3.3333 4.4444 5.5556 6.6667 7.7778 ... ]
             YData: [0 0.5274 0.8962 0.9954 0.7952 0.3558 -0.1906 ... ]
    XNegativeDelta: [1x0 double]
    XPositiveDelta: [1x0 double]
    YNegativeDelta: [0.3000 0.3000 0.3000 0.3000 0.3000 0.3000 0.3000 ... ]
    YPositiveDelta: [0.3000 0.3000 0.3000 0.3000 0.3000 0.3000 0.3000 ... ]

  Show all properties
Используйте e к свойствам доступа объекта errorbar после того, как это создается.
e.Marker = '*';
e.MarkerSize = 10;
e.Color = 'red';
e.CapSize = 15;

Входные параметры
свернуть все
y yvalues
вектор | матрица
Значения y в виде вектора или матрицы.
-
Если
yвектор, затемerrorbarстроит один график. -
Если
yматрица, затемerrorbarстроит отдельный график для каждого столбца вy.
Пример: y = [4 3 5 2 2 4];
Типы данных: single | double | int8 | int16 | int32 | int64 | uint8 | uint16 | uint32 | uint64 | logical | categorical | datetime | duration
x xvalues
вектор | матрица
Значения x в виде вектора или матрицы. x должен быть одного размера с y.
Пример: x = 0:10:100;
Типы данных: single | double | int8 | int16 | int32 | int64 | uint8 | uint16 | uint32 | uint64 | logical | categorical | datetime | duration
err — Длины значения погрешности для симметричного значения погрешности
вектор | матрица
Длины значения погрешности для симметричного значения погрешности в виде вектора или матрицы. err должен быть одного размера с y. Если вы не хотите чертить значение погрешности в конкретной точке данных, то задайте длину как NaN.
Тип данных длин значения погрешности должен быть совместим с соответствующими данными о графике. Например, если вы строите datetime значения, значением погрешности для тех значений должен быть duration значения.
Типы данных: single | double | int8 | int16 | int32 | int64 | uint8 | uint16 | uint32 | uint64 | logical | duration
neg — Длины значения погрешности в отрицательном направлении
вектор | матрица | []
Длины значения погрешности в обратном направлении в виде вектора или матрицы тот же размер как y или как пустой массив [].
-
Для вертикального значения погрешности,
negустанавливает длину значения погрешности ниже точек данных. -
Для горизонтального значения погрешности,
negустанавливает длину значения погрешности слева от точек данных.
Если вы не хотите чертить более низкую часть значения погрешности в конкретной точке данных, то задайте длину как NaN. Если вы не хотите чертить более низкую часть значения погрешности в какой-либо точке данных, то установленный neg к пустому массиву.
Тип данных длин значения погрешности должен быть совместим с соответствующими данными о графике. Например, если вы строите datetime значения, значением погрешности для тех значений должен быть duration значения.
Типы данных: single | double | int8 | int16 | int32 | int64 | uint8 | uint16 | uint32 | uint64 | logical | duration
pos — Длины значения погрешности в положительном направлении
вектор | матрица | []
Длины значения погрешности в положительном направлении в виде вектора или матрицы тот же размер как y или как пустой массив [].
-
Для вертикального значения погрешности,
posустанавливает длину значения погрешности выше точек данных. -
Для горизонтального значения погрешности,
posустанавливает длину значения погрешности справа от точек данных.
Если вы не хотите чертить верхнюю часть значения погрешности в конкретной точке данных, то задайте длину как NaN. Если вы не хотите чертить верхнюю часть значения погрешности в какой-либо точке данных, то установленный pos к пустому массиву.
Тип данных длин значения погрешности должен быть совместим с соответствующими данными о графике. Например, если вы строите datetime значения, значением погрешности для тех значений должен быть duration значения.
Типы данных: single | double | int8 | int16 | int32 | int64 | uint8 | uint16 | uint32 | uint64 | logical | duration
yneg — Вертикальные длины значения погрешности ниже точек данных
вектор | матрица | []
Вертикальные длины значения погрешности ниже точек данных в виде вектора или матрицы тот же размер как y или как пустой массив [].
Если вы не хотите чертить более низкую часть значения погрешности в конкретной точке данных, то задайте значение как NaN. Если вы не хотите чертить более низкую часть значения погрешности в какой-либо точке данных, то установленный yneg к пустому массиву.
Тип данных длин значения погрешности должен быть совместим с соответствующими данными о графике. Например, если вы строите datetime значения, значением погрешности для тех значений должен быть duration значения.
Типы данных: single | double | int8 | int16 | int32 | int64 | uint8 | uint16 | uint32 | uint64 | logical | duration
ypos — Вертикальные длины значения погрешности выше точек данных
вектор | матрица | []
Вертикальные длины значения погрешности выше точек данных в виде вектора или матрицы тот же размер как y или как пустой массив [].
Если вы не хотите чертить верхнюю часть значения погрешности в конкретной точке данных, то задайте длину как NaN. Если вы не хотите чертить верхнюю часть значения погрешности в какой-либо точке данных, то установленный ypos к пустому массиву.
Тип данных длин значения погрешности должен быть совместим с соответствующими данными о графике. Например, если вы строите datetime значения, значением погрешности для тех значений должен быть duration значения.
Типы данных: single | double | int8 | int16 | int32 | int64 | uint8 | uint16 | uint32 | uint64 | logical | duration
xneg — Горизонтальные длины значения погрешности налево от точек данных
вектор | матрица | []
Горизонтальные длины значения погрешности слева от точек данных в виде вектора или матрицы тот же размер как y или как пустой массив [].
Если вы не хотите чертить левую часть значения погрешности в конкретной точке данных, то задайте длину как NaN. Если вы не хотите чертить левую часть значения погрешности в какой-либо точке данных, то установленный xneg к пустому массиву.
Тип данных длин значения погрешности должен быть совместим с соответствующими данными о графике. Например, если вы строите datetime значения, значением погрешности для тех значений должен быть duration значения.
Типы данных: single | double | int8 | int16 | int32 | int64 | uint8 | uint16 | uint32 | uint64 | logical | duration
xpos — Горизонтальные длины значения погрешности направо от точек данных
вектор | матрица | []
Горизонтальные длины значения погрешности справа от точек данных в виде вектора или матрицы тот же размер как y или как пустой массив [].
Если вы не хотите чертить правильную часть значения погрешности в конкретной точке данных, то задайте длину как NaN. Если вы не хотите чертить правильную часть значения погрешности в какой-либо точке данных, то установленный xpos к пустому массиву.
Тип данных длин значения погрешности должен быть совместим с соответствующими данными о графике. Например, если вы строите datetime значения, значением погрешности для тех значений должен быть duration значения.
Типы данных: single | double | int8 | int16 | int32 | int64 | uint8 | uint16 | uint32 | uint64 | logical | duration
ornt — Ориентация значения погрешности
'vertical' (значение по умолчанию) | 'horizontal' | 'both'
Ориентация значения погрешности в виде одного из этих значений:
-
'vertical'— Вертикальное значение погрешности -
'horizontal'— Горизонтальное значение погрешности -
'both'— Вертикальное и горизонтальное значение погрешности
Пример: errorbar(x,y,err,'horizontal')
LineSpec — Стиль линии, маркер и цвет
вектор символов | строка
Стиль линии, цвет и маркер задается как символ или строка символов. Символы могут появиться в любом порядке. Вы не должны задавать все три характеристики (стиль линии, маркер и цвет). Например, если вы не используете стиль линии и задаете маркер, затем график показывает только маркер и никакую линию.
Пример: '--or' красная пунктирная линия с круговыми маркерами
| Стиль линии | Описание | Получившаяся линия |
|---|---|---|
'-' |
Сплошная линия |
|
'--' |
Пунктирная линия |
|
':' |
Пунктирная линия |
|
'-.' |
Штрих-пунктирная линия |
|
| Маркер | Описание | Получившийся маркер |
|---|---|---|
'o' |
Круг |
|
'+' |
Знак «плюс» |
|
'*' |
Звездочка |
|
'.' |
Точка |
|
'x' |
Крест |
|
'_' |
Горизонтальная линия |
|
'|' |
Вертикальная линия |
|
's' |
Квадрат |
|
'd' |
Ромб |
|
'^' |
Треугольник, направленный вверх |
|
'v' |
Нисходящий треугольник |
|
'>' |
Треугольник, указывающий вправо |
|
'<' |
Треугольник, указывающий влево |
|
'p' |
Пентаграмма |
|
'h' |
Гексаграмма |
|
| Название цвета | Краткое название | Триплет RGB | Внешний вид |
|---|---|---|---|
'red' |
'r' |
[1 0 0] |
|
'green' |
'g' |
[0 1 0] |
|
'blue' |
'b' |
[0 0 1] |
|
'cyan'
|
'c' |
[0 1 1] |
|
'magenta' |
'm' |
[1 0 1] |
|
'yellow' |
'y' |
[1 1 0] |
|
'black' |
'k' |
[0 0 0] |
|
'white' |
'w' |
[1 1 1] |
|
ax Объект осей
текущая система координат (значение по умолчанию) | объект осей
Объект осей. Если вы не задаете оси, то errorbar графики в текущую систему координат.
Аргументы name-value
Задайте дополнительные разделенные запятой пары Name,Value аргументы. Name имя аргумента и Value соответствующее значение. Name должен появиться в кавычках. Вы можете задать несколько аргументов в виде пар имен и значений в любом порядке, например: Name1, Value1, ..., NameN, ValueN.
Пример: errorbar(y,err,'LineWidth',2) задает ширину линии 2 точек.
Перечисленные здесь свойства являются только подмножеством. Для полного списка смотрите ErrorBar Properties.
CapSize — Длина дна в конце значения погрешности
6
Длина дна в конце значения погрешности в виде положительного значения в точках.
Пример: errorbar(x,y,err,'CapSize',10)
Ширина линии в виде положительного значения в точках, где 1 точка = 1/72 дюйма. Если у линии есть маркеры, ширина линии также влияет на края маркера.
Ширина линии не может быть более тонкой, чем ширина пикселя. Если вы устанавливаете ширину линии на значение, которое меньше ширины пикселя в вашей системе, отображения линии как один пиксель шириной.
Расширенные возможности
Массивы графического процессора
Ускорьте код путем работы графического процессора (GPU) с помощью Parallel Computing Toolbox™.
Указания и ограничения по применению:
-
Эта функция принимает массивы графического процессора, но не работает на графическом процессоре.
Для получения дополнительной информации смотрите функции MATLAB Запуска на графическом процессоре (Parallel Computing Toolbox).
Распределенные массивы
Большие массивы раздела через объединенную память о вашем кластере с помощью Parallel Computing Toolbox™.
Указания и ограничения по применению:
-
Эта функция работает с распределенными массивами, но выполняет в клиенте MATLAB®.
Для получения дополнительной информации смотрите функции MATLAB Запуска с Распределенными Массивами (Parallel Computing Toolbox).
Представлено до R2006a
Содержание
- errorbar
- Syntax
- Description
- Examples
- Plot Vertical Error Bars of Equal Length
- Plot Vertical Error Bars that Vary in Length
- Plot Horizontal Error Bars
- Plot Vertical and Horizontal Error Bars
- Plot Error Bars with No Line
- Control Error Bars Lengths in All Directions
- Plot Datetime Values with Error Bars
- Add Colored Markers to Each Data Point
- Change Cap Size and Prevent Overlap With Plot Box
- Modify Error Bars After Creation
- Input Arguments
- y — y-coordinates vector | matrix
- x — x-coordinates vector | matrix
- err — Error bar lengths for symmetrical error bars vector | matrix
- neg,pos — Error bar lengths in negative and positive directions pair of vectors | pair of matrices | vector and matrix
- yneg,ypos — Vertical error bar lengths in negative and positive directions pair of vectors | pair of matrices | vector and matrix
- xneg,xpos — Horizontal error bar lengths in negative and positive directions pair of vectors | pair of matrices | vector and matrix
- ornt — Error bar orientation «vertical» (default) | «horizontal» | «both»
- LineSpec — Line style, marker, and color string | character vector
errorbar
Line plot with error bars

Syntax
Description
errorbar( y , err ) creates a line plot of the data in y and draws a vertical error bar at each data point. The values in err determine the lengths of each error bar above and below the data points, so the total error bar lengths are double the err values.
errorbar( x , y , err ) plots y versus x and draws a vertical error bar at each data point.
errorbar( x , y , neg,pos ) draws a vertical error bar at each data point, where neg determines the length below the data point and pos determines the length above the data point, respectively.
errorbar( ___ , ornt ) sets the orientation of the error bars. Specify ornt as «horizontal» for horizontal error bars or «both» for both horizontal and vertical error bars. The default for ornt is «vertical» , which draws vertical error bars. Use this option after any of the previous input argument combinations.
errorbar( x , y , yneg,ypos , xneg,xpos ) plots y versus x and draws both horizontal and vertical error bars. yneg and ypos set the lower and upper lengths of the vertical error bars, respectively. Similarly, xneg and xpos set the left and right lengths of the horizontal error bars.
errorbar( ___ , LineSpec ) sets the line style, marker symbol, and color. For example, «—ro» plots a dashed, red line with circle markers. The line style affects only the line and not the error bars.
errorbar( ___ , Name,Value ) modifies the appearance of the line and error bars using one or more name-value pair arguments. For example, «CapSize»,10 sets the lengths of the caps at the end of each error bar to 10 points.
errorbar( ax , ___ ) creates the plot in the axes specified by ax instead of in the current axes. Specify the axes as the first input argument.
e = errorbar( ___ ) returns one ErrorBar object for each plotted line. Use e to modify properties of a specific ErrorBar object after it is created. For a list of properties, see ErrorBar Properties .
Examples
Plot Vertical Error Bars of Equal Length
Create vectors x and y . Plot y versus x . At each data point, display vertical error bars that are equal in length.
Plot Vertical Error Bars that Vary in Length
Create a line plot with error bars at each data point. Vary the lengths of the error bars.
Plot Horizontal Error Bars
Create a line plot with horizontal error bars at each data point.
Plot Vertical and Horizontal Error Bars
Create a line plot with both vertical and horizontal error bars at each data point.
Plot Error Bars with No Line
Plot vectors y versus x . At each data point, display a circle marker with both vertical and horizontal error bars. Do not display the line that connects the data points by omitting the line style option for the linespec input argument.
Alternatvely, omit the markers and plot the error bars by themselves. To do this, specify the LineStyle name-value argument as «none» .
Control Error Bars Lengths in All Directions
Display both vertical and horizontal error bars at each data point. Control the lower and upper lengths of the vertical error bars using the yneg and ypos input argument options, respectively. Control the left and right lengths of the horizontal error bars using the xneg and xpos input argument options, respectively.
Plot Datetime Values with Error Bars
Create a plot of datetime values with error bars in duration units.
Add Colored Markers to Each Data Point
Create a line plot with error bars. At each data point, display a marker. Change the appearance of the marker using name-value arguments. Use MarkerSize to specify the marker size in points. Use MarkerEdgeColor and MarkerFaceColor to specify the marker outline and fill colors, respectively. You can specify colors by name, such as «blue » , as RGB triplets, or hexadecimal color codes.
Change Cap Size and Prevent Overlap With Plot Box
Control the size of the caps at the end of each error bar by setting the CapSize property to a positive value in points.
To remove the caps, set the cap size to zero. Then add a margin of padding around the inside of the plot box by calling the axis padded command. Adding this margin keeps the error bars from overlapping with the plot box.
Modify Error Bars After Creation
Create a line plot with error bars. Assign the errorbar object to the variable e .
Use e to access properties of the errorbar object after it is created.
Input Arguments
y — y-coordinates
vector | matrix
y-coordinates, specified as a vector or matrix. The size and shape of y depend on the size and shape of your data and the type of plot you want to make. This table describes the most common types of plots you can create.
Specify all coordinates and error bar lengths as any combination of row and column vectors of the same length. For example, plot one line with error bars. Adjust the x-axis limits with the xlim function to prevent any overlap between the error bars and the plot box.
Optionally specify x as a vector of the same length as y .
Specify one or more of the coordinate inputs or error bar lengths as matrices. All matrices must be the same size and orientation. If any inputs are specified as vectors, they must have the same number of elements, and they must have the same length as one of the dimensions of the matrices.
MATLAB ® plots one line for each column in the matrices in these situations:
When all the coordinates and the error bar lengths are matrices of the same size and orientation
When all the inputs specified as vectors are the same length as the columns of the matrices
For example, plot five lines that each have two error bars. Adjust the x-axis limits with the xlim function to prevent any overlap between the error bars and the plot box.
Using the same err values from the preceding code, specify x as a 2-by-5 matrix and y as a five-element vector. The resulting plot has two lines that each have five error bars. The y-coordinates are shared between the two lines.
Data Types: single | double | int8 | int16 | int32 | int64 | uint8 | uint16 | uint32 | uint64 | logical | categorical | datetime | duration
x — x-coordinates
vector | matrix
x-coordinates, specified as a vector or matrix. The size and shape of x depend on the size and shape of your data and the type of plot you want to make. This table describes the most common types of plots you can create.
| Type of Plot | Coordinates and Error Bar Lengths |
|---|---|
| One line with error bars | |
| Multiple lines with error bars |
Specify all coordinates and error bar lengths as any combination of row and column vectors of the same length. For example, plot one line with error bars. Adjust the x-axis limits with the xlim function to prevent any overlap between the error bars and the plot box.
Specify one or more of the coordinate inputs or error bar lengths as matrices. All matrices must have the same size and orientation. If any inputs are specified as vectors, they must have the same number of elements, and they have the same length as of one of the dimensions of the matrices.
MATLAB plots one line for each column in the matrices in these situations:
When all the coordinates and the error bar lengths are matrices of the same size and orientation
When all the inputs specified as vectors are the same length as the columns of the matrices
Otherwise, MATLAB plots one line for each row in the matrices. For example, plot five lines that each have two error bars. Adjust the x-axis limits with the xlim function to prevent any overlap between the error bars and the plot box.
Using the same y and err values from the preceding code, specify x as a five-element vector. The resulting plot has two lines that each have five error bars. The x-coordinates are shared between the two lines.
Data Types: single | double | int8 | int16 | int32 | int64 | uint8 | uint16 | uint32 | uint64 | logical | categorical | datetime | duration
err — Error bar lengths for symmetrical error bars
vector | matrix
Error bar lengths for symmetrical error bars, specified as a vector or matrix. If you do not want to draw an error bar at a particular data point, then specify the length as NaN . The size and shape of err depend on the size and shape of the coordinate inputs and how you want to distribute the error bars. This table describes the most common types of plots you can create.
| Type of Plot | Coordinates and Error Bar Lengths |
|---|---|
| One line with error bars | |
| Multiple lines with error bars |
y is a row or column vector. If specified, x is a row or column vector of the same length as y .
Specify a row or column vector of the same length as x and y . For example, specify x as a five-element column vector, and specify y and err as five-element row vectors.
Specify a vector that is the same length as one of the dimensions of the x or y matrix. The dimension that matches determines the number of lines and the number of error bars per line.
When you specify a vector, the error bars are shared among all the lines. For example, plot two lines that share the same five error bars. Adjust the x-axis limits with the xlim function to prevent any overlap between the error bars and the plot box.
To display different error bars for each line, specify a matrix that has the same size and orientation as the x or y matrix. For example, plot two lines with different sets of error bars.
The data type of the error bar lengths must be compatible with the corresponding plot data. For example, if you plot datetime values, the error bars for those values must be duration values.
Data Types: single | double | int8 | int16 | int32 | int64 | uint8 | uint16 | uint32 | uint64 | logical | duration
neg,pos — Error bar lengths in negative and positive directions
pair of vectors | pair of matrices | vector and matrix
Error bar lengths in the negative and positive directions, specified as two comma-separated vectors, matrices, or a vector and a matrix. The negative direction is either below or to the left of the data points, depending on the orientation of the error bars. The positive direction is either above or to the right of the data points.
If you want to omit the negative or positive part of the error bar at a particular data point, then specify the length at that point as NaN . To omit the negative or positive part at all data points, specify an empty array for neg or pos .
The size and shape of neg and pos depend on the size and shape of the coordinate inputs and how you want to distribute the error bars. This table describes the most common types of plots you can create.
| Type of Plot | x and y | err |
|---|---|---|
| One line with error bars | ||
| Multiple lines with error bars | At least one of x or y is a matrix |
y is a row or column vector. If specified, x is a row or column vector of the same length as y .
Specify row or column vectors of the same length as x and y . For example, plot a line with five error bars by specifying all the inputs as five-element vectors. Adjust the x-axis limits with the xlim function to prevent any overlap between the error bars and the plot box.
Specify vectors that are the same length as one of the dimensions of the x or y matrix. The dimension that matches determines the number of lines and the number of error bars per line. The neg and pos vectors must be the same length.
When you specify vectors, those error bar lengths are shared among all the lines. For example, plot two lines that share the same negative and positive error bar lengths. Adjust the x-axis limits with the xlim function to prevent any overlap between the error bars and the plot box.
To display different positive and negative error bar lengths for each line, specify matrices that are the same size and orientation as the x or y matrix. For example, plot two lines with different positive and negative error bar lengths.
The data type of the error bar lengths must be compatible with the corresponding plot data. For example, if you plot datetime values, the error bars for those values must be duration values.
Data Types: single | double | int8 | int16 | int32 | int64 | uint8 | uint16 | uint32 | uint64 | logical | duration
yneg,ypos — Vertical error bar lengths in negative and positive directions
pair of vectors | pair of matrices | vector and matrix
Vertical error bar lengths in the negative and positive directions, specified as two comma-separated vectors, matrices, or a vector and a matrix. The negative direction is below data points, and the positive direction is above data points.
If you want to omit the negative or positive part of the error bar at a particular data point, then specify the length at that point as NaN . To omit the negative or positive part at all data points, specify an empty array for yneg or ypos .
The size and shape of yneg and ypos depend on the size and shape of the coordinate inputs and how you want to distribute the error bars. This table describes the most common types of plots you can create.
| Type of Plot | x and y | neg and pos |
|---|---|---|
| One line with error bars | ||
| Multiple lines with error bars | At least one of x or y is a matrix |
y is row or column vector. If specified, x is a row or column vector of the same length as y .
Specify row or column vectors of the same length as x and y . For example, plot a line with five error bars by specifying all the inputs as five-element vectors. Adjust the x-axis limits with the xlim function to prevent any overlap between the error bars and the plot box.
Specify vectors that are the same length as one of the dimensions of the x or y matrix. The dimension that matches determines the number of lines and the number of error bars per line. The yneg and ypos vectors must be the same length.
When you specify vectors, those error bar lengths are shared among all the lines. For example, plot two lines that share the same negative and positive vertical error bar lengths. Specify xneg and xpos as empty arrays to exclude the horizontal bars. Adjust the x-axis limits with the xlim function to prevent any overlap between the error bars and the plot box.
To display different positive and negative vertical lengths for each line, specify matrices that have the same size and orientation as the x or y matrix. For example, plot two lines with different positive and negative vertical error bar lengths for each line.
The data type of the error bar lengths must be compatible with the corresponding plot data. For example, if you plot datetime values, the error bars for those values must be duration values.
Data Types: single | double | int8 | int16 | int32 | int64 | uint8 | uint16 | uint32 | uint64 | logical | duration
xneg,xpos — Horizontal error bar lengths in negative and positive directions
pair of vectors | pair of matrices | vector and matrix
Horizontal error bar lengths in the negative and positive directions, specified as two comma-separated vectors, matrices, or a vector and a matrix. The negative direction is to the left of the data points, and the positive direction is to the right of the data points.
If you want to omit the negative or positive part of the error bar at a particular data point, specify the length at that point as NaN . To omit the negative or positive part at all data points, then specify an empty array for xneg or xpos .
The size and shape of xneg and xpos depends on the size and shape of the coordinate inputs and how you want to distribute the error bars. This table describes the most common types of plots you can create.
| Type of Plot | x and y | yneg and ypos |
|---|---|---|
| One line with error bars | ||
| Multiple lines with error bars | At least one of x or y is a matrix |
y is a row or column vector. If specified, x is a row or column vector of the same length as y .
Specify row or column vectors of the same length as x and y . For example, plot a line with five error bars by specifying all the inputs as five-element vectors. Adjust the x-axis limits with the xlim function to prevent any overlap between the error bars and the plot box.
Specify vectors that are the same length as one of the dimensions of the x or y matrix. The dimension that matches determines the number of lines and the number of error bars per line. The xneg and xpos vectors must be the same length.
When you specify vectors, those error bar lengths are shared among all the lines. For example, plot two lines that share the same negative and positive horizontal error bar lengths. Specify yneg and ypos as empty arrays to exclude the vertical bars. Adjust the x— and y-axis limits to prevent any overlap between the error bars and the plot box.
To display different positive and negative horizontal lengths for each line, specify matrices that have the same size and orientation as the x or y matrix. For example, plot two lines with different positive and negative horizontal error bar lengths for each line.
The data type of the error bar lengths must be compatible with the corresponding plot data. For example, if you plot datetime values, the error bars for those values must be duration values.
Data Types: single | double | int8 | int16 | int32 | int64 | uint8 | uint16 | uint32 | uint64 | logical | duration
ornt — Error bar orientation
«vertical» (default) | «horizontal» | «both»
Error bar orientation, specified as one of these values:
«vertical» — Vertical error bars
«horizontal» — Horizontal error bars
«both» — Vertical and horizontal error bars
Example: errorbar(x,y,err,»horizontal»)
LineSpec — Line style, marker, and color
string | character vector
Line style, marker, and color, specified as a string or character vector containing symbols. The symbols can appear in any order. You do not need to specify all three characteristics (line style, marker, and color). For example, if you omit the line style and specify the marker, then the plot shows only the marker and no line.
Example: «—or» is a red dashed line with circle markers
Источник
Adblock
detector
| Type of Plot | x and y | xneg and xpos |
|---|---|---|
| One line with error bars | ||
| Multiple lines with error bars | At least one of x or y is a matrix |

Introduction to Matlab Errorbar
Error bar is a vertical or horizontal line on any graph or plot with respect to errors. There are various ways to represent error bars with multiple variables. Error bars have some properties such as line width, line size, color, marker, and data. Line width represents the width of the error line. Line size decides the size of the error bar. by using the color option we can change the color of the error bar as red, blue, green, etc. marker is used to represents marks or points on plot and co-ordinates. We can adjust the position of error bar as per our need horizontal or vertical. In this topic, we are going to learn about Matlab Errorbar.
Syntax –
errorbar (x ,err)

errorbar (variable, error name)
errorbar (var1 ,var2 ,err)

errorbar (variable name 1, variable name2, error name)
e = errorbar (var1 ,var2 ,err)

error = errorbar (parameters, error name)
Marker = '*'

error name.marker = ‘mark symbol’
Marker Size = 25;

error name. Marker size =size
Color = 'green';

error name.color = color name
Why we use Matlab Errorbar?
In Matlab, the Error bar is used to draw vertical or horizontal lines on any plot. to represent errors graphically error bar is used. In which we can use various properties to display error graphs or error plots. we can change marker points by multiple symbols as well as we can change the size of that marker. Illustration of marker symbol and size is given in example four. By default color of the error, the bar is blue and the marker is ‘ * ’.
Examples of Matlab Errorbar
Here are the following examples of Matlab Errorbar mention below
Example #1
Let us consider one example with a single variable ‘x ’. Values of ‘x ’ varies from 1 to 99 with a uniform distance of 15. And the error is applied on variable x as multiple of 2.
Code:
clear all;

clc ;

x = 1 : 15 : 99

err = 2 * ones(size(x))

errorbar ( x ,err)
Output:
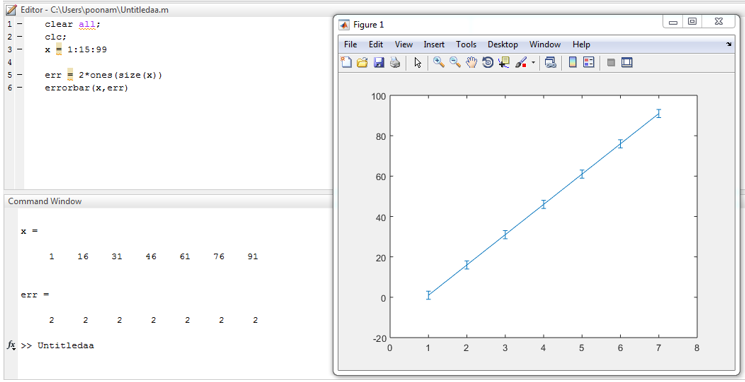
Example #2
Let us consider two-variable var 1 and var 2 with random values varies from 10 to 100. And one error is applied on the plot with respect to variable 2 in multiples of eight.
Code:
Clc ;

clear all;

var1 = [ 23 43 22 12 14 32 76 56 32 34 ]

var2 = [ 21 32 45 42 63 65 88 77 94 99 ]

err = 8 * ones(size ( var2))

errorbar ( var1,var2,err)
Output:
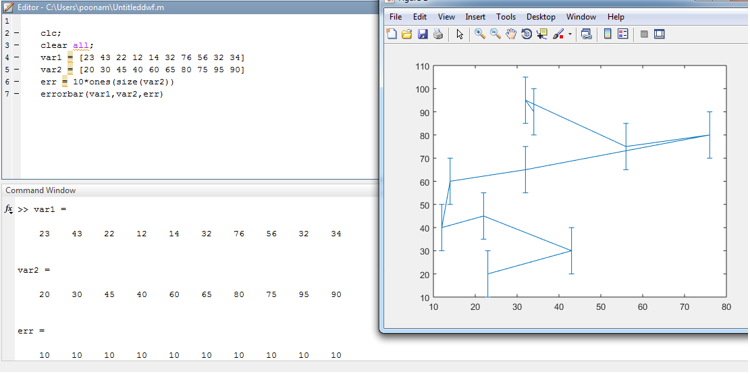
Example #3
In this example, we assume two different continuous functions instead of variables. One function is line space stored in var 1 and the second function is trigonometric cosine function, which is stored in var 2.
Code:
var1 = line space (0, 5, 10)

var2 = cos (var1)

err = [4 3 2 4 6 3 2 2 2 1]

e = errorbar (var1, var2, err)
Output:
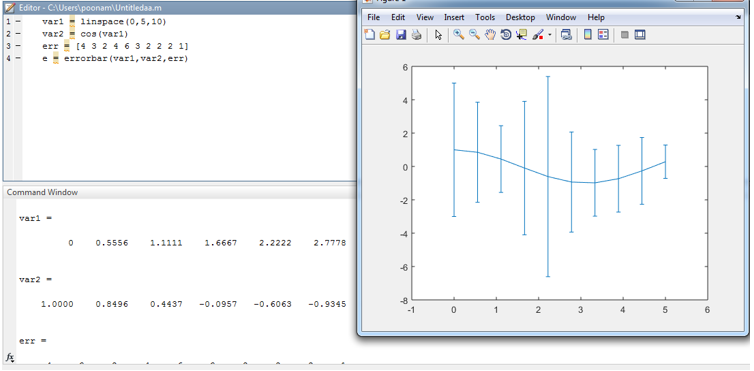
Example #4
In this example, we have used the properties of the error bar. for marker, we have assigned symbol ‘ * ’.marker size is 25 and the color assigned to the error bar is green.
Code:
Clc ;

clear all ;

var1 = [3 5 7 9 11]

var2 = cos (var1)

err = [2 2 2 2 2 ]

e = errorbar (var1, var2, err)

e .Marker = ' * ';

e .Marker Size = 25;

e .Color = ' green ';
Output:
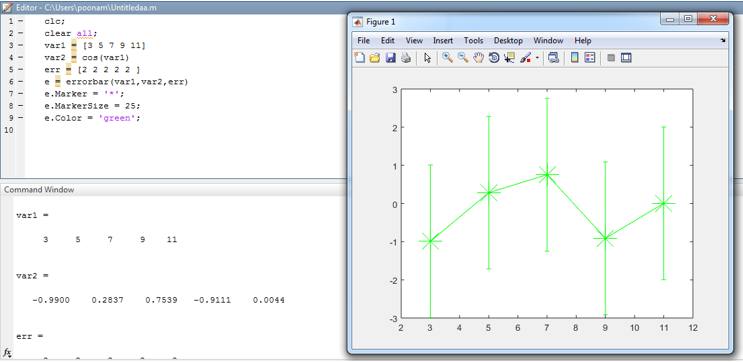
Conclusion
In this article, we have seen that representation error graph makes graph or plot very efficient. By using error bar we can properly display the errors on each coordinates of graph. Error bar can be represented in error bar, error line or error plot.
Recommended Articles
This is a guide to Matlab Errorbar. Here we discuss the basic concept, Examples of Matlab Errorbar along with output and Why we use it. You may also have a look at the following articles to learn more –
- Matlab Comet()
- Loops in Matlab
- 3D Plots in Matlab
- Matlab Count | How to Work?
- fminsearch in Matlab | Working and Examples

Approved: ASR Pro
Speed up your computer’s performance now with this simple download.
If you get a Plot Matlab error, today’s tutorial is written to help you. mathworks.com Image: mathworks.com In Matlab, an error bar is purchased to draw vertical or horizontal lines on each graph. The error field is used to graphically display errors. Where we might want to use different properties to display error graphs or error graphs. We can also change the drawing points for several symbols so that we can resize this marker.
Line chart with error bars
Description
error string ( createddraws a specific plot of data in y , err ) y verticallyError bars at each point in the data file. Define values in err the size of each error scale above and within the data points, i.e.The total length of the error supporters stripes are double err values.
Example
error bar ( and building land x , y , err ) y versus x anddraws each vertical error bar at each data point.
error bar ( drawvertical error bar at each statistical point, where x , y , neg , pos ) neg defineslength below records data specified by period and pos length of service sludgeand point data.
Example
errorbar (___, sentencesslope of error bars. Enter ornt ) ornt and 'horizontal' forhorizontal error bars or 'both' in relation to two horizontal barsand vertical error bars. Typically ornt uses 'vertical' ,vertical extraction of errors. Use this option after eachprevious combinations of input arguments.
Approved: ASR Pro
ASR Pro is the world’s most popular and effective PC repair tool. It is trusted by millions of people to keep their systems running fast, smooth, and error-free. With its simple user interface and powerful scanning engine, ASR Pro quickly finds and fixes a broad range of Windows problems — from system instability and security issues to memory management and performance bottlenecks.

Example
error bar ( x , y , yneg , ypos , xneg , xpos ) y x versus anddraws horizontal and vertical stripes of vacuum errors. yneg and ypos entriesset the top or bottom-most length of the usually vertical error bars.Define xneg in addition to xpos entriesthe left and right lengths of the person’s horizontal error bars.
Example
error bar (___, suggests this line Product, marker and colorThis icon. For example, LineSpec ) '--ro' Go to dotted red line with circular markers. The sequence style only affects the grid and probably not error bars.
Example
bar bar (___, changesthe appearance of a specific line and error bars with a possible name meaninga few more arguments. For example sentencesThe length of name, value ) 'capsize', 10 capital letters at the end of each error bar is ten points.
errorbar ( in the axes denoted by ax , ___) ax instead. to be determinedin the axes of today. Enter axes as the first invalid entry. Itemprop = “syntax”> e
Example
returnsthe ErrorBar element if is y vector. If y is usually an array, it will return a ErrorBar object.by column in y . Use e which can changeProperties of a specific ErrorBar depending on the productcreated. The list of structures can be found in the ErrorBar properties.
Examples
Hide all
Show Vertical Error Bars Of Equal Length
How to create a line plot with error bars in MATLAB?
Check the bottom and top lengths of the vertical error bars using the input argument parameters yneg and ypos, respectively. Control the left and right lengths of the horizontal error bars with xneg in addition to the xpos input argument parameters. Create a queue diagram with error bars. By Place a marker at each point of the material.
< div>
Create vectors aria-labelledby = "expand_panel_heading_bvc1i63-2_1" x and optionally y . Plot y relative to x < / code>. Displays vertical error bars of the same length at each point in the file.
x = 1: 10: 100;y corresponds to [20 45 30 40 60 65 80 70 95 90];err = 8 * units (size (y));error scale (x, y, err)
Plot Vertical Error Bars Of Different Lengths
Why does MATLAB not plot anything at all?
Why is Matlab not drawing anything? When I try to track something, nothing appears. There are no mistakes, there are only practices. The window with the number does not open. Subscribe to answer this question. You can open the previous graph anywhere and Matlab will draw it on the same shape. Look for open numbers, you may find them.
Create a row property with error bars for each aspect of the data . Vary the length of the sticker error.
x = 1: 10: 100;y = [20 30 50 40 60 65 80 75 96 90];err = [5 8 2 9 many 3 8 3 9 aria-multiselectable = "true" 3];error scale (x, y, err)
Draw Horizontal Error Bars
Create line plot with matching error bars at each data point.
x means 1:10: 100;y = [20 30 45 40 two months 65 80 75 95 90];the error corresponds to [1 3 3 5 3 5 6 2 3 3];error scale (x, y, err, 'horizontal')
Draw Vertical And Horizontal Error Bars
Create a line graph with both also horizontal error bars for each aspect of the data
x = 1: 10: 100;y = [20 30 5 40 60 65 80 75 96 90];error = [4 3 5 3 5 three positive results 6 4 3 3];error scale (x, y, err, 'both')
Draw Error Bar Without Line
Draw vectors y < / code> versus Base entry. x . Round gun display with vertical and horizontal error bars at each data point. Do not display line connecting data points without pipe style parameter for Linespec
x = 1: 10: 100;y = [20 30 45 40 dollars 60 65 80 75 95 90];erroneously equal to [4 3 5 3 5 3 five 4 3 aria-multiselectable = "true" 3];error scale (x, y, err, 'both', 'o')
Check the length of error bars in all directions

Display vertical and vertical deviations in horizontal columns at the data point. Control all top and bottom error column lengths from top to bottom using yneg along with input argument parameters ypos , assortment error columns using xneg or xpos port argument options.