Languages:
- Bahasa Indonesia
- Deutsch
- English
- Nederlands
- dansk
- español
- français
- magyar
- polski
- português do Brasil
- svenska
- čeština
- русский
- 中文
- 日本語
This page gives a basic introduction to debugging MediaWiki software.
One of the first things you will notice is that «echo» generally does not work; this is part of the general design.
PHP errors
To see PHP errors, add this to the second line from the top (right below the <?php) of LocalSettings.php:
error_reporting( -1 );
ini_set( 'display_errors', 1 );
Or set it in php.ini:
error_reporting = E_ALL
display_errors = On
Or set in .htaccess:
php_value error_reporting -1
php_flag display_errors On
This will cause PHP errors to be shown on-page. This might make it easier for attackers to find a way into your server, so disable it again when you have found the problem.
Note that fatal PHP errors may happen before the lines above are ever executed, or may prevent them from being shown. Fatal PHP errors are usually logged to Apache’s error log – check the error_log setting in php.ini (or use phpinfo()).
There are several configuration options to aid debugging. The following are all false by default. Enable them by setting them to true in your LocalSettings.php:
$wgShowExceptionDetailsEnable more details (like a stack trace) to be shown on the «Fatal error» page.$wgDebugToolbarShows a toolbar on the page with profiling, log messages and more.$wgShowDebugAdds the «log messages» part of wgDebugToolbar as a raw list to the page.$wgDevelopmentWarningsMediaWiki will throw notices for some possible error conditions and for deprecated functions.
Turning display_startup_errors on
Some providers turn display_startup_errors off, which hides the errors even if you raise the error_reporting level. Turning it on within the program is too late! Instead you’ll have to create a wrapper file around your file. In the case of MediaWiki you can just add this on top of mediawiki/index.php:
--- index.php
    error_reporting( -1 );
    ini_set( 'display_startup_errors', 1 );
    ini_set( 'display_errors', 1 );
In other environments:
--- myTestFile.php
    error_reporting( -1 );
    ini_set( 'display_startup_errors', 1 );
    ini_set( 'display_errors', 1 );
    require 'your_file.php';
SQL errors
To log all SQL queries, rather than just the one that raised the exception, set $wgDebugDumpSql in LocalSettings.php:
| MediaWiki versions: |
1.16 – 1.31 |
Prior to MediaWiki 1.32, you needed to set $wgShowSQLErrors and $wgShowDBErrorBacktrace to see details of database exceptions in the HTML output:
$wgShowSQLErrors = true;
$wgShowDBErrorBacktrace = true;
In-depth debugging
Debugger
For the most common setup (using MediaWiki-Vagrant and PhpStorm) see Manual:How to debug/with MediaWiki-Vagrant and PHPStorm.
Zend
If you are using the Zend PHP interpreter, you can debug your code with XDebug. MediaWiki-Vagrant has built in settings for this. If you’re not using MediaWiki-Vagrant, but your setup is similar, you can reuse those values. In some cases (e.g. due to a firewall), you may have to use the IDE on the same machine as the web server. In this case, you can simply set:
xdebug.remote_enable = 1
xdebug.remote_host = 'localhost'
See the XDebug documentation for more information.
To debug a command-line script (e.g. PHPUnit, or a maintenance script) on MediaWiki-Vagrant, use:
xdebug_on; php5 /vagrant/mediawiki/tests/phpunit/phpunit.php --wiki=wiki /vagrant/mediawiki/extensions/Extension/tests/phpunit/SomeTest.php; xdebug_off
Adjust the script, parameters, and remote host (it should be the IP of the computer where your IP is, 10.0.2.2 should work for MediaWiki-Vagrant) as needed.
Logging
For much greater detail, you need to profile and log errors.
The instructions below are only valid for the default configuration. If you change $wgMWLoggerDefaultSpi, for example to enable the psr3 role on a vagrant box, these settings will probably be ignored. In this case, see the documentation of your logger, for example, Manual:MonologSpi.
Setting up a debug log file
To save errors and debugging information to a log, add $wgDebugLogFile to the LocalSettings.php file. Change the value to a text file where you want to save the debug trace output.
The MediaWiki software must have permissions from your operating system to create and write to this file, for example in a default Ubuntu install it runs as user & group www-data:www-data.
Here’s a sample setting:
/**
 * The debug log file must never be publicly accessible because it
 * contains private data. But ensure that the directory is writeable by the
 * PHP script running within your Web server.
 * The filename is with the database name of the wiki.
 */
$wgDebugLogFile = "/var/log/mediawiki/debug-{$wgDBname}.log";
This file will contain much debug information from MediaWiki core and extensions.
Some subsystems write to custom logs, see #Creating a custom log file to capture their output.
Database transaction lifecycle debugging can be enabled for some databases with $wgDebugDBTransactions.
| The debug log file can contain private information such as login credentials, session cookies, and values of submitted forms. If this information is publicly accessible, attackers can use it to hack and compromise your machine and user account. If you need to share a debug log for diagnostic purposes, access the wiki without being logged in, and remove from the debug log any COOKIE lines, and don’t capture any login attempt. |
Creating a custom log file
| MediaWiki version: |
≤ 1.31 |
Prior to MediaWiki 1.32, to create a custom log file that only holds your specific debug statements, use the wfErrorLog() function.
This function takes two arguments, the text string to log and the path to the log file:
wfErrorLog( "An error occurred.n", '/var/log/mediawiki/my-custom-debug.log' );
Creating custom log groups
If you’re debugging several different components, it may be useful to direct certain log groups to write to a separate file.
See $wgDebugLogGroups for more information.
To set up custom log groups, use the following to LocalSettings.php:
/**
 * The debug log file should not be publicly accessible if it is used, as it
 * may contain private data. However, it must be in a directory to which PHP run
 * within your web server can write.
 *
 * Contrary to wgDebugLogFile, it is not necessary to include a wiki-id in these log file names
 * if you have multiple wikis. These log entries are prefixed with sufficient information to
 * identify the relevant wiki (web server hostname and wiki-id).
 */

// Groups from MediaWiki core
$wgDBerrorLog = '/var/log/mediawiki/dberror.log';
$wgDebugLogGroups = array(
	'resourceloader' => '/var/log/mediawiki/resourceloader.log',
	'exception' => '/var/log/mediawiki/exception.log',
	'error' => '/var/log/mediawiki/error.log',
	'ratelimit' => '/var/log/mediawiki/ratelimit.log',
	#'exception-json' => '/var/log/mediawiki/exception.json',

	// Extra log groups from your extension
	#'myextension' => '/var/log/mediawiki/myextension.log',
	#'somegroup' => '/var/log/mediawiki/somegroup.log',
);
To log to one of these groups, call wfDebugLog like this:
if ( $module->hasFailed ) {
    wfDebugLog( 'myextension', "Something is not right, module {$module->name} failed." );
}
If you have carefully followed the instructions above but nothing gets written to your logging file(s), and if your system is using SELinux, have a look at the logging section on the SELinux page to get around this SELinux context issue.
Writing log files to the /tmp directory may not generate any log file at all, even if the /tmp directory is supposed to be writable by anyone. This could happen if your system is using one of the systemd features that create a virtual /tmp directory for that process. If that’s the case, configure your log file to be written into a different directory, like /var/log/mediawiki
Structured logging
| MediaWiki version: |
≥ 1.25 |
Structured logging allows you to include fields in your log records.
See Structured logging for more information.
You will need to configure a better logger to collect the extra fields, for example Monolog.
Javascript error logging
| MediaWiki version: |
≥ 1.36 |
See the documentation of the mediawiki.errorLogger ResourceLoader module.
Statistics
Advanced client-side logging can be performed with Extension:EventLogging, which requires a complex setup and careful inspection of privacy issues.
Simple counting of certain kind of events is possible (since MediaWiki 1.25) using StatsD. StatsD offers meters, gauges, counters, and timing metrics.
Usage example:
$stats = $context->getStats();
$stats->increment( 'resourceloader.cache.hits' );
$stats->timing( 'resourceloader.cache.rtt', $rtt );
The metrics can be sent to a StatsD server, which may be specified via the wgStatsdServer configuration variable. (If not set, the metrics are discarded.) You can work with StatsD locally (without needing a Graphite server) by starting a StatsD server and configuring it with the «backends/console» backend, which will output metrics to the console.
As of MediaWiki 1.25, wfIncrStats() is a shortcut for the increment() method on the main RequestContext::getStats() instance.
This may occasionally be useful when supporting a non-technical end-user. It’s more secure than exposing the debug log file to the web, since the output only contains private data for the current user. But it’s not ideal for development use since data is lost on fatal errors and redirects. Use on production sites is not recommended. Debug comments reveal information in page views which could potentially expose security risks.
- $wgDebugComments
Working live with MediaWiki objects
eval.php is an interactive script to evaluate and interact with MediaWiki objects and functions in a fully initialized environment.
 $ php maintenance/eval.php
 > print wfMessage("Recentchanges")->plain();
 Recent changes
The MediaWiki-Vagrant portable virtual machine integrates the interactive PHP shell phpsh (when using Zend).
Callable updates
Code embedded in the DeferredUpdates::addCallableUpdate() function, such as $rc->save() in RecentChange.php, is not executed during the web request, so no error message will be displayed if it fails.
For debugging, it may be helpful to temporarily remove the code from within the function so that it is executed live.
Client side debugging (JavaScript)
Wikipedia offers a rich set of tools for debugging client side JavaScript.
In addition to the MediaWiki tools, other techniques are available to assist with diagnosing client interactions.
Tools:
- ResourceLoader offers a means to ensure JavaScript is easily viewable by client-side tools.
- Open your browser’s console. Many client side mediawiki scripts log error messages to the console using ResourceLoader, which provides a safety oriented way to log to the client console. Beyond the native JavaScript logging function, it provides a check to ensure that a console is available and that logging does not produce its own error. ResourceLoader/Architecture#Debug_mode also describes this feature.
- Browser tools may provide native functionality to debug client side script.
- Network tracers, like Wireshark can provide insight into the script that is being provided by a page.
- You can add
?debug=trueto your URL as in https://www.mediawiki.org/wiki/MediaWiki?debug=true to get more detailed information for debugging via your browser’s console
See also
- Manual:How to debug/Login problems
- Manual:Profiling
- ResourceLoader: ResourceLoader/Developing with ResourceLoader#Debugging
- All configuration variables related to debugging/logging: Manual:Configuration settings#Debug/logging
- Useful debugging tip:
throw new MWException( 'foo' );(dies with the given message and prints the callstack) - Manual:Errors and symptoms
- Category:Debug variables
- wikitech:Debugging in production — debugging on Wikimedia’s production cluster
- Help:Locating broken scripts
Languages:
- Bahasa Indonesia
- Deutsch
- English
- Nederlands
- dansk
- español
- français
- magyar
- polski
- português do Brasil
- svenska
- čeština
- русский
- 中文
- 日本語
На этой странице предствлено базовое введение в отладку ПО MediaWiki.
One of the first things you will notice is that «echo» generally does not work; this is part of the general design.
PHP-ошибки
Чтобы увидеть PHP-ошибки, добавьте следующее ко второй строке сверху в LocalSettings.php (прямо под <?php):
error_reporting( -1 );
ini_set( 'display_errors', 1 );
Или укажите в php.ini:
error_reporting = E_ALL
display_errors = On
Или укажите в .htaccess:
php_value error_reporting -1
php_flag display_errors On
This will cause PHP errors to be shown on-page. This might make it easier for attackers to find a way into your server, so disable it again when you have found the problem.
Note that fatal PHP errors may happen before the lines above are ever executed, or may prevent them from being shown. Fatal PHP errors are usually logged to Apache’s error log – check the error_log setting in php.ini (or use phpinfo()).
There are several configuration options to aid debugging. The following are all false by default. Enable them by setting them to true in your LocalSettings.php:
$wgShowExceptionDetailsEnable more details (like a stack trace) to be shown on the «Fatal error» page.$wgDebugToolbarShows a toolbar on the page with profiling, log messages and more.$wgShowDebugAdds the «log messages» part of wgDebugToolbar as a raw list to the page.$wgDevelopmentWarningsMediaWiki will throw notices for some possible error conditions and for deprecated functions.
Активация отображения ошибок при запуске (display_startup_errors)
Some providers turn display_startup_errors off, which hides the errors even if you raise the error_reporting level. Turning it on within the program is too late! Instead you’ll have to create a wrapper file around your file. In the case of MediaWiki you can just add this on top of mediawiki/index.php:
--- index.php
    error_reporting( -1 );
    ini_set( 'display_startup_errors', 1 );
    ini_set( 'display_errors', 1 );
В других окружениях:
--- myTestFile.php
    error_reporting( -1 );
    ini_set( 'display_startup_errors', 1 );
    ini_set( 'display_errors', 1 );
    require 'your_file.php';
SQL-ошибки
To log all SQL queries, rather than just the one that raised the exception, set $wgDebugDumpSql in LocalSettings.php:
| Версии MediaWiki: |
1.16 – 1.31 |
Prior to MediaWiki 1.32, you needed to set $wgShowSQLErrors and $wgShowDBErrorBacktrace to see details of database exceptions in the HTML output:
$wgShowSQLErrors = true;
$wgShowDBErrorBacktrace = true;
In-depth debugging
Отладчик
Zend
If you are using the Zend PHP interpreter, you can debug your code with XDebug. MediaWiki-Vagrant has built in settings for this. If you’re not using MediaWiki-Vagrant, but your setup is similar, you can reuse those values. In some cases (e.g. due to a firewall), you may have to use the IDE on the same machine as the web server. In this case, you can simply set:
xdebug.remote_enable = 1
xdebug.remote_host = 'localhost'
See the XDebug documentation for more information.
To debug a command-line script (e.g. PHPUnit, or a maintenance script) on MediaWiki-Vagrant, use:
xdebug_on; php5 /vagrant/mediawiki/tests/phpunit/phpunit.php --wiki=wiki /vagrant/mediawiki/extensions/Extension/tests/phpunit/SomeTest.php; xdebug_off
Adjust the script, parameters, and remote host (it should be the IP of the computer where your IP is, 10.0.2.2 should work for MediaWiki-Vagrant) as needed.
Журналирование
For much greater detail, you need to profile and log errors.
The instructions below are only valid for the default configuration. If you change $wgMWLoggerDefaultSpi, for example to enable the psr3 role on a vagrant box, these settings will probably be ignored. In this case, see the documentation of your logger, for example, Manual:MonologSpi.
Setting up a debug log file
To save errors and debugging information to a log, add $wgDebugLogFile to the LocalSettings.php file. Change the value to a text file where you want to save the debug trace output.
The MediaWiki software must have permissions from your operating system to create and write to this file, for example in a default Ubuntu install it runs as user & group www-data:www-data.
Here’s a sample setting:
/**
 * The debug log file must never be publicly accessible because it
 * contains private data. But ensure that the directory is writeable by the
 * PHP script running within your Web server.
 * The filename is with the database name of the wiki.
 */
$wgDebugLogFile = "/var/log/mediawiki/debug-{$wgDBname}.log";
This file will contain much debug information from MediaWiki core and extensions.
Some subsystems write to custom logs, see #Creating a custom log file to capture their output.
| The debug log file can contain private information such as login credentials, session cookies, and values of submitted forms. If this information is publicly accessible, attackers can use it to hack and compromise your machine and user account. If you need to share a debug log for diagnostic purposes, access the wiki without being logged in, and remove from the debug log any COOKIE lines, and don’t capture any login attempt. |
Creating a custom log file
Prior to MediaWiki 1.32, to create a custom log file that only holds your specific debug statements, use the wfErrorLog() function.
This function takes two arguments, the text string to log and the path to the log file:
wfErrorLog( "An error occurred.n", '/var/log/mediawiki/my-custom-debug.log' );
Creating custom log groups
If you’re debugging several different components, it may be useful to direct certain log groups to write to a separate file.
See $wgDebugLogGroups for more information.
To set up custom log groups, use the following to LocalSettings.php:
/**
 * The debug log file should not be publicly accessible if it is used, as it
 * may contain private data. However, it must be in a directory to which PHP run
 * within your web server can write.
 *
 * Contrary to wgDebugLogFile, it is not necessary to include a wiki-id in these log file names
 * if you have multiple wikis. These log entries are prefixed with sufficient information to
 * identify the relevant wiki (web server hostname and wiki-id).
 */

// Groups from MediaWiki core
$wgDBerrorLog = '/var/log/mediawiki/dberror.log';
$wgDebugLogGroups = array(
	'resourceloader' => '/var/log/mediawiki/resourceloader.log',
	'exception' => '/var/log/mediawiki/exception.log',
	'error' => '/var/log/mediawiki/error.log',
	'ratelimit' => '/var/log/mediawiki/ratelimit.log',
	#'exception-json' => '/var/log/mediawiki/exception.json',

	// Extra log groups from your extension
	#'myextension' => '/var/log/mediawiki/myextension.log',
	#'somegroup' => '/var/log/mediawiki/somegroup.log',
);
To log to one of these groups, call wfDebugLog like this:
if ( $module->hasFailed ) {
    wfDebugLog( 'myextension', "Something is not right, module {$module->name} failed." );
}
If you have carefully followed the instructions above but nothing gets written to your logging file(s), and if your system is using SELinux, have a look at the logging section on the SELinux page to get around this SELinux context issue.
Writing log files to the /tmp directory may not generate any log file at all, even if the /tmp directory is supposed to be writable by anyone. This could happen if your system is using one of the systemd features that create a virtual /tmp directory for that process. If that’s the case, configure your log file to be written into a different directory, like /var/log/mediawiki
Structured logging
Structured logging allows you to include fields in your log records.
See Structured logging for more information.
You will need to configure a better logger to collect the extra fields, for example Monolog.
Javascript error logging
See the documentation of the mediawiki.errorLogger ResourceLoader module.
Статистика
Advanced client-side logging can be performed with Расширение:EventLogging, which requires a complex setup and careful inspection of privacy issues.
Simple counting of certain kind of events is possible (since MediaWiki 1.25) using StatsD. StatsD offers meters, gauges, counters, and timing metrics.
Пример использования:
$stats = $context->getStats();
$stats->increment( 'resourceloader.cache.hits' );
$stats->timing( 'resourceloader.cache.rtt', $rtt );
The metrics can be sent to a StatsD server, which may be specified via the wgStatsdServer configuration variable. (If not set, the metrics are discarded.) You can work with StatsD locally (without needing a Graphite server) by starting a StatsD server and configuring it with the «backends/console» backend, which will output metrics to the console.
As of MediaWiki 1.25, wfIncrStats() is a shortcut for the increment() method on the main RequestContext::getStats() instance.
This may occasionally be useful when supporting a non-technical end-user. It’s more secure than exposing the debug log file to the web, since the output only contains private data for the current user. But it’s not ideal for development use since data is lost on fatal errors and redirects. Use on production sites is not recommended. Debug comments reveal information in page views which could potentially expose security risks.
- $wgDebugComments
Working live with MediaWiki objects
eval.php is an interactive script to evaluate and interact with MediaWiki objects and functions in a fully initialized environment.
 $ php maintenance/eval.php
 > print wfMessage("Recentchanges")->plain();
 Recent changes
The MediaWiki-Vagrant portable virtual machine integrates the interactive PHP shell phpsh (when using Zend).
Callable updates
Code embedded in the DeferredUpdates::addCallableUpdate() function, such as $rc->save() in RecentChange.php, is not executed during the web request, so no error message will be displayed if it fails.
For debugging, it may be helpful to temporarily remove the code from within the function so that it is executed live.
Отладка со стороны клиента (JavaScript)
Wikipedia offers a rich set of tools for debugging client side JavaScript.
In addition to the MediaWiki tools, other techniques are available to assist with diagnosing client interactions.
Инструменты:
- ResourceLoader offers a means to ensure JavaScript is easily viewable by client-side tools.
- Open your browser’s console.
Many client side mediawiki scripts log error messages to the console using ResourceLoader, which provides a safety oriented way to log to the client console. Beyond the native JavaScript logging function, it provides a check to ensure that a console is available and that logging does not produce its own error. ResourceLoader/Architecture#Debug_mode also describes this feature.
- Browser tools may provide native functionality to debug client side script.
- Network tracers, like Wireshark can provide insight into the script that is being provided by a page.
- You can add
?debug=trueto your URL as in https://www.mediawiki.org/wiki/MediaWiki?debug=true to get more detailed information for debugging via your browser’s console
См. также
- Manual:How to debug/Login problems
- Manual:Profiling
- All configuration variables related to debugging/logging: Manual:Configuration settings#Debug/logging
- Useful debugging tip:
throw new MWException( 'foo' );(dies with the given message and prints the callstack)
- Manual:Errors and symptoms
- Категория:Отладочные переменные
- wikitech:Debugging in production — debugging on Wikimedia’s production cluster
- Help:Locating broken scripts
- This page is about server log files. For IRC channel logs, see e.g. https://wm-bot.wmcloud.org/
Logs of several sorts are generated across the cluster and collected in a single location replicated on some machines. Privileged users can explore most logs through the OpenSearch Dashboards front-end at https://logstash.wikimedia.org/.
The SRE Observability team is working on a common log format called ECS, see the linked doc and intro slides. ECS documentation can be found at https://doc.wikimedia.org/ecs/
For a quick reference of debugging techniques, see Logs/Runbook.
mwlog1002:/srv/mw-log/
These record wfDebugLog() and similar calls in MediaWiki (see especially mw:Structured logging). All cluster-wide logs are aggregated here (configured through $wmgUdp2logDest, see also wmgMonologChannels). There are dozens log files, which amount to around 15 GB compressed per day as of April 2015. Some are not sent to logstash (settings) and some are sampled; log archives are stored for a variable amount of time, up to 90 days (per data retention guideline). Note that logstash also records the context data for structured logging, so it might contain significantly more information than the files.
Source: All appserver clusters.
Directories:
archive/: Directory holding a limited number of previous days of the same logs (compressed once a day).
General channels:
exception.log: Fatal exceptions that receive either a localised «Internal error» page, or a Wikimedia Error page rendered by php-wmerrors.- Error pages report a request ID, e.g.
[d84af39036] 2011-04-01: Fatal exception of type MWException". - To find details, search for
d84af39036in exception.log, or in Grafana under the «mediawiki» dashboard the exception log for «1903eff7» to find the complete stack trace).
- Error pages report a request ID, e.g.
apache2.log: aggregated Apache error logs, see #syslogapi.log: API requests and their parameters (including redacted POST payloads, and temporary PII). This used to be sampled, but is no longer (during 2014-2015) and is flushed every 30 days as of Nov 2015.
Specific components:
antispoof.log: Collision check passes and failures from the AntiSpoof extension. This checks for strings that look the same using different Unicode characters (such as spoofed usernames).badpass.log: Failed login attempts to wikis.captcha.log: Captcha attempts (both failed and successful attempts).centralauth.log(2013-05-09–),centralauth-bug39996.log,centralauthrename.log(2014-07-14–): (temporary) debug logs for bugzilla:35707, bugzilla:39996, bugzilla:67875. In theory, rare events; can include username and page visited/request made.CirrusSearch.log: Logs various info concerning cirrus (update/query failures and various debug info), Cirrus now uses the analytics platform to log search requests (Analytics/Data/Cirrus).CirrusSearchSlowRequests.log: Logs slow requestsCirrusSearchChangeFailed.log: Logs update failuresexternal.log: ExternalStore blob fetch failures (see External storage)imagemove.log: Page renames in the File namespace that take place (both failed and successful renames).memcached.log: Memcached for MediaWiki (WANObjectCache, misc ephemeral data, rate limiting counters, advisory locks).poolcounter.log: PoolCounter failures (connection problems, excess queue size, wait timeouts).redis.log: Redis query and connection failures (might involve sessions, job queues, and some other assorted features).resourceloader.log: Exceptions related to ResourceLoader.runJobs.log: Tracks job queue activity and including errors (both failed and successful runs).- Can be used to produce stats on jobs run on the various wikis, e.g. with Tim’s
perl ~/job-stats.pl runJobs.log.
- Can be used to produce stats on jobs run on the various wikis, e.g. with Tim’s
swift-backend.log: Errors in the SwiftFileBackend class (timeouts and HTTP 500 type errors for file and listing reads/writes).slow-parse.log(since May 2012; 6 months archive)spam.log: SimpleAntiSpam honeypot hits from bots (attempted user actions are discarded).XWikimediaDebug.log: see X-Wikimedia-Debug#Debug logging.
syslog
The syslog for all application servers can be found on apache2.log on mwlog1001 or /srv/syslog/apache.log on centrallog1001. This includes things like segmentation faults.
5xx errors
5xx errors are available on centrallog1001.eqiad.wmnet:/srv/weblog/webrequest/5xx.json. And in logstash, with Varnish 5xx Logstash dashboard
deploy1002:/var/log/l10updatelog/l10update.log
Source: scap
l10update.log: Error log for LocalisationUpdate runs.
vanadium:/var/log/eventlogging/
various: Logs of EventLogging entries. Potentially useful, in case their transformation into SQL records fails.
Request logs
Logs of any kind of request, e.g. viewing a wiki page, editing, using the API, loading an image.
- Analytics/Data/Webrequest: «wmf.webrequest» is a name of one unsampled requests archive in Hive. We started deleting older wmf.webrequest data in March 2015. We currently keep 62 days.
- Used for ad-hoc queries.
- Used to generate dumps for pagecounts-all-sites
centrallog1001:/srv/weblog/webrequest
The cache (outer layer) request logs; see Squid logging#Log files.
- Cache log format
- Analytics/Requests stream
The 1:1000 sampled logs are used for about 15 monthly and quarterly reports and day to day operations (source).
Beta cluster
The mw:Beta cluster has a similar logging configuration to production.
Various server logs are written to the remote syslog server deployment-mwlog01.deployment-prep.eqiad1.wikimedia.cloud in /srv/mw-log.
Apache access logs are written to /var/log/apache2/other_vhosts_access.log on
each beta cluster host.
See mw:Beta_Cluster#Testing_changes_on_Beta_Cluster for information on how to access the beta logstash web UI.
Mailservers
exim logs are retained for 90 days (see phabricator:T167333).
Dead
Lucene (search)
Each host logs at /a/search/log/log (now less noisy), see Search#Trouble on how to identify which host serves what pool etc.
fenari:/home/wikipedia/syslog
Source: All apaches
apache.log: Error log of all apaches (includes sterr of PHP, so PHP Notices, PHP Warnings etc.)- Use
fatalmonitorto aggregate this into a (tailing) report - This has been deprecated in favor of fluorine:/a/mw-log/apache2.log and logstash.
- Use
fenari:/var/log/
Source: Machine-specific logs
l10nupdatelog/l10nupdate.log: Used by LocalisationUpdate.
External links
- Recommendation from the Usage Log Retention Policy Workshop
Just set up a PHP Debug environment for Mediawiki. Couldn’t find a good overall documentation for that so writing this blog post. The part 1 of the post includes the different methods that are supported by the Mediawiki software itself. Mediawiki software ensures a lot of Debugging tools for the developers.
It is very important to ensure that the debugging tools are disabled on production sites, they might actually be used by attackers in such cases.
So, here we go:
- Mediawiki is complex software, PHP commands such as echo will not work.
- Checking PHP errors- Include this code in LocalSettings.php.
    error_reporting( -1 );
    ini_set( 'display_errors', 1 );
- Startup errors might be disabled using
display_startup_errorswhich might hide errors even in the above case. To ensure that the above works, add this to top of index.php
    error_reporting( -1 );
    ini_set( 'display_startup_errors', 1 );
    ini_set( 'display_errors', 1 );
Some important Mediawiki configuration variables for debugging
$wgShowExceptionDetails: Enable details like stack traces to be shown on the “Fatal error” page.$wgDebugToolbar: Very effective toolbar on all webpages. Contains options of profiling, log messages, PHP includes etc. Can be used to view custom log messages as well.$wgDevelopmentWarnings: Show possible error conditions and for deprecated functions.
View Debug output-Set these configuration values to true in LocalSettings.php
$wgShowDebug: Adds a list of “log messages” to the page. Can be used to view all the database queries as well.$wgDebugComments: Adds Debug output as HTML comments for the user.$wgShowSQLErrors: Show SQL errors$wgDebugDumpSql: Show SQL debug dump$wgShowDBErrorBacktrace: Show SQL errors call stack
Adding to the Debug output
- Debug text passed to function
wfDebug()is printed with the Debug output. - The call stack can be viewed as text in the Debug data using the function
wfBacktrace()
Logging debugging data
A log file can be set up by adding this in LocalSettings.php
$wgDebugLogFile = "/var/log/mediawiki-debug.log";
Mediawiki allows creation of custom log files and groups.
For instance, to print output of a specific function to a file, use
wfErrorLog( "Some debug text", '/var/custom-debug.log' );
To create custom log groups, add this to LocalSettings.php
    $wgDebugLogGroups = array(
	'mydebug' => '/var/log/mediawiki-mydebug.log',
    );
Now logging to this group can be done by:
wfDebugLog( 'mydebug', "Debugging comment" );
Working with Mediawiki objects using PHP
eval.php is an interactive script which allows users to work live with Mediawiki objects and database.
To run it, simply type in terminal:
php maintenance/eval.php
The script automatically loads Mediawiki classes so can be very handy.
Some examples:
    > print wfMessage( "Recentchanges" )->plain();
    Recent changes
Interaction with the database can be done using the Database Abstraction Layer in Mediawiki. For example:
    > $dbr = wfGetDB( DB_SLAVE );
    > $result = $dbr->select( 'page','page_len' )
    > foreach( $result as $row ) { /* DO SOMETHING */ }
Further ways to access the database can be found here
That’s all for today. In the next post, I will cover Debugging methods using IDEs, they are independent of the application used, Mediawiki in the current case.
MediaWiki has various logs which keep track of all the performed actions on the site. Each log registers and keeps history of a particular action. For example, the delete log shows a list of all page deletions (and restorations).
View and Access Logs
By default, all users can view almost all of the logs (with the exception of the suppress log). This can be done by going to Tools menu>Special pages button>Recent changes and logs section>Logs button. On the page that opens there’s a drop-down menu from which you can select a specific log, then click on the Go button. There are also some other filtering options; for example, you can select a certain time period.
You can also access the page for viewing logs by directly opening its URL address. Just add Special:Log to the main URL of your site. For example, if your site is accessible at youdomain.com, then open yourdomain.com/index.php/Special:Log.
Restrict Access to Logs
If you want to, you can restrict access to specific logs. This is not done from the frontend of the site. Like many other things this is performed by modifying the LocalSettings.php file of your MediaWiki application. It is done by adding the option $wgLogRestrictions with the name of the log to which you want to restrict access and a user permission. The following syntax is used:
$wgLogRestrictions[‘name-of-log’] = ‘name-of-permission’;
Of course, you have to replace name-of-log with the actual log’s name and name-of-permission with the particular permission. Only users that belong to a user group with that permission will be able to access the log. For this purpose you can either user a permission that already exists and is assigned to the user groups to which you want to give access, or you can create a new permission and use that permission. You can assign the new permission to existing groups or create new ones.
For example, by adding the following line at the end of LocalSettings.php:
$wgLogRestrictions[‘tag’] = ‘delete’;
only users who have the delete right will be able to access the log that shows the list of tags that have beend added/removed by users. By default, all registered users have the delete permission, so the log will not be accessible to anonymous users.
As we mentioned you can create a specific right, add it to a user group(s) and then use that right to restrict the access to logs. For example, by adding the following lines to LocalSettings.php:
$wgGroupPermissions['sysop']['restricted-logs'] = true;
$wgLogRestrictions['rights'] = 'restricted-logs';
$wgLogRestrictions['import'] = 'restricted-logs';
the user right restricted-logs will be created and assigned to the sysop group (that’s the group of the administrators); this is done with the first line. Then the second line restricts access to the log for viewing changes to user group membership (rights log), so that only users with the restricted-logs right can view it, and the third line does the same but for the log for listing imported pages.
Log Names
The name of the log is put in the first pair of brackets of the option $wgLogRestrictions and so you need to know the exact label of the log as defined in the code of MediaWiki. This label is not exactly the same as the corresponding name of the log that appears on the frontend.
Log names are defined with the option $wgLogTypes in the file DefaultSettings.php of your MediaWiki. The file is in the includes folder of the application. By searching for that option in the file you’ll find the list with the default labels for the logs. They are:
block — the log that lists the actions performed for blocking and unblocking users.
protect — this log keeps track of the changes of the protection level of pages.
rights — lists the changes to the group membership of users.
delete — log that lists the deletions and restorations of pages.
upload — the log for uploaded files.
move — this log registers all pages moves.
import — the log for page imports.
patrol — the log that keeps history of all page patrolling actions.
merge — this log registers the merges of page histories.
suppress — the suppression log lists actions related to hiding log information from administrators. In MediaWiki there’s a feature with which you can give a certain user group the right to hide log information for log entries from administrators (and registered users). For example, you can hide the username of a user who deleted a particular page, as well as the name of the page. The suppression log lists the actions performed to hide log entries.
By default, this log is not accessible to anybody, it has to be specifically enabled. This is done with the option $wgLogRestrictions as shown in the previous section. Just use the name of this log and specify a user permission (and if necessary assign that permission to a user group). There’s a user right specifically related to this that comes preconfigured with MediaWiki; it’s labeled suppressionlog. But by default it’s not assigned to any group.
tag — a log that keeps track of the adding and removal of tags performed by users to revision histories and log entries.
managetags — the tag management log registers all actions performed with tags manually (without those performed automatically by the application.
You an also find out what the label of a log is by opening that log and viewing its URL address. Go to the frontend page for the logs, select the log from the drop-down menu and open it by clicking on the Go button. Then check its URL address in the web browser. If, for example, the main address of your site is yourdomain.com, then the URL will look like something like this yourdomain.com/index.php?title=Special%3ALog&type=managetags&user=&page=&year=&month=-1. The part type=managetags shows the label of the log as defined in the code; in this case it’s managetags (that’s the Tag management log).
In this post I first describe the current approaches taken to logging and profiling in MediaWiki, then outline why these are problematic, and finish with a few thoughts on how things can be improved. The problems encountered and solutions proposed are not MediaWiki specific and can be apply to similar situations elsewhere.
The current approach
In MediaWiki, profiling, amongst many other things, is done by calling static functions. Sometimes these have the form of global functions such as wfProfileIn, and sometimes they are located in classes, such as SMWProfiler::In.
Each usage of wfProfileIn needs to be matched with a closing wfProfileOut. Doing so provides you with information in the execution time between those two calls, if you turned profiling on.
Typically a wfProfileIn is made near the start of some method, and a wfProfileOut is made before each exit point of the method. Bigger methods can have multiple profiling sections. (Though those that do are certainly doing to much.)
Problems
Since every usage of methods such as wfProfileIn create a static binding, the user of your class does not have the option to not making this profiling call, or to have it be made to a different profiler. You could modify or swap out the global profiler, though that is going to create more problems then it solves in any non-trivial system. This also points out that global state is used, which we all know is bad.
Also see the excellent “static considered harmful” blog post by Kore Nordmann, and read about the aptly named STUPID acronym.
Concrete places where one runs into the above problems are when writing tests, and when one wants assert the profiling calls are made correctly. Or when you want to enable profiling only in part of your object graph. Or if you have any other usage that is not the default. Global state and static kill the flexibility of your code.
A different type of problem the current approach has is in the form of clutter. Profiling calls and logging calls are made through your business logic, while those two things are clearly quite distinct. This has a number of negative consequences.
First of all, it increases complexity, by adding more things into methods. Readability and understandability suffer, which in turn increase likelihood of new bugs being introduced and the code rotting further.
Having to put in an opening call to profileIn and matching closing calls to profileOut is a very error prone process. It’s quite easy to miss an exit point of a method. (Or rather, it is in the MediaWiki codebase, and in most codebases out there. Again, keeping methods appropriately focused eliminates this problem.) It is even easier to introduce new exit points later on, and either not realize one needs to also add a profileOut call, or simply forget about it. And since this code is not being tested due to it being static and global, you are not going to notice the error until someone that tried to profile starts shouting at you.
The clutter problem gets worse as more profiling, logging, debugging calls, and similar are added.
And all of this code gets executed the whole time, and has to be understood by every developer that needs to do some task affecting or affected by this code. In most cases, this is forcing things not relevant to people onto them. Does it make sense to have all these calls to wfProfile, wfLog, wfDebug and so on happen on your production system? As a developer changing some business rule in a method, or even merely understand it, do you want to be forced to hold into account these concerns all of the time while most of the time there would be no such need if concerns where properly separated?
Thoughts on how to make things better
MediaWiki should be rewritten from ground up, in Haskell.
More seriously, there are two main approaches that can be used to tackle some of the outlines problems.
- One way to achieve great separation between your domain logic and cross cutting concerns such as profiling and logging is to make use of the decorator pattern.
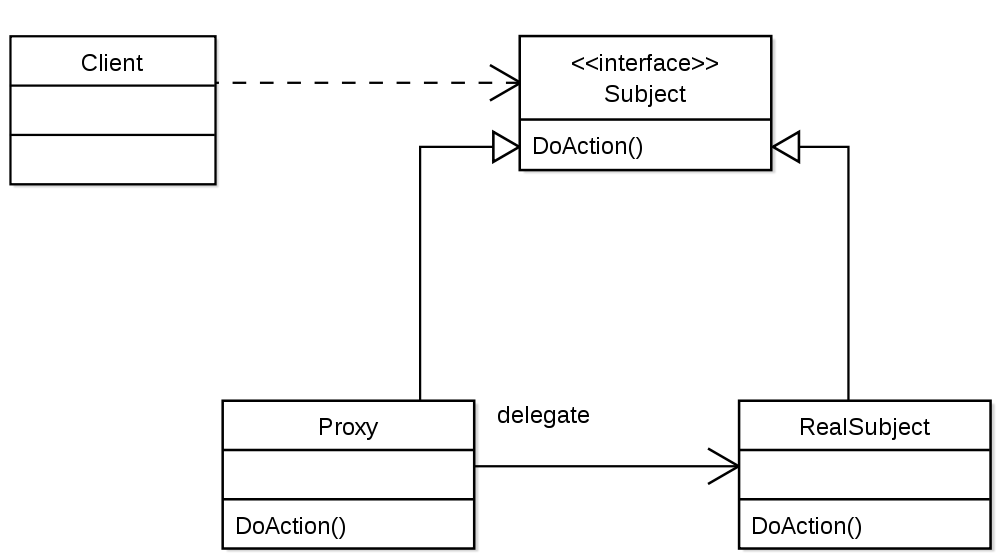
This is a very simple pattern with lots of similarity to other “wrapping patterns” such as Adapter and Proxy. Unlike the Adapter pattern, the wrapping class implements the same interface, rather then adapting to another one. The above UML diagram is actually for the Proxy pattern, and at least to me is easier to quickly understand then the Decorator one on Wikipedia. This does not matter much though, since the patterns are structurally identical as far as we are concerned here.
Imagine you have some service object from the domain layer titled “AwesomenessMultiplier”, containing a bunch of business logic. Depending on what kind of public methods this class has, you either create a new abstract class or interface with the name “AwesomenessMultiplier”, after you renamed the original class to something else. Lets say we renamed it to “ConcreteAwesomenessMultiplier”. Now you can create a ProfilingAwesomenessMultiplier that extends/implements AwesomenessMultiplier.
ProfilingAwesomenessMultiplier will be the place where you put all profiling calls. This class has all the public methods specified by AwesomenessMultiplier, after all, it implements/extends it. In these public methods you can add profiling, logging and whatnot calls as you like, and appropriately forward the call to an object taking care of the real behaviour. This object is stored in a field of type AwesomenessMultiplier.
So typically such a decorating class for logging or profiling will have two fields: a AwesomenessMultiplier and a Logger/Profiler. Both would be injected via the constructor. If you lack such a Profiler interface, you can put in static calls in the decorator as an intermediate step. It’ll get rid of the clutter problem, and decrease the static binding problem. The later will however still be in your decorator, and presumably in lots of other parts of your application. It is thus well worthwhile to create the trivial abstractions needed to get rid of this.
You can have a LoggingAwesomenessMultiplier wrap a AwesomenessMultiplier, and have that whole thing wrapped by a ProfilingAwesomenessMultiplier. And then pass it around through your system without any of it knowing anything about logging, profiling, or the use of decorators to hide those concerns.
- Proper dependency injection
In case one needs to make calls that are not at the start/end of public methods, using decorators does not work nicely. You could somewhat modify the approach by using inheritance so you can place calls around protected methods as well. That however breaks encapsulation and might cause more problems then it solves.
You are thus forced to have some logging, profile, etc, code in the same class with your business logic. It thus becomes very important the concerns outlined in this post are addressed as best as possible, as unlike with the decorator approach, they’ll be in your face the whole time.
Step one is getting rid of those nasty static calls relying on global state. Enter dependency injection.
Inject a thing implementing a Logger or a Profiler interface in the constructor of your object and stuff it into a field. Your code then calls $this->logger->log() rather then wfLog().
When creating such interfaces, keep the Interface Segregation Principle in mind. They should not contain everything that could possibly be related to logging. In case of PHP development, also consider the PSR-3 standard which has been adopted by a bunch of frameworks already.
In case of doing calls such as profileIn that need matching profileOut closing calls, do separate this on the method level. Rather then doing this
|
public function multiplyAwesomeness() { profileIn( __METHOD__ ); if ( foo() ) { $result = bar(); profileOut( __METHOD__ ); return $result; } $result = ‘baz’; profileOut( __METHOD__ ); return $result; } |
Consider doing the below:
|
public function multiplyAwesomeness() { profileIn( __METHOD__ ); $result = $this—>doAwesomenessMultiplication(); profileOut( __METHOD__ ); return $result; } protected function doAwesomenessMultiplication() { if ( foo() ) { return bar(); } return ‘baz’; } |
Post Views: 4,036