MongoDB is a popular NoSQL database as it is a highly scalable and cost-effective one. It is a document-oriented and cross-platform database application.
The differentiating factor of a NoSQL database is that it stores data differently from relational databases like MySQL and is not tabular.
MongoDB uses JSON-like documents with optional schemas. The data can be used and stored without worrying about relationships or tables. And for diagnosing issues, monitoring your deployment, and fine tuning performance, MongoDB Logs are useful.
Big businesses widely use MongoDB, and it’s understandable why. MongoDB is quicker than a SQL database and is simple to scale. It is a fantastic choice if you’re searching for a database that won’t have you spend time worrying about relationships and scalability.
It is a top-tier, C++-written open-source NoSQL database. Another factor in choosing it is that it’s free and performs better. In this blog, you can learn more about how to analyze MongoDB logs messages using the free MongoDB logs analyzer tools like mtools.
Table of Contents
- What is MongoDB, & How Does It Store Data?
- What Are MongoDB Logs?
- What Types of Event Messages Should You Monitor in MongoDB Logs?
- What are MongoDB Logs Message?
- What are mtools?
- Visualizing MongoDB Logs File with mplotqueries
- Conclusion
What is MongoDB, & How Does It Store Data?
Technically speaking, MongoDB is a document-oriented NoSQL database, meaning that documents are used in a schema to describe models. MongoDB stores documents (objects) in a format called BSON. In addition, its primary selling factors include simple indexing, replication, ad-hoc queries, schema lessness, cross-platform support, and superior performance.
Consider a document an object whose keys and values fall under the same taxonomy. Here is an example of a JSON-encoded document model for a typical user and its corresponding BSON:
Here is a JSON document example.
{
"hello” : "world"
}
MongoDB is innovative by incorporating this structure into a new format known as BSON, a binary representation of JSON data optimizing the speed, schema flexibility, and governance, resulting in enhanced scalability.
When storing the JSON document, it will be converted to the following.
x16x00x00x00             // total document size
x02                         // 0x02 = type String
hellox00                    // field name
x06x00x00x00worldx00    // field value (size of value, value, null terminator
x00                         // 0x00 = type EOO ('end of object')
MongoDB partitions data by breaking up more enormous shards into smaller pieces which can be performed automatically or manually, depending on certain conditions.
When you use MongoDB, it records some messages in its logs, just like any other database, including MySQL.
It is helpful to be aware of the issue before it arises and causes any negative impact. You can fix the problem in advance if you are aware of it. You can find information in the logs that, when used properly, can save time and effort in case of issues.
As the ability of businesses to collect data explodes, data teams have a crucial role in fueling data-driven decisions. Yet, they struggle to consolidate the data scattered across sources into their warehouse to build a single source of truth. Broken pipelines, data quality issues, bugs and errors, and lack of control and visibility over the data flow make data integration a nightmare.
1000+ data teams rely on Hevo’s Data Pipeline Platform to integrate data from over 150+ sources in a matter of minutes. Billions of data events from sources as varied as SaaS apps, Databases, File Storage and Streaming sources can be replicated in near real-time with Hevo’s fault-tolerant architecture. What’s more – Hevo puts complete control in the hands of data teams with intuitive dashboards for pipeline monitoring, auto-schema management, and custom ingestion/loading schedules.
This, combined with transparent pricing and 24×7 support, makes us the most loved data pipeline software on review sites.
Take our 14-day free trial to experience a better way to manage data pipelines.
Get started for Free with Hevo!
What Types of Event Messages Should You Monitor in MongoDB Logs?
MongoDB encodes numerous log messages. You will not use every log message to address your application’s issue. You must know what information from MongoDB logs is crucial.
You’ll primarily search for log messages like fatal, error, warning, and debug.
According to the official MongoDB documentation, the log messages have various levels ranging from fatal to debug, where debug is the lowest level. Beginning with MongoDB 4.4, all log messages are output by mongod/mongos instances in structured JSON format.
The log entry format is a set of key-value pairs, where each key denotes a field type of the log message, like “severity,” and each corresponding value contains the logging data related to that field type, like “informational.”
What are MongoDB Logs Message?
You can find MongoDB logs in the MongoDB log files at /var/log/mongodb/mongodb.log or else; check the mongodb.conf.- a configuration file specifying the location of logs.
The log file structure is the first thing you’ll need to understand. The log file is a JSON structure, as described earlier. Each key in a key-value combination that makes up a log entry identifies a different sort of log message field, such as “severity.”
For each appropriate value, such as “informational,” the accompanying logging data gets recorded. Log entries appear as plain text, which isn’t always readable.
What are mtools?
You can use Unix commands as a MongoDB log analyzer to do a fair analysis. However, several tools make log analysis more accessible. mtools is a fantastic open-source utility.
Suppose that slow queries executing against MongoDB are hurting the performance of the database; you can determine where MongoDB is slowing down by using mtools. mtools is a collection of Python utility scripts to analyze and filter MongoDB log files, display information from log files, and rapidly build up sophisticated local MongoDB test setups. Look at the “queries” section of mloginfo first.
Use command – mloginfo mongod.log –queries
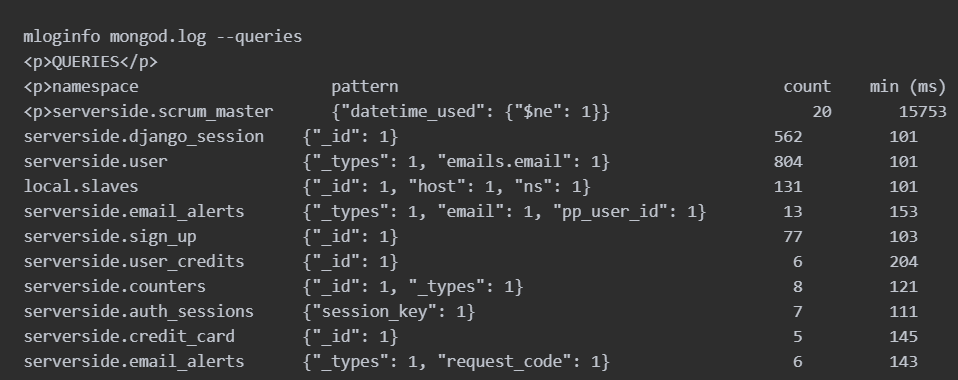

Each line shows the namespace, the query pattern, and statistics of a particular namespace/pattern combination. The rows get sorted by the “sum” column, descending. Sorting by sum is an excellent way to see where the database spent most of its time.
Further mlogfilter assists in refining log file searches. The script allows you to filter log messages based on their namespace (database and collection names), operation (queries, inserts, updates, commands, etc.), and individual connection.
Lastly, mplotqueries takes a log file (mlogfiltered or not) and visualizes the data in various ways. Several graph kinds are available, including scatter plots (showing all operations over time versus their length), histograms, event and range plots, and other specific graphs such as connection churn and replica set changes.
Visualizing MongoDB Logs File with mplotqueries
mtools can provide visualization of query performance and other operations graphically. mplotqueries’ scatter plot shows the duration of any operation (y-axis) over time (x-axis), thus making it easy to spot long-running operations. The following plot gets generated with
mplotqueries mongod.logand then press L for the “logarithmic” y-axis view:
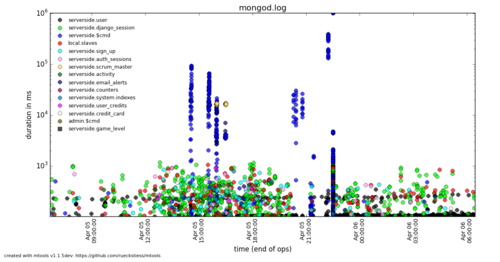
The blue dots stand out, showing hundreds and thousands of seconds, unlike others which are sub-seconds—clicking on any of the blue dots prints out the relevant log line to stdout for analysis and action. You can learn further in-depth details on mtools here.
Conclusion
Similar to other log messages, MongoDB logs are pretty helpful for resolving problems. You may use the terminal to analyze the log file by displaying its contents. Even though this is functional, it is difficult to view or search data through the terminal. It becomes considerably worse when the log file contains important data.
The commands included in mtools MongoDB log analyzers, such as mloginfo, mlogfilter, mplotqueries, mlogvis, and mlaunch, may help you do more with a tool like mtools. This program has several limitations, including the inability to show data on the terminal, despite its vast command set. You may also explore commercial mongodb log analyzer tools for MongoDB log analysis if required.
VISIT OUR WEBSITE TO EXPLORE HEVO
Hevo, a No-code Data Pipeline, provides you with a consistent and reliable solution for seamless data replication from a wide variety of Sources & Destinations — that, too, in just a few clicks!
Want to give Hevo a try? Sign Up for a 14-day free trial and experience the feature-rich Hevo suite first hand. You may also look at the amazing price, which will assist you while selecting the best plan for your requirements.
Share your experience understanding MongoDB Logs and how we analyze them in the comment section below! We would love to hear your thoughts.
With the hype around document databases continuing to grow, and around MongoDB in particular, we get a lot of questions about how people should move their applications over to using it. The advice is usually the same – especially for existing applications – take one step at a time. With that said, we’d like to show off what we consider to be an excellent place to start: using MongoDB for error logging.
MongoDB is an excellent fit for logging (and of course other things as well) for many reasons. For one, it is very VERY fast for writing data. It can perform writes asynchronously; your application wont hang because your logging routines are blocked. This allows you to centralize your logs which makes it easier to querying against them to find issues. Also, its query interface is easy to work with and is very flexible. You can query against any of the field names or perform aggregate functions either with map/reduce or MongoDB 2.2’s upcoming aggregation framework.
This article will show how you can use existing code to add a logging library to your code and log errors to MongoDB. You’ll also see how to query MongoDB from the command line and how to filter those queries to find the information you are interested in.
Setting Up The Logger
Before writing a MongoDB logging class for PHP, we took a quick look to see what else was out there already and found a nice micrologging tool on GitHub called Analog. In the interest of not reinventing the wheel, we’ll use this in our examples.
What we really liked about Analog is the simplicity of its code and the number of things you can log to! It’s designed to be extensible, so you should be able to easily build on in to anything specific you may need for your own project.
The logger is fairly self-contained, so all you’ll need to do to make its functionality available is to include its main file Analog.php. This takes care of the autoloading and namespace registration needed for it to find its dependencies. Since it uses spl_autoload_register(), it will happily co-exist alongside any other autoloading arrangements you already have in place.
To start using the logger, you’ll need to intialize the logging handler you want to use and then pass it to the main logging class. There are some examples included with the project which makes it easy to see what you need for a specific platform. For MongoDB, we have the following:
<?php
Analog::handler(AnalogHandlerMongo::init(
	"localhost:27017",
	"testing",
	"log"));
All we have to do here is to point Analog at our MongoDB installation (ours is on the same machine as the web server and uses the default port), tell it to use the testing database, and write to the log collection. With this included somewhere at the top of our script, probably along with various other bootstrapping tasks, we’re ready to go.
Logging Errors
At this point we can use the logging functionality anywhere we want it in our application. To log an error, simply do:
<?php
Analog::log("Oh noes! Something went wrong!");
To see what’s in the database, open the mongo shell.
lorna@taygete:~$ mongo
type "help" for help
> use testing
> db.log.find();
{ "_id" : ObjectId("4f268e9dd8562fc817000000"), "machine" : "localhost", "date" : "2012-02-29 11:11:16", "level" : 3, "message" : "Oh noes! Something went wrong!" }
As you can see this gives us the error message, the severity, the date and time that the error was created, and the machine from which it came. The machine identifier comes from $_SERVER["SERVER_ADDR"] if set, otherwise “localhost” is used.
Logging Levels
The Analog library comes with a great set of constants that you can use to set the level of each error. Here’s a snippet from the class to showing them:
<?php
...
class Analog {
    /**
     * List of severity levels.
     */
    const URGENT   = 0; // It's an emergency
    const ALERT    = 1; // Immediate action required
    const CRITICAL = 2; // Critical conditions
    const ERROR    = 3; // An error occurred
    const WARNING  = 4; // Something unexpected happening
    const NOTICE   = 5; // Something worth noting
    const INFO     = 6; // Information, not an error
    const DEBUG    = 7; // Debugging messages
...
The default is level 3 to denote an error. To log an error of any other level, pass the desired level as a second parameter to the log() method:
<?php
Analog::log("FYI, a log entry", Analog::INFO);
Looking in the database now, we can how our log messages collection will grow.
> db.log.find();
{ "_id" : ObjectId("4f268e9dd8562fc817000000"), "machine" : "localhost", "date" : "2012-02-29 11:11:16", "level" : 3, "message" : "Oh noes! Something went wrong!" }
{ "_id" : ObjectId("4f268e9dd8562fc817000001"), "machine" : "localhost", "date" : "2012-02-29 12:35:41", "level" : 6, "message" : "FYI, a log entry" }
Although (as with all logs) in a real application we’ll be building up a large set of data, using a database means we can easily generate summary information or filter the data to find only the important entries.
Filtering And Summarizing MongoDB Logs
Using database storage means the ability to search results, and MongoDB is designed to be easy for developers to use even with large datasets. The days of grep’ing enormous flat-file logs are over! We can very easily filter the data to show only what we’re interested in.
> db.log.find({level: 3});
{ "_id" : ObjectId("4f268e9dd8562fc817000000"), "machine" : "localhost", "date" : "2012-02-29 11:11:16", "level" : 3, "message" : "Oh noes! Something went wrong!" }
There are some higher-level entries also in the database since we have many different levels of logging. To show everything of error severity and above (a lower error level constant), we can query with the operator $lte:
> db.log.find({level: {$lte: 3}});
{ "_id" : ObjectId("4f268e9dd8562fc817000000"), "machine" : "localhost", "date" : "2012-02-29 11:11:16", "level" : 3, "message" : "Oh noes! Something went wrong!" }
{ "_id" : ObjectId("4f26aaafd8562fcb27000009"), "machine" : "localhost", "date" : "2012-02-29 13:01:04", "level" : 0, "message" : "To the lifeboats!" }
We can also look for date ranges, for example, using a $gt comparison to pull the most recent few log entries from my database:
> db.log.find({date: {$gt: "2012-02-29 14:35:30"}});
{ "_id" : ObjectId("4f26aaafd8562fcb2700000a"), "machine" : "localhost", "date" : "2012-02-29 14:35:31", "level" : 4, "message" : "Empty variable $a on line 127" }
{ "_id" : ObjectId("4f26aaafd8562fcb2700000b"), "machine" : "localhost", "date" : "2012-02-29 14:35:35", "level" : 4, "message" : "Empty variable $a on line 93" }
{ "_id" : ObjectId("4f26aaafd8562fcb2700000c"), "machine" : "localhost", "date" : "2012-02-29 14:35:40", "level" : 4, "message" : "Empty variable $a on line 277" }
{ "_id" : ObjectId("4f26aaafd8562fcb2700000d"), "machine" : "localhost", "date" : "2012-02-29 14:35:45", "level" : 6, "message" : "FYI, it seems to be snowing" }
If you commonly query data on a particular field, you can speed up your queries by adding an index. For example, if you frequently query on level and date you can create a compound index:
> db.log.ensureIndex({ date : -1, level : 1 } );
The above line will create a single index if it doesn’t already exist. There’s a couple things worth noting here, however. First, we placed date first as it will have the largest variation and therefore the index will do the most good. We also created date as a reverse index as we commonly want to query for the most recent entries. Secondly, we added level as part of the index. This compound index will make any query on date and any query on date and level more efficient. It will not be able to be used for queries on just level and not date.
Sometimes you’ll want to look for overall trends in your logs, so you’ll group how many of a particular error happens. In this example, we’ve grouped the error set by the error level to show how many there are of each:
> db.log.group({key: {level: true}, initial: {count: 0}, reduce: function (obj, prev){prev.count++}});
[
    {
        "level" : 3,
        "count" : 1
    },
    {
        "level" : 6,
        "count" : 4
    },
    {
        "level" : 4,
        "count" : 8
    },
    {
        "level" : 0,
        "count" : 1
    }
]
You can use the group() function to count errors per day, or from a particular machine, as you so choose. Do take care though as this approach is only useful on small data sets. If you have over 10,000 results then you’ll want to use map/reduce to generate the results.
Summary
It makes sense to start small when looking at adding MongoDB to an existing application, and logging is an ideal candidate. Different types of errors can include different types of information and you can also save the current object or any other information to MongoDB since it has a flexible schema. Any new technology can be a bit of a learning curve but hopefully the command line examples help you to get quite close to what you are working on. Implementing just one piece of functionality in something new can be a great way to get your feet wet – hope you enjoy MongoDB as much as we do!
Image via mama-art / Shutterstock
The main log file is the mongod.log. You can specify the log file location when you are starting the mongod process but if you have installed on Ubuntu from a package then you log file will normally be located in /var/log/mongodb/mongod.log.
You can tail the log file using:
tail -f /var/log/mongodb/mongod.log
From the Mongo shell you can also view the log file using:
show logs
global

show log global
Log Levels
Mongo logs have a number of verbosity levels from 0 to 5. 0 is the quietest and 5 is the most verbose. The default level is 0.
The typical log entry follows the following pattern:
<timestamp> <severity> <components> [<context>] <message>
2016-03-03-07T35:22:33.456-700 I NETWORK [initandlisten] waiting...
One nice feature is that you canset the logging level for a specific component. So if you are having a problem wiht the network you can just increase the level for this one component. The command to do this is:
db.setLogLevel(verbosity from 0 to 5, [component])
db.setLogLevel(2,'query')
The components are:
- accessControl
- command
- control
- geo
- index
- network
- query
- replication
- storage
- journal
- write
Note: The component is optional but if you do not specify a component then the new logging level is set for all components.
To see the current log levels use:
db.getLogComponents()
You can reset the loglevel by setting it to -1 which means it will use the default level.
db.setLogLevel(-1,'query')
Logging Configuration
You can set the logging level in the mongod.conf.
storage:
   dbPath: "/data"

systemLog:
   destination: file
   path: "/var/log/mongodb/mongod.log"

   component:
      query:
         verbosity: 2
      command:
         verbosity: 1
Mongo will use the new setting the next time mongo is restarted.
Query Profiling
You can set the Profiling Level so that you can flag slow queries. The format is:
db.setProfilingLevel(Level 0-2, Threshold in ms)
db.setProfilingLevel(2,20)
You can look at the details of a query using:
db.system.profile.find({op: 'query', ns: 'mydatabase.mycollection'})
MongoStat
The mongostat tool comes with mongo and it gives runtime statistics for mongod servers. To use it just attach it to a server using:
mongostat --host myserver --port 27017
If you do not specify a host or port it will assume the local server on the default port. You can also specify a specific number of rows ie --rowcount 10, otherwise it will just keep producing statistics.
MongoTop
The mongotop tool show you where mongod spends monst of its time. Like mongostat it will continiously show data.
db.stats()
You can run db.stats() in the shell to get a picture of disk and memory usage.
db.stats()
{
    "db" : "mydatabase",
    "collections" : 19,
    "objects" : 347914,
    "avgObjSize" : 817.9144041343551,
    "dataSize" : 284563872,
    "storageSize" : 352567296,
    "numExtents" : 72,
    "indexes" : 28,
    "indexSize" : 57101184,
    "fileSize" : 520093696,
    "nsSizeMB" : 16,
    "extentFreeList" : {
            "num" : 0,
            "totalSize" : 0
    },
    "dataFileVersion" : {
            "major" : 4,
            "minor" : 22
    },
    "ok" : 1
}
This returns the result in bytes. It is better to look at the data in megabytes (1000000) so we pass that to the db.stats() function.
db.stats(1000000)
{
    "db" : "mydatabase",
    "collections" : 19,
    "objects" : 347914,
    "avgObjSize" : 817.9144041343551,
    "dataSize" : 284.563872,
    "storageSize" : 352.567296,
    "numExtents" : 72,
    "indexes" : 28,
    "indexSize" : 57.101184,
    "fileSize" : 520.093696,
    "nsSizeMB" : 16,
    "extentFreeList" : {
            "num" : 0,
            "totalSize" : 0
    },
    "dataFileVersion" : {
            "major" : 4,
            "minor" : 22
    },
    "ok" : 1
}
You can also just gets stats on a particular collection:
db.locations.stats(1000000)
{
    "ns" : "mydatabase.locations",
    "count" : 29123,
    "size" : 55,
    "avgObjSize" : 1896,
    "numExtents" : 9,
    "storageSize" : 58,
    "lastExtentSize" : 20.64384,
    "paddingFactor" : 1,
    "paddingFactorNote" : "paddingFactor is unused and unmaintained in 3.0. It remains hard coded to 1.0 for compatibility only.",
    "userFlags" : 1,
    "capped" : false,
    "nindexes" : 4,
    "totalIndexSize" : 3,
    "indexSizes" : {
            "_id_" : 0,
            "vendorName_Lower_1" : 0,
            "geo_2dsphere" : 0,
            "locationName_1" : 1
    },
    "ok" : 1
}
Server Status
You can get the server runtime status by using db.serverStatus() or running the db.runCommand({serverStatus:1}) command.
You can also just get a piece of information, for example the network status:
db.serverStatus().network
{
    "bytesIn" : NumberLong(82899),
    "bytesOut" : NumberLong(183990),
    "numRequests" : NumberLong(402)
}
Or Memory:
db.serverStatus().mem
{
"bits" : 64,
"resident" : 76,
"virtual" : 660,
"supported" : true,
"mapped" : 0,
"mappedWithJournal" : 0
}
Or Cursors (which are a limited resource too)
db.serverStatus().metrics.cursor
{
    "timedOut" : NumberLong(0),
    "open" : {
        "noTimeout" : NumberLong(0),
        "pinned" : NumberLong(2),
         "total" : NumberLong(2)
    }
}