В MySQL на данный момент существуют 4 вида журнала (лога) и при достаточно серьёзной работе с базами на MySQL необходимо за ними следить. Например, бинарный лог у нас за сутки набирает около гигабайта, а размер жёсткого диска на сервере ограничен и за ними надо следить. Однако следить следует не только за бинарным логом, так как логи (журналы) в MySQL могут принести немалую пользу.
Итак, какие логи ведёт MySQL? Это:
1. бинарный лог (binary log)
2. лог ошибок (error log)
3. лог медленный запросов (slow query log)
4. лог запросов (general query log)
5. лог репликаций (relay log)
Каждый из них по-своему полезен.
Бинарный лог
В первую очередь полезен с точки зрения репликаций. Можно его бэкапить, можно использовать для восстановления данных на более точное время при использовании бэкапов. Лог содержит все команды изменений базы данных, выборки (select, show) не сохраняет, для таблиц, поддерживающих транзакции (BDB, InnoDB) запись в лог выполняется только после выполнения команды COMMIT. Для лога можно указывать список баз данных, которые надо логировать и список баз данных, которые не надо логировать. В более ранних версиях вместо бинарного лога использовался лог обновлений. Использование бинарного лога снижает производительность базы данных, однако его польза настолько велика, что крайне не рекомендуется его отключать. Рекомендуется защищать бинарный лог паролем, так как он может данные также о паролях пользователей. При достижении максимально разрешённого размера (1 гиг по умолчанию) создаётся следующий файл. Каждый новый файл имеет порядковый номер после имени.
Содержание бинарного лога можно посмотреть с помощью утилиты mysqlbinlog.
Основные настройки в my.cnf
Местоположение лога:
log_bin = /var/log/mysql/mysql-bin.log
Максимальный размер, минимум 4096 байт, по умолчанию 1073741824 байт (1 гигабайт):
max_binlog_size= 500M
Сколько дней хранится:
expire_logs_days = 3
Наиболее часто использующиеся команды
Повторение действий после операции восстановления:
shell> mysqlbinlog log_file | mysql -h server_name
Удаление логов до определённого файла:
PURGE BINARY LOGS TO 'mysql-bin.000';
Удаление логов до определённой даты:
PURGE BINARY LOGS BEFORE 'YYYY-MM-DD hh:mm:ss';
Лог ошибок
Особенно полезен в случаях сбоев. Лог содержит информацию об остановках, запусках сервера, а также сообщения о критических ошибках. Может содержать сообщения с предупреждениями (warnings).
Основные настройки в my.cnf
Местоположение лога:
log_error = /var/log/mysql/mysql.err
Флаг, указывающий стоит ли записывать в лог в том числе предупреждения (записываются, если значение больше нуля):
log_warnings = 1
Наиболее часто использующиеся команды
Переход к новому файл лога:
shell> mysqladmin flush-logs
Копирование старой части лога (необходимо, так как в случае повторного выполнения fluch он будет удалён):
shell> mv host_name.err-old backup-directory
Лог медленных запросов
Если есть подозрение, что приложение работает медленно из-за неэффективных запросов к базе, то в первую очередь следует проверить лог медленных запросов. В случае оптимизации запросов этот лог поможет выяснить, что необходимо оптимизировать в первую очередь.
Основные настройки в my.cnf
Местоположение лога:
log_slow_queries = /var/log/mysql/mysql_slow.log
Со скольки секунд выполнения запрос считается медленным, минимальное значений — 1 секунда, по умолчанию 10 секунд:
long_query_time = 10
Если надо логировать запросы, которые не используют индексы, надо добавить строку:
log-queries-not-using-indexes
Если надо вести лог медленных команд, таких как OPTIMIZE TABLE, ANALYZE TABLE и ALTER TABLE:
log-slow-admin-statements
Лог запросов
Лог содержит информацию о подключениях и отключениях клиентов, а также все SQL запросы, которые были получены. Фактически, это временный лог. Обычно лог удаляется автоматически сразу после выполнения всех команд (т.е. как только он стал ненужным). Лог ведётся в соответствии с очередность поступления запросов. Этот лог содержит все запросы к базе данных (независимо от приложений и пользователей). Так что если есть желание (или необходимость) проанализировать, какие необходимы индексы, какие запросы могли бы оптимизированы, то этот лог как раз может помочь в таких целях. Лог полезен не только для случаев, когда необходимо знать, какие запросы выполняются с базой данных, но и в случаях, когда ясно, что возникла ошибка с базой данных, но неизвестно, какой запрос был отправлен к базе данных (например, в случае генерации динамического SQL-а). Рекомендуется защищать лог запросов паролем, так как он может данные также о паролях пользователей.
Основные настройки в my.cnf
Местоположение лога:
log = /var/log/mysql/mysql.log
Наиболее часто использующиеся команды
В отличии от других логов, перезагрузка сервера и команда fluch не инициирует создание нового лога. Но это можно сделать вручную:
shell> mv host_name.log host_name-old.log

shell> mysqladmin flush-logs

shell> mv host_name-old.log backup-directory
Лог репликаций
Здесь логируются изменения, выполненные по инициации сервера репликаций. Как и бинарный лог, состоит из файлов, каждый из которых пронумерован.
Основные настройки в my.cnf
Местоположение лога:
relay-log = /var/log/mysql/mysql-relay-bin.log
Максимальный размер:
max_relay_log_size = 500М
Наиболее часто использующиеся команды
Начать новый файл лога можно только при остановленном дополнительном (slave) сервере:
shell> cat new_relay_log_name.index >> old_relay_log_name.index

shell> mv old_relay_log_name.index new_relay_log_name.index
Команда fluch logs инициирует ротацию лога.
This tutorial shows you how to configure and view different MySQL logs. MySQL is
an open-source relational database based on SQL (Structured Query Language).
MySQL offers various built-in logs. In general, a database is the cornerstone of
almost every backend, and because of that administrators want to log this
service.
MySQL has multiple logs with different purpose. We will focus on following four
logs:
- Error log: Records problems encountered starting, running, or stopping
mysqld. This log is stored by default in the/var/logdirectory. It could
be useful if you want to analyze the server itself. - General query logs: Records every connection established with each client.
This log records everything that client sent to the server. This log is useful
to determine client problems. - Binary logs: Record each event that manipulates data in the database.
These log records operations such as a table creating, modification of schema,
inserting new values, or querying tables. These logs are used to backup and
recover the database. - Slow query log: Record of each query, which execution took too much time.
This log could be useful for the optimisation of slow SQL queries.
In this tutorial, you will do the following actions:
- You will install the MySQL server and view default error log.
- You will connect to MySQL server, view metadata about general query logs
and view these logs. - You will understand the concept of the MySQL binary logs and where to find
them. - You will enable and configure a slow query log, simulate some slow query
and check this incident in the new log.
🔭 Want to centralize and monitor your MySQL logs?
Head over to Logtail and start ingesting your logs in 5 minutes.
Prerequisites
You will need:
- Ubuntu 20.04 distribution including the non-root user with
sudoaccess. - Basic knowledge of SQL languages (understanding of simple select query
statement).
Step 1 — Viewing Error Log
The MySQL server is maintained by the command-line program mysqld. This
program manages access to the MySQL data directory that contains databases and
tables. The problems encountered during mysqld starting, running, or stopping
are stored as a custom log in the directory /var/log/mysql. This log doesn’t
include any information about SQL queries. It is useful for the analysis of the
MySQL server.
First of all, let’s install the MySQL server. Ubuntu 20.04 allows to install the
MySQL from default packages with the apt install (installation requires sudo
privilege):
$ sudo apt update
$ sudo apt install mysql-server
The first command will update Ubuntu repositories, and the second will download
and install required packages for the MySQL server.
Now, the server is installed. The new service already creates a default error
log. You can list the directory /var/log and find a new subdirectory mysql
with ls:
You’ll see the program’s output appear on the screen:
Output
alternatives.log       bootstrap.log           kern.log.4.gz
alternatives.log.1     btmp                    lastlog
alternatives.log.2.gz  btmp.1                  letsencrypt
alternatives.log.3.gz  cups                    my-custom-app
apache2                dist-upgrade            mysql
apport.log             dmesg                   openvpn
apport.log.1           dmesg.0                 private
apport.log.2.gz        dmesg.1.gz              speech-dispatcher
apport.log.3.gz        dmesg.2.gz              syslog
apport.log.4.gz        dmesg.3.gz              syslog.1
apport.log.5.gz        dmesg.4.gz              syslog.2.gz
apport.log.6.gz        dpkg.log                syslog.3.gz
apport.log.7.gz        dpkg.log.1              syslog.4.gz
apt                    dpkg.log.2.gz           syslog.5.gz
auth.log               dpkg.log.3.gz           syslog.6.gz
auth.log.1             faillog                 syslog.7.gz
auth.log.2.gz          fontconfig.log          teamviewer15
auth.log.3.gz          gdm3                    test.log
auth.log.4.gz          gpu-manager.log         ubuntu-advantage.log
boot.log               gpu-manager-switch.log  unattended-upgrades
boot.log.1             hp                      wtmp
boot.log.2             installer               wtmp.1
boot.log.3             journal                 Xorg.0.log
boot.log.4             kern.log                Xorg.0.log.old
boot.log.5             kern.log.1              Xorg.1.log
boot.log.6             kern.log.2.gz           Xorg.1.log.old
boot.log.7             kern.log.3.gz
The output shows also directory mysql. This directory contains by default
single log error.log. Let’s view the content of file error.log with cat:
cat /var/log/mysql/error.log
You’ll see the program’s output appear on the screen:
Output
2021-04-28T09:36:19.040254Z 0 [System] [MY-013169] [Server] /usr/sbin/mysqld (mysqld 8.0.23-0ubuntu0.20.04.1) initializing of server in progress as process 62373
2021-04-28T09:36:19.046865Z 1 [System] [MY-013576] [InnoDB] InnoDB initialization has started.
2021-04-28T09:36:20.482915Z 1 [System] [MY-013577] [InnoDB] InnoDB initialization has ended.
2021-04-28T09:36:23.709432Z 6 [Warning] [MY-010453] [Server] [email protected] is created with an empty password ! Please consider switching off the --initialize-insecure option.
2021-04-28T09:36:28.971810Z 6 [System] [MY-013172] [Server] Received SHUTDOWN from user boot. Shutting down mysqld (Version: 8.0.23-0ubuntu0.20.04.1).
2021-04-28T09:36:33.851492Z 0 [System] [MY-010116] [Server] /usr/sbin/mysqld (mysqld 8.0.23-0ubuntu0.20.04.1) starting as process 62437
2021-04-28T09:36:33.870257Z 1 [System] [MY-013576] [InnoDB] InnoDB initialization has started.
2021-04-28T09:36:34.114770Z 1 [System] [MY-013577] [InnoDB] InnoDB initialization has ended.
2021-04-28T09:36:34.222753Z 0 [ERROR] [MY-011292] [Server] Plugin mysqlx reported: 'Preparation of I/O interfaces failed, X Protocol won't be accessible'
2021-04-28T09:36:34.222924Z 0 [ERROR] [MY-011300] [Server] Plugin mysqlx reported: 'Setup of socket: '/var/run/mysqld/mysqlx.sock' failed, can't create lock file /var/run/mysqld/mysqlx.sock.lock'
2021-04-28T09:36:34.354295Z 0 [Warning] [MY-010068] [Server] CA certificate ca.pem is self signed.
2021-04-28T09:36:34.354479Z 0 [System] [MY-013602] [Server] Channel mysql_main configured to support TLS. Encrypted connections are now supported for this channel.
...
The output shows that the file stores plain text records about the mysqld
server initialisation, and running.
Step 2 — Viewing General Query Logs
The server writes records about each client event during connection to the
general query log. Basically, it keeps the information about all SQL statements
that happens. This log is useful when the administrators want to know what
clients exactly execute.
Connecting to Server and Checking General Query Log Status
First of all, let’s check the status of the general query log because this
logging feature can be turned off.
You can connect to MySQL server as a root client:
You will be redirected to MySQL command-line.
Now, you can view system variables related to the general query log by executing
command show variables:
mysql> show variables like '%general%';
The clause specifies a pattern that should match the variable. In our case, the
pattern '%general%' specifies to show variables that contain the string
general. You’ll see the program’s output appear on the screen:
Output
+------------------+-----------------------------+
| Variable_name    | Value                       |
+------------------+-----------------------------+
| general_log      | ON                          |
| general_log_file | /var/lib/mysql/alice.log    |
+------------------+-----------------------------+
2 rows in set (0.01 sec)
The output shows two variables:
general_log: the variable holds valueON(general log enable), orOFF
(general log disabled).general_log_file: the variable defines where is the log stored in the file
system.
As you can see, the general query log is by default enabled. We can disconnect
from the server by executing the exit command:
You will be redirected back to the terminal.
Viewing General Query Log
Now, you can view the content of this log with a cat (the sudo is required
because this file is maintained by the system):
$ sudo cat /var/lib/mysql/alice.log
You’ll see the program’s output appear on the screen:
Output
/usr/sbin/mysqld, Version: 8.0.23-0ubuntu0.20.04.1 ((Ubuntu)). started with:
Tcp port: 3306  Unix socket: /var/run/mysqld/mysqld.sock
Time                 Id Command    Argument
2021-04-28T10:47:28.713271Z    10 Connect   [email protected] on  using Socket
2021-04-28T10:47:28.713625Z    10 Query select @@version_comment limit 1
2021-04-28T10:53:50.778598Z    10 Query show variables like '%general%'
2021-04-28T13:35:41.944309Z    10 Quit
The output shows all statement executed on the server. You can see the time
stamp and the specific command that was executed. There is also the executed
command show variables like '%general%'.
Step 3 — Listing Binary Logs
The binary log contains events that manipulated the database. If you want to
recover the database, you need a backup and a binary log relevant to this
backup. There are multiple binary logs because they are versioned.
By default, the binary logs are enabled. You can check where are they stored.
Let’s connect to the MySQL server as a root client:
You will be redirected to MySQL prompt.
Now, you can check the binary logs status by executing show binary logs:
The command will list the binary log files on the server:
Output
+---------------+-----------+-----------+
| Log_name      | File_size | Encrypted |
+---------------+-----------+-----------+
| binlog.000001 |       179 | No        |
| binlog.000002 |       403 | No        |
| binlog.000003 |       770 | No        |
| binlog.000004 |       179 | No        |
| binlog.000005 |       403 | No        |
| binlog.000006 |       892 | No        |
+---------------+-----------+-----------+
6 rows in set (0.00 sec)
The output shows all binary logs. Now, we can find out where are this logs
stored.
We can show logs location by executing command show variables:
mysql> show variables like '%log_bin%';
We already use this show clause in the previous step. This time, the clause
shows variables that contain the string log_bin. You’ll see the program’s
output appear on the screen:
Output
+---------------------------------+-----------------------------+
| Variable_name                   | Value                       |
+---------------------------------+-----------------------------+
| log_bin                         | ON                          |
| log_bin_basename                | /var/lib/mysql/binlog       |
| log_bin_index                   | /var/lib/mysql/binlog.index |
| log_bin_trust_function_creators | OFF                         |
| log_bin_use_v1_row_events       | OFF                         |
| sql_log_bin                     | ON                          |
+---------------------------------+-----------------------------+
6 rows in set (0.00 sec)
The output shows that the binary logs are stored in directory /var/lib/mysql,
and they are labelled as binlog.index (for example binlog.000001).
We can disconnect from the server by executing the exit command:
You will be redirected back to the terminal.
Now, let’s list the directory /var/lib/mysql but only as a root because it is
owned and maintained by the system:
You’ll see the program’s output appear on the screen:
Output
auto.cnf         ca.pem                 ib_logfile0    private_key.pem
binlog.000001    client-cert.pem      ib_logfile1      public_key.pem
binlog.000002    client-key.pem       ibtmp1             server-cert.pem
binlog.000003    debian-5.7.flag      '#innodb_temp' server-key.pem
binlog.000004    EXAMPLE_DB           alice.log      sys
binlog.000005    '#ib_16384_0.dblwr'  alice.pid      undo_001
binlog.000006    '#ib_16384_1.dblwr'  mysql            undo_002
binlog.index     ib_buffer_pool       mysql.ibd
ca-key.pem     ibdata1              performance_schema
The output shows that the directory /var/lib/mysql contains the binary log
files.
Step 4 — Configuring Slow Query Log
MySQL allows to log queries, which took too much time. This mechanism is called
a slow query log.
Enabling Slow Query Logging
By default, the slow query log is disabled. You can enable it by editing MySQL
configuration file /etc/mysql/mysql.conf.d/mysqld.cnf (sudo required):
$ sudo nano /etc/mysql/mysql.conf.d/mysqld.cnf
The file contains following lines that holds configuration variables (by default
commented out):
...
# Here you can see queries with especially long duration
# slow_query_log          = 1
# slow_query_log_file     = /var/log/mysql/mysql-slow.log
# long_query_time = 10
...
These three lines holds following three configuration variables:
slow_query_log: the slow query logging is disable (value0) or enabled
(value1).slow_query_log_file: the slow query log is stored in the file
/var/log/mysql/mysql-slow.log. You can specify your own file.long_query_time: by default, the slow query logs record each SQL query that
takes more than 10 seconds. You can change this minimal time interval to
another value. The value can be specified as a floating-point number where the
value1.0refers to 1 second.
You can enable slow query log by uncommenting this three lines. Also, you can
set your own long_query_time value:
...
# Here you can see queries with especially long duration
slow_query_log          = 1
slow_query_log_file     = /var/log/mysql/mysql-slow.log
long_query_time = 5
...
In our example, we change the default long_query_time value to 5 seconds. Now,
you can save the file.
If you want immediately apply the new configuration rules then you must restart
the MySQL server with systemctl (sudo required):
$ sudo systemctl restart mysql.service
Now, the MySQL server enables slow query log.
Checking Slow Query Log Status
You can check that the log is enabled if you login into the MySQL server as a
root client:
You will be redirected to MySQL prompt.
Let’s check the slow query log status by executing command show variables:
mysql> show variables like '%slow_query_log%';
Once again, we use the show clause. This time, the clause shows variables that
contain the string slow_query_log. You’ll see the program’s output appear on
the screen:
Output
+---------------------+----------------------------------+
| Variable_name       | Value                            |
+---------------------+----------------------------------+
| slow_query_log      | ON                               |
| slow_query_log_file | /var/log/mysql/mysql-slow.log   |
+---------------------+----------------------------------+
2 rows in set (0.00 sec)
The output shows that the slow query log is enabled (the variable
slow_query_log holds the value ON). The log is stored in the file
/var/log/mysql/mysql-slow.log. You can see that it is the same file as the
file specified in the configuration script.
Let’s view actual slow query time interval by executing the command
show variables:
mysql> show variables like '%long_query_time%';
You’ll see the program’s output appear on the screen:
Output
+-----------------+-----------+
| Variable_name   | Value     |
+-----------------+-----------+
| long_query_time |  5.000000 |
+-----------------+-----------+
1 row in set (0.00 sec)
The output shows that the variable long_query_time holds the value 5 seconds
(as we define in the configuration script).
Viewing Slow Query Log
At last, we can check that the MySQL records slow queries to the new log. You
can execute the following select query that takes 6 seconds:
The select will wait 6 seconds and then return 0:
Output
+----------+
| sleep(6) |
+----------+
|        0 |
+----------+
1 row in set (6.01 sec)
The output shows that this query takes 6 seconds. As a result, it should be
recorded in a slow query log.
We can disconnect from the server by executing the exit command:
You will be redirected back to the terminal.
At last, we can print content of the slow query log
/var/log/mysql/mysql-slow.log (the sudo is required because the file is
maintained by system):
$ sudo cat /var/log/mysql/mysql-slow.log
You’ll see the program’s output appear on the screen:
/usr/sbin/mysqld, Version: 8.0.23-0ubuntu0.20.04.1 ((Ubuntu)). started with:
Tcp port: 3306  Unix socket: /var/run/mysqld/mysqld.sock
Time                 Id Command    Argument
# Time: 2021-04-29T06:28:55.445053Z
# [email protected]: root[root] @ localhost []  Id:    15
# Query_time: 6.000443  Lock_time: 0.000000 Rows_sent: 1  Rows_examined: 1
SET timestamp=1619677729;
select sleep(6);
You can see that the output shows record about execution query
select sleep(6).
Conclusion
In this tutorial, you configured and viewed different MySQL logs. You installed
the MySQL server and viewed the error log. You connected to the server,
viewed the general query logs and their configuration. You listed binary
logs. At last, you enabled, configured and viewed a slow query log.
Centralize all your logs into one place.
Analyze, correlate and filter logs with SQL.
Create actionable
dashboards.
Share and comment with built-in collaboration.
Got an article suggestion?
Let us know
![]()
![]()
![]()
Next article
How To Start Logging With PostgreSQL
Learn how to start logging with PostgreSQL and go from basics to best practices in no time.
→
![]()
This work is licensed under a Creative Commons Attribution-NonCommercial-ShareAlike 4.0 International License.

Introduction of MySQL Log File
MySQL log file consists of records of actions that has been performed. MySQL server generates log files that are generated based on the actions performed. The log files are of different types: – error logs, ISAM log, general query log, update log, binary log, and slow query log.
- Error log File: It consists of all the records that has been encountered while running, starting or stopping mysql.
- ISAM Log File: It records all the changes that has been done to the ISAM tables.Used only for ISAM code debugging.
- General Query Log File: Contains information regarding the connections established and executed queries.
- Update Log File: Consists of information on all the changes that have been performed on data.
- Binary Log File: Which consists of all the modification that happened in the database
- Slow Query Log File: Stores all the details of the queries that took more than the “long_query_time” to execute.
Syntax of MySQL Log File
To check log location and settings the error log file in the shell:
mysql -se "SHOW VARIABLES" | grep -e log_error
To check log location and settings the general log file in the shell:
mysql -se "SHOW VARIABLES" | grep-e general_log
To check log location and settings the slow query log file in the shell:
mysql -se "SHOW VARIABLES" | grep -e slow_query_log
How does MySQL Log File Works?
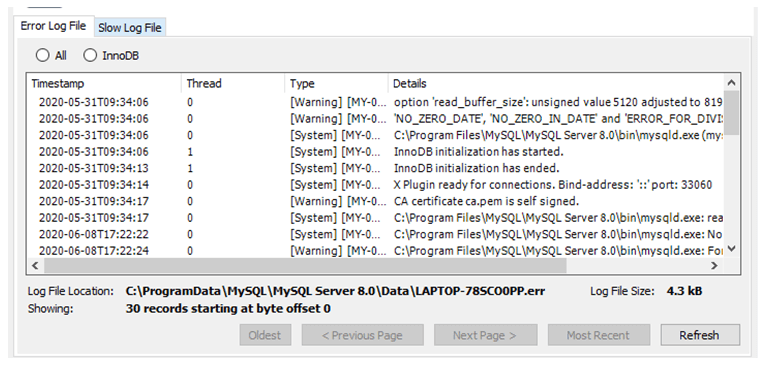
Now let us see the error log that records the information about the errors encountered while running, starting or stopping mysqld. In windows, we have the path called “C:ProgramDataMySQLMySQL Server 8.0Data” which consists of the error log as mentioned in the below screenshot. The type of the error log file is “err”. Below we have highlighted the same.
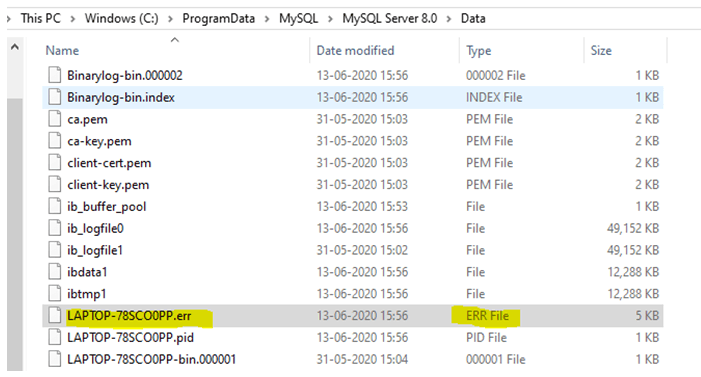
1. Error Log File
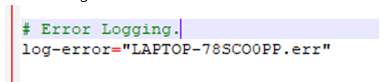
We can see the details of the error log file in the “config” file (my.ini) from the path
“C:ProgramDataMySQLMySQL Server 8.0”.

# Error Logging.

log-error="LAPTOP-78SCO0PP.err"
2. General Log File
Contains information regarding the connections established and executed queries.We can see the details of the general log file in the “config” file (my.ini) from the path “C:ProgramDataMySQLMySQL Server 8.0”.
# General and Slow logging.

log-output=FILE

general-log=0

general_log_file="LAPTOP-78SCO0PP.log"
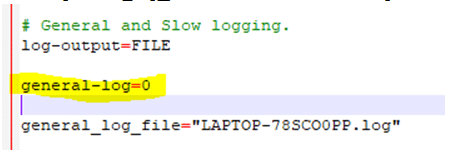
Here the “general-log” =0 which means that the general log is not enabled. To enable we need to set the value to “general-log” =1.
3. Binary Log File
Show BINARY LOGS
Output:
| Log_name | file_size | Encrypted |
| LAPTOP-78SCO0PP-bin.000001 | 179 | No |
| LAPTOP-78SCO0PP-bin.000002 | 2129912 | No |
mysqlbinlog log-file | mysql -h server_name
4. ISAM Log File
myisamlog processes contain the information of a MyISAM log file. In order to create the ISAM log file, we start the server with a –log-isam=log_file option. We just need to invoke myisamlog as below:
myisamlog [options] [file_name [tbl_name] …]
Options can be of –c, -f, -F, -i, -o etc
5. Update Log File
The update log is replaced by the binary log. When the server is started, we mention the option with a file name as “–log-update[=file_name]” , mysqld writes a log file containing all SQL commands that update data like UPDATE or DELETE. It skips the UPDATE statements if the column value is already existing.
6. Slow Query Log File
Stores all the details of the queries that took more than the “long_query_time” to execute. Below is the query that shows the longest query executed.
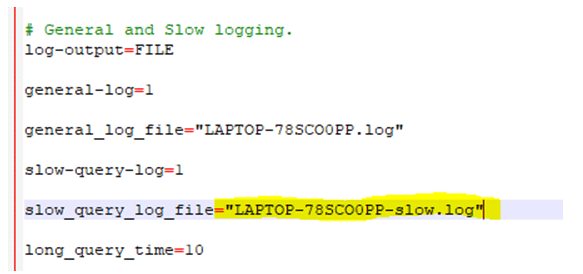
We can see the details of the general log file in the “config” file (my.ini) from the path “C:ProgramDataMySQLMySQL Server 8.0”.
# Slow logging.

slow-query-log=1

slow_query_log_file="LAPTOP-78SCO0PP-slow.log"

long_query_time=10
7. Error Log File
Once we open the “error” log file we get the below data information: –
- InnoDB initialization has started.
- InnoDB initialization has ended.
- X Plugin ready for connections. Bind-address: ‘::’ port: 33060
- CA certificate ca.pem is self signed.
| Timestamp | Thread | Type | Details |
| 2020-05-31T09:34:06 | 0 | [Warning] [MY-000081] [Server] | option ‘read_buffer_size’: unsigned value 5120 adjusted to 8192. |
| 2020-05-31T09:34:06 | 0 | [Warning] [MY-010915] [Server] | ‘NO_ZERO_DATE’, ‘NO_ZERO_IN_DATE’, and ‘ERROR_FOR_DIVISION_BY_ZERO’ sql modes should be used with strict mode. They will be merged with strict mode in a future release. |
| 2020-05-31T09:34:06 | 0 | [System] [MY-010116] [Server] | C:Program FilesMySQLMySQL Server 8.0binmysqld.exe (mysqld 8.0.20) starting as process 16316 |
| 2020-05-31T09:34:06 | 1 | [System] [MY-013576] [InnoDB] | InnoDB initialization has started. |
| 2020-05-31T09:34:13 | 1 | [System] [MY-013577] [InnoDB] | InnoDB initialization has ended. |
| 2020-05-31T09:34:14 | 0 | [System] [MY-011323] [Server] | X Plugin ready for connections. Bind-address: ‘::’ port: 33060 |
| 2020-05-31T09:34:17 | 0 | [Warning] [MY-010068] [Server] | CA certificate ca.pem is self signed. |
| 2020-05-31T09:34:17 | 0 | [System] [MY-010931] [Server] | C:Program FilesMySQLMySQL Server 8.0binmysqld.exe: ready for connections. Version: ‘8.0.20’ socket: ” port: 3306 MySQL Community Server – GPL. |
| 2020-06-13T10:22:35 | 0 | [System] [MY-013105] [Server] | C:Program FilesMySQLMySQL Server 8.0binmysqld.exe: Normal shutdown. |
| 2020-06-13T10:23:20 | 0 | [System] [MY-010910] [Server] | C:Program FilesMySQLMySQL Server 8.0binmysqld.exe: Shutdown complete (mysqld 8.0.20) MySQL Community Server – GPL. |
| 2020-06-13T10:26:03 | 0 | [Warning] [MY-000081] [Server] | option ‘read_buffer_size’: unsigned value 5120 adjusted to 8192. |
| 2020-06-13T10:26:03 | 0 | [Warning] [MY-010915] [Server] | ‘NO_ZERO_DATE’, ‘NO_ZERO_IN_DATE’ and ‘ERROR_FOR_DIVISION_BY_ZERO’ sql modes should be used with strict mode. They will be merged with strict mode in a future release. |
| 2020-06-13T10:26:04 | 0 | [System] [MY-010116] [Server] | C:Program FilesMySQLMySQL Server 8.0binmysqld.exe (mysqld 8.0.20) starting as process 6292 |
| 2020-06-13T10:26:08 | 1 | [System] [MY-013576] [InnoDB] | InnoDB initialization has started. |
| 2020-06-13T10:26:18 | 1 | [System] [MY-013577] [InnoDB] | InnoDB initialization has ended. |
| 2020-06-13T10:26:25 | 0 | [System] [MY-011323] [Server] | X Plugin ready for connections. Bind-address: ‘::’ port: 33060 |
| 2020-06-13T10:26:29 | 0 | [Warning] [MY-010068] [Server] | CA certificate ca.pem is self signed. |
| 2020-06-13T10:26:30 | 0 | [System] [MY-010931] [Server] | C:Program FilesMySQLMySQL Server 8.0binmysqld.exe: ready for connections. Version: ‘8.0.20’ socket: ” port: 3306 MySQL Community Server – GPL. |
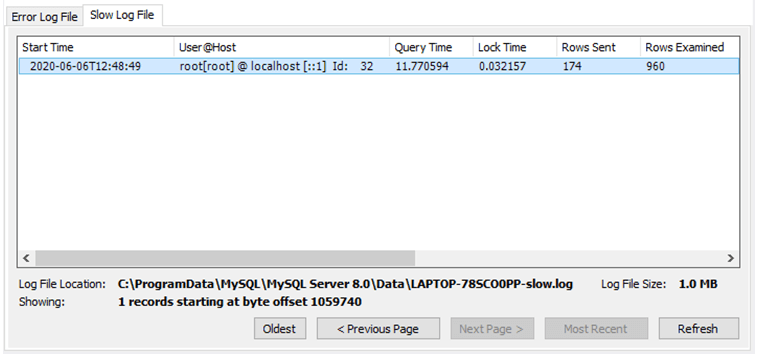
8. Slow Query Log File
We can see the details of the general log file in the “config” file (my.ini) from the path “C:ProgramDataMySQLMySQL Server 8.0”.
Now let us see the slow query log file. Below are the details that we get from our database.
| Start Time | User@Host | Query Time | Lock Time | Rows Sent | Rows Examined | Detail |
| 2020-06-06T12:48:49 | root[root] @ localhost [::1] Id: 32 | 11.770594 | 0.032157 | 174 | 960 | use sourcedb; SET timestamp=1591447717; SELECT * FROM information_schema.`TABLES` T, information_schema.`COLLATION_CHARACTER_SET_APPLICABILITY` CCSA WHERE CCSA.collation_name = T.table_collation LIMIT 0, 1000; |
Recommended Articles
This is a guide to MySQL Log File. Here we also discuss the introduction and how does mysql log file works along with examples and its code implementation. You may also have a look at the following articles to learn more –
- MySQL BIN()
- MySQL INSTR()
- MySQL WHILE LOOP
- MySQL Root
Contents
- Configuring the Error Log Output Destination
- Writing the Error Log to a File
- Writing the Error Log to Stderr on Unix
- Writing the Error Log to Syslog on Unix
- Syslog with mysqld_safe
- Syslog with Systemd
- Writing the Error Log to Console on Windows
- Writing the Error Log to the Windows Event Viewer
- Configuring the Error Log Verbosity
- Verbosity Level 0
- Verbosity Level 1
- Verbosity Level 2
- Verbosity Level 3
- Verbosity Level 4
- Verbosity Level 9
- MySQL’s log_error_verbosity
- Format
- Rotating the Error Log on Unix and Linux
- Error Messages File
The error log contains a record of critical errors that occurred during the server’s operation, table corruption, start and stop information.
SQL errors can also be logged in a separate file using the SQL_ERROR_LOG plugin.
Configuring the Error Log Output Destination
MariaDB always writes its error log, but the destination is configurable.
Writing the Error Log to a File
To configure the error log to be written to a file, you can set the log_error system variable. You can configure a specific file name. However, if a specific file name is not configured, then the log will be written to the ${hostname}.err file in the datadir directory by default.
The log_error system variable can be set in a server option group in an option file prior to starting up the server. For example, to write the error log to the default ${hostname}.err file, you could configure the following:
[mariadb]
...
log_error
If you configure a specific file name as the log_error system variable, and if it is not an absolute path, then it will be relative to the datadir directory. For example, if you configured the following, then the error log would be written to mariadb.err in the datadir directory:
[mariadb]
...
log_error=mariadb.err
If it is a relative path, then the log_error is relative to the datadir directory.
However, the log_error system variable can also be an absolute path. For example:
[mariadb]
...
log_error=/var/log/mysql/mariadb.err
Another way to configure the error log file name is to set the log-basename option, which configures MariaDB to use a common prefix for all log files (e.g. general query log, slow query log, error log, binary logs, etc.). The error log file name will be built by adding a .err extension to this prefix. For example, if you configured the following, then the error log would still be written to mariadb.err in the datadir directory:
[mariadb]
...
log-basename=mariadb
log_error
The log-basename cannot be an absolute path. The log file name is relative to the datadir directory.
Writing the Error Log to Stderr on Unix
On Unix, if the log_error system variable is not set, then errors are written to stderr, which usually means that the log messages are output to the terminal that started mysqld.
If the log_error system variable was set in an option file or on the command-line, then it can still be unset by specifying --skip-log-error.
Writing the Error Log to Syslog on Unix
On Unix, the error log can also be redirected to the syslog. How this is done depends on how you start MariaDB.
Syslog with mysqld_safe
If you start MariaDB with mysqld_safe, then the error log can be redirected to the syslog. See mysqld_safe: Configuring MariaDB to Write the Error Log to Syslog for more information.
Syslog with Systemd
If you start MariaDB with systemd, then the error log can also be redirected to the syslog. See Systemd: Configuring MariaDB to Write the Error Log to Syslog for more information.
systemd also has its own logging system called the journal, and some errors may get logged there instead. See Systemd:Systemd Journal for more information.
Writing the Error Log to Console on Windows
On Windows, if the console option is specified, and if the log_error system variable is not used, then errors are written to the console. If both options are specified, then the last option takes precedence.
Writing the Error Log to the Windows Event Viewer
On Windows, error log messages are also written to the Windows Event Viewer. You can find MariaDB’s error log messages by browsing Windows Logs, and then selecting Application or Application Log, depending on the Windows version.
In MariaDB 10.3 and before, you can find MariaDB’s error log messages by searching for the Source MySQL.
In MariaDB 10.4 and later, you can find MariaDB’s error log messages by searching for the Source MariaDB.
Configuring the Error Log Verbosity
The default value of the log_warnings system variable is 2.
The log_warnings system variable can be used to configure the verbosity of the error log. It can be changed dynamically with SET GLOBAL. For example:
SET GLOBAL log_warnings=3;
It can also be set either on the command-line or in a server option group in an option file prior to starting up the server. For example:
[mariadb]
...
log_warnings=3
Some of the warnings included in each verbosity level are described below.
The log_warnings system variable only has an effect on some log messages. Some log messages are always written to the error log, regardless of the error log verbosity. For example, most warnings from the InnoDB storage engine are not affected by log_warnings. For a complete list of log messages affected by log_warnings, see the description of the log_warnings system variable.
Verbosity Level 0
If log_warnings is 0, then many optional warnings will not be logged. However, this does not prevent all warnings from being logged, because there are certain core warnings that will always be written to the error log. For example:
- If InnoDB strict mode is disabled, and if DDL is performed on a table that triggers a «Row size too large» error, then InnoDB will log a warning:
[Warning] InnoDB: Cannot add field col25 in table db1.tab because after
  adding it, the row size is 8477 which is greater than maximum allowed
  size (8126) for a record on index leaf page.
However, if InnoDB strict mode is enabled, then the same message will be logged as an error.
Verbosity Level 1
Default until MariaDB 10.2.3. If log_warnings is 1, then many types of warnings are logged. Some useful warnings are:
- Replication-related messages:
[Note] Error reading relay log event: slave SQL thread was killed
[Note] Slave SQL thread exiting, replication stopped in log
  'dbserver-2-bin.000033'   at position 181420;
  GTID position '0-263316466-368886'
[Note] Slave I/O thread exiting, read up to log
  'dbserver-2-bin.000034', position 642;
  GTID position 0-263316466-368887
- Messages related to DNS lookup failures:
[Warning] IP address '192.168.1.193'
  could not be resolved: Name or service not known
- Messages related to the event scheduler:
[Note] Event Scheduler: Loaded 0 events
- Messages related to unsafe statements for statement-based replication:
[Warning] Unsafe statement written to the binary log using statement format since
  BINLOG_FORMAT = STATEMENT. The statement is unsafe because
  it uses a LIMIT clause. This
  is unsafe because the set of rows included cannot be predicted.
Frequent warnings about unsafe statements for statement-based replication can cause the error log to grow very large. MariaDB will automatically detect frequent duplicate warnings about unsafe statements for statement-based replication. After 10 identical warnings are detected, MariaDB will prevent that same warning from being written to the error log again for the next 5 minutes.
Verbosity Level 2
Default from MariaDB 10.2.4. If log_warnings is 2, then a couple other different kinds of warnings are printed. For example:
- Messages related to access denied errors:
[Warning] Access denied for user 'root'@'localhost' (using password: YES)
- Messages related to connections that are aborted due to errors or timeouts:
[Warning] Aborted connection 35 to db: 'unconnected' user:
  'user1@host1' host: '192.168.1.40' (Got an error writing communication packets)
[Warning] Aborted connection 36 to db: 'unconnected' user:
  'user1@host2' host: '192.168.1.230' (Got an error writing communication packets)
[Warning] Aborted connection 38 to db: 'db1' user:
  'user2' host: '192.168.1.60' (Unknown error)
[Warning] Aborted connection 51 to db: 'db1' user:
  'user2' host: '192.168.1.50' (Got an error reading communication packets)
[Warning] Aborted connection 52 to db: 'db1' user:
  'user3' host: '192.168.1.53' (Got timeout reading communication packets)
- Messages related to table handler errors:
[Warning] Can't find record in 'tab1'.
[Warning] Can't write; duplicate key in table 'tab1'.
[Warning] Lock wait timeout exceeded; try restarting transaction.
[Warning] The number of locks exceeds the lock table size.
[Warning] Update locks cannot be acquired during a READ UNCOMMITTED transaction.
- Messages related to the files used to persist replication state:
- Either the default
master.infofile or the file that is configured by the master_info_file option. - Either the default
relay-log.infofile or the file that is configured by the relay_log_info_file system variable.
- Either the default
[Note] Reading Master_info: '/mariadb/data/master.info'
  Relay_info:'/mariadb/data/relay-log.info'
[Note] Initialized Master_info from '/mariadb/data/master.info'
[Note] Reading of all Master_info entries succeded
[Note] Deleted Master_info file '/mariadb/data/master.info'.
[Note] Deleted Master_info file '/mariadb/data/relay-log.info'.
- Messages about a master’s binary log dump thread:
[Note] Start binlog_dump to slave_server(263316466), pos(, 4)
Verbosity Level 3
If log_warnings is 3, then a couple other different kinds of warnings are printed. For example:
- Messages related to old-style language options:
[Warning] An old style --language value with language specific
  part detected: /usr/local/mysql/data/
[Warning] Use --lc-messages-dir without language specific part instead.
- Messages related to progress of InnoDB online DDL:
[Note] InnoDB: Online DDL : Start
[Note] InnoDB: Online DDL : Start reading clustered index of the table and
  create temporary files
[Note] InnoDB: Online DDL : End of reading clustered index of the table and
  create temporary files
[Note] InnoDB: Online DDL : Start merge-sorting index PRIMARY (1 / 3),
  estimated cost : 18.0263
[Note] InnoDB: Online DDL : merge-sorting has estimated 33 runs
[Note] InnoDB: Online DDL : merge-sorting current run 1 estimated 33 runs
[Note] InnoDB: Online DDL : merge-sorting current run 2 estimated 17 runs
[Note] InnoDB: Online DDL : merge-sorting current run 3 estimated 9 runs
[Note] InnoDB: Online DDL : merge-sorting current run 4 estimated 5 runs
[Note] InnoDB: Online DDL : merge-sorting current run 5 estimated 3 runs
[Note] InnoDB: Online DDL : merge-sorting current run 6 estimated 2 runs
[Note] InnoDB: Online DDL : End of  merge-sorting index PRIMARY (1 / 3)
[Note] InnoDB: Online DDL : Start building index PRIMARY (1 / 3),
  estimated cost : 27.0395
[Note] InnoDB: Online DDL : End of building index PRIMARY (1 / 3)
[Note] InnoDB: Online DDL : Completed
[Note] InnoDB: Online DDL : Start merge-sorting index ux1 (2 / 3),
  estimated cost : 5.7895
[Note] InnoDB: Online DDL : merge-sorting has estimated 2 runs
[Note] InnoDB: Online DDL : merge-sorting current run 1 estimated 2 runs
[Note] InnoDB: Online DDL : End of  merge-sorting index ux1 (2 / 3)
[Note] InnoDB: Online DDL : Start building index ux1 (2 / 3),
  estimated cost : 8.6842
[Note] InnoDB: Online DDL : End of building index ux1 (2 / 3)
[Note] InnoDB: Online DDL : Completed
[Note] InnoDB: Online DDL : Start merge-sorting index ix1 (3 / 3),
  estimated cost : 6.1842
[Note] InnoDB: Online DDL : merge-sorting has estimated 3 runs
[Note] InnoDB: Online DDL : merge-sorting current run 1 estimated 3 runs
[Note] InnoDB: Online DDL : merge-sorting current run 2 estimated 2 runs
[Note] InnoDB: Online DDL : End of  merge-sorting index ix1 (3 / 3)
[Note] InnoDB: Online DDL : Start building index ix1 (3 / 3),
  estimated cost : 9.2763
[Note] InnoDB: Online DDL : End of building index ix1 (3 / 3)
[Note] InnoDB: Online DDL : Completed
Verbosity Level 4
If log_warnings is 4, then a couple other different kinds of warnings are printed. For example:
- Messages related to killed connections:
[Warning] Aborted connection 53 to db: 'db1' user:
  'user2' host: '192.168.1.50' (KILLED)
- Messages related to all closed connections:
[Warning] Aborted connection 56 to db: 'db1' user:
  'user2' host: '192.168.1.50' (CLOSE_CONNECTION)
- Messages related to released connections, such as when a transaction is committed and completion_type is set to
RELEASE:
[Warning] Aborted connection 58 to db: 'db1' user:
  'user2' host: '192.168.1.50' (RELEASE)
Verbosity Level 9
If log_warnings is 9, then some very verbose warnings are printed. For example:
- Messages about initializing plugins:
[Note] Initializing built-in plugins
[Note] Initializing plugins specified on the command line
[Note] Initializing installed plugins
MySQL’s log_error_verbosity
MariaDB does not support the log_error_verbosity system variable added in MySQL 5.7.
Format
The format consists of the date (yyyy-mm-dd) and time, the thread ID, followed by the type of error (Note, Warning or Error) and the error message, for example:
2016-06-15 16:53:33 139651251140544 [Note] InnoDB:
  The InnoDB memory heap is disabled
Until MariaDB 10.1.4, the format only consisted of the date (yymmdd) and time, followed by the type of error (Note, Warning or Error) and the error message, for example:
160615 16:53:08 [Note] InnoDB: The InnoDB memory heap is disabled
Rotating the Error Log on Unix and Linux
Unix and Linux distributions offer the logrotate utility, which makes it very easy to rotate log files. See Rotating Logs on Unix and Linux for more information on how to use this utility to rotate the error log.
Error Messages File
Many error messages are ready from an error messages file that contains localized error messages. If the server can’t find this file when it starts up, then you might see errors like the following:
[ERROR] Can't find messagefile '/usr/share/errmsg.sys'
If this error is occurring because the file is in a custom location, then you can configure this location by setting the lc_messages_dir system variable either on the command-line or in a server option group in an option file prior to starting up the server. For example:
[mariadb]
...
lc_messages_dir=/usr/share/mysql/
If you want to use a different locale for error messages, then you can also set the lc_messages system variable. For example:
[mariadb]
...
lc_messages_dir=/usr/share/mysql/
lc_messages=en_US
See Setting the Language for Error Messages for more information.
Журналы событий — первый и самый простой инструмент для определения статуса системы и выявления ошибок. Основных логов в MySQL четыре:
- Error Log — стандартный лог ошибок, которые собираются во время работы сервера (в том числе start и stop);
- Binary Log — лог всех команд изменения БД, нужен для репликации и бэкапов;
- General Query Log — основной лог запросов;
- Slow Query Log — лог медленных запросов.
Лог ошибок
Этот журнал содержит все ошибки, которые произошли во время работы сервера, включая критические ошибки, а также остановки, включения сервера и предупреждения (warnings). С него нужно начать в случае сбоя системы. По умолчанию все ошибки выводятся в консоль (stderr), также можно записывать ошибки в syslog (по умолчанию в Debian) или отдельный лог-файл:
|
log_error=/var/log/mysql/mysql_error.log |
Рекомендуем держать этот журнал включенным для быстрого определения ошибок. А для понимания, что значит та или иная ошибка, в MySQL присутствует утилита perror:
|
shell> perror 13 64 OS error code 13: Permission denied OS error code 64: Machine is not on the network |
Бинарный (он же двоичный) лог
В бинарный лог записываются все команды изменения базы данных, пригодится для репликации и восстановления.
Включается так:
|
log_bin = /var/log/mysql/mysql-bin.log expire_logs_days = 5 max_binlog_size = 500M |
Учтите, что если вы не собираетесь масштабировать систему и реализовывать отказоустойчивость, то бинарный лог лучше не включать. Он требователен к ресурсам и снижает производительность системы.
Лог запросов
В этом журнале содержатся все полученные SQL-запросы, информация о подключениях клиентов. Может пригодиться для анализа индексов и оптимизации, а также выявления ошибочных запросов:
|
general_log_file = /var/log/mysql/mysql.log <b>general_log = 1</b> |
Также его можно включить/отключить во время работы сервера MySQL:
|
SET GLOBAL general_log = ‘ON‘; SET GLOBAL general_log = ‘OFF‘; |
Лог медленных запросов
Журнал пригодится для определения медленных, то есть неэффективных запросов. Подробнее читайте в этой статье.
Просмотр логов
Для просмотра логов на Debian (Ubuntu) нужно выполнить:
|
# Лог ошибок tail -f /var/log/syslog <span class=«comment»> #Лог запросов </span>tail -f /var/log/mysql/mysql.log <span class=«comment»> # Лог медленных запросов </span>tail -f /var/log/mysql/mysql-slow.log |
Ротация логов
Не забывайте сжимать (архивировать, ротировать) файлы логов, чтобы они занимали меньше места на сервере. Для этого используйте утилиту logrotate, отредактировав файл конфигурации /etc/logrotate.d/mysql-server:
|
1 2 3 4 5 6 7 8 9 10 11 12 13 14 15 16 17 18 19 20 21 22 23 24 25 26 27 28 29 |
# — I put everything in one block and added sharedscripts, so that mysql gets <span class=«comment»> # flush-logs’d only once. </span># Else the binary logs would automatically increase by n times every day. <span class=«comment»> # — The error log is obsolete, messages go to syslog now. </span><b>/var/log/mysql.log /var/log/mysql/mysql.log /var/log/mysql/mysql-slow.log</b> { daily rotate 7 missingok create 640 mysql adm compress sharedscripts postrotate test -x /usr/bin/mysqladmin || exit 0 <span class=«comment»> # If this fails, check debian.conf! </span> MYADMIN=«/usr/bin/mysqladmin —defaults-file=/etc/mysql/debian.cnf» if [ -z «`$MYADMIN ping 2>/dev/null`» ]; then <span class=«comment»> # Really no mysqld or rather a missing debian-sys-maint user? </span> <span class=«comment»> # If this occurs and is not an error please report a bug. </span> <span class=«comment»> #if ps cax | grep -q mysqld; then </span> if killall -q -s0 -umysql mysqld; then exit 1 fi else $MYADMIN flush-logs fi endscript } |
DDL Log
MySQL также ведет лог языка описания данных. В него собираются данные операций типа DROP_TABLE and ALTER_TABLE. Лог используется для восстановления после сбоев, которые произошли во время выполнения таких операций. DDL Log — бинарный файл, не предназначенный для чтения пользователем, поэтому не модифицируйте и не удаляйте его.
Самое главное
Всегда включайте лог ошибок, используйте лог запросов для проверки соединения приложения с базой данных, проверки запросов и работы memcached. Лог медленных запросов пригодится для оптимизации работы MySQL.