MySQL is the de facto choice for open-source relational databases, and you should learn how to use MySQL database logs to improve efficiency and security. As an open-source product, it is free to use and has a large and active developer community. It is crucial to understand how to diagnose and monitor the performance of a MySQL instance in the long run.
Logs to the rescue!
Why is logging important?
A highly available and performant database is essential for an application’s performance. While using a MySQL instance in production, you will come across issues like slow queries, deadlocks, and aborted connections. Logging is essential to diagnosing these issues. A good understanding of your MySQL database logs will help you improve operations by reducing the mean time to recovery and the mean time between failures.
Logs are also key to detecting and diagnosing security issues within your MySQL instance. In the event of a compromise, logs track the details of an attack and the actions taken by the attackers. This information provides context to your data and helps you take remedial action.
Is monitoring logs a complex affair?
Logging is often ignored because analyzing logs is considered a complex activity. However, monitoring logs from a MySQL instance isn’t a complex task, provided you know which variables to watch and where to find them.
If your MySQL instance is generating a large amount of log data each day, it might not be feasible to review all of them manually. You can automate the review process by using log monitoring software that can pinpoint problematic events. Some monitoring software can even be configured to send out email alerts when something suspicious is detected.
In this post, we’ll discuss five important logs and the specific ways in which they can help you monitor your MySQL instance.
- General Query Log
- Slow Query Log
- Error Log
- Binary Log
- Relay Log
Enable Logging on MySQL
Before moving ahead, it’s important to note that logging is disabled by default on MySQL except for the error log. Let’s take a quick look at how to enable the general and slow query logs.
To start using MySQL commands, open your command prompt, and log in to your MySQL instance with the following command.
mysql -u root -p
First, check the current state of the system variables by using the command
mysql> show variables;
If variables like general_log and slow_query_log are OFF, we need to switch them on.
![]()
![]()
You can enable the general query log with the following command. The default name of the log file is host_name.log but you can change the name and path as required.
mysql>SET GLOBAL general_log = ‘ON’;
mysql>SET GLOBAL general_log_file = ‘path_on_your_system’;
The slow query log can be enabled with the commands below.
mysql>SET GLOBAL slow_query_log = ‘ON’;
mysql>SET GLOBAL slow_query_log_file = ‘path_on_your_system’;
You can also control the destination of logs by setting the value of the log_output variable to FILE TABLE or FILE,TABLE . FILE selects logging to log files while TABLE selects logging to the MySQL system schema.
Now, let’s see which 5 logs you’ll want to keep an eye out for in your MySQL instance!
1. General Query Log
As the name implies, the general query log is a general record of what MySQL is doing. Information is written to this log when clients connect or disconnect to the server. The server also logs each SQL statement it receives from clients. If you suspect an error in a client, you can know exactly what the client sent to the MySQL instance by looking at the general query log.
You should be aware that MySQL writes statements to the general query log in the order in which it receives them. The order might differ from the order in which the queries are executed because, unlike other log formats, the query is written to this log file before MySQL even attempts to execute the query. MySQL database logs are therefore perfect for debugging MySQL crashes.
Since the general query log is a record of every query received by the server, it can grow large quite quickly. If you only want a record of queries that change data, it might be better to use the binary log instead (more on that later).
Impact on performance
In terms of performance, enabling the general query log does not have a noticeable impact on performance in most cases. However, it has been observed that writing logs to a file is faster than writing them to a table. If you want a detailed analysis of the performance impact of the general query, you can go through this article which goes into greater depth on this.
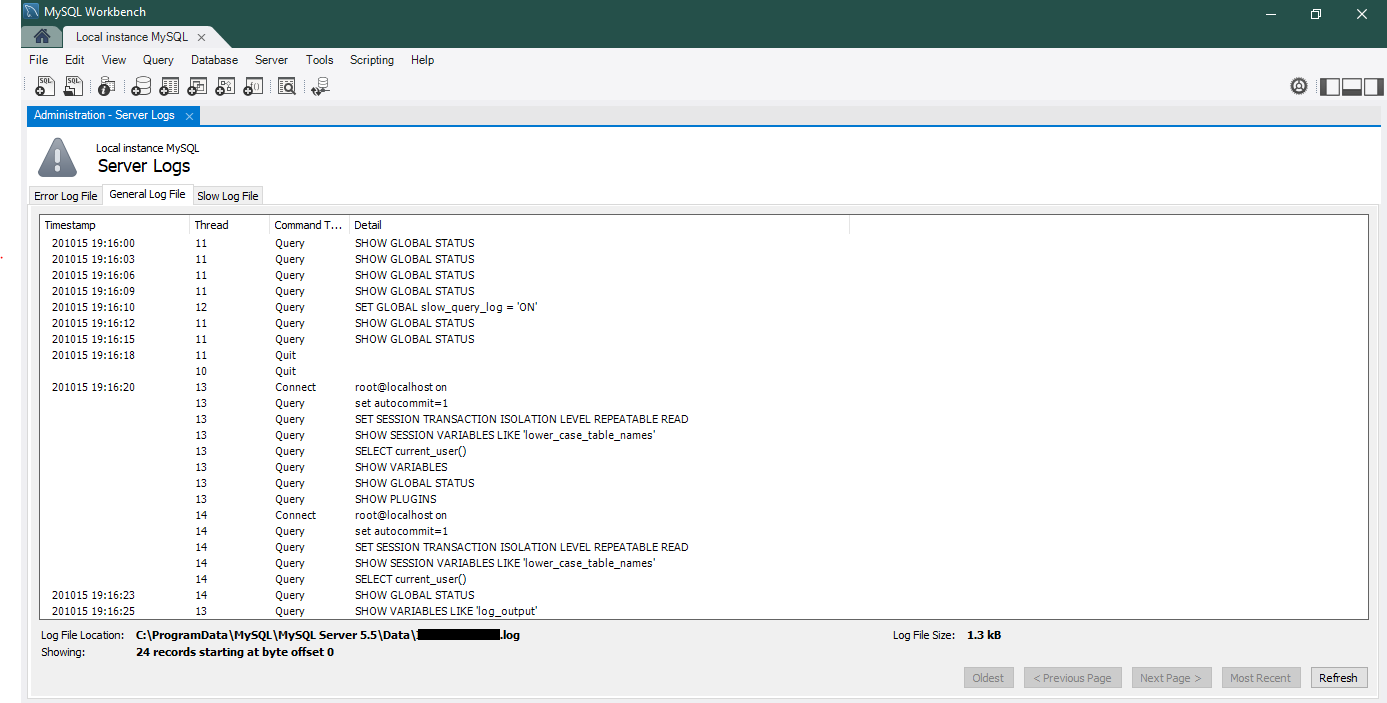
Viewing MySQL Database Logs on the workbench
To view logs on the MySQL workbench, go to the ‘Server’ navigation menu and then choose ‘Server Logs’. The following picture shows an example of entries in a general log file.
2. Slow Query Log
As applications scale in size, queries that were once extremely fast can become quite slow. When you’re debugging a MySQL instance for performance issues, the slow query log is a good starting place to see which queries are the slowest and how often they are slow.
The slow query log is the MySQL database log queries that exceed a given threshold of execution time. By default, all queries taking longer than 10 seconds are logged.
Configuration options
You can change the threshold query execution time by setting the value of the long_query_time system variable. It uses a unit of seconds, with an optional milliseconds component.
SET GLOBAL long_query_time = 5.0;
To verify if the slow query log is working properly, you can execute the following query with a time greater than the value of the long_query_time .
SELECT SLEEP(7);
Queries not using indexes are often good candidates for optimization. The log_queries_not_using_indexes system variable can be switched on to make MySQL log all queries that do not use an index to limit the number of rows scanned. In this case, logging occurs regardless of execution time of the query.
Parsing slow query logs
For large applications, the slow query log can become difficult to investigate. Fortunately, MySQL has a tool called mysqldumpslow which parses the slow query log files and prints a summary result with similar queries grouped. Normally, mysqldumpslow groups queries that are similar except for the particular values of number and string data values.
Finally, you should understand that not every query logged on the slow query log needs to be optimized. A query that takes long to run but is only run once a month is probably not a source of concern. On the other hand, a query that has a smaller execution time but runs thousands of times an hour may be a good candidate for optimization.
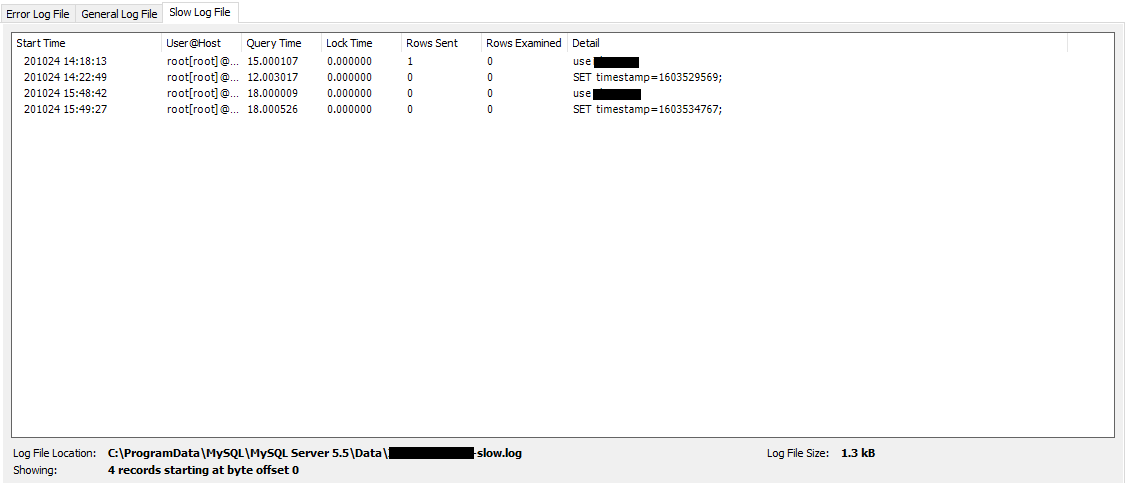
The following picture shows an example of entries in a slow query log file.
3. Error Log
MySQL uses the error log to record diagnostic messages, warnings, and notes that occur during server startup and shutdown, and while the server is running. The error log also records MySQL startup and shutdown times.
Error logging is always enabled. On Linux, if the destination is not specified, the server writes the error log to the console and sets the log_error system variable to stderr. On Windows, by default, the server writes the error log to the host_name.err file in the data directory. You can customize the path and file name of the error log by setting the value of the log_error system variable.
Commonly logged errors
Some common errors that MySQL logs to the error log are as follows:
- Permission errors
- Configuration errors
- Out of memory errors
- Errors with initiation or shutdown of plugins and InnoDB
Filtering the error log
MySQL database logs have the option to filter error logs, should you want to focus on critical errors. You can set the verbosity of the error log by changing the value of the log_error_verbosity system variable. Permitted values are 1 (errors only), 2 (errors and warnings), 3 (errors, warnings, and notes), with a default of 3.
MySQL 8.0 also provides error filtering based on user-defined rules using the log_filter_dragnet system variable. You can read more about how to enable this filtering on the official MySQL documentation.
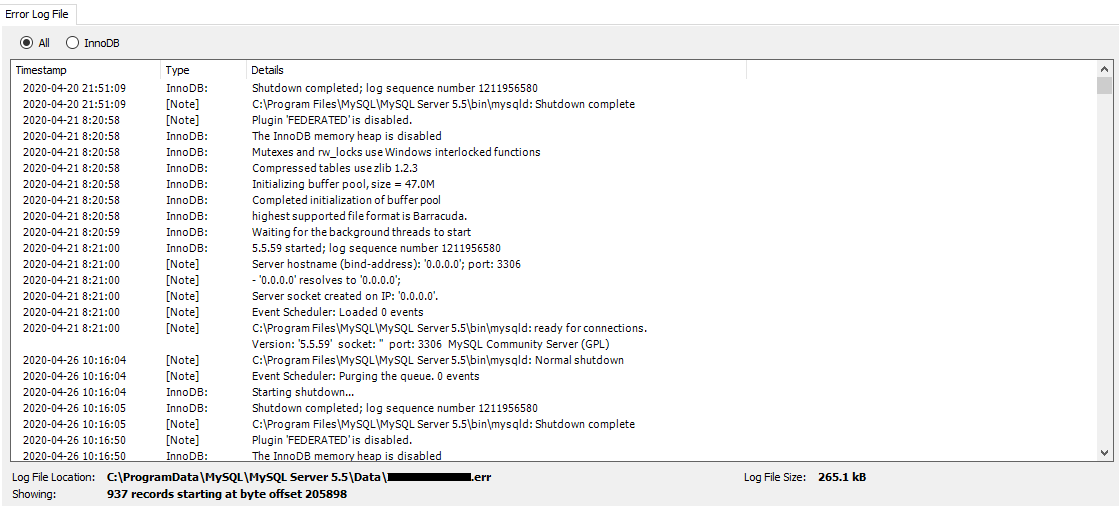
The picture below shows a snippet of the error log.
4. Binary Log
The binary log is used by MySQL to record events that change the data within the tables or change the table schema itself. For example, binary logs record INSERT, DELETE and UPDATE statements but not SELECT or SHOW statements that do not modify data. Binary logs also contain information about how long each statement took to execute.
The logging order of a binary login is in contrast with that of the general query log. Events are logged only after the transaction is committed by the server.
MySQL writes binary log files in binary format. To read their contents in text format, you need to use the mysqlbinlog utility. For example, you can use the code below to convert the contents of the binary log file named binlog.000001 to text.
mysql> mysqlbinlog binlog.0000001
Purpose of the binary log
The primary purpose of the binary log is to keep a track of changes to the server’s global state during its operation. Thus binary log events can be used to reproduce the changes which have happened on a server earlier. The binary log has two important applications.
- Replication: The binary log is used on the main server to record all of the events that modify database structure or content. Each replica that connects to the main server requests a copy of the binary log. The replica then executes the events from the binary log in order to reproduce the changes just as they were made on the main server.
- Data Recovery: Data recovery operations also make use of binary logs. When a database is restored from a backup file, the events in the binary log that were recorded after the backup was made are re-executed. This makes the restored database up to date with the original.
Binary logging formats
MySQL database logs offer three formats for binary logging.
- Statement-based logging: In this format, MySQL records the SQL statements that produce data changes. Statement-based logging is useful when many rows are affected by an event because it is more efficient to log a few statements than many rows.
- Row-based logging: In this format, changes to individual rows are recorded instead of the SQL statements. This is useful for queries that require a lot of execution time on the source but result in just a few rows being modified.
- Mixed logging: This is the recommended logging format. It uses statement-based logging by default but switches to row-based logging when required.
The binary logging format can be changed using the code below. However, you should note that it is not recommended to do so at runtime or while replication is ongoing.
SET GLOBAL binlog_format = 'STATEMENT';
SET GLOBAL binlog_format = 'ROW';
SET GLOBAL binlog_format = 'MIXED';
Enabling binary logging on your MySQL instance will lower the performance slightly. However, the advantages discussed above generally outweigh this minor dip in performance.
5. Relay Log
Relay logs are a set of numbered log files created by a replica during replication from the main server. Relay logs also consist of an index file that contains the names of all used relay log files.
During replication, the replica reads events from the main server’s binary log and writes it onto its relay logs. It then performs all the events in order to be in sync with the main server. After all events in the file have been executed, the replication SQL thread automatically deletes relay log files that are no longer needed.
The format of the relay log is the same as that of the binary log, so the mysqlbinlog utility can be used to display its contents.
Configuration options
By default, relay log names are of the form host_name-relay-bin.nnnnnn where host-name is the name of the replica server and #nnnnnn is the sequence number. The default filename for the relay log index file is host_name-relay-bin.index. Both relay log files and the relay log index file are stored in the data directory.
The filename and path of relay logs and the relay log index file can be changed by setting the relay_log and relay_log_index system variables respectively. This is useful if you anticipate that the replica’s hostname might change from time to time.
Managing Log Files
Over time, MySQL database logs become large and cumbersome. It is necessary to manage log files for two important reasons.
First, you need to restrict the volume of log data to prevent old logs from taking up too much of your disk space. Second, breaking up your log files into smaller organized files makes troubleshooting and analyzing them much simpler.
Log rotation is a simple way to achieve this.
Log Rotation
Log rotation is the process in which the current log file is renamed, usually by appending a “1” to the name, and a new log file is set up to record new log entries. Each time a new log file is started, the numbers in the file names of old log files are increased by one. Based on the threshold of files to be retained, old log files are then compressed, deleted, or archived separately to save space.
Depending on your requirements, you can decide on the maximum size of a log file, the frequency of rotations, and how many old log files you want to retain.
On Linux, the logrotate utility can be used to automate rotation compression, removal, and mailing of log files. Logrotate can be run as a scheduled job daily or weekly or when the log file gets to a certain size. On other systems, you can run a similar script using a scheduler.
Conclusion
Logging is an indispensable tool for managing your MySQL instances. Gaining a deeper understanding of the five logs mentioned above will help you preempt, diagnose, and monitor issues as your application scales.
Although it may seem daunting at first, you will get better at troubleshooting and debugging logs over time. Start using them today!
В MySQL на данный момент существуют 4 вида журнала (лога) и при достаточно серьёзной работе с базами на MySQL необходимо за ними следить. Например, бинарный лог у нас за сутки набирает около гигабайта, а размер жёсткого диска на сервере ограничен и за ними надо следить. Однако следить следует не только за бинарным логом, так как логи (журналы) в MySQL могут принести немалую пользу.
Итак, какие логи ведёт MySQL? Это:
1. бинарный лог (binary log)
2. лог ошибок (error log)
3. лог медленный запросов (slow query log)
4. лог запросов (general query log)
5. лог репликаций (relay log)
Каждый из них по-своему полезен.
Бинарный лог
В первую очередь полезен с точки зрения репликаций. Можно его бэкапить, можно использовать для восстановления данных на более точное время при использовании бэкапов. Лог содержит все команды изменений базы данных, выборки (select, show) не сохраняет, для таблиц, поддерживающих транзакции (BDB, InnoDB) запись в лог выполняется только после выполнения команды COMMIT. Для лога можно указывать список баз данных, которые надо логировать и список баз данных, которые не надо логировать. В более ранних версиях вместо бинарного лога использовался лог обновлений. Использование бинарного лога снижает производительность базы данных, однако его польза настолько велика, что крайне не рекомендуется его отключать. Рекомендуется защищать бинарный лог паролем, так как он может данные также о паролях пользователей. При достижении максимально разрешённого размера (1 гиг по умолчанию) создаётся следующий файл. Каждый новый файл имеет порядковый номер после имени.
Содержание бинарного лога можно посмотреть с помощью утилиты mysqlbinlog.
Основные настройки в my.cnf
Местоположение лога:
log_bin = /var/log/mysql/mysql-bin.log
Максимальный размер, минимум 4096 байт, по умолчанию 1073741824 байт (1 гигабайт):
max_binlog_size= 500M
Сколько дней хранится:
expire_logs_days = 3
Наиболее часто использующиеся команды
Повторение действий после операции восстановления:
shell> mysqlbinlog log_file | mysql -h server_name
Удаление логов до определённого файла:
PURGE BINARY LOGS TO 'mysql-bin.000';
Удаление логов до определённой даты:
PURGE BINARY LOGS BEFORE 'YYYY-MM-DD hh:mm:ss';
Лог ошибок
Особенно полезен в случаях сбоев. Лог содержит информацию об остановках, запусках сервера, а также сообщения о критических ошибках. Может содержать сообщения с предупреждениями (warnings).
Основные настройки в my.cnf
Местоположение лога:
log_error = /var/log/mysql/mysql.err
Флаг, указывающий стоит ли записывать в лог в том числе предупреждения (записываются, если значение больше нуля):
log_warnings = 1
Наиболее часто использующиеся команды
Переход к новому файл лога:
shell> mysqladmin flush-logs
Копирование старой части лога (необходимо, так как в случае повторного выполнения fluch он будет удалён):
shell> mv host_name.err-old backup-directory
Лог медленных запросов
Если есть подозрение, что приложение работает медленно из-за неэффективных запросов к базе, то в первую очередь следует проверить лог медленных запросов. В случае оптимизации запросов этот лог поможет выяснить, что необходимо оптимизировать в первую очередь.
Основные настройки в my.cnf
Местоположение лога:
log_slow_queries = /var/log/mysql/mysql_slow.log
Со скольки секунд выполнения запрос считается медленным, минимальное значений — 1 секунда, по умолчанию 10 секунд:
long_query_time = 10
Если надо логировать запросы, которые не используют индексы, надо добавить строку:
log-queries-not-using-indexes
Если надо вести лог медленных команд, таких как OPTIMIZE TABLE, ANALYZE TABLE и ALTER TABLE:
log-slow-admin-statements
Лог запросов
Лог содержит информацию о подключениях и отключениях клиентов, а также все SQL запросы, которые были получены. Фактически, это временный лог. Обычно лог удаляется автоматически сразу после выполнения всех команд (т.е. как только он стал ненужным). Лог ведётся в соответствии с очередность поступления запросов. Этот лог содержит все запросы к базе данных (независимо от приложений и пользователей). Так что если есть желание (или необходимость) проанализировать, какие необходимы индексы, какие запросы могли бы оптимизированы, то этот лог как раз может помочь в таких целях. Лог полезен не только для случаев, когда необходимо знать, какие запросы выполняются с базой данных, но и в случаях, когда ясно, что возникла ошибка с базой данных, но неизвестно, какой запрос был отправлен к базе данных (например, в случае генерации динамического SQL-а). Рекомендуется защищать лог запросов паролем, так как он может данные также о паролях пользователей.
Основные настройки в my.cnf
Местоположение лога:
log = /var/log/mysql/mysql.log
Наиболее часто использующиеся команды
В отличии от других логов, перезагрузка сервера и команда fluch не инициирует создание нового лога. Но это можно сделать вручную:
shell> mv host_name.log host_name-old.log

shell> mysqladmin flush-logs

shell> mv host_name-old.log backup-directory
Лог репликаций
Здесь логируются изменения, выполненные по инициации сервера репликаций. Как и бинарный лог, состоит из файлов, каждый из которых пронумерован.
Основные настройки в my.cnf
Местоположение лога:
relay-log = /var/log/mysql/mysql-relay-bin.log
Максимальный размер:
max_relay_log_size = 500М
Наиболее часто использующиеся команды
Начать новый файл лога можно только при остановленном дополнительном (slave) сервере:
shell> cat new_relay_log_name.index >> old_relay_log_name.index

shell> mv old_relay_log_name.index new_relay_log_name.index
Команда fluch logs инициирует ротацию лога.
This tutorial shows you how to configure and view different MySQL logs. MySQL is
an open-source relational database based on SQL (Structured Query Language).
MySQL offers various built-in logs. In general, a database is the cornerstone of
almost every backend, and because of that administrators want to log this
service.
MySQL has multiple logs with different purpose. We will focus on following four
logs:
- Error log: Records problems encountered starting, running, or stopping
mysqld. This log is stored by default in the/var/logdirectory. It could
be useful if you want to analyze the server itself. - General query logs: Records every connection established with each client.
This log records everything that client sent to the server. This log is useful
to determine client problems. - Binary logs: Record each event that manipulates data in the database.
These log records operations such as a table creating, modification of schema,
inserting new values, or querying tables. These logs are used to backup and
recover the database. - Slow query log: Record of each query, which execution took too much time.
This log could be useful for the optimisation of slow SQL queries.
In this tutorial, you will do the following actions:
- You will install the MySQL server and view default error log.
- You will connect to MySQL server, view metadata about general query logs
and view these logs. - You will understand the concept of the MySQL binary logs and where to find
them. - You will enable and configure a slow query log, simulate some slow query
and check this incident in the new log.
🔭 Want to centralize and monitor your MySQL logs?
Head over to Logtail and start ingesting your logs in 5 minutes.
Prerequisites
You will need:
- Ubuntu 20.04 distribution including the non-root user with
sudoaccess. - Basic knowledge of SQL languages (understanding of simple select query
statement).
Step 1 — Viewing Error Log
The MySQL server is maintained by the command-line program mysqld. This
program manages access to the MySQL data directory that contains databases and
tables. The problems encountered during mysqld starting, running, or stopping
are stored as a custom log in the directory /var/log/mysql. This log doesn’t
include any information about SQL queries. It is useful for the analysis of the
MySQL server.
First of all, let’s install the MySQL server. Ubuntu 20.04 allows to install the
MySQL from default packages with the apt install (installation requires sudo
privilege):
$ sudo apt update
$ sudo apt install mysql-server
The first command will update Ubuntu repositories, and the second will download
and install required packages for the MySQL server.
Now, the server is installed. The new service already creates a default error
log. You can list the directory /var/log and find a new subdirectory mysql
with ls:
You’ll see the program’s output appear on the screen:
Output
alternatives.log       bootstrap.log           kern.log.4.gz
alternatives.log.1     btmp                    lastlog
alternatives.log.2.gz  btmp.1                  letsencrypt
alternatives.log.3.gz  cups                    my-custom-app
apache2                dist-upgrade            mysql
apport.log             dmesg                   openvpn
apport.log.1           dmesg.0                 private
apport.log.2.gz        dmesg.1.gz              speech-dispatcher
apport.log.3.gz        dmesg.2.gz              syslog
apport.log.4.gz        dmesg.3.gz              syslog.1
apport.log.5.gz        dmesg.4.gz              syslog.2.gz
apport.log.6.gz        dpkg.log                syslog.3.gz
apport.log.7.gz        dpkg.log.1              syslog.4.gz
apt                    dpkg.log.2.gz           syslog.5.gz
auth.log               dpkg.log.3.gz           syslog.6.gz
auth.log.1             faillog                 syslog.7.gz
auth.log.2.gz          fontconfig.log          teamviewer15
auth.log.3.gz          gdm3                    test.log
auth.log.4.gz          gpu-manager.log         ubuntu-advantage.log
boot.log               gpu-manager-switch.log  unattended-upgrades
boot.log.1             hp                      wtmp
boot.log.2             installer               wtmp.1
boot.log.3             journal                 Xorg.0.log
boot.log.4             kern.log                Xorg.0.log.old
boot.log.5             kern.log.1              Xorg.1.log
boot.log.6             kern.log.2.gz           Xorg.1.log.old
boot.log.7             kern.log.3.gz
The output shows also directory mysql. This directory contains by default
single log error.log. Let’s view the content of file error.log with cat:
cat /var/log/mysql/error.log
You’ll see the program’s output appear on the screen:
Output
2021-04-28T09:36:19.040254Z 0 [System] [MY-013169] [Server] /usr/sbin/mysqld (mysqld 8.0.23-0ubuntu0.20.04.1) initializing of server in progress as process 62373
2021-04-28T09:36:19.046865Z 1 [System] [MY-013576] [InnoDB] InnoDB initialization has started.
2021-04-28T09:36:20.482915Z 1 [System] [MY-013577] [InnoDB] InnoDB initialization has ended.
2021-04-28T09:36:23.709432Z 6 [Warning] [MY-010453] [Server] [email protected] is created with an empty password ! Please consider switching off the --initialize-insecure option.
2021-04-28T09:36:28.971810Z 6 [System] [MY-013172] [Server] Received SHUTDOWN from user boot. Shutting down mysqld (Version: 8.0.23-0ubuntu0.20.04.1).
2021-04-28T09:36:33.851492Z 0 [System] [MY-010116] [Server] /usr/sbin/mysqld (mysqld 8.0.23-0ubuntu0.20.04.1) starting as process 62437
2021-04-28T09:36:33.870257Z 1 [System] [MY-013576] [InnoDB] InnoDB initialization has started.
2021-04-28T09:36:34.114770Z 1 [System] [MY-013577] [InnoDB] InnoDB initialization has ended.
2021-04-28T09:36:34.222753Z 0 [ERROR] [MY-011292] [Server] Plugin mysqlx reported: 'Preparation of I/O interfaces failed, X Protocol won't be accessible'
2021-04-28T09:36:34.222924Z 0 [ERROR] [MY-011300] [Server] Plugin mysqlx reported: 'Setup of socket: '/var/run/mysqld/mysqlx.sock' failed, can't create lock file /var/run/mysqld/mysqlx.sock.lock'
2021-04-28T09:36:34.354295Z 0 [Warning] [MY-010068] [Server] CA certificate ca.pem is self signed.
2021-04-28T09:36:34.354479Z 0 [System] [MY-013602] [Server] Channel mysql_main configured to support TLS. Encrypted connections are now supported for this channel.
...
The output shows that the file stores plain text records about the mysqld
server initialisation, and running.
Step 2 — Viewing General Query Logs
The server writes records about each client event during connection to the
general query log. Basically, it keeps the information about all SQL statements
that happens. This log is useful when the administrators want to know what
clients exactly execute.
Connecting to Server and Checking General Query Log Status
First of all, let’s check the status of the general query log because this
logging feature can be turned off.
You can connect to MySQL server as a root client:
You will be redirected to MySQL command-line.
Now, you can view system variables related to the general query log by executing
command show variables:
mysql> show variables like '%general%';
The clause specifies a pattern that should match the variable. In our case, the
pattern '%general%' specifies to show variables that contain the string
general. You’ll see the program’s output appear on the screen:
Output
+------------------+-----------------------------+
| Variable_name    | Value                       |
+------------------+-----------------------------+
| general_log      | ON                          |
| general_log_file | /var/lib/mysql/alice.log    |
+------------------+-----------------------------+
2 rows in set (0.01 sec)
The output shows two variables:
general_log: the variable holds valueON(general log enable), orOFF
(general log disabled).general_log_file: the variable defines where is the log stored in the file
system.
As you can see, the general query log is by default enabled. We can disconnect
from the server by executing the exit command:
You will be redirected back to the terminal.
Viewing General Query Log
Now, you can view the content of this log with a cat (the sudo is required
because this file is maintained by the system):
$ sudo cat /var/lib/mysql/alice.log
You’ll see the program’s output appear on the screen:
Output
/usr/sbin/mysqld, Version: 8.0.23-0ubuntu0.20.04.1 ((Ubuntu)). started with:
Tcp port: 3306  Unix socket: /var/run/mysqld/mysqld.sock
Time                 Id Command    Argument
2021-04-28T10:47:28.713271Z    10 Connect   [email protected] on  using Socket
2021-04-28T10:47:28.713625Z    10 Query select @@version_comment limit 1
2021-04-28T10:53:50.778598Z    10 Query show variables like '%general%'
2021-04-28T13:35:41.944309Z    10 Quit
The output shows all statement executed on the server. You can see the time
stamp and the specific command that was executed. There is also the executed
command show variables like '%general%'.
Step 3 — Listing Binary Logs
The binary log contains events that manipulated the database. If you want to
recover the database, you need a backup and a binary log relevant to this
backup. There are multiple binary logs because they are versioned.
By default, the binary logs are enabled. You can check where are they stored.
Let’s connect to the MySQL server as a root client:
You will be redirected to MySQL prompt.
Now, you can check the binary logs status by executing show binary logs:
The command will list the binary log files on the server:
Output
+---------------+-----------+-----------+
| Log_name      | File_size | Encrypted |
+---------------+-----------+-----------+
| binlog.000001 |       179 | No        |
| binlog.000002 |       403 | No        |
| binlog.000003 |       770 | No        |
| binlog.000004 |       179 | No        |
| binlog.000005 |       403 | No        |
| binlog.000006 |       892 | No        |
+---------------+-----------+-----------+
6 rows in set (0.00 sec)
The output shows all binary logs. Now, we can find out where are this logs
stored.
We can show logs location by executing command show variables:
mysql> show variables like '%log_bin%';
We already use this show clause in the previous step. This time, the clause
shows variables that contain the string log_bin. You’ll see the program’s
output appear on the screen:
Output
+---------------------------------+-----------------------------+
| Variable_name                   | Value                       |
+---------------------------------+-----------------------------+
| log_bin                         | ON                          |
| log_bin_basename                | /var/lib/mysql/binlog       |
| log_bin_index                   | /var/lib/mysql/binlog.index |
| log_bin_trust_function_creators | OFF                         |
| log_bin_use_v1_row_events       | OFF                         |
| sql_log_bin                     | ON                          |
+---------------------------------+-----------------------------+
6 rows in set (0.00 sec)
The output shows that the binary logs are stored in directory /var/lib/mysql,
and they are labelled as binlog.index (for example binlog.000001).
We can disconnect from the server by executing the exit command:
You will be redirected back to the terminal.
Now, let’s list the directory /var/lib/mysql but only as a root because it is
owned and maintained by the system:
You’ll see the program’s output appear on the screen:
Output
auto.cnf         ca.pem                 ib_logfile0    private_key.pem
binlog.000001    client-cert.pem      ib_logfile1      public_key.pem
binlog.000002    client-key.pem       ibtmp1             server-cert.pem
binlog.000003    debian-5.7.flag      '#innodb_temp' server-key.pem
binlog.000004    EXAMPLE_DB           alice.log      sys
binlog.000005    '#ib_16384_0.dblwr'  alice.pid      undo_001
binlog.000006    '#ib_16384_1.dblwr'  mysql            undo_002
binlog.index     ib_buffer_pool       mysql.ibd
ca-key.pem     ibdata1              performance_schema
The output shows that the directory /var/lib/mysql contains the binary log
files.
Step 4 — Configuring Slow Query Log
MySQL allows to log queries, which took too much time. This mechanism is called
a slow query log.
Enabling Slow Query Logging
By default, the slow query log is disabled. You can enable it by editing MySQL
configuration file /etc/mysql/mysql.conf.d/mysqld.cnf (sudo required):
$ sudo nano /etc/mysql/mysql.conf.d/mysqld.cnf
The file contains following lines that holds configuration variables (by default
commented out):
...
# Here you can see queries with especially long duration
# slow_query_log          = 1
# slow_query_log_file     = /var/log/mysql/mysql-slow.log
# long_query_time = 10
...
These three lines holds following three configuration variables:
slow_query_log: the slow query logging is disable (value0) or enabled
(value1).slow_query_log_file: the slow query log is stored in the file
/var/log/mysql/mysql-slow.log. You can specify your own file.long_query_time: by default, the slow query logs record each SQL query that
takes more than 10 seconds. You can change this minimal time interval to
another value. The value can be specified as a floating-point number where the
value1.0refers to 1 second.
You can enable slow query log by uncommenting this three lines. Also, you can
set your own long_query_time value:
...
# Here you can see queries with especially long duration
slow_query_log          = 1
slow_query_log_file     = /var/log/mysql/mysql-slow.log
long_query_time = 5
...
In our example, we change the default long_query_time value to 5 seconds. Now,
you can save the file.
If you want immediately apply the new configuration rules then you must restart
the MySQL server with systemctl (sudo required):
$ sudo systemctl restart mysql.service
Now, the MySQL server enables slow query log.
Checking Slow Query Log Status
You can check that the log is enabled if you login into the MySQL server as a
root client:
You will be redirected to MySQL prompt.
Let’s check the slow query log status by executing command show variables:
mysql> show variables like '%slow_query_log%';
Once again, we use the show clause. This time, the clause shows variables that
contain the string slow_query_log. You’ll see the program’s output appear on
the screen:
Output
+---------------------+----------------------------------+
| Variable_name       | Value                            |
+---------------------+----------------------------------+
| slow_query_log      | ON                               |
| slow_query_log_file | /var/log/mysql/mysql-slow.log   |
+---------------------+----------------------------------+
2 rows in set (0.00 sec)
The output shows that the slow query log is enabled (the variable
slow_query_log holds the value ON). The log is stored in the file
/var/log/mysql/mysql-slow.log. You can see that it is the same file as the
file specified in the configuration script.
Let’s view actual slow query time interval by executing the command
show variables:
mysql> show variables like '%long_query_time%';
You’ll see the program’s output appear on the screen:
Output
+-----------------+-----------+
| Variable_name   | Value     |
+-----------------+-----------+
| long_query_time |  5.000000 |
+-----------------+-----------+
1 row in set (0.00 sec)
The output shows that the variable long_query_time holds the value 5 seconds
(as we define in the configuration script).
Viewing Slow Query Log
At last, we can check that the MySQL records slow queries to the new log. You
can execute the following select query that takes 6 seconds:
The select will wait 6 seconds and then return 0:
Output
+----------+
| sleep(6) |
+----------+
|        0 |
+----------+
1 row in set (6.01 sec)
The output shows that this query takes 6 seconds. As a result, it should be
recorded in a slow query log.
We can disconnect from the server by executing the exit command:
You will be redirected back to the terminal.
At last, we can print content of the slow query log
/var/log/mysql/mysql-slow.log (the sudo is required because the file is
maintained by system):
$ sudo cat /var/log/mysql/mysql-slow.log
You’ll see the program’s output appear on the screen:
/usr/sbin/mysqld, Version: 8.0.23-0ubuntu0.20.04.1 ((Ubuntu)). started with:
Tcp port: 3306  Unix socket: /var/run/mysqld/mysqld.sock
Time                 Id Command    Argument
# Time: 2021-04-29T06:28:55.445053Z
# [email protected]: root[root] @ localhost []  Id:    15
# Query_time: 6.000443  Lock_time: 0.000000 Rows_sent: 1  Rows_examined: 1
SET timestamp=1619677729;
select sleep(6);
You can see that the output shows record about execution query
select sleep(6).
Conclusion
In this tutorial, you configured and viewed different MySQL logs. You installed
the MySQL server and viewed the error log. You connected to the server,
viewed the general query logs and their configuration. You listed binary
logs. At last, you enabled, configured and viewed a slow query log.
Centralize all your logs into one place.
Analyze, correlate and filter logs with SQL.
Create actionable
dashboards.
Share and comment with built-in collaboration.
Got an article suggestion?
Let us know
![]()
![]()
![]()
Next article
How To Start Logging With PostgreSQL
Learn how to start logging with PostgreSQL and go from basics to best practices in no time.
→
![]()
This work is licensed under a Creative Commons Attribution-NonCommercial-ShareAlike 4.0 International License.