Первая задача, с которой чаще всего сталкиваются разработчики, начинающие программировать на JavaScript, – как регистрировать события в журнале консоли с помощью метода console.log. В поисках информации по отладке кода на JavaScript вы найдёте сотни статей в блогах, а также инструкций на StackOverflow, советующих «просто» вывести данные в консоль через метод console.log. Это настолько распространённая практика, что пришлось ввести правила для контроля качества кода, подобные no-console, чтобы не оставлять случайные записи из журнала в коде для продакшена. Но что делать, если нужно специально зарегистрировать какое-нибудь событие, чтобы предоставить дополнительную информацию?
В этой статье рассматриваются различные ситуации, в которых требуется вести логи; показывается разница между методами console.log и console.error в Node.js и демонстрируется, как передать функцию логирования библиотекам, не перегружая пользовательскую консоль.

Теоретические основы работы с Node.js
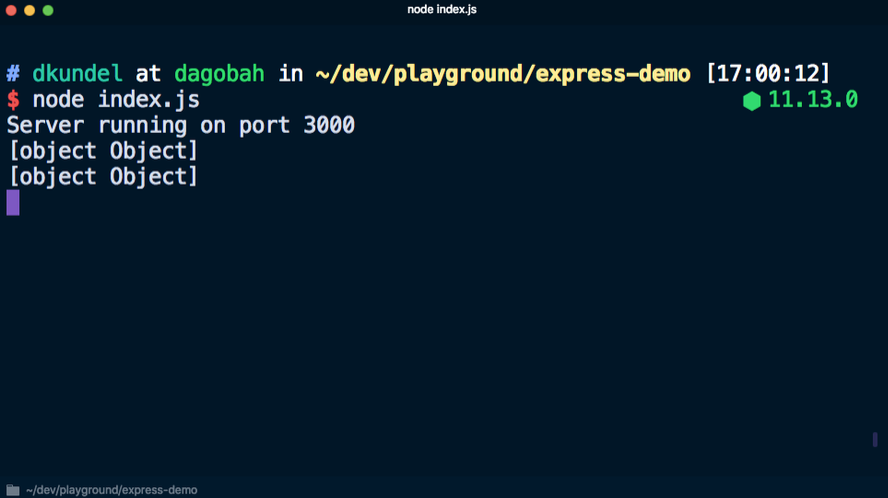
Методы console.log и console.error можно использовать как в браузере, так и в Node.js. Тем не менее, при использовании Node.js нужно помнить одну важную вещь. Если создать следующий код в Node.js, используя файл под названием index.js,

а затем выполнить его в терминале с помощью node index.js, то результаты выполнения команд будут располагаться один над другим:

Несмотря на то, что они кажутся похожими, система обрабатывает их по-разному. Если посмотреть раздел о работе console в документации Node.js, то окажется, что console.log выводит результат через stdout, а console.error – через stderr.
Каждый процесс может работать с тремя потоками (stream) по умолчанию: stdin, stdout и stderr. Поток stdin обрабатывает ввод для процесса, например нажатия кнопок или перенаправленный вывод (об этом чуть ниже). Стандартный поток вывода stdout предназначен для вывода данных приложения. Наконец, стандартный поток ошибок stderr предназначен для вывода сообщений об ошибках. Если нужно разобраться, для чего предназначен stderr и в каких случаях его использовать, прочитайте эту статью.
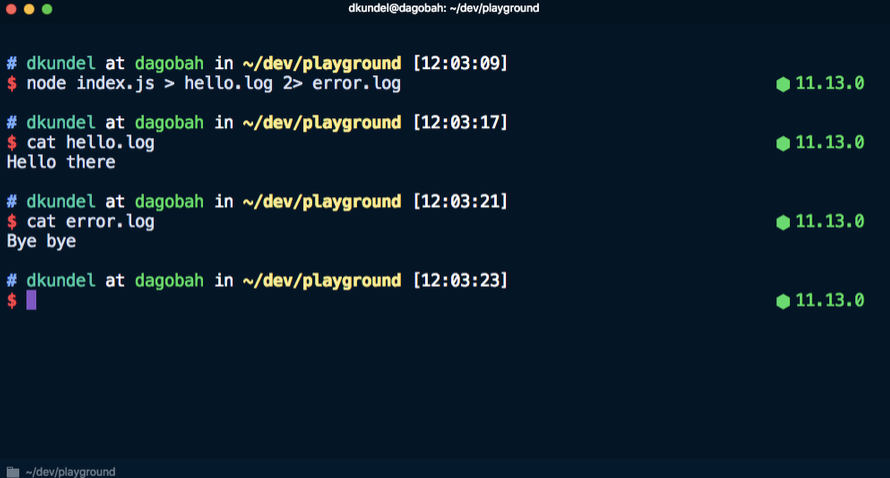
Если вкратце, то с его помощью можно использовать операторы перенаправления (>) и конвейера (|) для работы с ошибками и диагностической информацией отдельно от фактических результатов работы приложения. Если оператор > позволяет перенаправить вывод результата выполнения команды в файл, то с помощью оператора 2> можно перенаправить вывод потока ошибок stderr в файл. Например, эта команда отправит Hello there в файл hello.log, а Bye bye в файл error.log.

Когда необходимо записывать события в журнал?
Теперь, рассмотрев технические аспекты, лежащие в основе записи в журнал, перейдём к различным сценариям, в которых необходимо регистрировать события. Обычно эти сценарии относятся к одной из нескольких категорий:
- быстрая отладка при неожиданном поведении во время разработки;
- ведение журнала на базе браузера для анализа и диагностики;
- ведение журналов для серверных приложений для регистрации входящих запросов и возможные ошибки;
- ведение дополнительных журналов отладки для библиотек, чтобы помогать пользователям в решении проблем;
- ведение журнала для выходных данных интерфейса командной строки, чтобы выводить сообщения в консоли о ходе выполнения операции, подтверждениях и ошибках.
В этой статье рассматриваются только три последних сценария на базе Node.js.
Ведение журналов для серверных приложений
Существует несколько причин для логирования событий, происходящих на сервере. Например, логирование входящих запросов позволяет получить статистические данные о том, как часто пользователи сталкиваются с ошибкой 404, что может быть этому причиной или какое клиентское приложение User-Agent используется. Также можно узнать время возникновения ошибки и её причину.
Для того чтобы поэкспериментировать с материалом, приведённым в этой части статьи, нужно создать новый каталог для проекта. В каталоге проекта создаём index.js для кода, который будет использоваться, и выполняем следующие команды для запуска проекта и установки express:

Настраиваем сервер с межплатформенным ПО, который будет регистрировать каждый запрос в консоли с помощью метода console.log. Помещаем следующие строки в файл index.js:
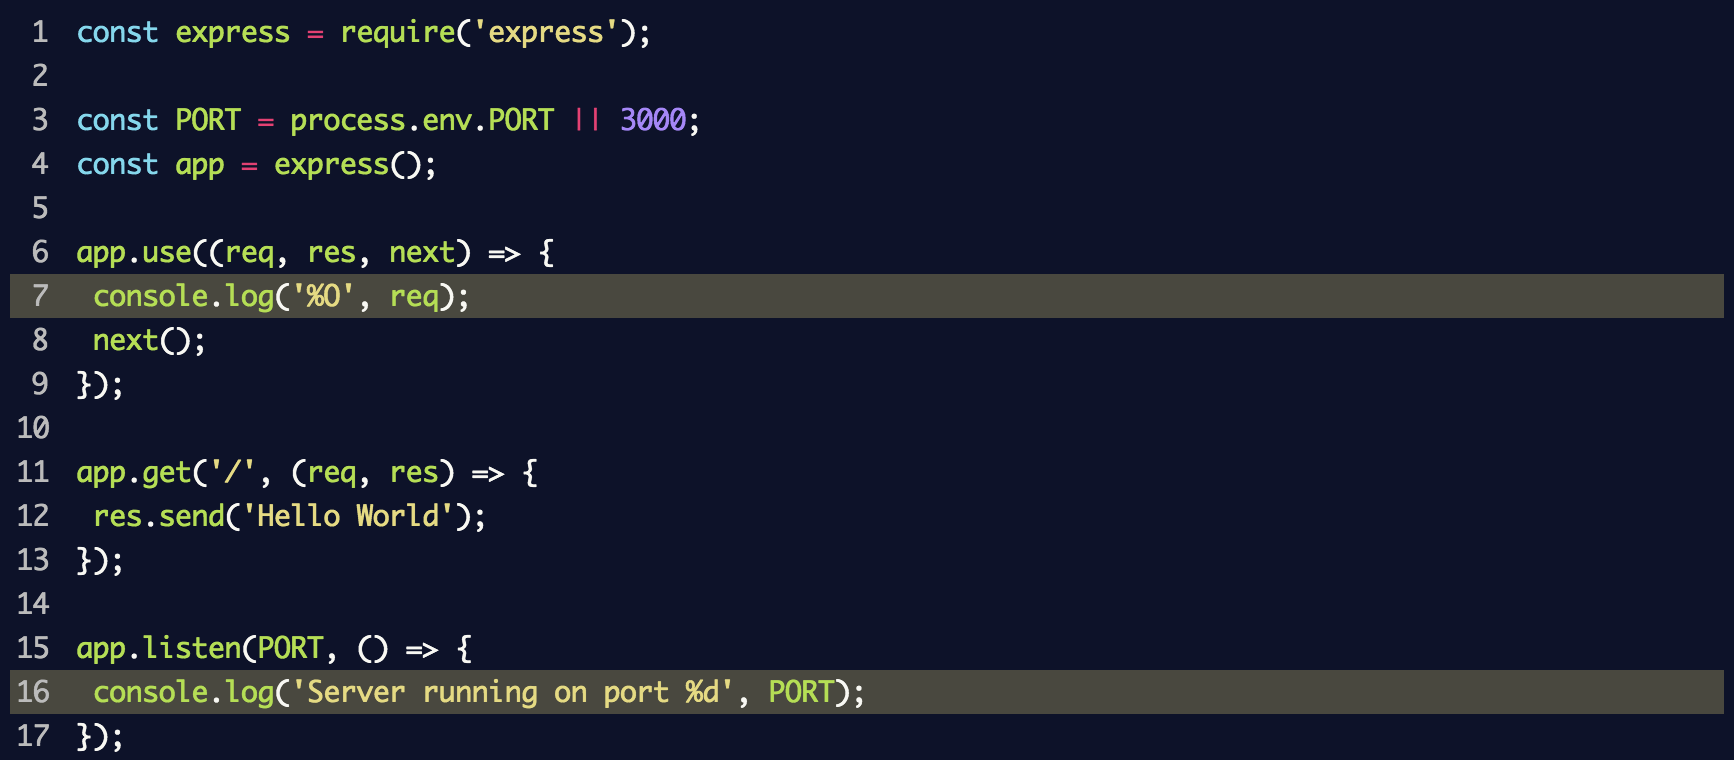
Здесь используется console.log('%O', req) для регистрации целого объекта в журнале. С точки зрения внутренней структуры метод console.log применяет util.format, который кроме %O поддерживает и другие метки-заполнители. Информацию о них можно найти в документации Node.js.
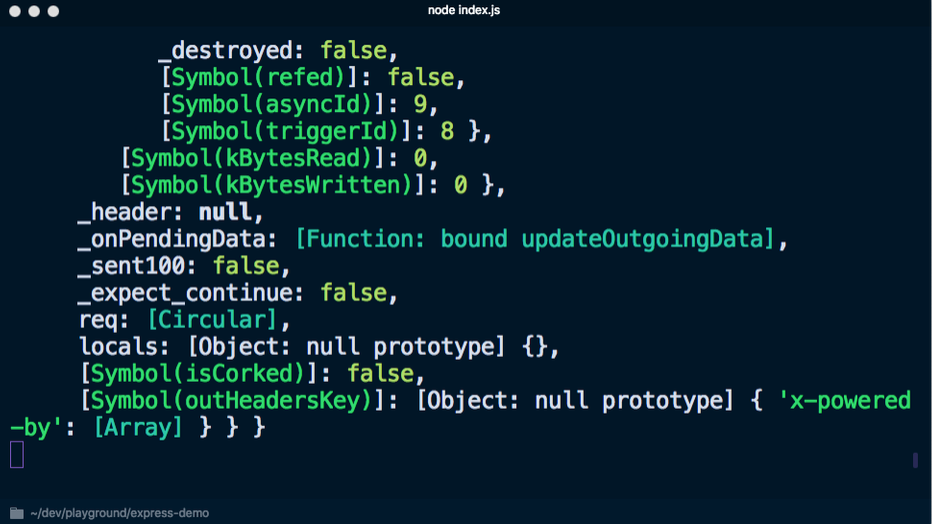
При выполнении node index.js для запуска сервера и переходе на localhost:3000 в консоли отображается много ненужной информации:
Если вместо этого использовать console.log('%s', req), чтобы не выводить объект полностью, много информации получить не удастся:
Можно написать собственную функцию логирования, которая будет выводить только нужные данные, однако сначала следует определиться, какая именно информация необходима. Несмотря на то, что в центре внимания обычно оказывается содержание сообщения, в реальности часто необходимо получить дополнительную информацию, которая включает:
- метку времени – чтобы знать, когда произошли события;
- имя компьютера/сервера – если запущена распределённая система;
- идентификатор процесса – если запущено несколько процессов Node с помощью, например,
pm2; - сообщение – фактическое сообщение с неким содержимым;
- трассировку стека – если ошибка регистрируется;
- дополнительные переменные/информацию.
Кроме того, учитывая, что в любом случае всё выводится в потоки stdout и stderr, возникает необходимость вести журнал на разных уровнях, а также конфигурировать и фильтровать записи в журнале в зависимости от уровня.
Этого можно добиться, получив доступ к разным частям процесса process и написав несколько строчек кода на JavaScript. Однако Node.js замечателен тем, что в нём уже есть экосистема npm и несколько библиотек, которые можно использовать для этих целей. К ним относятся:
pino;winston;- roarr;
- bunyan (эта библиотека не обновлялась в течение двух лет).
Часто предпочтение отдаётся pino, потому что она быстрая и обладает собственной экосистемой. Посмотрим, как pino может помочь с ведением журнала. Ещё одно преимущество этой библиотеки – пакет express-pino-logger, который позволяет регистрировать запросы.
Установим pino и express-pino-logger:

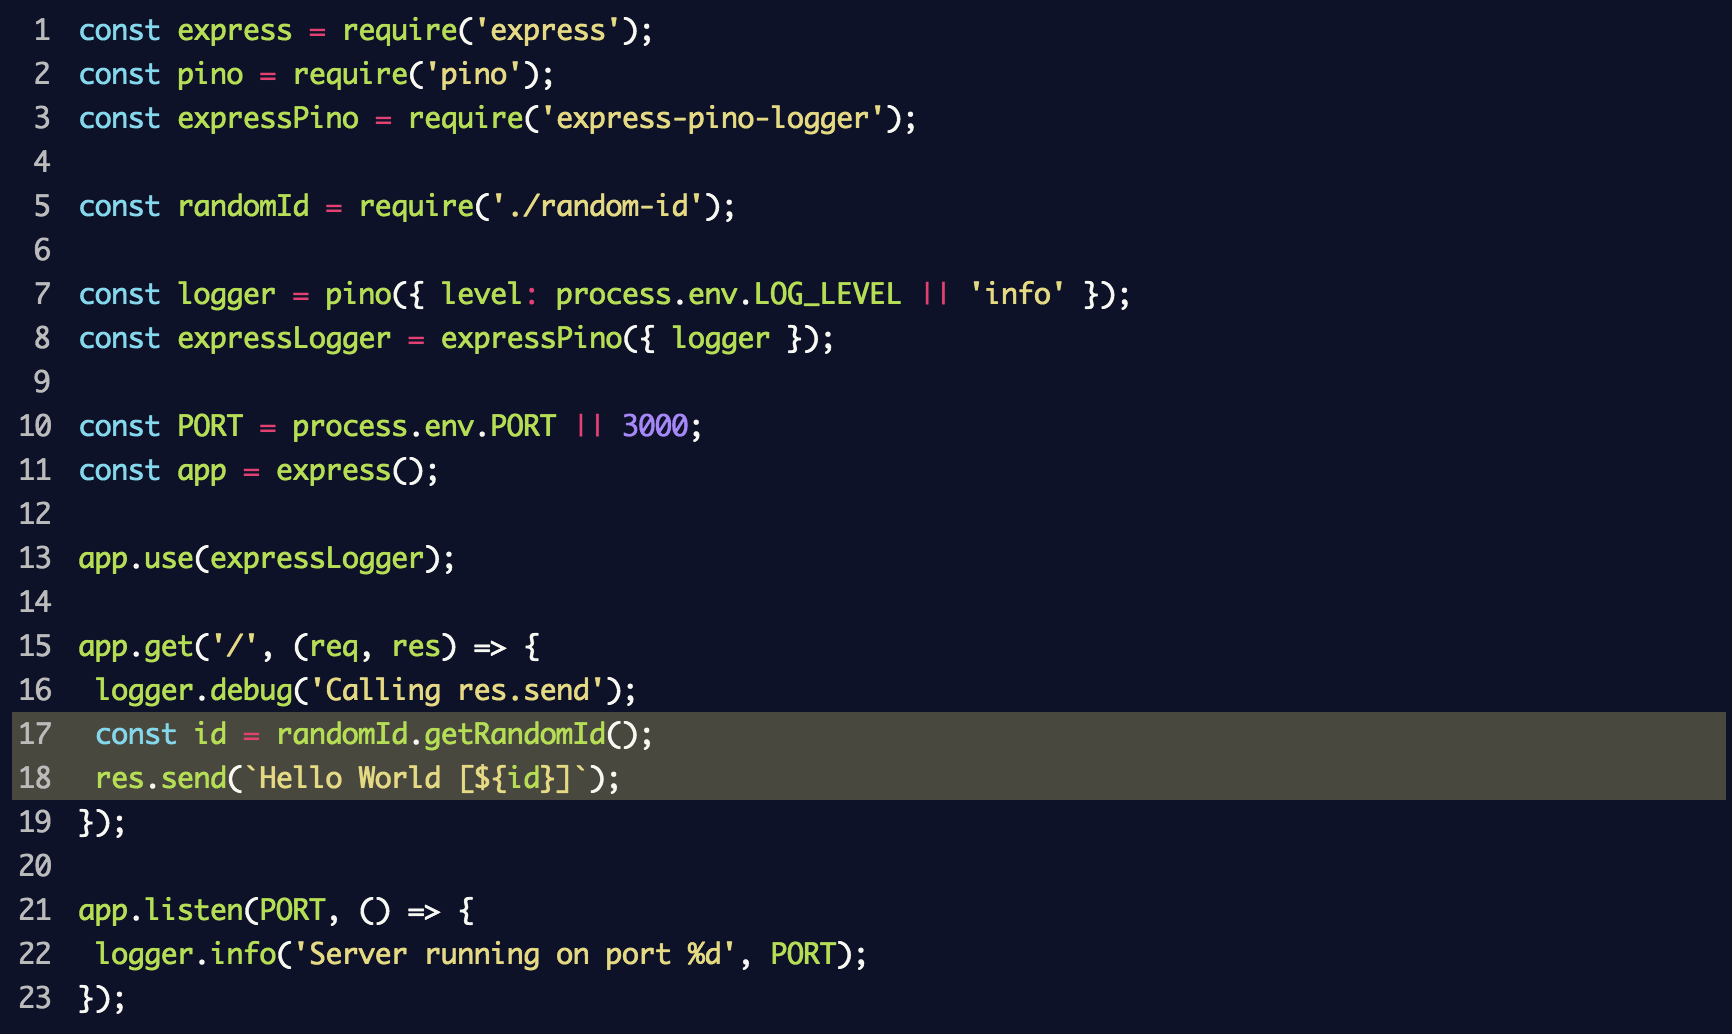
После этого обновляем файл index.js, чтобы использовать регистратор событий и межплатформенное ПО:
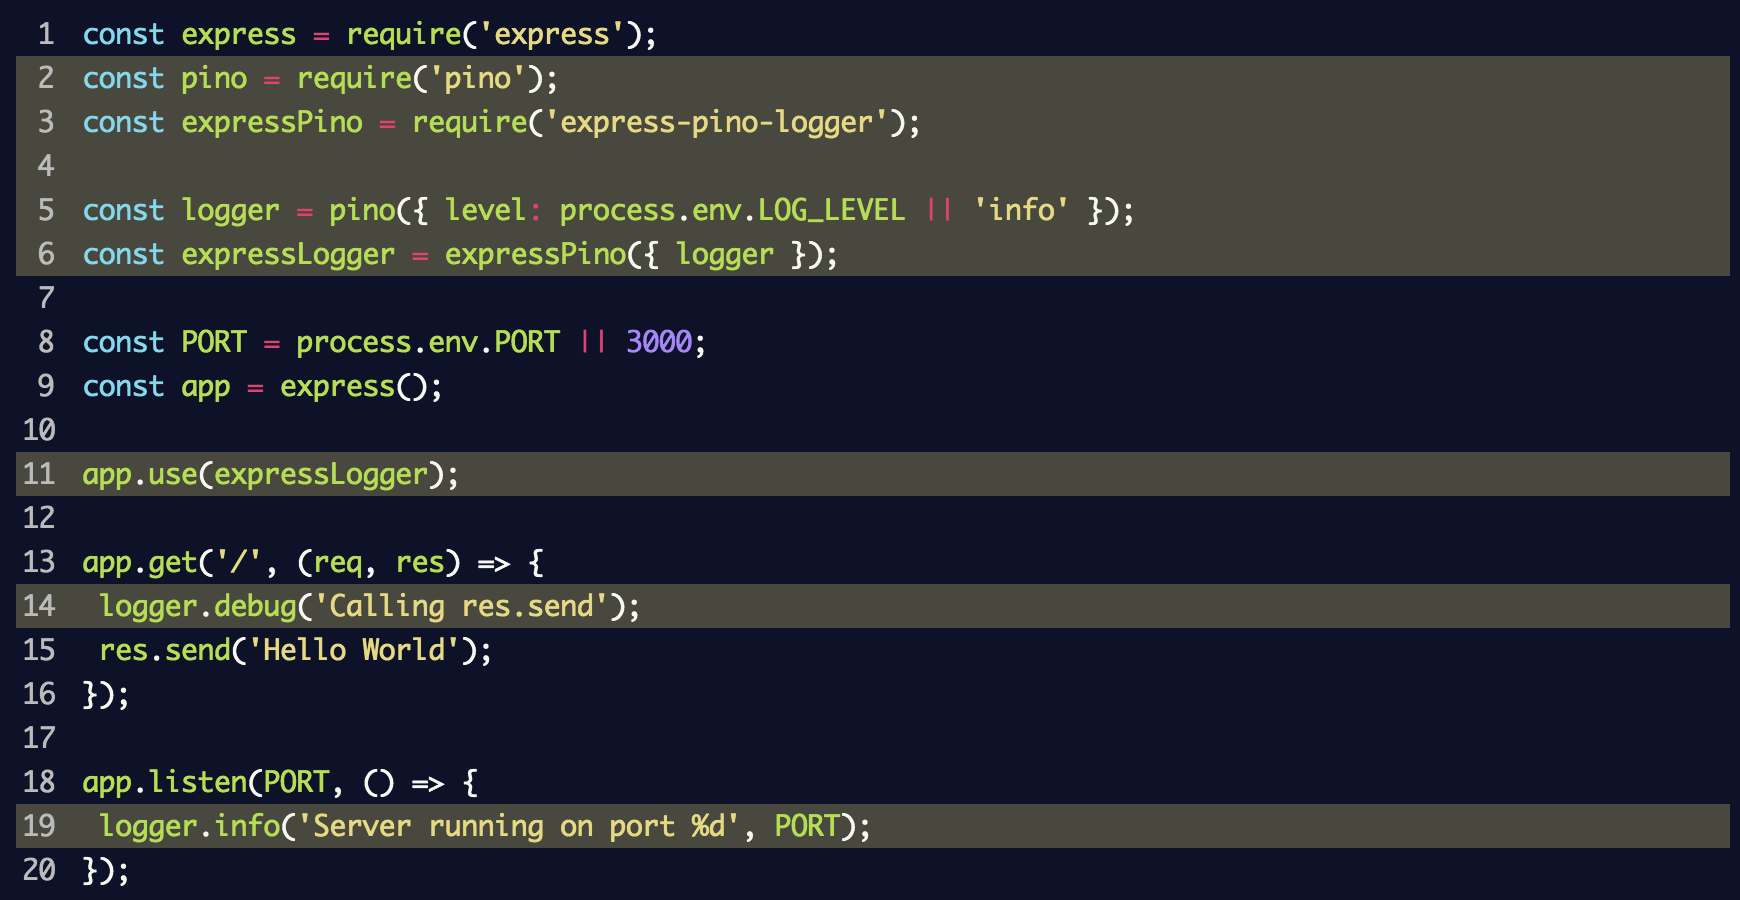
В этом фрагменте создали экземпляр регистратора событий logger для pino и передали его в express-pino-logger, чтобы создать новое межплатформенное ПО для регистрации событий, с которым можно вызвать app.use. Кроме того, console.log заменили при запуске сервера на logger.info и добавили logger.debug к маршруту, чтобы отображать разные уровни журнала.
Если вы перезапустите сервер, повторно выполнив node index.js, то получите на выходе другой результат, при котором каждая строка/линия будет выводиться в формате JSON. Снова переходим на localhost:3000, чтобы увидеть ещё одну новую строку в формате JSON.
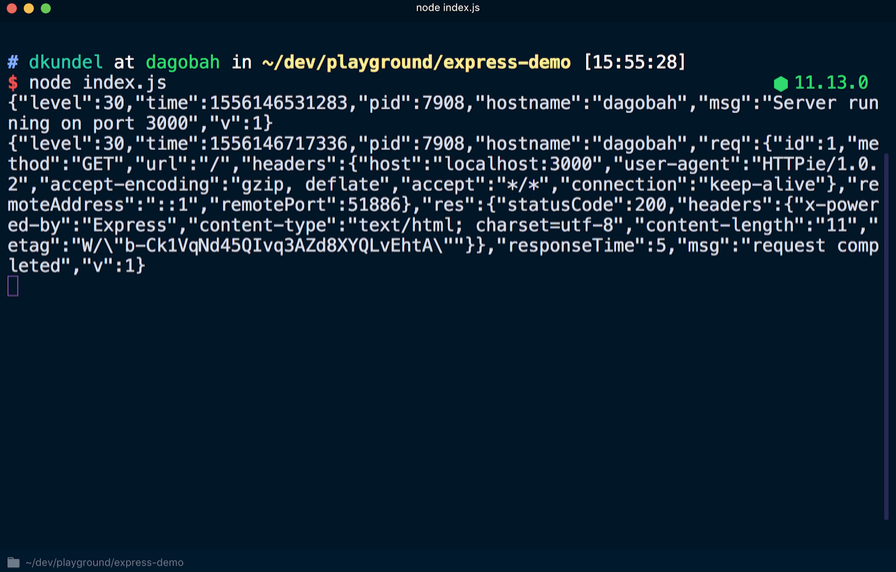
Среди данных в формате JSON можно обнаружить упомянутую ранее информацию, например метку времени. Также отмечаем, что сообщение logger.debug не было выведено. Для того чтобы сделать его видимым, необходимо изменить установленный по умолчанию уровень журнала. После создания экземпляра регистрации событий logger было установлено значение process.env.LOG_LEVEL. Это означает, что можно изменить значение или принять значение info по умолчанию. Запуская LOG_LEVEL=debug node index.js, изменяем уровень журнала.
Прежде чем это сделать, необходимо решить проблему выходного формата, который не слишком удобен для восприятия в настоящий момент. Этот шаг делается намеренно. Согласно философии pino, в целях производительности необходимо перенести обработку записей в журнале в отдельный процесс, передав выходные данные (с помощью оператора |). Процесс включает перевод выходных данных в формат, более удобный для восприятия человеком, или их загрузку в облако. Эту задачу выполняют инструменты передачи под названием transports. Ознакомьтесь с документацией по инструментам transports и вы узнаете, почему ошибки в pino не выводятся через stderr.
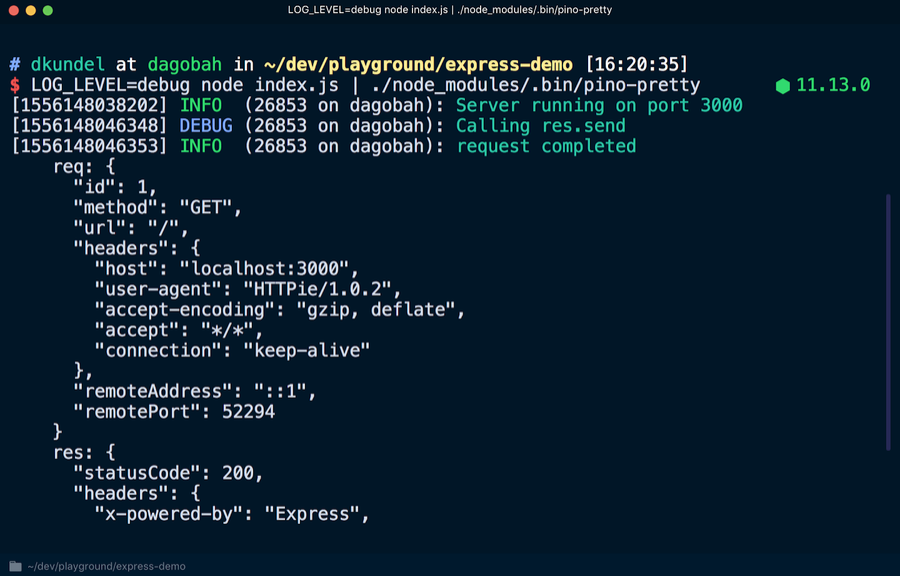
Чтобы просмотреть более удобную для чтения версию журнала, воспользуемся инструментом pino-pretty. Запускаем в терминале:

Все записи в журнале передаются с помощью оператора | в распоряжение pino-pretty, благодаря чему «очищаются» выходные данные, которые будут содержать только важную информацию, отображённую разными цветами. Если снова запросить localhost:3000, должно появиться сообщение об отладке debug.
Для того чтобы сделать записи в журнале более читабельными или преобразовать их, существует множество инструментов передачи. Их даже можно отобразить с помощью эмодзи, используя pino-colada. Эти инструменты будут полезны для разработки в локальных масштабах. При работе сервера в продакшене может появиться необходимость передавать данные журнала с помощью другого инструмента, записывать их на диск с помощью > для последующей обработки или делать две операции одновременно, используя определённую команду, например tee.
В документе также говорится о ротации файлов журнала, фильтрации и записи данных журнала в другие файлы.
Ведение журналов для библиотек
Изучив способы эффективной организации ведения журналов для серверных приложений, можно использовать ту же технологию для собственных библиотек.
Проблема в том, что в случае с библиотекой может понадобиться вести журнал в целях отладки, не нагружая при этом приложения клиента. Наоборот, клиент должен иметь возможность активировать журнал, если необходимо произвести отладку. По умолчанию библиотека не должна производить записи выходных данных, предоставив это право пользователю.
Хорошим примером этого является фреймворк express. Во внутренней структуре фреймворка express происходит много процессов, что может вызвать интерес к его более глубокому изучению во время отладки приложения. В документации для фреймворка express сказано, что к началу команды можно добавить DEBUG=express:* следующим образом:

Если применить эту команду к существующему приложению, можно увидеть множество дополнительных выходных данных, которые помогут при отладке:
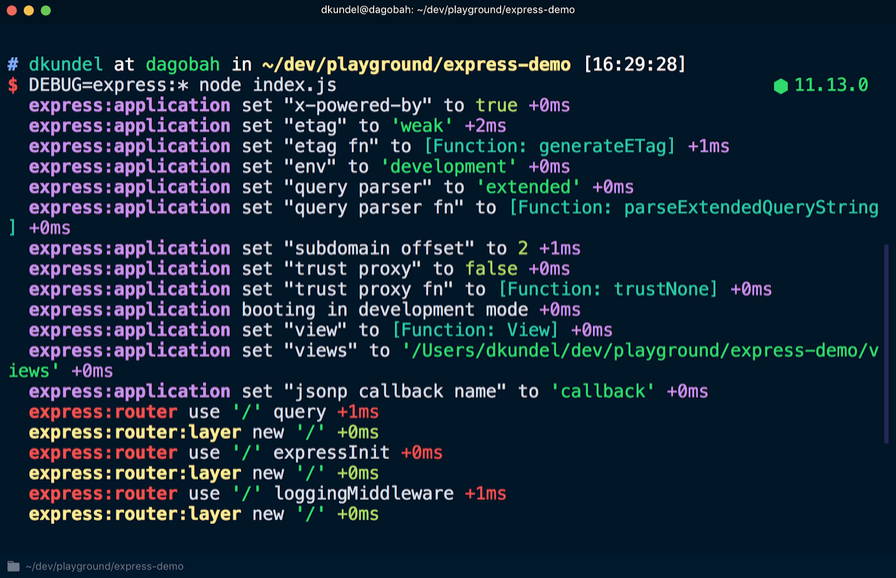
Эту информацию нельзя увидеть, если не активирован журнал отладки. Для этого существует пакет debug. С его помощью можно писать сообщения в «пространстве имён», и если пользователь библиотеки включит это пространство имён или подстановочный знак, который с ним совпадает, в их переменную среды DEBUG, то сообщения будут отображаться. Сначала нужно установить библиотеку debug:

Создайте новый файл под названием random-id.js, который будет моделировать работу библиотеки, и поместите в него следующий код:
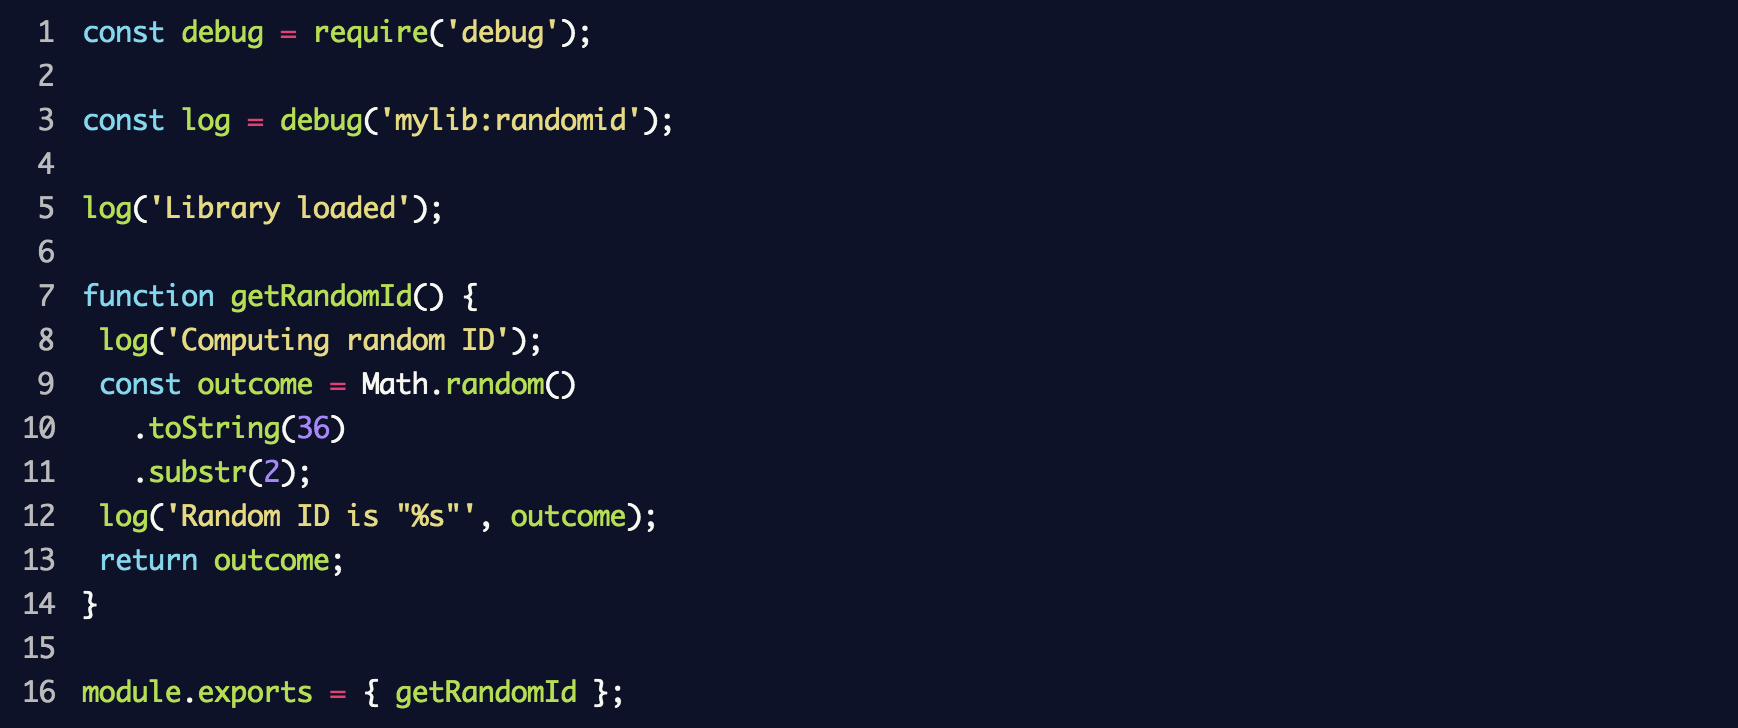
В результате будет создан новый регистратор событий debug с пространством имён mylib:randomid, в котором затем будут зарегистрированы два сообщения. Используем его в index.js из предыдущего раздела:
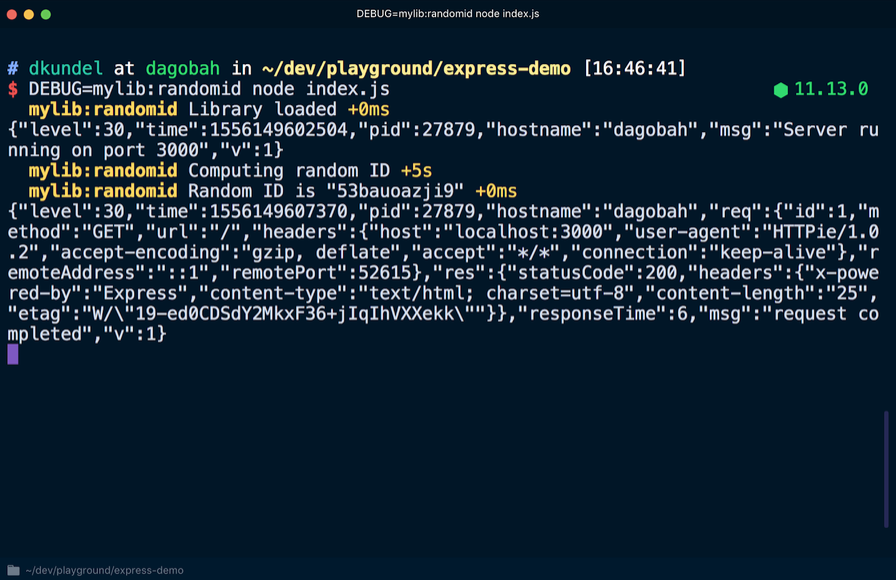
Если вновь запустить сервер, добавив в этот раз DEBUG=mylib:randomid node index.js, то отобразятся записи в журнале отладки для нашей «библиотеки»:
Если пользователи библиотеки захотят поместить информацию об отладке в записи журнала pino, они могут использовать библиотеку под названием pino-debug, созданную командой pino для корректного форматирования этих записей.
Устанавливаем библиотеку:

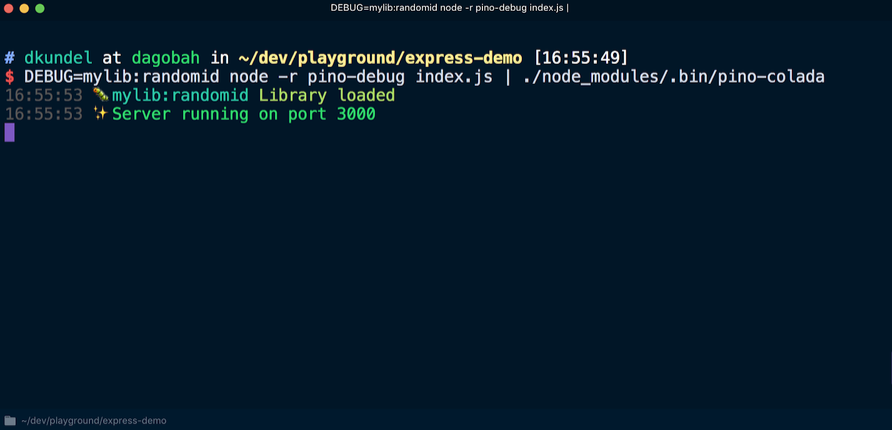
Перед первым использованием debug необходимо инициализировать pino-debug. Самый простой способ сделать это – использовать флаги -r или --require, чтобы запросить модуль перед запуском скрипта. Перезапускаем сервер, используя команду (при условии, что установлена pino-colada):

В результате записи журнала отладки библиотеки отобразятся так же, как и в журнале приложения:
Выходные данные интерфейса командной строки (CLI)
Последний случай, который рассматривается в этой статье, касается ведения журнала для интерфейса командной строки. Предпочтительно, чтобы журнал, регистрирующий события, связанные с логикой программы, вёлся отдельно от журнала для регистрации данных интерфейса командной строки. Для записи любых событий, связанных с логикой программы, нужно использовать определённую библиотеку, например debug. В этом случае можно повторно использовать логику программы, не будучи ограниченным одним сценарием использования интерфейса командной строки.
Создавая интерфейс командной строки с помощью Node.js, можно добавить различные цвета, блоки с изменяемым значением или инструменты форматирования, чтобы придать интерфейсу визуально привлекательный вид. Однако при этом нужно держать в уме несколько сценариев.
По одному из них интерфейс может использоваться в контексте системы непрерывной интеграции (CI), и в этом случае лучше отказаться от цветового форматирования и визуально перегруженного представления результатов. В некоторых системах непрерывной интеграции установлен флаг CI. Удостовериться, что вы находитесь в системе непрерывной интеграции, можно с помощью пакета is-ci, который поддерживает несколько таких систем.
Некоторые библиотеки, например chalk, определяют системы непрерывной интеграции и отменяют вывод в консоль цветного текста. Давайте посмотрим, как это работает.
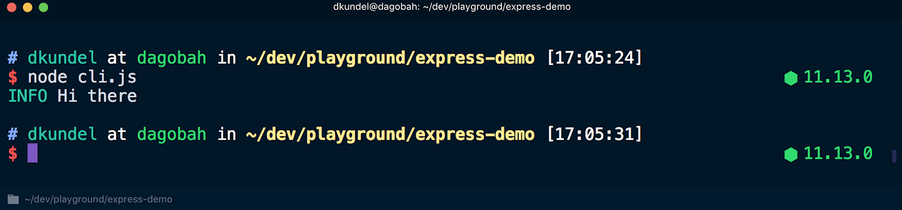
Установите chalk с помощью команды npm install chalk и создайте файл под названием cli.js. Поместите в файл следующие строки:

Теперь, если выполнить этот скрипт с помощью node cli.js, результаты будут представлены с использованием разных цветов:
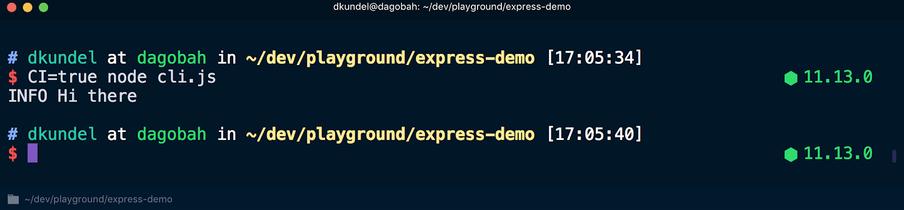
Но если выполнить скрипт с помощью CI=true node cli.js, цветовое форматирование текстов будет отменено:
В другом сценарии, о котором стоит помнить, stdout запущен в режиме терминала, т.е. данные выводятся на терминал. В этом случае результаты можно красиво отобразить с помощью boxen. В противном случае выходные данные, скорее всего, будут перенаправлены в файл или куда-то ещё.
Проверить работу потоков stdin, stdout или stderr в режиме терминала можно, посмотрев на атрибут isTTY соответствующего потока. Например, process.stdout.isTTY. TTY означает «телетайп» (teletypewriter) и в данном случае предназначен специально для терминала.
Значения могут различаться для каждого из трёх потоков в зависимости от того, как были запущены процессы Node.js. Подробную информацию об этом можно найти в документации Node.js, в разделе «Ввод/вывод процессов».
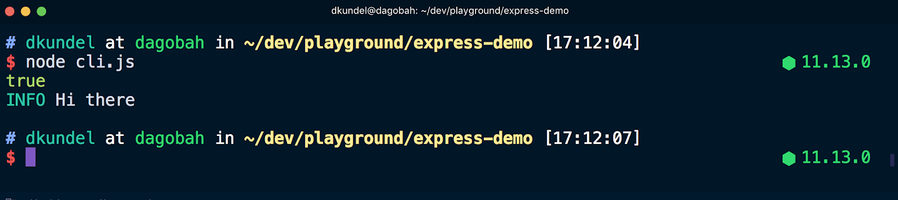
Посмотрим, как значение process.stdout.isTTY различается в разных ситуациях. Обновляем файл cli.js, чтобы проверить его:
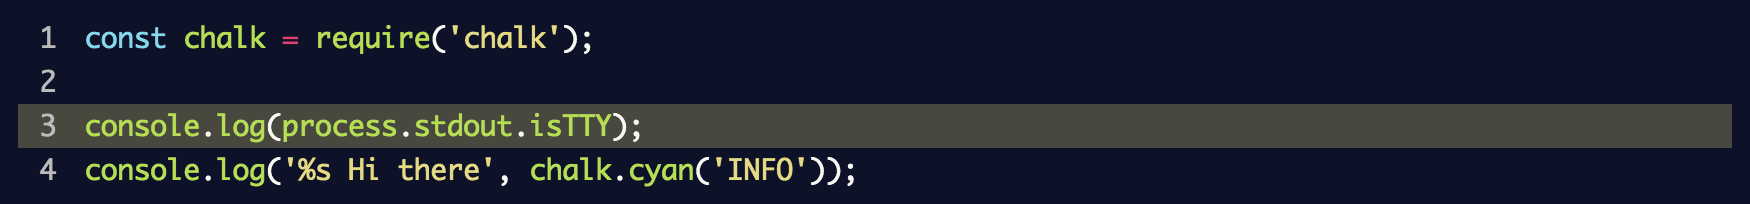
Теперь запускаем node cli.js в терминале и видим слово true, после которого цветным шрифтом отображается сообщение:
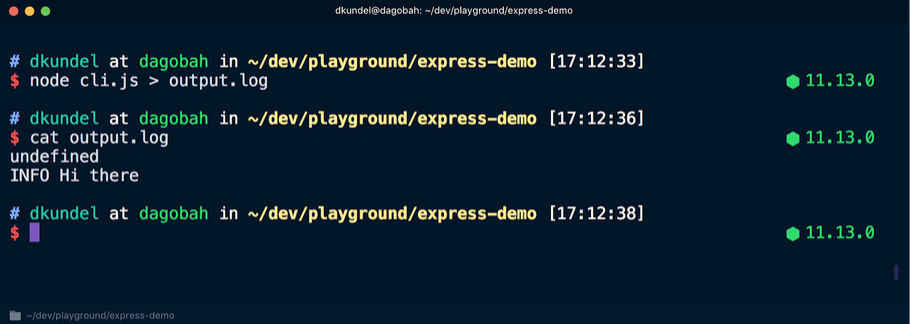
После этого повторно выполняем команду, но перенаправляем выходные данные в файл, а затем просматриваем содержимое:

В этот раз в терминале появилось слово undefined, за которым следует сообщение, отображённое бесцветным шрифтом, поскольку перенаправление потока stdout вывело его из режима терминала. Здесь chalk использует инструмент supports-color, который с точки зрения внутренней структуры проверяет isTTY соответствующего потока.
Такие инструменты, как chalk, выполняют эти действия самостоятельно. Однако, разрабатывая интерфейс командной строки, нужно всегда помнить о ситуациях, когда интерфейс работает в системе непрерывной интеграции или осуществляется перенаправление выходных данных. Эти инструменты помогают использовать интерфейс командной строки на более высоком уровне. Например, данные в терминале можно организовать более структурировано и, если isTTY имеет значение undefined, переключиться на более простой способ анализа.
Заключение
Начать использовать JavaScript и внести первую строчку в журнал консоли с помощью console.log довольно просто. Но перед тем как развернуть код в продакшене, следует учесть несколько аспектов использования журнала. Данная статья является лишь введением в различные способы и решения, применяемые при организации журнала событий. Она не содержит всего, что вам необходимо знать. Поэтому рекомендуется обращать внимание на удачные проекты с открытым кодом и отслеживать, каким образом в них решена проблема логирования и какие инструменты используются при этом. А теперь попробуйте сами вести логи без вывода данных в консоль.

Если вы знаете другие инструменты, о которых стоит упомянуть, напишите о них в комментариях.
Для начала повторю то, что каждый разработчик должен знать об этом — надо предохраняться.
Зачем надо логгировать
Вы запустили серверное приложение у которого нету GUI для отображения своего состояния, а знать очень хочется. Самое простое и очевидное решение, выводить какие то сообщения куда то — stdout/stderr, файлики, syslog, что-то более извращенное. Это и есть логирование (спасибо кэп).
Перечислю основные задачи, которые могут решаться при помощи логгирования:
- Анализ поведения и производительности. Здесь надо заметить, что для анализа производительности, лучше использовать проббирование (н-р twitter zipkin получает данные через пробы в коде). К поведению относится все, что сейчас происходит.
- Анализ и диагностика проблем. Тут очевидно — в приложении критическая ситуация 1/0 (причем не важно когда она произошла, приложение вот вот издохнет), что делать? Правильно — залоггировать это. О об этом подробнее чуть ниже.
- Всякие левые сценарии использования.
Как логгировать
Писать в логи надо и много и мало. Настолько мало, чтобы понять в каком состоянии приложение сейчас, и настолько много, чтобы если приложение рухнуло понять почему.
То есть пишем, что вы сами считаете нужным, для того, чтобы вам было понятно, что происходит. Но надо подчеркнуть, что логгирование ест ресурсы приложения — так что не надо увлекаться, я видел приложение однажды, где логгирование жрало примерно 50% производительности (это конечно же ппц не надо так делать).
Если происходит ошибка/исключение и тд, вам нужно понять почему. В этот самый момент, пишем в логи все (да, абсолютно все), что необходимо для понимания, почему это случилось (здесь как раз надо писать много — не надо скромничать).
Уровни логов
Очевидно, что не всякое сообщение имеет одинаковую важность. Обычно большинству приложении достаточно 5 уровней логгов — я использую название уровней к которым привык с slf4j:
- ERROR — приложение в критическом положении, требуется внимание человека для продолжения. Появляется довольно редко, но метко. Я использую его для очень низкоуровневых вещей или для необработанных исключений
- WARN — произошло что-то необычное, выбивающееся из обычного сценария, но приложение умное и восстановило свою работу само. Я использую этот уровень в обрабочиках ошибок.
- INFO — что сейчас происходит
- DEBUG — что сейчас происходит, более подробно
- TRACE — пишем как в твиттер, все что не попадя.
Далее будут небольшое сравнение логгеров, которые я опробовал в node.js и что в них не так, с учетом написанного выше.
log4js
Это первое на что я посмотрел, в надежде что это хоть сколько нибудь будет похоже на log4j.
Маленький пример:
var log4js = require('log4js');
var logger = log4js.getLogger();
logger.debug("Some debug messages");
В консоли появится цветное сообщение:
[2014-01-13 20:41:22.604] [DEBUG] [default] - Some debug messages
В этом логгере есть необходимый минимум. Есть фильтрация сообщений по уровню и категории (имени логгера), время сообщения и возможность его изменить. Для вывода сообщений использутся util.format — поэтому поддерживаются те же опции форматирования, что и в console.log.
winston
Его часто рекомендуют на SO. Я лично ни кому бы его не рекомендовал.
Пример:
var winston = require('winston');
winston.info('Hello distributed log files!');
Что будет в консоли:
info: Hello distributed log files!
В этом месте был небольшой опус о том, что winston не позволяет выдавать время записей, благодаря Keenn, оказалось, что все таки можно, но эти опции (timestamp: true у транспортов) выключены по умолчанию, что очень странно.
bunyan
В отличии от двух предыдущих библиотек этот логгер вместо текста выдает JSON. Создатель решил, что логи все равно разбираются машиной (коллекторами логгов), то пусть это будет машиночитаемый формат. Это хорошо подходит под первый сценарий логирования (очевидно, что собирать пробы руками — это как минимум глупо), но не всегда используются коллекторы. Что лично мне показалось странным, или лучше сказать неудачным решением:
- JSON для второго сценария, который на мой взгляд наиболее разумное применение логирования, это как искать в ассемблерном коде ошибку в С++ коде. Логи читают люди. Если приложение небольшое, коллектор логов избыточен, а если появился, то нужно просто добавить для него обработчик.
- Если говорить об организации кода, то что обработчик логгера выплевывает и куда, это полностью ответственность обработчика — то есть по идее вывод JSON можно прикрутить к любой библиотеке которая позволяет писать свои обработчики/форматтеры.
- У bunyan есть одна фича — сериализаторы для пользовательских типов. Вместе с сообщением логгеру скармливается пачка объектов и он их сериализует. Если посмотреть на это под другим углом:
сериализация — это просто JSON представление объекта; каждый объект может определить у себя в прототипе метод toJSON и он будет вызван при JSON.stringify — вот и сериализатор; теперь как его вывести — абсолютно все логгеры позволяют выводить json представление объектов специальным флагом (для util.format это %j). То есть фича вроде как достаточно очевидная.
Я честно признаюсь, опыта использования этого логгера у меня почти нет (я пробовал его прикрутить самым первым — все таки joyent использует его), если мне покажут/укажут/ткнут носом, что в нем крутого, я с радостью послушаю и приму к сведению. Хотя я заметил, что есть простейшая организация иерархий логгеров, но ее использовать мне не показалось удобным.
intel
Это самое лучшая библиотека для логгирования, которая мне попалась. В плане конфигурации у меня к ней не было ни каких нареканий. Почему она мне понравилась:
- Как уже сказал, у нее очень удобная конфигурация, настроить можно все в одном месте. У логгеров есть обработчики, у обработчиков есть форматтеры сообщений, фильтры по сообщениям и уровням. Почти сказка.
- Иерархии логгеров, кто пришел н-р с slf4j считает это само собой разумеющимся, однако же только в этой либе это было нормально реализовано. Что такое иерархия логгов:
у каждого логгера есть родитель (полное имя логгера задается перечеслением через точку всех родителей), задавая конфигурацию родителя можно выставить опцию, чтобы все дети автоматически получали ее же (log propagation). То есть я могу например создать несколько родительских логеров, задать им обработчики (н-р на уровни ERROR и WARN слать email) и все дети будут использовать их же, но более того если мне нужно заглушить какое то дерево логгов, я просто специализирую конфигурацию для его полного пути. И все это в одном месте и один раз. - Очень разумная подмена стандартной console. Разрешаются пути относительно текущей рабочей директории, что позволяет без проблем конфигурировать вывод console.log и получить плюшки логгера.
После непродолжительно использования (я заметил, что в этом проекте форматированию уделяется столько же мало внимания как и в других), я сделал несколько пулл реквестов, чтобы добавить возможность вывода миллисикунд, поддержку форматированного вывода ошибок, но после непродолжительного общения с автором и 4-5 пулл реквестов, стало очевидно, что автор хочет идти своей дорогой и я форкнул проект добавив, то о чем мечтал.
Поковырявшись в коде я заметил, что автор оптимизировал код для бенчмарка. Свое мнение о таких вещах я лучше оставлю при себе.
Что я изменил в самой либе, оставив не тронутыми обработчики:
- Выкинул все такие оптимизации для бенчмарка — писать такое себя не уважать.
- Формат сообщений в intel: нужно у полей объекта-записи указывать их тип (н-р ‘[%(date)s] %(name)s:: %(message)s’), но ведь типы этих полей известны — так зачем нужно их указывать. Вместо этого я взял формат сообщений из logback.
- Для форматирования аргументов при логгировании используется свой собственный аналог util.format причем со своими ключами и он же используется при подмене консоли, то есть если сторонняя либа напишет, что то в консоль мы получим не то что ожидаем. Естественно это было заменено на util.format
- После некоторого профайлинга стало очевидно, что все время уходит на форматирование сообщений. Так как формат обычно задается один раз разумно его оптимизировать, что и было сделано, с помощью new Function формат собирается один раз, а не при каждом вызове.
Есть еще некоторые мелочи, но это будет уже какой то пиар, а не сравнение.
Чтобы показать некоторую пузомерку отличий — маленький замер скорости (код бенчмарка, все версии последние). Просто выведем logger.info(с сообщением):
$ node benchmark/logging.js
console.info x 1,471,685 ops/sec ±0.79% (95 runs sampled)
rufus.info x 200,641 ops/sec ±1.04% (84 runs sampled)
winston.info x 65,567 ops/sec ±0.80% (96 runs sampled)
intel.info x 56,117 ops/sec ±1.51% (92 runs sampled)
bunyan.info x 86,970 ops/sec ±1.71% (81 runs sampled)
log4js.info x 45,351 ops/sec ±3.25% (79 runs sampled)
Fastest is console.info
При вот таком формате сообщений ‘[%date] %logger:: %message’, который разумно ожидать всегда. Попробуем заменить на стандартное сообщение в intel, чтобы ощутить всю мощь оптимизаций:
$ node benchmark/logging.js
console.info x 1,569,375 ops/sec ±0.66% (95 runs sampled)
rufus.info x 199,138 ops/sec ±0.81% (97 runs sampled)
winston.info x 66,864 ops/sec ±0.84% (91 runs sampled)
intel.info x 173,483 ops/sec ±5.64% (59 runs sampled)
bunyan.info x 86,357 ops/sec ±1.02% (94 runs sampled)
log4js.info x 49,978 ops/sec ±2.29% (81 runs sampled)
Fastest is console.info
Интересное изменение.
Вообщем, то все. Если кому интересно — форк (я скорее всего не буду принимать feature запросы, так как писал для себя в свободное время, с багами и пулл реквестами добро пожаловать).
Как всегда, надеюсь в комментариях найти что-то новое для себя. Ошибки пожалуйста в личку.
Logging refers to the process of recording some detail about application
behavior and storing it in a persistent medium. Having a good logging system is
a key feature that helps developers, sysadmins, and support teams to monitor the
behavior of an application in production, and solve problems as they appear.
Troubleshooting is not the only valid reason to log. Product teams and designers
also use logs to track user behavior (such as A/B testing), and the marketing
department can measure the impact of a specific marketing campaign through the
logs.
In short, logging can provide value for every department in an organization
provided that the correct things are logged in the right format, and analyzed
using a specialized tool.
This tutorial will explain the basics of logging in Node.js starting from the
built-in console module, then proceed to topics like choosing a logging
framework, using the right log format, structuring your messages and sending
them to a log management system for long-term storage and further analysis.
🔭 Want to centralize and monitor your Node.js logs?
Head over to Logtail and start ingesting your logs in 5 minutes.
Prerequisites
Before you proceed with this article, ensure that you have a recent version of
Node.js and npm installed locally on your
machine. Also, you can sign up for a free
Logtail account if you’d like to centralize
your application logs in one place but this is not required to follow through
with this tutorial.
What should you log?
Before we discuss the mechanics of Node.js logging, let’s discuss the general
things that you should be logging in a Node.js application. It’s possible to log
too much or too little so these general guidelines are helpful when determining
what to log:
- Think about the critical aspects of your program and identify which
information you will want to debug an issue in production. - Log as much as possible in development at the appropriate level and turn off
the superfluous details in production through an environmental variable. You
can always turn them back on if you need to trace a problem more closely. - Log data that can help you profile your code in the absence of specialized
tools. - Log your Node.js errors, whether they are operational or not.
- Log uncaught exceptions and unhandled promise rejections at the highest log
level so that it can be fixed promptly.
It might also be helpful to think about what not to log:
- Don’t log sensitive user information such as passwords, credit card details.
- Avoid logging anything that can cause you to fall afoul of any relevant
regulations in places where your business operates.
Following these simple rules will help if you’re just getting started with
logging. As your application evolves, you’ll figure out how valuable your logs
are and update your logging strategy accordingly.
Logging using the console module
The most common way to log in Node.js is by using methods on the console
module (such as log()). It’s adequate for basic debugging, and it’s already
present in the global scope of any Node.js program. All the methods provided on
the console module log to the console, but there are ways to redirect the
output to a file as you’ll see shortly. These are the console methods commonly
used for logging in Node.js:
console.error(): used for serious problems that occurred during the
execution of the program.console.warn(): used for reporting non-critical unusual behavior.console.trace(): used for debugging messages with extended information (a
stack trace) about application processing.console.info(),console.log(): used for printing informative messages
about the application.
Let’s look at a quick example of using the logging methods on the console
object. Create a main.js file in the root of your project, and populate it
with the following code:
const fruits = [
  'apple',
  'banana',
  'grapefruit',
  'mango',
  'orange',
  'melon',
  'pear',
];

const basket = [];

function addToBasket(item) {
  if (basket.length < 5) {
    // log the action
    console.info(`Putting "${item}" in the basket!`);
    basket.push(item);
  } else {
    // log an error if the basket is full
    console.error(`Trying to put "${item}" in the full basket!`);
  }
}

for (const fruit of fruits) {
  addToBasket(fruit);
}

// log the current basket state
console.log('Current basket state:', basket);
Save the file, then run the program using the command below:
You should observe the following output:
Output
Putting "apple" in the basket!
Putting "banana" in the basket!
Putting "grapefruit" in the basket!
Putting "mango" in the basket!
Putting "orange" in the basket!
Trying to put "melon" in the full basket!
Trying to put "pear" in the full basket!
Current basket state: [ 'apple', 'banana', 'grapefruit', 'mango', 'orange' ]
Now that we can log to the console, let’s look at a way to store our log output
in a log file for further processing. You can do this by redirecting the output
of the program to a file as shown below:
node main.js > combined.log
You’ll notice that the following error logs were printed to the console:
Output
Trying to put "melon" in the full basket!
Trying to put "pear" in the full basket!
Meanwhile, you’ll also notice that a new combined.log file is present in the
current working directory. If you inspect the file in your editor or with cat,
you’ll see the following contents:
Output
Putting "apple" in the basket!
Putting "banana" in the basket!
Putting "grapefruit" in the basket!
Putting "mango" in the basket!
Putting "orange" in the basket!
Current basket state: [ 'apple', 'banana', 'grapefruit', 'mango', 'orange' ]
The reason why the error logs were printed to the console instead of being sent
to the combined.log file is that the error() method prints its messages to
the standard error (stderr) and the > operator works for messages printed to
the standard output (stdout) alone (both info() and log() print to
stdout).
To ensure that error logs are also placed in a file, you need to use the 2>
operator as shown below:
node main.js > main.log 2> error.log
Using > main.log lets you redirect the stdout contents to the main.log
file while 2> error.log redirects the contents of stderr to the error.log
file. You can inspect the contents of both files using cat as shown below:
This outputs the following:
Output
Putting "apple" in the basket!
Putting "banana" in the basket!
Putting "grapefruit" in the basket!
Putting "mango" in the basket!
Putting "orange" in the basket!
Current basket state: [ 'apple', 'banana', 'grapefruit', 'mango', 'orange' ]
Next, display the contents of the error.log file:
Which should yield the following output:
Output
Trying to put "melon" in the full basket!
Trying to put "pear" in the full basket!
If you want to log both types of messages to a single file, you can do the
following:
node main.js > app.log 2>&1
This would redirect the stdout file descriptor to the app.log and redirect
stderr to stdout.
Output
Putting "apple" in the basket!
Putting "banana" in the basket!
Putting "grapefruit" in the basket!
Putting "mango" in the basket!
Putting "orange" in the basket!
Trying to put "melon" in the full basket!
Trying to put "pear" in the full basket!
Current basket state: [ 'apple', 'banana', 'grapefruit', 'mango', 'orange' ]
To learn more about input or output redirection, you can read more about file
descriptors on the wooledge pages.
Don’t forget to check out the
Node.js Console documentation to learn
more about the other features of the console module.
Why you need a logging framework
Using the methods on the console module is a good way to get started with
Node.js logging, but it’s not adequate when designing a logging strategy for
production applications due to its lack of convenience features like log levels,
structured JSON logging, timestamps, logging to multiple destinations, and more.
These are all features that a good logging framework takes care
of so that you can focus on the problem you’re trying to
solve instead of logging details.
There are a lot of options out there when it comes to logging frameworks for
Node.js. They mostly offer similar features so choosing between them often boils
down to the one whose API you love the most. Here’s a brief overview of the most
popular logging packages on NPM that you can check out:
- Winston: the most popular and
comprehensive logging framework for Node.js - Pino: offers an extensive feature-set and claims to be
faster than competing libraries. - Bunyan: provides structured JSON
logging out of the box. - Roarr: use this if you need a single
library for logging in Node.js and the browser.
In this tutorial, we’ll be demonstrating some basic features of a logging
framework through Winston since it remains the most popular logging framework
for Node.js at the time of writing.
Getting started with Winston
Winston is a multi-transport async
logging library for Node.js with rich configuration abilities. It’s designed to
be a simple and universal logging library with maximal flexibility in log
formatting and transports (storage). You can install Winston in your project
through npm:
After installing Winston, you can start logging right away by using the default
logger which is accessible on the winston module. Clear your main.js file
before populating it once more with the following code:
const winston = require('winston');

const consoleTransport = new winston.transports.Console();

winston.add(consoleTransport);

winston.info('Getting started with Winston');
winston.error('Here is an error message');
Before you can use the default logger, you need to set at least one transport
(storage location) on it because none are set by default. In the snippet above,
we’ve set the
Console transport
which means that subsequent log messages will be outputted to the Node.js
console. Run the program to see this in action:
You should observe the following output:
{"level":"info","message":"Getting started with Winston"}
{"level":"error","message":"Here is an error message"}
Notice that the default logger has been configured to format each log message as
JSON instead of plain text. This is done to ensure that log entries are
structured in a consistent manner that allows them to be easily searched,
filtered and organised by a log management system.
Without structured logging, finding and extracting the useful data that is
needed from your logs will be a tedious experience because you’ll likely need to
write a custom parsing algorithm for extracting relevant data attributes from
plain text messages, and this task can become quite complicated if the
formatting of each message varies from entry to entry.
Winston uses JSON by default, but it provides some other predefined options like
simple, cli, and logstash which you can investigate further. You can also
create a completely custom format by using winston.format. Under the hood,
this uses the logform module to format
the messages.
Since JSON is both human and machine-readable, it remains the go-to format for
structured logging in most Node.js applications. We recommend that you stick
with it unless you strongly prefer some other structured format (such as
logfmt for example).
Understanding Log levels
In the previous code block, you’ll notice the presence of the level property
in each log entry. The value of this property indicates how important the
message is to the application. Notably, this is absent in the native Console
module, and it’s one of the major reasons why its methods are unsuitable for
serious production-ready applications.
In general, log levels indicate the severity of the logging message. For
example, an info message is just informative, while a warn message indicates
an unusual but not critical situation. An error message indicates that
something failed but the application can keep working, while a fatal or
emergency message indicates that a non-recoverable error occurred and
immediate attention is needed to resolve the issue.
The exact log levels available to you will depend on your framework of choice,
although this is usually configurable. Winston provides six log levels on its
default logger and six corresponding methods which are ordered from the most
severe to the least severe below:
const levels = {
  error: 0,
  warn: 1,
  info: 2,
  http: 3,
  verbose: 4,
  debug: 5,
  silly: 6
};
Severity ordering in Winston conforms to the order specified by the
RFC5424 document in which the most severe
level is numbered 0, and each subsequent level ascends numerically ensuring
that the least severe level has the highest number.
winston.error('error');
winston.warn('warn');
winston.info('info');
winston.verbose('verbose');
winston.debug('debug');
winston.silly('silly');
The log level for an entry has an important consequence when logging. It
determines if the entry will be emitted by the logger during program execution.
You can test this out by placing each of the six logging methods above in your
main.js file and executing it. You’ll notice that only the first three appear
in the Node.js console:
Output
{"level":"error","message":"error"}
{"level":"warn","message":"warn"}
{"level":"info","message":"info"}
That’s because the default logger is set to log at the info level by default.
This means that only messages with a minimum severity of info (or a maximum
number of 2) will be logged to the configured transport (the console in this
case). This behavior can be changed by customizing the level property on the
transport as shown below:
. . .

winston.add(consoleTransport);

consoleTransport.level = 'silly';

winston.error('error');
winston.warn('warn');
winston.info('info');
winston.verbose('verbose');
winston.debug('debug');
winston.silly('silly');
With the minimum severity level now set to silly, all the logging methods
above will now produce some output:
Output
{"level":"error","message":"error"}
{"level":"warn","message":"warn"}
{"level":"info","message":"info"}
{"level":"verbose","message":"verbose"}
{"level":"debug","message":"debug"}
{"level":"silly","message":"silly"}
It’s important to log at the appropriate level so that it’s easy to distinguish
between purely informative events and potentially critical problems that need to
be addressed immediately. Log levels also help to reduce the verbosity of
logging so that some messages are essentially turned off where they are not
needed. Usually, production environments will run the application at the info
level by default while testing or debugging environments typically run at the
debug or the lowest level in the hierarchy.
This setting is usually controlled through an environmental variable to avoid
modifying the application code each time the log level needs to be changed.
consoleTransport.level = process.env.LOG_LEVEL;
A starting point for your log entries
A good log entry should consist of at least the following three fields:
timestamp: the time at which the entry was created so that we can filter
entries by time.level: the log level, so that we can filter by severity.message: the log message that contains the details of the entry.
Using the default Winston logger gives us only two of the three properties, but
we can easily add the third by creating a custom logger. Update your main.js
file as shown below:
const winston = require('winston');

const logger = winston.createLogger({
  level: 'info',
  format: winston.format.json(),
  transports: [new winston.transports.Console()],
});

logger.info('Info message');
Three basic things to configure on a custom logger are the minimum log level,
the format of the log messages, and where the logs should be outputted. This
logger above does not behave too differently from the default logger at the
moment, but we can easily customize it further.
For example, let’s add the missing timestamp field on all log entries. The way
to do this is by creating a custom format that combines the timestamp() and
json() formats as shown below:
const logger = winston.createLogger({
  level: 'info',
  format: winston.format.combine(
    winston.format.timestamp(),
    winston.format.json()
  ),
  transports: [new winston.transports.Console()],
});

logger.info('Info message');
After configuring the logger as shown above, a timestamp field will be
included in each entry:
Output
{"level":"info","message":"Info message","timestamp":"2022-01-22T08:24:44.305Z"}
You can also configure the format of the datetime value in the timestamp filed
by passing an object to the timestamp() method as shown below. The string
accepted by the format property must be one that can be parsed by the
fecha module.
winston.format.timestamp({
  format: 'YYYY-MM-DD HH:mm:ss',
})
This yields the following output:
{"level":"info","message":"Info message","timestamp":"2022-01-23 13:46:35"}
Writing good log messages
The way messages are crafted is essential to good logging practices. The whole
point of logging is to help you understand what is happening in your
application, so it’s necessary to adequately describe the details of each entry
using detailed and concise language so that your logs don’t turn out to be
useless when you need them the most. Some examples of bad log messages include
the following:
Output
Something happened
Transaction failed
Couldn't open file
Failed to load resource
Task failed successfully
Here are examples of better log messages:
Output
Failed to open file 'abc.pdf': no such file or directory
Cache hit for image '59AIGo0TMgo'
Transaction 3628122 failed: cc number is invalid
Adding context to your log entries
Another important way to furnish your log entries with useful details is by
adding extra fields to each JSON object aside from the three already discussed.
A good starting point for the data points that you can add to your logs include
the following:
- HTTP request data such as the route path or verb.
- IP addresses.
- Session identifiers.
- Order or transaction IDs.
- Exception details.
You can do so by passing an object as the second argument to each logging
method:
logger.info('Starting all recurring tasks', {
  tag: 'starting_recurring_tasks',
  id: 'TaskManager-1234729',
  module: 'RecurringTaskManager',
});
This yields the following output:
Output
{"id":"TaskManager-1234729","level":"info","message":"Starting all recurring tasks","module":"RecurringTaskManager","tag":"starting_recurring_tasks","timestamp":"2022-01-23 14:51:17"}
If you add context to your log entries in this manner, you won’t need to repeat
the information in the message itself. This also makes it easy to filter your
logs, or to find a specific entry based on some criteria.
Storing logs in files
Logging to the console may be good enough in development, but it’s important to
record the entries into a more permanent location when deploying to production.
Winston provides a
File transport
to help you direct entries to a file. You can use it via the transports
property as shown below
const logger = winston.createLogger({
  levels: logLevels,
  level: 'trace',
  format: winston.format.combine(
    winston.format.timestamp(),
    winston.format.json()
  ),
  transports: [new winston.transports.File({ filename: 'combined.log' })],
});
This replaces the Console transport with the File transport so all emitted
entries will now be placed in the combined.log file. You can log to more than
one transport at once so you can log to both the console and a file using the
snippet below:
transports: [
  new winston.transports.Console(),
  new winston.transports.File({ filename: 'combined.log' }),
]
To prevent a log file from getting too big, you should rotate them through a
transport like the
winston-daily-rotate-file.
You can also use an external tool like
logrotate if you’re deploying to a
Linux-based operating system.
Aggregating your logs
Once you’re used to writing and reading logs, you’ll want to aggregate them in a
specialized log management tool. This helps you centralize your logs in one
place, and filter them to debug an issue or gather insights from them in various
ways. You can even discover usage patterns that could come in handy when
debugging specific issues, or create alerts to get notified when a specific
event occurs.
Logtail is a specialized log management tool
that integrates perfectly with several Node.js logging frameworks. To use it
with Winston, you’ll need to install the
@logtail/node and
@logtail/winston packages:
npm install @logtail/node @logtail/winston
Afterward, you can set Logtail as one of the transport options on your Winston
logger and log as normal. Note that you’ll need to
sign up for Logtail to retrieve your source
token. Ensure to replace the <your_source_token> placeholder below with this
token string.
const winston = require('winston');
const { Logtail } = require('@logtail/node');
const { LogtailTransport } = require('@logtail/winston');

// Create a Logtail client
const logtail = new Logtail('<your_source_token>');

const logger = winston.createLogger({
  level: 'info',
  format: winston.format.combine(
    winston.format.timestamp(),
    winston.format.json()
  ),
  transports: [new winston.transports.Console(), new LogtailTransport(logtail)],
});

logger.info('Info message');
After executing the above snippet, you should see the following output in the
Live tail section on the Logtail dashboard.
For more information on how Logtail integrates with Node.js applications, please
see the full documentation.
Summary
- Logging is a necessary task in application development and it should be taken
seriously. - Due to the deficiencies of the Node.js
consolemodule, it is recommended
that a suitable logging framework is employed for this task. - Structured logging is key for automated processing (such as for alerting or
auditing). - Use JSON format for log entries to maintain human and machine readability.
- Always log at the appropriate level and turn off superfluous levels in
production. - Ensure all log entries have a timestamp, log level, and message.
- Improve your log entries with contextual information.
- Use a log management solution, such as Logtail, to aggregate and monitor your
logs as this can help you drastically improve the speed at which issues are
resolved.
Conclusion and next steps
We hope this article has helped you learn enough to get started with logging in
your Node.js applications. As the title suggests, this is only the starting
point of your logging journey, so feel free to do some more research on this
topic as needed. We also have specialized guides that provide more detail on
everything you can do with logging frameworks like
Winston
and Pino, and also some Node.js logging best practices to follow so
ensure to check those out as well.
Thanks for reading, and happy coding!
Centralize all your logs into one place.
Analyze, correlate and filter logs with SQL.
Create actionable
dashboards.
Share and comment with built-in collaboration.
Got an article suggestion?
Let us know
![]()
![]()
![]()
Next article
A Complete Guide to Pino Logging in Node.js
Learn how to start logging with Pino in Node.js and go from basics to best practices in no time.
→
![]()
This work is licensed under a Creative Commons Attribution-NonCommercial-ShareAlike 4.0 International License.
Building SaaS products is hard. Making customers happy is even harder. I should know, I’ve built a start-up that failed!
But, not everything is that bad. I learned a lot. Now I maintain a few open-source Node.js projects at Sematext. It’s a monitoring SaaS. I joined to help make the log management features as good as they can be. If you’ve never heard that term before, my co-worker wrote this great introductory explanation of what is log management.
Let me tell you, the peeps here at Sematext take logs seriously! But, back to the topic at hand.
I want to take you on a trip to show what I’ve learned so far about logging in Node.js while working on open-source projects. Hopefully, it’ll help you improve your code, make it more robust, and ultimately help you solve bugs and errors more quickly.
There are a few things I want to explain before we dive into some code examples and configurations. Not knowing anything about logging is okay, don’t feel pressured into having to google for explanations. I’ll go over as much as I can without making this article boring. 😉
After the introductory explanations, I’ll jump into code examples and explain what tools to use and what not to use to make your logging setup solid.
Ready to go down the rabbit hole? Let’s go! PS. I really love this song. 😄
Why Is Logging Important?
Reading and analyzing logs and making sense of errors, why they happen, and what they break, is your first line of defense when battling production downtime. These logs tell you what’s happening in your app, what’s misbehaving, and what’s the root cause of the issue you want to fix. Logs help you solve problems and maintain maximum uptime.
Logging in Different Environments
First of all, I want you to know you can gather and monitor logs from several different environments.
- Application
- Containers (Docker / Kubernetes)
- Infrastructure
Based on what you need, and how you configure your infrastructure, you can gather and send logs directly from your Node.js app which is the first option – Application.
Or, you can output logs to stdout/stderr and use a log collector and shipper tool running as a DaemonSet (K8s) / persistent Docker container (Docker) to gather and send these logs to a central location which would work for option 2 – Containers.
Finally, you can write Node.js logs to a file that’s stored on your server, then use a log shipping tool that would natively run on the server to tail this file and send the content to your preferred location for safekeeping if you pick option 3 – Infrastructure.
What Data Should You Log?
Log as much as you can while staying within reason and not breaking the budget.
It makes sense to log as much as you can. With more data, you can visualize issues easier. The better structure you create for the logs, the easier you can solve issues that pop up. But, here’s the kicker. This will make it easier for you to create alerts based on the richness of data and the proper log structure.
I can’t give you the ultimate correct answer for what to log. Every use case is different. But I can give you pointers on how to start.
What NOT to Log?
This is pretty straightforward. Would you like to expose credit card info, passwords, secret keys, your users’ personal data? I’d rather not. I’d also suggest you be careful here. Logs are considered data by law, and laws like GDPR require you to not expose or misuse user data. Here’s an article explaining logging GDPR best practices in simple terms.
To make sure you don’t expose sensitive data, you can drop fields like these or mask them by replacing the values with asterisk symbols (*).
Where to Send Log Data?
Most likely you’ll end up sending and storing logs in Elasticsearch. You can host it yourself, or use a hosted setup, or a SaaS tool. It doesn’t really matter. But I’m warning you, rolling your own will take time and require active maintenance. If you can’t afford that, I’d suggest using a SaaS or Elastic Stack alternative.
You want a tool that can integrate errors and logs so you have all the context you need at your disposal right away.
Some of the most common log management solutions that pop into my mind:
- Sematext
- Logz.io
- LogDNA
- Elasticsearch
If you’re on the market for a logging solution, have a look at this pros & cons comparison of the best log management tools, my co-worker, Radu, wrote. These include both free and paid solutions as well as some open-source tools as well.
We take logging seriously at Sematext. Having logs, metrics, events and alerts in one place lets you pivot and correlate all the data to get to the root cause of issues much faster. You don’t really have to believe me, try for yourself or check these screenshots to see what I mean.
Or, you can check out this short video on Sematext Logs.
How To Log Node.js Applications: Best Practices You Should Follow
I’ll run you through a set of best practices to follow, but more importantly, I’ll show you how to configure it all with code examples, so you can set up your own applications too!
Let’s go!
Use a Structured Logging Format
Please promise me you’ll never use the console.log every again in a production app. Please? Every time you do that a baby penguin dies. I mean, not really, but imagine that happens, and please never do it again. 😄
Structured logging has saved my skin so many times. What is it? It’s pretty self-explanatory. ALWAYS log out JSON objects with a certain predefined set of fields.
This makes it simple to filter logs based on severity levels. Meaning, if they are errors, warnings, debug logs or whatever else.
Structured logging allows you to add metadata to your logs that make your life easier. That’s the goal. Getting alerted when 💩 breaks, and making the 💩-fixing easy. At least that’s my mantra!
Fields in my JSON structured logs I tend to always have are:
- message
- timestamp
- log level
- source
- destination
Yours may vary based on your app and your needs, but try always having the top three from the list above.
Use Node.js Logging Frameworks
Now you’re asking yourself: “Dude WTF, you said no-console, what should I do then!?”
Yeah, you’re right. Use frameworks instead. The ones I’d suggest are:
- Winston
- Morgan
- Pino
In the section below you’ll see how to configure Winston and Morgan. With these tools, you can choose which format your logs will have, where to forward the logs, and much more.
I’ll also show you how to configure a middleware to get API-level logs and metrics for every single one of your API routes! 🤯 I actually wrote a separate blog post about that if you have the time to check it out.
Lastly, I want to walk you through how I configured logging in this open-source tool I maintain. This will show you a practical example of how I do it at work.
Enough talk, let’s write some code.
Set Up an Express.js Application
Let’s start by creating a simple Express.js app. Create a directory called logging-made-easy. Open it up and run this command in your terminal:
npm init -y
npm i express winston morgan morgan-json
Now, open the project with your favorite code editor. I use VS Code, but any will do.
Create a file called app.js and paste in this boilerplate code.
const express = require('express')
const app = express()

app.get('/', (req, res, next) => {
  res.status(200).send('Hello World!')
})

app.listen(3000, () =>
  console.log('Express.js listening on port 3000.'))
You can add in console.log or console.error statements to write logs to the stdout or stderr streams. Like this:
const express = require('express')
const app = express()

app.get('/', (req, res, next) => {
  console.log('This is the "/" route.')
  res.status(200).send('Hello World!')
})

app.get('/boom', (req, res, next) => {
  try {
    throw new Error('Wowza!')
  } catch (error) {
    console.error('Whooops! This broke with error: ', error)
    res.status(500).send('Error!')
  }
})

app.listen(3000, () =>
  console.log('Express.js listening on port 3000.'))
When you hit the “/” route you’ll see the string “This is the “/” route.” be output to the stdout. If you hit the “/boom” route, you’ll see an error instead.
Now, what’s the difference? It has to do with Linux streams. Not to bore you with details, this article explains it to you much better than I ever could.
What’s important however is that you grasp the notion of log levels! If you want to learn more about log levels, my buddy Rafal, an Solr/Elasticsearch pro, he wrote a short article about what log levels are and how they work.
In the life of a Node.js dev, you can get away with having a rough understanding of the article above and then move on to using npm log levels. Let’s go into that a bit more.
Log Levels Based on Priority
Using proper log level is one of the best practices you should follow for efficient application logging. Log levels indicate message priority. Every level is shown as an integer. I’ll be using and explaining the npm logging levels in this tutorial. They’re prioritized from 0 to 5. Where 0 is the highest, and 5 is the lowest.
- 0: error
- 1: warn
- 2: info
- 3: verbose
- 4: debug
- 5: silly
Using these log levels is a breeze with Winston. And, you guessed it, that’s what I’ll be showing now.
Use Winston for Logging
You already installed Winston above. What needs to be done now, is to add it to the code.
Start by creating another file called logger.js. Paste this snippet into the file.
const winston = require('winston')

const options = {
  file: {
    level: 'info',
    filename: './logs/app.log',
    handleExceptions: true,
    json: true,
    maxsize: 5242880, // 5MB
    maxFiles: 5,
    colorize: false,
  },
  console: {
    level: 'debug',
    handleExceptions: true,
    json: false,
    colorize: true,
  },
};

const logger = winston.createLogger({
  levels: winston.config.npm.levels,
  transports: [
    new winston.transports.File(options.file),
    new winston.transports.Console(options.console)
  ],
  exitOnError: false
})

module.exports = logger
This config will add file and console transports in the Winston configuration. Remember when I mentioned logging in different environments above? Here’s why. I wanted you to grasp the notion of being able to both output logs to the console and write them to a file, based on what tool you’re using to forward them to a central location.
Transports are a concept introduced by Winston that refer to the storage/output mechanisms used for the logs.
Winston comes with three core transports – console, file, and HTTP. I’ll explain the console and file transports in this article.
The console transport will log information to the console, and the file transport will log information to a file. Each transport definition can contain its own configuration settings such as file size, log levels, and log format.
When specifying a logging level in Winston for a particular transport, anything at that level or higher will be logged. For example, by specifying a level of info, anything at level error, warn, or info will be logged.
Log levels are specified when calling the logger, meaning we can do the following to record an error: logger.error('test error message').
Let’s move on and require the logger in the app.js, then replace all console statements with logger. Here’s what your app.js should look like now.
const express = require('express')
const app = express()
const logger = require('./logger')

app.get('/', (req, res, next) => {
  logger.debug('This is the "/" route.')
  res.status(200).send('Hello World!')
})

app.get('/boom', (req, res, next) => {
  try {
    throw new Error('Wowza!')
  } catch (error) {
    logger.error('Whooops! This broke with error: ', error)
    res.status(500).send('Error!')
  }
})

app.listen(3000, () =>
  logger.info('Express.js listening on port 3000.'))
When hitting the routes now, you’ll see logs being written in JSON format. They’re structured exactly like you want them! Error logs will have fields called error making debugging much easier.
Set Up Error Handling
Having a solid configuration for error handling is crucial in every production environment. With Express.js you can configure a middleware to catch any errors that happen so you don’t need to handle errors for every API route separately. If you want to find out more about that, read my blog post about Express.js performance best practices for running Express.js in production.
The concept of a middleware in Express.js is rather simple. They are functions with access to the req and res objects, but also a next function that passes control to the next function in the middleware chain. The official Express.js docs explain it in more detail.
Let me break it down to simpler terms though. This means you can call the next() function with the error as the parameter and handle errors down the middleware chain.
Here’s an example. Above the app.listen section of your app.js file add this piece of code.
app.get('/errorhandler', (req, res, next) => {
  try {
    throw new Error('Wowza!')
  } catch (error) {
    next(error)
  }
})

app.use(logErrors)
app.use(errorHandler)

function logErrors (err, req, res, next) {
  console.error(err.stack)
  next(err)
}
function errorHandler (err, req, res, next) {
  res.status(500).send('Error!')
}

app.listen(3000, () =>
  logger.info('Express.js listening on port 3000.'))
By calling app.use() with a function as a parameter you’ll add error handling middleware functions to the middleware chain.
Look at the new “/errorhandler” route. I’m calling the next(error) function which passes the error as a parameter to the logErrors and errorHandler functions respectively. This loosens the pressure of you having to write error handlers in every API route separately. Very convenient in my opinion.
If error handling sounds like an alien to you right now, I recommend you also check out my blog post about Node.js error handling best practices where I’m sharing tips & tricks that I’ve learned over the years while working with Node.js logs.
Use Morgan for Logging HTTP Requests
Morgan is a HTTP logger middleware for Express.js. It’s built to output HTTP logs to the console. I’ll show you how to define a stream function that will be able to get morgan-generated output into the Winston log files.
But, I won’t settle with only logging the HTTP requests. I want to have actionable metrics as well. So, I’ll show you how to configure a nice format with response times, status codes, and much more.
Start by creating a file called httpLogger.js and paste this code in it.
const morgan = require('morgan')
const json = require('morgan-json')
const format = json({
  method: ':method',
  url: ':url',
  status: ':status',
  contentLength: ':res[content-length]',
  responseTime: ':response-time'
})

const logger = require('./logger')
const httpLogger = morgan(format, {
  stream: {
    write: (message) => {
      const {
        method,
        url,
        status,
        contentLength,
        responseTime
      } = JSON.parse(message)

      logger.info('HTTP Access Log', {
        timestamp: new Date().toString(),
        method,
        url,
        status: Number(status),
        contentLength,
        responseTime: Number(responseTime)
      })
    }
  }
})

module.exports = httpLogger
Next, add the httpLogger to the app.js.
const express = require('express')
const app = express()
const logger = require('./logger')
const httpLogger = require('./httpLogger')

app.use(httpLogger)

app.get('/', (req, res, next) => {
  res.status(200).send('Hello World!')
})

app.get('/boom', (req, res, next) => {
  try {
    throw new Error('Wowza!')
  } catch (error) {
    logger.error('Whooops! This broke with error: ', error)
    res.status(500).send('Error!')
  }
})

app.get('/errorhandler', (req, res, next) => {
  try {
    throw new Error('Wowza!')
  } catch (error) {
    next(error)
  }
})

app.use(logErrors)
app.use(errorHandler)

function logErrors (err, req, res, next) {
  console.error(err.stack)
  next(err)
}
function errorHandler (err, req, res, next) {
  res.status(500).send('Error!')
}

app.listen(3000, () =>
  logger.info('Express.js listening on port 3000.'))
There we go. Hitting the API routes now will generate HTTP access logs with actionable metrics you can use when debugging issues in your production Node.js app.
{"timestamp":"Tue Nov 24 2020 15:58:01 GMT+0100 (Central European Standard Time)","method":"GET","url":"/","status":200,"contentLength":"12","responseTime":7.544,"level":"info","message":"HTTP Access Log"}
We’re getting somewhere with this logging magic, aren’t we!
This format above is what I use in one of the open-source tools I maintain. Having insight into response times and status codes is crucial when trying to find errors and debug issues. You can read this blog post to find out more about how I suggest hooking up monitoring and logging for a Node.js app in production.
I mentioned briefly the notion of logging in different environments. Whether you’re using a plain server, or running containers, the approach to logging can be different.
Logging Node.js Apps that Run on Servers
There are two ways to go about creating a nice logging setup for your Node.js app that’s running natively on a plain server.
You can either log everything to a file, that you then tail and forward to a central location, or forward the logs from the app directly.
Both of these options work with Winston. But, Morgan in this sense, is just a logging library, as it helps you format and structure your logs. While Winston is a fully-fledged log shipper. Read this article about the differences between logging libraries and log shippers, if you want to learn more.
Winston has tons of transports you can choose from.
You can pick from syslog, HTTP, or any vendor-specific transport. Here’s an example of using some common transports.
First, AWS Cloudwatch.
const winston = require('winston')
const CloudWatchTransport = require('winston-aws-cloudwatch')

const logger = winston.createLogger({
  transports: [
    new CloudWatchTransport({
      logGroupName: '...', // REQUIRED
      logStreamName: '...', // REQUIRED
      createLogGroup: true,
      createLogStream: true,
      submissionInterval: 2000,
      submissionRetryCount: 1,
      batchSize: 20,
      awsConfig: {
        accessKeyId: '...',
        secretAccessKey: '...',
        region: '...'
      },
      formatLog: item =>
        `${item.level}: ${item.message} ${JSON.stringify(item.meta)}`
    })
  ]
})
Here’s one I maintain for Sematext Logs.
const Logsene = require('winston-logsene')
const { createLogger, config } = require('winston')

const logger = createLogger({
  levels: config.npm.levels,
  transports: [
    new Logsene({
      token: process.env.LOGS_TOKEN,
      level: 'debug',
      type: 'test_logs',
      url: '<https://logsene-receiver.sematext.com/_bulk>'
    })
  ]
})
Finally, you can always rely on using the file transport.
const winston = require('winston')

const options = {
  file: {
    level: 'info',
    filename: `./logs/app.log`,
    handleExceptions: true,
    json: true,
    maxsize: 5242880, // 5MB
    maxFiles: 5,
    colorize: false,
  }
}
const logger = winston.createLogger({
  levels: winston.config.npm.levels,
  transports: [
    new winston.transports.File(options.file)
  ],
  exitOnError: false
})
In this case, you need to pick a log shipper that’ll run on the server. This shipper will collect, parse, and send the logs to whichever location you choose. It can be Sematext, Elasticsearch, CloudWatch, whatever.
From the available log shippers, I’d suggest you use:
- Vector
- Fluentbit
- Logagent
- Logstash
But, any will do, as long as you are comfortable with it. You’ll configure it to tail your log file and send its content to your location of choice.
Logging Node.js Apps that Run in Containers
If you’re running your Node.js app in a Docker container, then you should use the Console transport to output all logs to the Docker socket. What’s a Docker socket!? I explained it in more detail in this article about Docker logs location.
When logging in Docker, all logs should be written to the console. These logs are then piped through one socket. You should use a cluster level agent to listen to this socket, gather all Docker logs, and forward them to a central location.
const winston = require('winston')

const options = {
  console: {
    level: 'info',
    handleExceptions: true,
    json: true
  }
}

const logger = winston.createLogger({
  levels: winston.config.npm.levels,
  transports: [
    new winston.transports.Console(options.console)
  ],
  exitOnError: false
})

module.exports = logger
As with plain servers, choose a log shipper and run it in your cluster as a DaemonSet. This will ensure every host has a log shipper listening to the Docker socket.
Phew, that was a lot of info to digest. Let’s have a quick rest. Now’s the perfect time to go over some of the available tools you can use to store the logs.
Final Thoughts About Node.js Logging
There’s one last piece of advice I want to share. Logs are not living up to their full potential if you’re not getting alerted when shit breaks. Use a centralized logging SaaS like Sematext Logs, or whichever tool you like. We rounded up some of the best log management tools, log analysis tools, and cloud logging services if you want to check them out and see how Sematext stacks against them.
You want to see all logs across your entire infrastructure, cluster, servers, apps in one place. This will help you pinpoint issues and pivot between logs and metrics to find spikes and drill down to issues faster. This is what we’re building at Sematext. I want you to pivot between Node.js logs and metrics with two clicks.
You can pinpoint the errors with filters and fields to exclude redundant info and isolate the issues you’re looking for. Then, taking this a bit further, enable alerting when errors like these happen again. You need to know when 💩 breaks before your customers do!
If you need a central location for your logs, check out Sematext Logs. We’re pushing to open source our products and make an impact. If you’d like to try us out and monitor your Node.js applications, sign up to get a 14-day pro trial, or choose the free tier right away.

on
August 07, 2020
When visiting a new website, it is quite normal to get carried away by the bells and whistles of the fancy UI and UX and not be able to appreciate all the lower level, back-end code that runs tirelessly to ensure a smooth and fast website experience. This is because your front-end HTML code has a visually rich browser page interface as a platform to showcase its output. Whereas your back-end, server-side code usually only has a console at its disposal. The console is the only window to the execution of your back-end code. And the only way we can effectively utilize this console is by extensively, yet intelligently logging information in our application.
Logging is the practice of keeping track of events that take place over the course of your application’s life. It allows you to record important information about its execution to keep track of its correctness, accuracy, quality, and overall performance.
Logging plays an integral role throughout the whole pipeline of any software application: from development to testing to releasing for production, a well-implemented logging system allows you to understand the various aspects of your application’s performance.
In this post, we will first talk about the importance of logging in web applications and about the most common, practical use cases where it would be a good idea to implement logging. Then we will discuss how we can implement logging in Node.js: about the different levels and functions of logging, about how they work under the hood, and the different places in which we can output our logs. To understand from a real-life example, we will also create a basic Express.js based server application and set up a basic logging system in it. Since implementing an extensive, fully functional logging system can be a daunting task if you are just starting out, we will also learn to use one of the most popular third-party open-source logging frameworks for Node.js — Winston, that can ease off your burden and provide a great deal of flexibility in logging.
If you haven’t already been logging in your code, by the end of this post, you should be convinced about its importance and be able to easily implement it in your Node.js application.
Here’s an outline of what we’ll be covering in this post so you can navigate the guide or skip ahead in the tutorial:
- Why Is Node.js Logging Important?
- What and When to Log: Use Cases for Logging
- How to Log: Various Logging Methods in Node.js
- How Node.js Logging Works Under The Hood ⚙️
- Where to Log 📝
- Logging in an Express.js Server App
- Third-Party Logging Frameworks — Winston 👨🏻🔧
- Recap and Summary 🔁
Let’s get started!
Why Is Node.js Logging Important? 🖨
Logging in Programming Languages]
Before we talk about logging in Node.js based web applications, let us look into how we directly benefit from well-implemented logging systems on a daily basis. Each time you write basic code in any programming language and make an error (for example, forgetting to close a parenthesis), you are encountered by a straightforward error message. It provides information about what the error is, where it happened, and (quite often) even about how it can be fixed.
Example syntax error in Node.js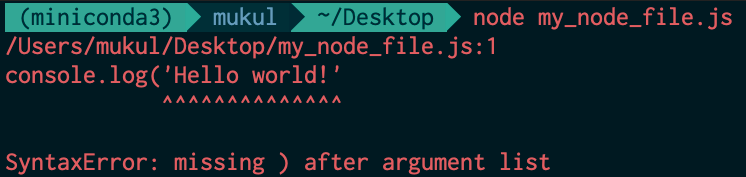
Example syntax error in Node.js
Thanks to excellent in-built logging systems in these programming languages, developers can be alerted about the weak links in their code through errors and warnings. If this wasn’t the case, it would take you ages of proof-reading your code to figure out why it didn’t output anything; you wouldn’t know about error occurrences right away, let alone where those errors happened and how they can be fixed.
[Logging in Web Applications]
If we talk about web applications, there’s a lot of work that goes behind the scenes to ensure a smooth, fast website experience. Your server needs to take care of a lot of stuff like serving web-pages, processing data, authenticating users, making API requests, performing database operations, and much more. It can be difficult to keep track of everything that’s going around in your back-end code without logging.

When developing small-scale personal projects, it, therefore, helps to log intermediate outputs, HTTP requests, responses, confirmation messages, and other information. This not only allows you to be able to understand and manage your application better but also makes debugging a whole lot easier. Similar is the case for large-scale applications where the server-side code is likely to be handling hundreds or thousands of such concurrent operations. If you don’t have appropriate logging set up, your system can seem to behave like a black box: if something goes wrong and your app fails, you will not know what happened and where it happened, thus making it difficult to make amends and get the application back on track.
Therefore, we need a way to be more in the loop as far as our application’s performance is concerned. Just like the browser web-page allows you to evaluate your front-end code, logging mechanisms enable you to receive updates and feedback information about the functioning of your back-end code.
All in all, logging in web applications allows you to be more aware of the proceedings of your code and it’s behavior. Like we discussed above, it is an integral aspect of web development across it’s complete lifecycle: from development to testing to production. During development, it allows you to quickly verify code behavior and debug small errors. During testing, it allows you to understand the failed cases, their locations, and reasons for failure. During production, it allows you to keep track of user analytics and make sense of that data. We will look at all these points in more detail in the next section.
What and When to Log: Use Cases for Logging
Now that we are fairly convinced about the importance of logging in our application, let us look at some use case scenarios in which logging can be extremely useful.
Quick debugging and verifying code behavior 🧼
When writing code, it can be helpful to keep track of its progress by intermittently logging the relevant output. This allows you to verify your application’s behavior and make sure that it is working as expected, at least during the development stage.
This can also help in exposing small mistakes in your code that can easily be debugged, thanks to intelligent log messages that can guide you to the part of the code where the error was localized.
By logging information and recording the progress at each significant intermediate checkpoint of our application, we can reduce the chances of letting through trivial bugs in our code during the preliminary stages of development.
Logging server requests and responses 🌐
Servers are constantly communicating over the internet through HTTP requests and responses. Messages carried over by these requests contain some information about (and from) the requester (your front-end code or some other server on the internet), like the HTTP method (GET, PUT, POST, etc), message body, content type, content length, requester’s remote IP address, timestamp and so much more. These requests can be easily decoded by web frameworks, allowing us to process its data and deal with it in our own way.
When your server receives this request packet, it can be useful to log its contents and take a glance at it. As we saw above, there are a bunch of items in the request object; but you might be interested in only a few of those. You can cherry-pick the ones relevant to your application and log them for each request to your server. You can also similarly log the response object generated by your server for each request when it is sent back. This allows you to inspect all the incoming requests and corresponding outgoing responses in real-time. This can make debugging HTTP data exchange a whole lot easier.
Later in the post, we will also look at some examples of logging server requests in Node.js.
Logging During Testing 🔬
Testing plays a very important role in the web development pipeline. It allows you to foolproof your code in a time-saving, automated, and therefore, more reliable way.
During testing, logging is a must because you need to log information about test suites, about each of its test cases, whether they passed or not, about expected values and about relevant warnings and error messages. These logs are also used to capture extra information like code coverage, speed performance, and the overall time taken. All testing frameworks (eg. Mocha, Jest) come equipped with in-built loggers that systematically output this information in an easily readable format.
Since most of us rely on efficient in-built or third-party libraries to carry out these tests, we can rest assured that they are capable of recording all the relevant information about our tests.

As you can see in the above example of test output, everything important related to your tests has been cleanly logged. This goes to show how useful a well-implemented logging system can be for getting a bird’s eye view of your application’s functioning and it’s code.
Analytics/diagnostics information about web app 📈 📊
For teams working on large-scale applications that are running in production, one of the main goals is to improve the user’s experience. For improving their products or services to better suit their customers’ needs, these teams need to better understand how their users interact with the application: about which pages or features are most commonly used, about the most commonly performed actions, etc. Besides, there should also be a focus on keeping track of the diagnostics data — about performance metrics, quality issues, bottlenecks, common errors, etc. and use that information to make the necessary changes and improvements.
Understanding both these aspects of your app’s performance requires a robust, well-implemented logging system that can effectively present coherent analytics and diagnostics information about your app. These logs can provide valuable insights about how your app is performing and how it can be improved. It can help you to direct your efforts towards improving the most important parts of your app, and therefore boost overall productivity.
You can take this to the next level by using proficient application monitoring (APM) tools like ScoutAPM to constructively analyze and optimize your website’s performance. ScoutAPM gives you real-time insight so you can quickly pinpoint & resolve issues before the customer ever sees them.
One more thing to note here about the advantages of logging is that it can benefit everyone in the team and not just web developers. Just like developers can glean debugging cues and benefit from lower-level jargony logs, project managers can make better sense of the higher-level telemetry-based analytics’ logs that give a bird’s eye view of the most used features and about how that information could be used to plan future updates and releases.
Now that we have a fair understanding of the very many use cases and advantages of logging, let’s dive into the implementation part of it, and look at how we can log stuff in Node.js.
How to Log: Various Logging Methods in Node.js 🧰
The most common way of logging in Node.js is by using the console.log() method.
console.log([data][, ...args])As the object and function name reads, it logs the message to your console. This is the easiest method to get started with logging.
Let’s see how it works with a very basic example.
// my_node_file.js
var world_emoji = "🌎";
console.log("Hello world", world_emoji);
OUTPUT:

Node.js ships with certain variants of console.log() that we’d like to be familiar with. They can be divided into two types —
For logging general information and debugging —
console.log()console.info()console.debug()
For errors and warnings ⚠️ —
console.error()console.warn()
As their names suggest, these functions can be used for various purposes, depending on the type and severity (level) of the information to be logged.
However, if you use and compare both the console.log() and console.error() functions, you will notice that these functions work in the same way (at least) in the output they produce. Let’s see this in action through an example —
//my_node_file.js
console.log("Hello log!")
console.error("Hello error!")
OUTPUT:
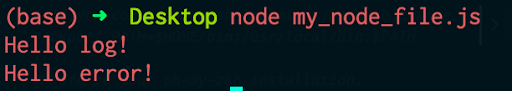
As you can see, there is no visible difference in the way these two functions display the log messages. Both the aforementioned set of functions (general logging-based and error-based) are, therefore, similar for the most part, except for two notable differences —
- If you prefer these logging functions to output the information differently, you can run them directly in the browser’s console or through your website’s Javascript code. This provides some fancy text-color highlighting that makes it visually easier to differentiate between the different logging levels. Additionally, the browser console also allows you to filter the log messages based on their level.
Logging in browser console
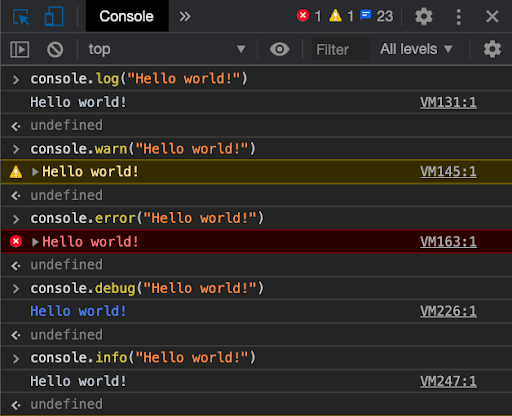
2. Understanding the second difference between general purpose and error-based logging functions requires an understanding of how these functions work under the hood. Let’s look at that in the next section.
How Node.js Logging Works Under The Hood ⚙️
If you are familiar with Node.js, you might know what streams are. For those of you who don’t know, streams in Node.js are objects that allow you to handle your data-read and write operations in a sequential manner. Instead of reading or writing the data all at once, these operations are performed piece by piece, in small chunks.
Processes in Node.js have access to three such streams — stdin, stdout, and stderr. As the name suggests, the stdin stream is for dealing with the input to the process (example — keyboard or mouse input). On the other hand, stdout and stderr are output streams for writing the output to the console or a separate file. The stderr stream has been reserved exclusively for error messages and warnings.
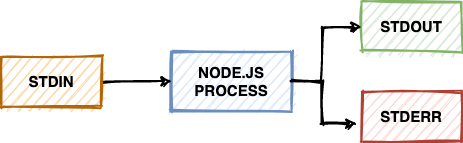
stdin, stdout and stderr streams
When you use the general-purpose logging methods — console.log(), console.info(), and console.debug(), they output to the conventional stdout stream. Whereas if you use the error and warning based methods — console.error() and console.warning(), they output to the stderr stream.
The design decision behind having two separate streams for different kinds of logs has benefited developers a lot. Thanks to it, we can maintain our logs more cleanly by keeping the general logs separate and clear from the error and warning logs. Even though sometimes we might want these logs to be in one place (for example, when we are interested in the events’ sequence of occurrence), having the flexibility to be able to segregate these logs based on their type always comes in handy.
We will see how we can take advantage of these two separate streams for better logs’ maintenance in the next section.
Where to Log 📝
When we run a node application from our command line, using node my_node_file.js, the logs are by default output to the command line itself. We saw this in one of the previous examples as well.
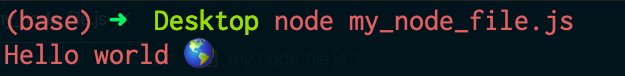
This might be helpful when you want to view the log messages in real-time.
But for most large-scale applications, where your server is concurrently catering to hundreds or thousands of requests, it becomes humanly impossible to keep track of the raw log messages as they inundate your CLIs. It is therefore considered to be a good practice to store your logs in separate files. This is a much more viable alternative as it makes it easier to maintain these records and therefore simplifies the process of monitoring and analyzing your application’s overall performance.
Let’s see how we can store the logged outputs to specific files instead of having them printed on the command line. Here is our Node.js file —
// my_node_file.js
var world_emoji = "🌎";
console.log("Hello world", world_emoji);
console.error("Hello world error ⚠️");
Now if we want to output our message to a specific log file, we need to use the redirect operator ‘ > ’ when we run the file, as shown below —
node my_node_file.js > my_log.log
OUTPUT:
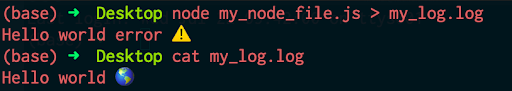
As you can see, our console.log() message was logged to the specified file. The thing to note here is that the console.error() message was not logged to that file. Instead, it was printed on the command line.
The reason for this is that the redirect operator ‘ > ’ is only used to redirect the stdout stream’s output (from the console.log() function) to a file. As a result, the stderr stream’s output (from the console.error() function) was not redirected to this file.
If we want to record the error logs in a file, we need to use the ‘ 2> ’ operator for capturing the stderr stream output to the file. If we were to capture both the log types in the previous example, we can use the command shown below —
node my_node_file.js > my_log.log 2> my_error_log.logOUTPUT:
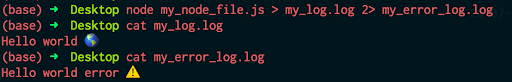
We can see how the above log messages were recorded in separate files.
As we discussed above, this differentiation allows us to maintain and process our general logs and error logs separately.
Now that we know quite a bit about the ‘how’, ‘what’, ‘where’ and ‘when’ of logging, let us write some server-side code in Node.js and learn by logging a few things for a dummy back-end application.
Logging in an Express.js Server App
Express.js is the most popular web application framework for Node.js. It is light-weight, robust, and provides a simple, minimal interface to easily get started with writing server-side code for your application. In this section, we’ll create a basic server and learn by logging a few things.
Let us first get a basic Express.js server up and running. To get started you can initialize an npm project and install Express.js (and other) dependencies using the following commands —
npm init # initialise npm project
npm install --save express # install Express.js dependencies
Then we can create a file index.js and write the following code to start the server.
// index.js
var express = require('express'); // importing library
var app = express(); // initialising app
var PORT = 3000; // server port

app.get('/', function(req, res){ // dummy GET route
  res.send("Hello world! 🌎");
});

app.listen(PORT, () => { // start server
  console.log('Server running on port %d! 🚨', PORT);
});
OUTPUT: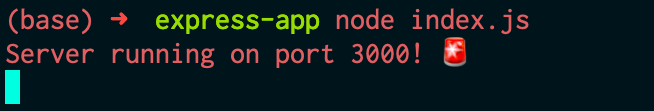
Server output
As you can see, we are able to successfully log that the server has been started. This is one of the most basic things that we can log in to our application.
For the intrepid developer, Express.js also exposes certain additional lower-level log messages that can be helpful for debugging and understanding how the server runs under the hood. As per their documentation, we can get access to this additional information by using the following command —
DEBUG=express:* node index.js
Side note: This is made possible thanks to the renowned npm debug package.
OUTPUT:
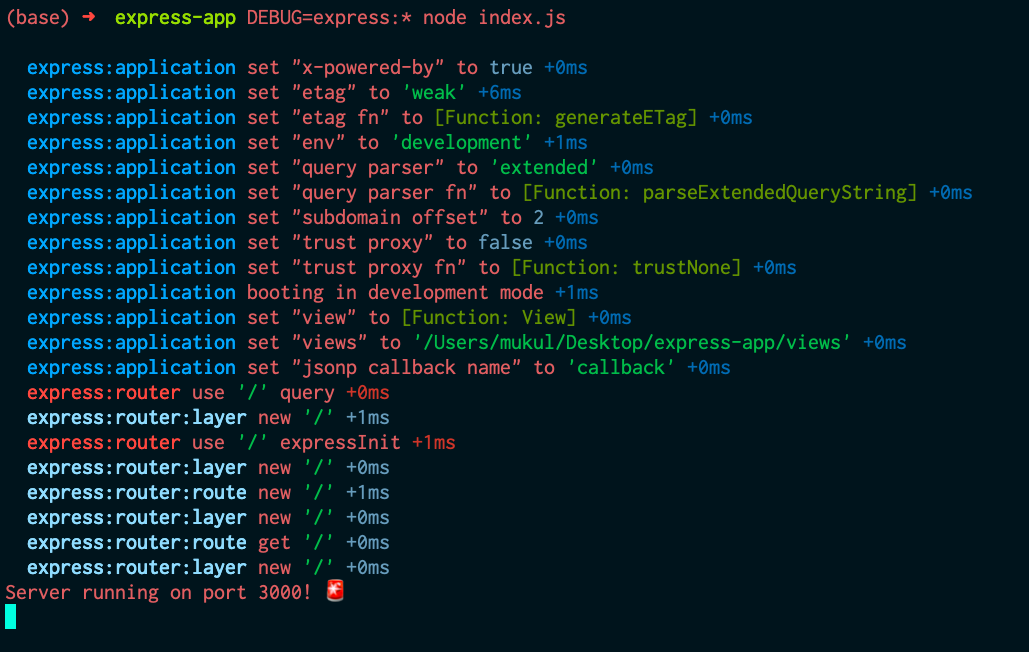
This output is just a glimpse of everything that goes behind the scenes when you start your server. All this extra information is only required if you want to get into the lower-level specifics of how things work. So, for most cases, we can turn this off and proceed with the conventional approach.
Coming back to the basic Express.js code we wrote — let’s try to make some requests to our server and log them from our code. As you can see in our code, we have also created a simple GET route (‘/’) in our server. Now to it’s handler function, let’s add some code for logging the request object.
app.get('/', function(req, res){ // dummy GET route
  console.log(req);
  res.send("Hello world! 🌎");
});
Now restart your server for the changes to take effect.
When you visit the ‘/’ route of your server ( localhost:3000 ), your server will log the whole request object to the console.
OUTPUT:
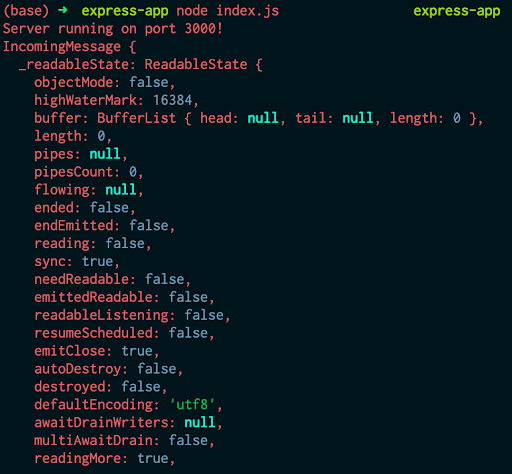
What has been shown above is only a very small snippet of the whole output. As you can see, most of the information here is not useful for us. We might be interested in deconstructing this object and logging a more relevant subset of this that contains information about —
- Request headers
- Request query params
- Request path (or route)
- Timestamp
Let’s see how we can naively log these from our handler function.
app.get('/', function(req, res){ // dummy GET route

  var timestamp = new Date(); // getting current timestamp

  console.log('Timestamp:', timestamp);
  console.log('Request Headers:', req.headers);
  console.log('Request Query Params:', req.query); // for all query params
  console.log('Request Path:', req.path);
  console.log('Request Route:', req.route);
  res.send("Hello world! 🌎");

});
Now we’ll create a dummy request (with params) from our browser to localhost:3000/?happy=😊&cat=🐈 and see what the server logs.
OUTPUT:
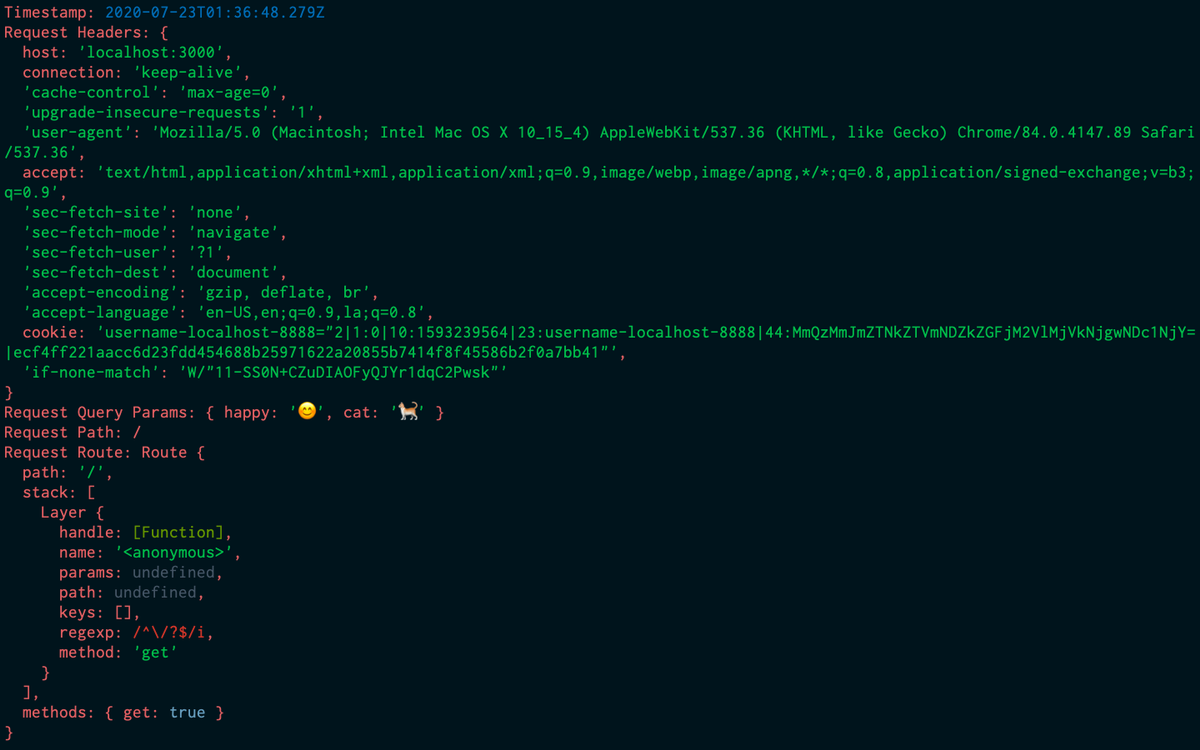
As you can see, we were able to successfully log the request parameters. We can also write this information to specific log files using the redirect operators ( ‘>’ and ‘2>’) as we discussed above.
This was just an example of logging some of the items that we can extract from the request object. In many cases, we might want to log fewer (or different) items for our application.
As I hinted before, this is a slightly naive way of logging things. There are much more functionality and convenience that we can benefit from by plugging third party solutions into our code. Now we will look at a renowned open-source third-party logging framework — Winston, and how it can make our life easier in the next section.
Third-Party Logging Frameworks — Winston 👨🏻🔧
One of the most popular logging frameworks for Node.js is Winston. It provides a simple API that makes the overall logging process more extensible and flexible.
Primarily, it allows you to configure multiple transports for redirecting logs to various sources. This can be very helpful if you want to record different levels of logs with different settings in different places. For instance, you might want a specific preset for your error logs — eg. for them to be in JSON format, formatted with timestamps, stored in separate files on some remote server; whereas you might want to deal with your general logs differently — eg. to output them to the CLI or redirect them to some local file with certain additional information. You can read more about transports in Winston here.
This multi-transport feature is quite easy to set up in Winston. Let’s first install Winston in our npm project using-
npm install --save winston
Now let’s see how we can initialize our Winston logger, configure it with the various options available, and log some stuff. We’ll break down the code for easier understanding —
// index.js
var express = require('express'); // importing library
var app = express(); // initialising app
var PORT = 3000; // server port

const winston = require('winston') // importing library
const format = winston.format // initialising for configuring log format options
Here, we import the Winston library and also initialize the format object that will be used to configure the formatting options for our log messages later
const consoleTransport = new winston.transports.Console(); // initialising console transport - for redirecting log output to console


const errorLogsFileTransport = new winston.transports.File({ filename: 'error.log', level: 'error' }); // initialising file transport for error logs


const allLogsFileTransport = new winston.transports.File({ filename: 'all_logs.log', level: 'info' }); // initialising file transport for all logs
Here, we initialize our transport targets (or destinations) that will take care of which logs should be stored where. First, we initialize the console transport, for logging to the console. Then we initialize file transports that will be used for storing different levels of logs in different files.
Note: When we initialize allLogsFileTransport using ‘info’ as the level, it allows all logs below the ‘info’ level to be stored in the specified file. This is why logs stored in all_logs.log also include ‘error’ and other level logs. You can read more about logging levels in Winston here.
Moving on,
const myWinstonOptions = { // defining configuration options for logger

  format: format.combine( // combining multiple format options

     format.timestamp({
       format: 'YYYY-MM-DD HH:mm:ss' // for adding timestamp to log
     }),

     format.label({ label: 'My label 🏷' }), // for labelling log message

     format.prettyPrint(), // for pretty printing log output
  ),

  transports: [consoleTransport, errorLogsFileTransport, allLogsFileTransport] // transport objects to be used
}
Here, we define the format and transport options that we will be using for our logger, which is to be initialized next.
const logger = new winston.createLogger(myWinstonOptions); // initialising logger

app.get('/', function(req, res){ // dummy GET route

  logger.info(req.query) // logging request's query params
  logger.error(new Error("Hello error ❌")) // logging arbitrary error
  res.send("Hello world! 🌎");

});

app.listen(PORT, () => { // start server
console.log('Server running on port %d! 🚨', PORT);
});
After defining all the configurations, we finally initialize our logger and log two types of messages in the route handler function.
Now based on our configurations, both the logs should appear in our console and in the all_logs.log file. Also, the error log should be written to the error.log file.
OUTPUT:
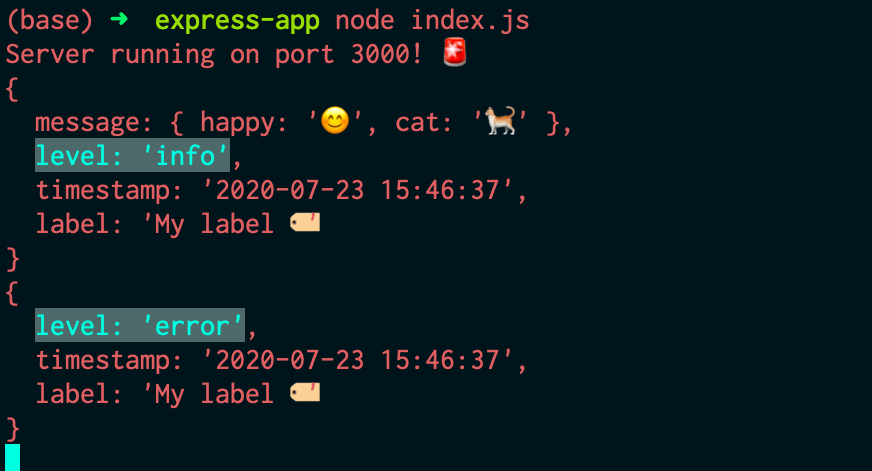
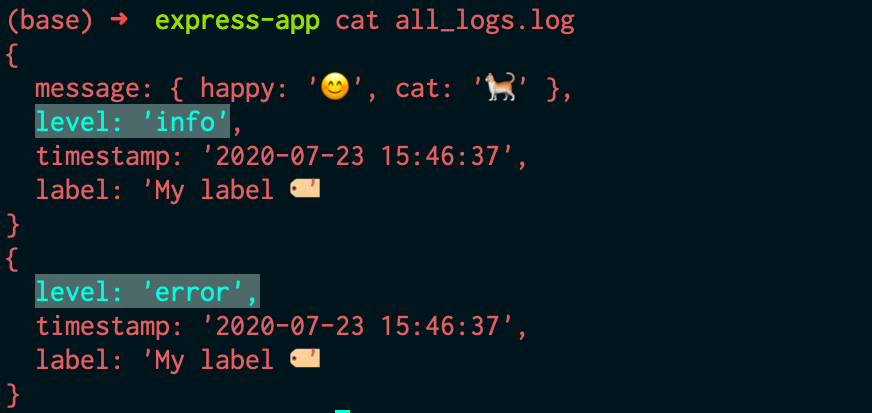
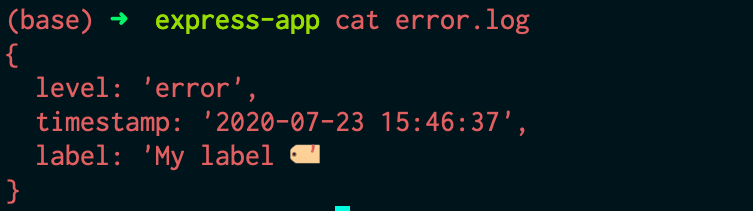
Thanks to Winston, you can see how easy and systematic it is to maintain these logs in an organized fashion. There’s a lot of extra functionality that Winston offers, like color formatting, child loggers, custom transports, exception handling, and much more. You can learn more about Winston and it features from their documentation here.
Here are some other popular logging frameworks for Node.js that you can also check out —
- Bunyan
- Morgan
- Node-Loggly (also from the developers of Winston)
Recap and Summary 🔁
In this post, we started by discussing the importance of logging in your applications: about how much we owe to good logging systems that benefit us every day. To understand more about the applications of logging and why it is useful, we also looked at four common, prevalent use case scenarios that extensively involve or benefit from logging. After being convinced about the advantages of logging in general, we then segued into the more implementation-based part of logging. We first learned about the various functions in Node.js’s console logging toolkit — about the general logging functions and the error/warning logging functions. We also discussed the difference between those two through an understanding of how logging in Node.js works under the hood. We then looked at the two redirect operators (‘>’ and ‘2>’) that allow us to write the log messages to separate log files.
To solidify our understanding of these concepts, we also created a basic Express.js server app and played around with logging the request object. Towards the end, we also looked at one of the most common Node.js logging frameworks, Winston, and implemented a basic Winston logger in our server to witness the ease, functionality, and flexibility it brought to the table.
Now that you know almost everything about logging in Node.js, go ahead and start logging in your application! Good luck!
Stay healthy, stay safe, and keep learning! Happy coding!
Did you find this article helpful or see something you disagree with or think should be improved? Please let us know, we value your feedback!
Editor’s note: This article was updated on 14 April 2022 to reflect the most recent information for Node.js logging best practices, including information about Pino and Bunyan and health monitoring tools.
Logging is one of the most important and useful steps a developer can take when working in Node.js. In fact, it’s one of the most useful steps a developer can take regardless of their runtime environment! Logging helps developers know what it is that their code is actually doing, and can help developers save hours of debugging work.
One of the key purposes of logging is to save information about each flow or runtime. This is the same information that a developer uses to understand their application. For example, if there is a bug in the database section of an app, a log will point to where the failure takes place, helping you to identify the cause of the problem.
In this article, we’ll cover some of the best practices for logging in Node.js and see why logging is a good idea. I will also share my recommendations for the best monitoring tools for Node.js applications.
Jump ahead:
- Start with
console.log - Move to a log library
- Winston
- Pino
- Bunyan
- Log HTTP requests in Node with Morgan
- Configure Winston with Morgan
- Define log levels
- Use logs with a log management system
- Health monitoring tools
What data should be logged?
Before we review best practices for logging in Node, it’s important to remember that not all information should be logged. For example, personal data, like user information, and delicate data, like passwords and credit card information, should not be logged. Also worth noting is that the tool you use to log is far less important than your approach to logging.
In the following sections, we will explain the most effective approaches as a part of logging best practices in Node.js.
Start with console.log
Some would argue that it should be regular practice when building a side project to have console.log around your applications. Other console methods include console.group, console.info, and less common methods like console.error:
console.error('Error!');
When running console.log, you may notice a negligible decrease in performance. To avoid negatively impacting performance, I recommend switching to a logging library when your project begins to expand.
Move to a log library
Logging libraries help developers create and manage log events, which can increase the overall efficiency and functionality of your application. Some of the most popular logging libraries for Node are Winston, Pino, Bunyan, and Log4js.
While you should almost always use a standard console.log, a logging library can be more functional and help avoid decreases in app performance.
Winston
If you want to store your error log in a remote location or separate database, Winston might be the best choice because it supports multiple transports. Alternatively, Log4js supports log streams, like logging to a console, and log aggregators like Loggly (using an appender).
Below is an example of how to set up a logging library using Winston:
const winston = require('winston');
const config = require('./config');

const enumerateErrorFormat = winston.format((info) => {
  if (info instanceof Error) {
    Object.assign(info, { message: info.stack });
  }
  return info;
});

const logger = winston.createLogger({
  level: config.env === 'development' ? 'debug' : 'info',
  format: winston.format.combine(
    enumerateErrorFormat(),
    config.env === 'development' ? winston.format.colorize() : winston.format.uncolorize(),
    winston.format.splat(),
    winston.format.printf(({ level, message }) => `${level}: ${message}`)
  ),
  transports: [
    new winston.transports.Console({
      stderrLevels: ['error'],
    }),
  ],
});

module.exports = logger;
Pino
This logging library is very popular for its low overhead and minimalism. It uses less resources for logging by using a worker thread for processing.
const pino = require('pino');

// Create a logging instance
const logger = pino({
level: process.env.NODE_ENV === 'production' ? 'info' : 'debug',
});


logger.info('Application started!');
Using Pino with web frameworks has recently been made easier. For example, Fastify comes with Pino by default, and others have a specific library for Pino. For more information on how to use Pino, refer to this article.
Bunyan
Bunyan is another fast JSON logging library that supports multiple transports and uses a CLI for filtering the logs. It has a refined method that produces what they should do. My favorite feature about Bunyan is the log snooping, which helps in debugging failures in production.
const bunyan = require('bunyan');
const log = bunyan.createLogger({name: 'myapp'});
log.info('My App');


{"name":"myapp","hostname":"banana.local","pid":40161,"level":30,"msg":"My App","time":"2022-04-04T18:24:23.851Z","v":0}
Other cool features of Bunyan are a stream system for controlling where logs are located, support for environments aside from Node.js, and that JSON objects are serialized by default.
Log HTTP requests in Node with Morgan
Another best practice is to log your HTTP request in your Node.js application. One of the most used tools to accomplish this is Morgan, which gets the server logs and systematizes them to make them more readable.
To use Morgan, simply set the format string:
const morgan = require('morgan');
app.use(morgan('dev'));
For reference, the predefined format string is:
morgan('tiny')
Below is the expected output:
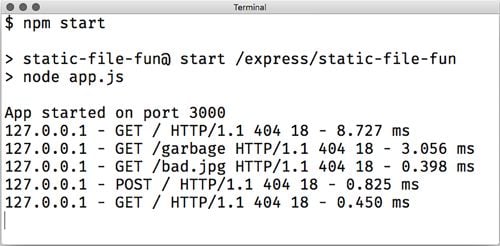
Configure Winston with Morgan
If you choose to use the Winston library, then you can easily configure with Morgan:
const morgan = require('morgan');
const config = require('./config');
const logger = require('./logger');

morgan.token('message', (req, res) => res.locals.errorMessage || '');

const getIpFormat = () => (config.env === 'production' ? ':remote-addr - ' : '');
const successResponseFormat = `${getIpFormat()}:method :url :status - :response-time ms`;
const errorResponseFormat = `${getIpFormat()}:method :url :status - :response-time ms - message: :message`;

const successHandler = morgan(successResponseFormat, {
  skip: (req, res) => res.statusCode >= 400,
  stream: { write: (message) => logger.info(message.trim()) },
});

const errorHandler = morgan(errorResponseFormat, {
  skip: (req, res) => res.statusCode < 400,
  stream: { write: (message) => logger.error(message.trim()) },
});

module.exports = {
  successHandler,
  errorHandler,
};
As you can see in the above example, to configure Winston with Morgan, you just have to set up Winston to pass the output of Morgan back to it.
Define log levels
Before embarking on a build with your development team, it is very important to define your log levels in order to differentiate between log events. Managing log events in an orderly and consistent manner makes it easier to get necessary information at a glance.
There are several log levels and it is important to know them and their uses. Each log level gives a rough direction about the importance and urgency of the message:
- Error: important events that will cause the program execution to fail
- Warn: crucial events that should be noticed to prevent fails
- Info: important events that detail a completed task
- Debug: mostly used by developers
The developer should be able to see a detailed event and determine if it should be fixed immediately.
Use logs with a log management system
Depending on how big your application is, it may be helpful to pull the logs out of your application and manage them separately using a log management system.
Log management systems allow you to track and analyze logs as they happen in real time, which in turn can help improve your code. As you can see in the example below, a log management system can help you keep track of useful data including backend errors, anomalies, log sources, and production errors.
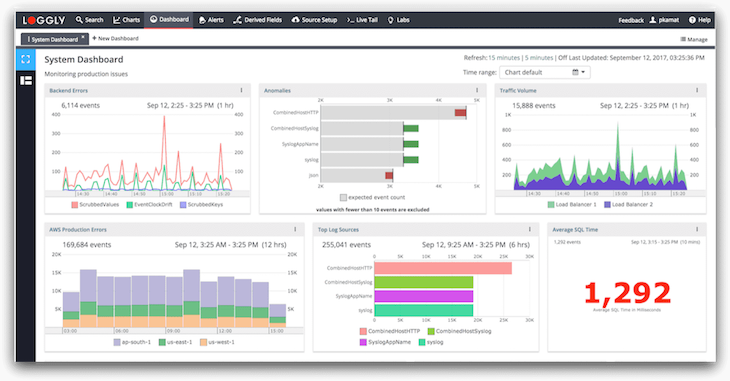
For log analysis and log management tools, I recommend Sentry, Loggly, McAfee Enterprise, Graylog, Splunk, Logmatic (acquired by Datadog at the time of writing), or Logstash.
Health monitoring tools are a good way to keep track of your server performance and identify causes of application crashes or downtime. Most health monitoring tools offer error tracking as well as alerts and general performance monitoring. Some developers find error tracking particularly frustrating in Node.js, so using a health monitoring tool can help alleviate some of those difficulties.
Below are few popular monitoring tools for Node.js:
- PM2
- Sematext
- App Metrics
- ClinicJS
- AppSignal
- Express Status Monitor
Conclusion
In this article, we looked at how important logging is and how it can help developers better understand their applications. We also discussed logging best practices in Node.js, including using a log library, logging HTTP requests, defining log levels, and using a log management system.
A few of the popular logging libraries like Winston, Pino, and Bunyan are actually fair to work with and lightweight meaning that they won’t be a bottleneck on your Node.js application.
While no infrastructure is completely safe or entirely error free, logging is a necessary step for developers who want to monitor production and cut down on errors.
More great articles from LogRocket:
- Don’t miss a moment with The Replay, a curated newsletter from LogRocket
- Learn how LogRocket’s Galileo cuts through the noise to proactively resolve issues in your app
- Use React’s useEffect to optimize your application’s performance
- Switch between multiple versions of Node
- Discover how to animate your React app with AnimXYZ
- Explore Tauri, a new framework for building binaries
- Compare NestJS vs. Express.js
Logging can also be useful for other team members including QA, Support, and new programmers, as it saves valuable information to learn from and build on.
200’s only  Monitor failed and slow network requests in production
 Monitor failed and slow network requests in production
 Deploying a Node-based web app or website is the easy part. Making sure your Node instance continues to serve resources to your app is where things get tougher. If you’re interested in ensuring requests to the backend or third party services are successful, try LogRocket. 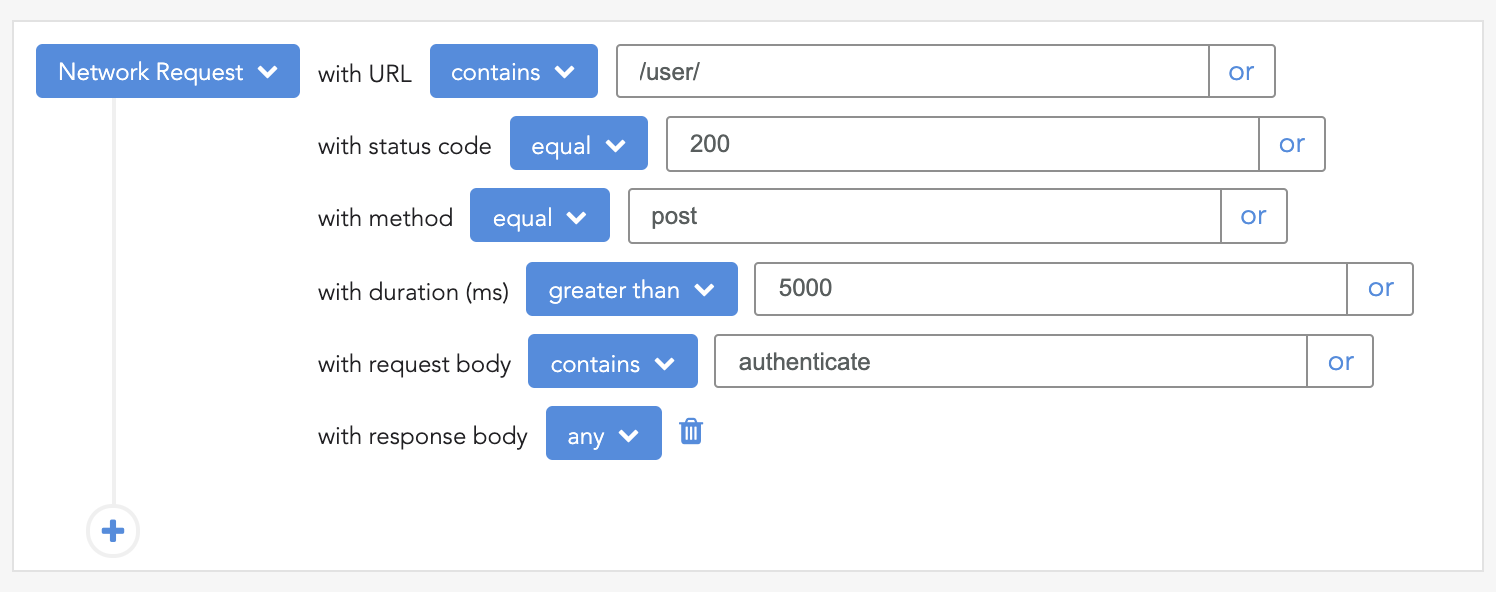 https://logrocket.com/signup/
LogRocket is like a DVR for web and mobile apps, recording literally everything that happens while a user interacts with your app. Instead of guessing why problems happen, you can aggregate and report on problematic network requests to quickly understand the root cause.
LogRocket instruments your app to record baseline performance timings such as page load time, time to first byte, slow network requests, and also logs Redux, NgRx, and Vuex actions/state. Start monitoring for free.
Logging helps developers in reducing errors and cyber-attacks. The application is designed to be dynamic. We can’t always predict how an application will react to data changes, errors, or program changes. Logging in allows us to better understand our own programs.
For all applications, an absolute logging solution is essential. A good logging system increases the application’s stability and makes it easier to maintain on the production server. Application logging is the process of gathering information about your program’s execution time.
When a user has an issue, you have no way of knowing what went wrong. You can only hope to contact the user who had the issue and have them tell you what happened.
As you can see, this is a bad strategy. This article focuses on some of the most important aspects of Node.js logging:
- What is Log?
- Why Logging is Important?
- Log Levels
- Where should I Log?
- Best Practices for Node.js Logging
What is Log?
Logs are events that reflect many characteristics of your application; if created correctly by the team, they are the simplest means of troubleshooting and diagnosing your application.
Debugging is done with logs by operations engineers and developers. Logs are used by product managers and UX designers to plan and develop. Marketers want to know how well various components related to advertising campaigns are doing.
Anyone with a stake in the company can benefit from the information provided by logs. However, you won’t appreciate the worth of your logs until they’ve been properly evaluated. And in order to do so, we’ll need to keep track of the correct data.
Why Logging is Important?
Previously, logging was seen as a low-priority task. People did not put forth much effort into creating significant logs. Logs, on the other hand, have become a useful piece of information as a result of technological advancements in machine learning and artificial intelligence.
Logs can be used to analyse user behaviour and the application’s general health. It analyses the major components of your application to improve performance. Measures crucial metrics including the number of errors or warnings logged, as well as your application’s overall availability.
Furthermore, logs assist you in comprehending what is occurring within your application. What happened is documented in your logs. This data is helpful if something goes wrong and you need to troubleshoot an issue. As a developer, the first thing you should do is look through the logs to determine what happened leading up to the issue. You’ll be able to see exactly what actions lead to the problem if you do it this way.
When debugging your application, logs are quite useful. Additionally, technical advances such as trend analysis enable your company to spot anomalies by examining logs, allowing it to go from reactive to proactive monitoring. You can limit the number of errors since you can correct them before they affect the user.
Log Levels
One of the best practices for efficient application logging is to use the right log level. The priority of communication is indicated by its log level. Each level is represented by an integer.
RFC5424 specifies the severity of logging levels. A decimal severity level indicator is included with each message priority. These, along with their numerical values, are included in the table below. The severity values must be between 0 and 7, inclusive.
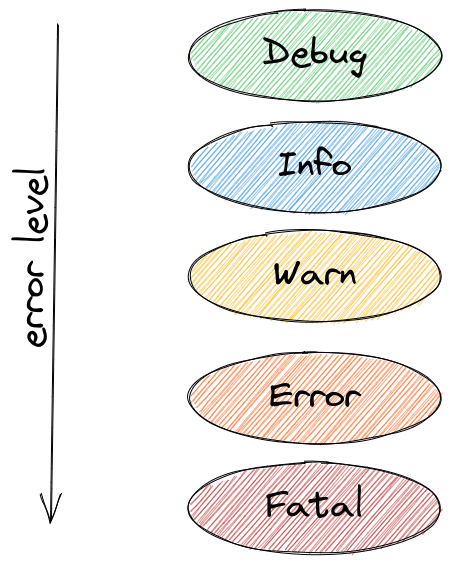
- Code 0 (Emergency): the system is unusable
- Code 1 (Alert): action must be taken immediately
- Code 2 (Critical): critical conditions
- Code 3 (Error): error conditions
- Code 4 (Warning): warning conditions
- Code 5 (Notice): normal but significant condition
- Code 6 (Informational): informational messages
- Code 7 (Debug): debug-level messages
Each log level indicates the importance and urgency of the message in general. Let’s take a look at the most significant levels and how they’re used:
- ERROR
Something went wrong, and it needs to be looked at right away. For example, if the database is down, or if communication with other microservices has failed, or if the required input is unknown. System operators and monitoring systems are the key target audiences. - WARNING
These logs are warnings that do not prevent the application from continuing; they serve as notifications when something goes wrong and a workaround is used. For example, incorrect user input, retries, and so on. These warnings should be fixed by the administrators in the future. - INFORMATIONAL
Some critical messages, such as event messages that indicate when a task is completed. Consider the following scenario: «New User created with id xyz». This is the only way to keep track of progress logs. - DEBUG
This level is for developers; it’s akin to logging the information you see while using a debugger or a breakpoint, such as which function was called and which parameters were supplied, and so on. It should have the current condition so that debugging and pinpointing the issue is easier.
A developer should be able to look at a detailed event and assess whether it needs to be fixed right away.
Where should I Log?
An event source pattern is an excellent example of loose coupling. An event source pattern is frequently used in a microservices architecture. It consists of a number of services that place events on a bus or in a line. Independent processes “listening” to the queue can reply to those events.
Log events are different kinds of events that can be queued. Multiple listeners can each listen to the queue and write to their own log. With this level of adaptability comes an increased level of complexity. We frequently only register a single logger to the log call. There are several options, but anything we use for logging must be able to handle the volume of log messages.
Some of the most common log locations are listed here.
1. console or stdout/stderr
The basic console.log and console.info functions in Node.js will log to stdout. stderr is where console.warn and console.error are written. These will print the output to your console by default. This will be the developer tools console on the front end. This is generally sufficient for running your Node.js backend locally.
2. Log File
If you’ve already used the console everywhere, you can route stdout and stderr to a file without touching your code. This is accomplished by using the standard redirect when launching your application:
node project.js > project.log 2>&1This will send stdout to a file named project.log and stderr to stdout.
When would you use a file to log to?
In most cases, logging to persistent storage is preferable in production. The simplest approach to store logs is in a file. It isn’t, however, the finest long-term option.
You might wish to log into your file system when you’re running locally. When you have numerous processes running at the same time, this can be useful. It’s possible that they’re in distinct containers.
When you have a process that spans numerous processes, such as a workflow, you’ll want to bring all the logs together in either case. It will make the analysis go more smoothly. You don’t want to have to switch back and forth between different log outputs to connect the dots.
3. Log Management Tools
The ideal way to log-structured events is to send them to a log management tool. Structured logging makes data easier to correlate, find patterns, and use. Querying the data is more efficient when the logs are stored in a centralized logging database — specifically, one designed for the purpose.
Here are some log management tools that we suggest for logging:
- Atatus
- Loggly
- PaperTrail
- Sumo Logic
- Splunk
- GrayLog
- LogDNA
Best Practices for Node.js Logging
Node.js logging can be done in a variety of ways. To improve logging, we can use the built-in features or one of the many popular packages. The best method for logging is to pipe stdout and stderr to your desired log destination. Because debug, the main logger in node js, writes directly to process.stdout and process.stderr, this is the case.
We’ll go over the most successful techniques as part of Node.js logging best practices in the sections below.
#1 Begin with console.log
Console.log is the original node.js logging technique. console.error, console.info, and console.warn are some of the versions. Those are just extra methods on top of the main function, which is:
console.log(level, message)You can write to console.log, but outside the code, you have limited control over where things log.
If you run console.log, you may notice a slight slowdown in performance. When your project grows larger, I recommend moving to a logging library to avoid performance issues.
#2 Move to Log Library
Logging libraries assist developers in creating and managing log events, which can improve your application’s overall efficiency and effectiveness. Winston, Bunyan, and Log4js are three of the most popular logging libraries for Node.
Comparison of Logging Libraries
We’ll go through the most significant features of three logging libraries in this section: Winston, Bunyan, and Log4js.
- Winston Logging
Winston is a universal logging library that allows logs to be stored in several locations. It lets you store certain log levels in a remote location. The remaining logs can be saved somewhere else, such as a database. This handy feature lets you send higher-level logs to a log aggregation tool while storing lower-level logs in a database or file storage. - Bunyan Logging
Bunyan is also a logging library with a lot of features. Bunyan, like Winston, allows you to customize your transportation options. - Log4js Logging
Log4js is a fork of the well-known Java logger Log4j. The package isn’t as well-known as Winston or Bunyan, but it still has some unique features. Developers can use Log4js to log to the console, a file, or a log aggregator through a TCP connection.
Winston may be the ideal option if you wish to store your error log in a distant place or separate database because it supports multiple modes of transport. Bunyan also has a CLI for filtering and supports several modes of transport. Alternatively, Log4js offers log streams and log aggregators, such as logging to a console.
Here’s an example of how to use Winston to build up a logging library:
const winston = require('winston');
const config = require('./config');
const enumerateErrorFormat = winston.format((info) => {
    if (info instanceof Error) {
        Object.assign(info, {
            message: info.stack
        });
    }
    return info;
});
const logger = winston.createLogger({
    level: config.env === 'development' ? 'debug' : 'info',
    format: winston.format.combine(
        enumerateErrorFormat(),
        config.env === 'development' ? winston.format.colorize() : winston.format.uncolorize(),
        winston.format.splat(),
        winston.format.printf(({
            level,
            message
        }) => `${level}: ${message}`)
    ),
    transports: [
        new winston.transports.Console({
            stderrLevels: ['error'],
        }),
    ],
});
module.exports = logger;
The point is that, while a standard console.log should nearly always be used, a logging library can be more useful and helps avoid application performance degradation.
#3 Log HTTP Requests with Morgan
Logging your HTTP request in your Node.js application is another great practice. Morgan node.js tool is one of the most popular tools for doing so, as it takes the server logs and organizes them to make them more readable.
To use Morgan, simply type the following into the format string:
morgan = require('morgan');
app.use(morgan('dev'));
Configure Winston with Morgan
If you prefer to use the Winston library, Morgan makes it simple to set up:
const morgan = require('morgan');
const config = require('./config');
const logger = require('./logger');
morgan.token('message', (req, res) => res.locals.errorMessage || '');
const getIpFormat = () => (config.env === 'production' ? ':remote-addr - ' : '');
const successResponseFormat = `${getIpFormat()}:method :url :status - :response-time ms`;
const errorResponseFormat = `${getIpFormat()}:method :url :status - :response-time ms - message: :message`;
const successHandler = morgan(successResponseFormat, {
    skip: (req, res) => res.statusCode >= 400,
    stream: {
        write: (message) => logger.info(message.trim())
    },
});
const errorHandler = morgan(errorResponseFormat, {
    skip: (req, res) => res.statusCode < 400,
    stream: {
        write: (message) => logger.error(message.trim())
    },
});
module.exports = {
    successHandler,
    errorHandler,
};
To configure Winston with Morgan, simply set up Winston to transmit the output of Morgan back to it, as shown in the example above.
#4 Define Log Level
It’s critical to specify your log levels before starting a build with your development team so that you can distinguish between log events. It’s easier to gather important information at a glance when log events are managed in an ordered and consistent manner.
It’s essential that everyone in the team agrees on when to utilize which log level. A WARNING level, for example, could be assigned to a failed login attempt. A failed login attempt, on the other hand, could indicate that something is wrong or that someone is attempting to break into an account.
You can lose out on vital information in your production environment if your team uses multiple log levels for similar events.
Additionally, decide on a specific log style format. In every log message, you might want to add the user ID. Before you begin creating your code, define these standards. It’s easier to study logs when they’re in a standard format.
#5 Server Logs
Server logs are a crucial component of application monitoring. Whatever hosting environment you use, you must keep a watch on this. Sending all of the data to a single location is the optimal solution. Application logs, database logs, and server logs should all be viewed together because they all have an influence on your users.
Let’s not forget about the network. Although most of us have little influence over the network, it’s worth examining how you might log network concerns. Errors can sometimes be traced back to the network. We can chase our tails seeking a cause after an incident if we don’t have insight into network issues.
Conclusion
While no infrastructure is perfectly secure or error-free, logging is an essential step for developers who wish to keep an eye on production and reduce errors. Other team members, such as QA, Support, and new programmers, can benefit from logging because it saves critical information to learn from and grow on.
Node.js logging is an important part of any node.js application’s process. Almost everyone involved in the application is affected by Node.js logging. Logs are essential to the feedback loop that promotes success, from users to executives to designers and engineers. We should keep track of everything, from minor details to major events.
Atatus
Log Monitoring and Management
Atatus is delivered as a fully managed cloud service with minimal setup at any scale that requires no maintenance. It monitors logs from all of your systems and applications into a centralized and easy-to-navigate user interface, allowing you to troubleshoot faster.

We give a cost-effective, scalable method to centralized node.js logging, so you can obtain total insight across your complex architecture. To cut through the noise and focus on the key events that matter, you can search the logs by hostname, service, source, messages, and more. When you can correlate log events with
Application Performance Monitoring(APM)
slow traces and errors, troubleshooting becomes easy.
Try your 14-day free trial of Atatus.
Error handling is one section of our job that we tend to neglect, especially when working on something new,
interesting, or something we just need to get working. We’ll handle errors later, we say — and that’s often a big lie.
But that’s not even the worst part. The problem comes when we decide to ‘quickly’ add some code to handle our
errors and completely forget about the importance and relevance of a properly constructed error message.
Who cares about the other side as long as my app doesn’t burn while crashing, right?
Wrong.
And don’t even get me started on the lack of proper logging for those errors — who’s interested in the person troubleshooting those midnight crashes?
These are prevalent situations that we need to learn to avoid. We can’t code assuming our applications won’t have
issues (they will), and we can’t think that no one will try to troubleshoot those issues. There is a lot of information
that we can provide if we do it properly.
So let’s see what a proper logging strategy looks like and how
we can structure our error messages to be helpful.
The Importance of a Good Error Message
«There’s been an error, try again later.»
How many times have we read or written that error message (bad developer!). Who are we helping?
And honestly, do you really think «try again later» solves anything? Is the problem going to fix itself magically?
For the sake of our sanity, let’s assume that it won’t, shall we?
Error messages aren’t there to get you out of crashing your app. They should help whatever or whoever is on the
other side of the request to understand why they’re not getting what they asked.
Notice how I said «whatever or whoever.» That’s because we live in a world where people can use our systems
through a piece of software, or an automated software can read errors directly.
Both
need very different types of error messages.
We need to have an explanation of:
- what went wrong
- why it went wrong
- what we can do to fix it, if possible
On the other hand, automated systems won’t benefit from such an approach since we all know getting
machines to understand our language can be very hard. Instead, other systems might just need a single alphanumerical code
representing the error code. They’ll have an internal mapping to understand how to respond to problems.
From the perspective of returning a particular error message in Node.js, I like to take the JSON approach and return
everything I need to return inside a single JSON object. For example, in the following code snippet, we
return an error for a fictional sign-up form. In this scenario, the user attempts to register on our site with an
already existing username:
{
    "error": {
        "error_code": "44CDA",
        "error_msg": "There was a problem with your username, it looks like it's already been taken, please try with a different one"
    }
}
The above error response does a few things:
- It lets the other end know there is information about the error by encapsulating everything inside a single
errorkey. - It returns a single error code for any potential system to automatically react to, without the need to parse and understand our error message.
- It also returns a detailed explanation of the error for a human user to understand.
You could even expand on #3 and provide some suggested usernames that are currently available. But the example above is more than enough.
Another great practice for returning error messages is to consider the HTTP
response code. This is, of course, only useful if you’re working under HTTP (but let’s assume you are).
As part of the standard (and this is why it’s so useful — because it’s a standard), we have the following groupings:
- 1XX (Informational responses) — These are informational statuses meant to let you know the server has received your request and is still
working on it. - 2XX (Successful responses) — OK return codes, meaning that whatever you tried to do, it worked.
- 3XX (Redirects) — Redirect messages usually mean that the resource you’re trying to reach is no longer there.
- 4XX (Client errors) — These indicate that the problem is on the request, meaning it’s incorrectly formatted, trying to
access something that’s not allowed, or some variation of that. In other words: it’s your fault. - 5XX (Server errors) — These indicate that something went terribly wrong on the server-side. Your code crashed, and it couldn’t
recover, thus the 500 error.
Read all about the different status codes.
With this in mind, we know that we could potentially group our custom error codes into two categories:
- Errors generated by the user
- Errors generated by our code
Why would we do this? Why isn’t the custom error code enough? It actually is in some situations. However, if you’re dealing
with client code that you know follows HTTP standards, such as a web browser, then you’re
providing them with information that they can automatically use to improve the way they handle the error.
So, for instance, back to our ‘invalid username’ error example: we would return it with an HTTP Status Code of 400 — ‘bad request.’ The request initiated by the user is incorrect, as they wanted to sign-up with an already taken username.
How to Log Errors in Node.js
Consider the necessity of understanding why errors happen.
Why does your application constantly return the same error message stating that a username is already taken?
Meanwhile, this is causing users to complain that they can’t sign-up to your app, so you’d better figure out what’s happening fast.
This is where logging comes into play — because returning a good error message to the user is only half the battle.
What happens when the user is getting the wrong error message? You, my friend, have a problem. But you now need to
understand it and figure out how to solve it.
Doing this without proper logging will be a pain, especially if you’re troubleshooting a production application.
How Does a Good Logger Look?
What is a «good logger» after all?
Well, it’s not console.log("This is my log message"), that’s for sure.
A good logger is a piece of code that can do multiple things, ideally all at once:
- Help you log a message (duh!).
- Handle any type of variable (including objects) being logged. That means correct serialization of attributes.
- Add metadata to the message, such as its importance (or level, as it is commonly known), a timestamp, or the message’s origin (the module, for instance, or the function name).
- Persist that message somewhere.
- Format the message for easier human interaction (e.g., add colors, bold words, etc.).
At a high level, this is exactly what you want to look for in any logger you either build or import into your code.
Just make sure that you use one that’s accessible throughout your code. This is crucial because another problem with
an unsupervised logging strategy is that multiple developers often try to solve the same problem differently.
You and your colleagues will inevitably each build your unique version of the ideal logger, tailored
to your particular needs.
That is a problem right there, not only because you’re repeating logic, but also because you’re potentially handling some
related issues in different ways. For instance:
- Message formatting
- Extra metadata
- Message persistence
Instead, ensure that you’re all using the same logger, following the same standards, and doing the same
thing with the output.
What to Do with Logged Data
A vital topic to cover when it comes to logging is what to do with logged data. Every time you
log a message, you’re generating data that needs to go somewhere.
That ‘somewhere’ can simply be the console — a volatile place where everything that’s not actively watched or
captured somehow gets lost. So if you’re not looking at the log output, then you’ll miss it. This means that
storage-wise, you have it very simple; however, by losing the data, there is no chance for you to correctly troubleshoot
your application when something goes wrong.
You have to think about your logs as pictures of the state of your system at any given time. The more pictures you have,
the better your ability to re-live it.
That means we need to save our logs. But where?
Saving into a local file can be dangerous because if you’re not manually truncating those files, your
hard drive might run out of disk space. The very solution you’ve used then ends up causing a big problem.
Ironic, isn’t it?
Instead, consider using an external utility such as Logrotate —
a Linux utility that allows you to manage your log files automatically. For instance, you can zip and rename
your log files automatically by setting thresholds on files’ age and sizes. When these triggers get fired,
Logrotate will create a new, empty log file and «rotate» the old one so that it is archived. You can control how many archive files are created. When a set number is reached, the oldest one is deleted, and a new one added.
An alternative is to send the log messages to other platforms such as Loggly
or Logz.io, which receive, index, and provide you with search functionality over your logs.
This, in turn, makes it very easy to traverse the full set of logs, especially when you’re logging on
multiple servers (for example, when you have copies of the same service).
Logs are a wonderful tool to use when things go wrong, but they require you to pay attention to something other than your code. Storage is one of the main aspects of logging that many people ignore — and they end up crashing their servers due to a lack of disk space. Make sure you have a storage strategy to go alongside your logging strategy, and you’ll have no issues.
Logging Libraries for Node.js
Like with anything in JavaScript, there are way too many logging library options out there.
I got 6,219 results on NPM’s site when searching ‘logging’. The endless options can be intimidating.
That being said, only a few of these results are worth using, as they’re actively maintained and used by millions of users. So let’s focus on those options, and you can go from there.
Winston
Winston is, by far, my personal favorite. It’s a very versatile library that integrates with major platforms when it
comes to storage.
Essentially, Winston is a logging library that allows you to:
- Create your own loggers
- Customize the output format and logging level
- Control how you’ll store those logs
- Decide different storage options for different levels
For example, you could decide that error-level logs — those you want to keep an eye out for — are sent to DataDog. At the same
time, you can determine that any info-level logs will go to a local file that gets rotated when it reaches 100Mb of size and display debug-level
logs on the terminal.
Winston’s plugin-based architecture means it stays relevant even after new logging products are released because
developers create integrations with the plugins and publish them on NPM.
Creating a logger with Winston is as simple as doing the following:
const winston = require("winston");

const logger = winston.createLogger({
  level: "info", //Sets the default level
  format: winston.format.json(), //Sets the default format
  defaultMeta: { service: "user-service" }, //Adds extra meta-data
  transports: [
    //Configures the transports, or essentially where do log messages go...
    //
    // - Write all logs with level `error` and below to `error.log`
    // - Write all logs with level `info` and below to `combined.log`
    //
    new winston.transports.File({ filename: "error.log", level: "error" }), //Error log files for error-level logs
    new winston.transports.File({ filename: "combined.log" }), //Simple file for everything together
  ],
});

//
// If we're not in production then log to the `console` with the format:
// `${info.level}: ${info.message} JSON.stringify({ ...rest }) `
//
if (process.env.NODE_ENV !== "production") {
  logger.add(
    new winston.transports.Console({
      format: winston.format.simple(),
    })
  );
}
Notice how, through the use of the createLogger method, we’re creating a new instance of a Winston logger. And through the configuration object we pass
to the method, we make sure this particular instance behaves as expected:
- The default level is going to be
info. - The format that every message will have is JSON.
- It’ll also add one extra field to every logged message:
servicewith the value"user-service". - Error-type logs are saved into a specific file called
error.log. - And all logs, in general, will go to a file called
combined.log.
That entire configuration will make your particular instance unique, and you can build as many as you want (although you’d normally build one).
Finally, an extra transport is added in case we’re not in a production environment (we check this through the value of the environment variable
NODE_ENV): the console. This means that if we’re dealing with a non-production deployment, we’ll send every log into the terminal, and
the format for all messages will be plain text with no JSON-like structure. This is especially useful for debugging purposes.
Finally, simply use:
logger.info("This is an info message!");
logger.error("Something terrible happened, look out!");
As you can see, the magic methods appear. You don’t have to worry about whether you’re logging in a production environment, or if you want one of these
messages to be saved into a file. It’s all transparent to you now.
Check out this complete list of Winston integrations with external systems.
Logging
Logging is a basic yet functional logging library. It only works for
your terminal, so you can’t control where or how logs are stored through code.
That being said, nothing stops you from capturing the terminal’s output and redirecting it to a file, to get rotated using logrotate.
Using this library is super easy. All you have to worry about
is creating a logger around a particular feature, and then you’ll have custom methods for each
log level, just like with Winston.
import createLogger from "logging";

const logger = createLogger("MyFeature");

logger.info("Interesting information you need to know");
logger.warn("Hmmm..., this data is not correct", { details });
logger.error("Not good.", "Not good at all.", { err }, { context }, { etc });

/**
This would output:

[ MyFeature ] Interesting information you need to know
[ WARNING MyFeature ] Hmmm..., this data is not correct { details object }
[ ERROR MyFeature ] Not good. Not good at all. { err } { context } ...
*/
In the above code, we also have the same createLogger method we had with Winston. However, this time around, it’s a bit simpler.
We only care about naming the feature we’re logging (the parameter that the method receives), and that’s it. The
rest of the magic methods come back, but they all do pretty much the same thing — they log those messages to the terminal.
As I mentioned, this is a very basic library that doesn’t do a lot — but what it does do, it does
very well. External libraries can do the rest.
Log4js
If you’re familiar with Java, you probably know about log4j. Log4js is an attempt to port that functionality into Node.js.
The creator’s README does not recommend assuming that this library works like its Java counterpart — however, it’s
safe to assume certain similarities.
Much like Winston, Log4js is packed with possibilities and configuration options. You can decide how to format your
logs and where to store them.
Its list of integrations is not as big — there are only 11 options available.
Don’t get me wrong though, these are 11 more than Logging, and you probably only need one per project. You’ll hardly ever need to
consider sending your logs to different places, even if you had the chance to do so.
From the library’s documentation:
const log4js = require("log4js");
log4js.configure({
  appenders: { cheese: { type: "file", filename: "cheese.log" } },
  categories: { default: { appenders: ["cheese"], level: "error" } },
});

const logger = log4js.getLogger("cheese");
logger.trace("Entering cheese testing");
logger.debug("Got cheese.");
logger.info("Cheese is Comté.");
logger.warn("Cheese is quite smelly.");
logger.error("Cheese is too ripe!");
logger.fatal("Cheese was breeding ground for listeria.");
Here, we have a mixture of Winston and Logging because, as you can see, we’re configuring a specific instance of the logger.
We’re setting up one particular file to contain all of our logs — cheese.log — and we’re also adding a default error level (much like
we did for Winston). However, we then create one particular logger instance around the «cheese» category (like we did with
Logging).
This code will output the following to your terminal:
[2010-01-17 11:43:37.987] [ERROR] cheese - Cheese is too ripe!
[2010-01-17 11:43:37.990] [FATAL] cheese - Cheese was a breeding ground for listeria.
Why only two lines? Because, as you can see, the default level for the ‘cheese’ category is «error», everything below
that level only gets saved to the cheese.log file.
If you ask me, unless you’re an ex-Java developer who’s familiar with log4j, I would skip this one and go straight to
Winston.
Are there more options? Absolutely: Bunyan,
Pino, and others. It depends on what your particular logging needs are.
What to Log in Your Node.js Projects
Let’s leave the actual libraries aside for now. It’s important to understand that there is an unspoken standard between
them all. You may have noticed mentions of «log-levels» and methods such as
debug, error, info, and others from the small code snippets above.
You see, not every log message is created equal — they don’t all have the same importance or relevance at any given
point in time.
You’ll want to see some messages every time your application runs because they’ll
let you know everything is working correctly. There are other messages that you’ll only care about
if things start to go wrong.
The basic log levels that most libraries tend to adopt are:
- Info — Meant for messages that display useful yet concise information. You want to use info-level messages
to show that a process got called, but not what parameters it received or how long it ran. - Error — This one’s easy enough. When things don’t work out, and you catch an error, you’ll use an error level message to
save as much detail about the error as you can. Remember, error messages need to be useful. See this post on long error messages to read more about how you can make error messages useful. - Debug — This is the ‘verbose’ level. As you’ll use this when you’re debugging your application, you
need a lot of details about what’s happening. Here, you’d include things like full-stack trace dumps or list the
full content of an array. Things that it doesn’t make sense to see constantly, but you need to make sure that
everything goes where it’s supposed to go.
There might be other log levels depending on the library, such as warn — to indicate messages that live
between an info state and an error state. In other words, warn flags something that needs attention — for example, a missing config file.
While you can still use default values, you could instead write something like this:
[Warn] Missing configuration file on ./config, using default values
This could be written as an info message as well, but an extra level of logging allows you to filter and organize the
information a lot better.
You might also see a fatal level, which is worse than an error — for instance, a crash on your server
(i.e., something you can’t recover from) would be a perfect use case for fatal.
Finally, a level that goes beyond debug is trace. This level contains all
the super detailed messages that you only want to see when something is wrong, and you need to understand what’s
happening inside your application.
An example is an Extract, Transform and Load (ETL) process, where you extract information from a source, transform it somehow
and finally load it into a storage system (this could be a database, the file system, or anything in between).
If you start
seeing that your data is corrupted at the end of this process, you need to understand when the corruption happened. You’ll have to know exactly what happens to the data at each step, and that is where a trace level of
logging can come in handy.
Once you’re done checking your logs, you can revert to a less verbose default logging level. Let’s look at that now.
Default Logging Level
We can’t always log everything. This is another important concept to understand when defining our logging strategy.
Even if we split different log levels into different destinations, we can’t always spend computational resources
logging every detail of our business logic.
Logging hurts performance the more you do it, so keep that in mind as well.
So what do we do instead? The log levels mentioned above are sorted by priority, for example:
tracedebuginfowarnerrorfatal
If we want to use the less verbose levels, we could set the default level to info. Then, even if we
had direct calls to the debug and trace methods, they would be ignored because the library would only pay attention to
our default level and anything with higher priority.
In the same vein, if we only care about error messages for some reason, we can set the default level to error and get error and fatal logs, but nothing else. So we toggle certain levels based on a single value. The perfect use case for this is to enable different
levels depending on our deployment environment.
Let’s pretend we have three environments:
- Dev — where we test new features ourselves
- QA — where we let others test our features
- Prod — the final environment where we deploy our code once it’s ready
We could have different default logging levels in each environment.
For example, trace could be a default for our Dev
environment to get the most details about how our code executes. Only we care about that level, so it makes
sense that it’s only the default here.
For the QA environment, we could have the info level as our default, in case something goes wrong or we want to monitor
what’s happening during tests. We’re assuming things work here, so we don’t need the details provided by
debug or trace.
Finally, we’ll only want to use the error level as default for our Prod environment because we only care about
things going wrong. If nobody complains, we’re good. This also provides the lowest possible performance loss since we’re only
logging when something bad happens.
You can control the default value with an environment variable, like this:
const winston = require("winston");

const logger = winston.createLogger({
  level: process.env.NODE_LOG_LEVEL || "info", //using the default log level or info if none provided
  //... rest of the implementation
});
The example above shows that you can grab any environment variable through the process.env global object.
By default, if we can’t find the variable, we use the "info" value.
You can set that directly on the execution of the script:
$ NODE_LOG_LEVEL=error node server.jsOr through a bash script where you export the variable directly:
$ export NODE_LOG_LEVEL=infoWrap-up: Choose the Right Node.js Logger and Useful Error Messages
Any application you’re developing requires a logging strategy. Luckily for us, Node.js has a bunch of very interesting
and useful loggers. As long as you understand your use case and your strategy,
you can then pick the right one for you.
As for your strategy, remember the two most important things to decide are:
- What are you going to do with error messages?
- How are you going to structure them?
Once you’ve answered those two questions, it just comes down to picking the right library and adding logging lines.
Check out this article for more tips on logging in your Node.js apps.
Happy coding!
P.S. If you liked this post, subscribe to our JavaScript Sorcery list for a monthly deep dive into more magical JavaScript tips and tricks.
P.P.S. If you need an APM for your Node.js app, go and check out the AppSignal APM for Node.js.