Each and every one of your gauss variables are missing the multiplication operator in two places. Check every line at it will run. For example, this:
gauss1=(1/(y*sqrt(2*%pi)))exp(-0.5(bb/y)^2)
should be this:
gauss1=(1/(y*sqrt(2*%pi))) * exp(-0.5 * (bb/y)^2)
As for the Gaussian bell, there is no standard function in Scilab. However, you could define a new function to make things more clear in your case:
function x = myGauss(s,b_)
    x = (1/(s*sqrt(2*%pi)))*exp(-0.5*(b_/s)^2)
endfunction
Actually, while we’re at it, your whole code is really difficult to read. You should define functions instead of repeating code: it helps clarify what you mean, and if there is a mistake, you need to fix only one place. Also, I personally do not recommend that you enclose everything in a function like bla7() because it makes things harder to debug. Your example could be rewritten like this:
- The
myGaussfunction; - A function
w_to calculatew1,w2,w10,w20,w100andw200; - A function
c_to calculatec1,c2,c10,c20,c100andc200; - A function
normal_to calculatenormal1,normal2,normal10,normal20,normal100andnormal200; - Call all four functions as many times as needed with different inputs for different results.
If you do that, your could will look like this:
function x = myGauss(s,b_)
    x = (1 / (s * sqrt(2 * %pi))) * exp(-0.5 * (b_/s)^2);
endfunction

function [w1_,w2_] = w_(t_,l_,n_,p_)

    w1_ = zeros(t_,1);
    w2_ = zeros(t_,1);
    for I = 1 : t_
        a = (grand(n_,1,"unf",0,p_));
        x = l_ * cos(a);
        y = l_ * sin(a);
        z1 = zeros(n_,1);
        z2 = zeros(n_,1);
        for i = 2 : n_
            z1(i) = z1(i-1) + x(i);
            z2(i) = z2(i-1) + y(i);
        end
        w1_(I) = z1($);
        w2_(I) = z2($);
    end

endfunction

function [c1_,c2_] = c_(t_,k_,v_,w1_,x_)

    c1_ = zeros(k_,1)
    for r = 1 : t_
        c = w1_(r);
        m = -x_ + v_;
        n = -x_;
        for g = 1 : k_
            if (c < m & c >= n) then
                c1_(g) = c1_(g) + 1;
                m = m + v_;
                n = n + v_;
            else
                m = m + v_;
                n = n + v_;
            end
        end
    end
    c2_ = zeros(k_,1);
    c2_(1) = -x_ + (x_/k_);
    for b = 2 : k_
        c2_(b) = c2_(b-1) + v_;
    end

endfunction

function [normal1_,normal2_,normal3_] = normal_(k_,bb_,bc_,v_,w1_)

    y = stdev(w1_);

    normal1_ = zeros(k_,1);
    normal2_ = zeros(k_,1);

    for wa = 1 : k_
        bd_ = (bb_ + bc_) / 2;
        gauss1 = myGauss(y,bb_);
        gauss2 = myGauss(y,bc_);
        gauss3 = myGauss(y,bd_);
        gauss4 = ((bc_ - bb_) / 6) * (gauss1 + gauss2 + 4 * gauss3);
        bb_ = bb_ + v_;
        bc_ = bc_ + v_;
        normal2_(wa,1) = gauss4;
    end

    normal3_ = normal2_ * 4000;

endfunction

t = 4000;
l = 0.067;
p = 2 * %pi;

n = 1000;
k = 70;
v = 12 / k;
x = 6;
bb = -x;
bc = -x + v;
[w1,w2] = w_(t,l,n,p);
[c1,c2] = c_(t,k,v,w1,x);
[normal1,normal2,normal3] = normal_(k,bb,bc,v,w1);
bar(c2,c1,1.0,'white');
plot(c2, normal3, 'r-');

n = 10000;
k = 100;
v = 24 / k;
x = 12;
bb = -x;
bc = -x + v;
[w10,w20] = w_(t,l,n,p);
[c10,c20] = c_(t,k,v,w10,x);
[normal10,normal20,normal30] = normal_(k,bb,bc,v,w10);
bar(c20,c10,1.0,'white');
plot(c20, normal30, 'b-');

n = 100;
k = 70;
v = 12 / k;
x = 6;
bb = -x;
bc = -x + v;
[w100,w200] = w_(t,l,n,p);
[c100,c200] = c_(t,k,v,w100,x);
[normal100,normal200,normal300] = normal_(k,bb,bc,v,w100);
bar(c200,c100,1.0,'white');
plot(c200, normal300, 'm-');

poly1.thickness=3;
xlabel(["x / um"]);
ylabel("molecules");
gcf().axes_size=[500,500]
a=gca();
a.zoom_box=[-12,12;0,600];
a.font_size=4;
a.labels_font_size=5;
a.x_label.font_size = 5;
a.y_label.font_size = 5;
ticks = a.x_ticks
ticks.labels =["-12";"-10";"-8";"-6";"-4";"-2";"0";"2";"4";"6";"8";"10";"12"]
ticks.locations = [-12;-10;-8;-6;-4;-2;0;2;4;6;8;10;12]
a.x_ticks = ticks
-
Inclab
-
Scilab для новичков
- Построение графиков Scilab
Математический пакет Scilab располагает широким и гибко настраиваемым аппаратом для построения двумерных графиков и трёхмерных изображений.
Данная статья получила продолжение: Как настраивать толщину и начертание графиков в Scilab и дополнительный разбор Настройки графиков: свойства осей и сетки.
Перечислим основные функции для оформления графика:
xgrid() — добавление сетки на график;
xtitle(«Название графика», «Название оси абсцисс», «Название оси ординат») — добавление подписей;
legend(.., , .. ) — создание легенды с перечнем всех отображенных графиков в системе координат;
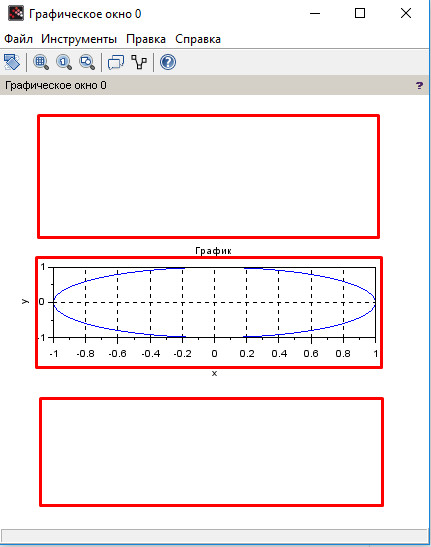
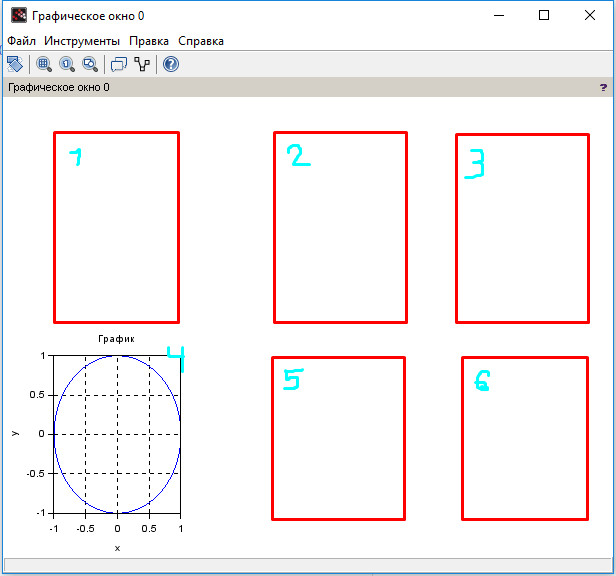
subplot(mnk) — функция разделения окна на матрицу, содержащую ( m ) строк, (n столбцов), а (k )- это номер ячейки, в которой будет отображен график.
Например, subplot(312) разобъёт графичекое окно на 3 строки, 1 столбец и нарисует график во второй ячейке:
Расположение графика в графическом окне subplot(312).
Например, subplot(234) разобъёт графичекое окно на 2 строки, 3 столбца и нарисует график в четвёртой ячейке:
Расположение графика в графическом окне subplot(234).
5.1 Двумерные графики
Для построения графиков, в которых положение точки задаётся двумя величинами, в Scilab нужно воспользоваться функцией plot(x, y , s). Здесь первая переменная ( х ) — массив абсцисс, ( у ) — массив ординат, ( s ) — необязательный параметр, отвечающий за цвет графика, толщину и начертание линии.
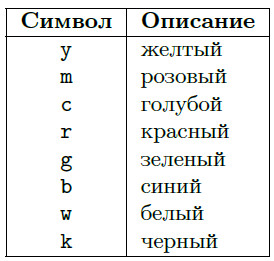
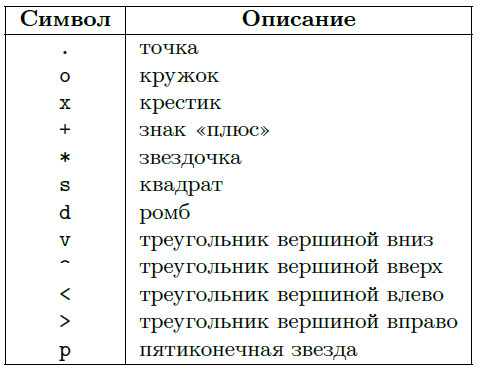
Установить желаемый вид и цвет графика можно, указав строковый параметр ( s ), который может состоять из одного, двух или трёх символов, определяющие соответственно: цвет линии, тип маркера, тип линии графика. Возможные значения перечислены в таблицах 2-4.
Таблица 2. Символы, определяющие цвет линии графика.
Таблица 3. Символы, определяющие тип линии графика.
Таблица 4. Символы, определяющие тип маркера
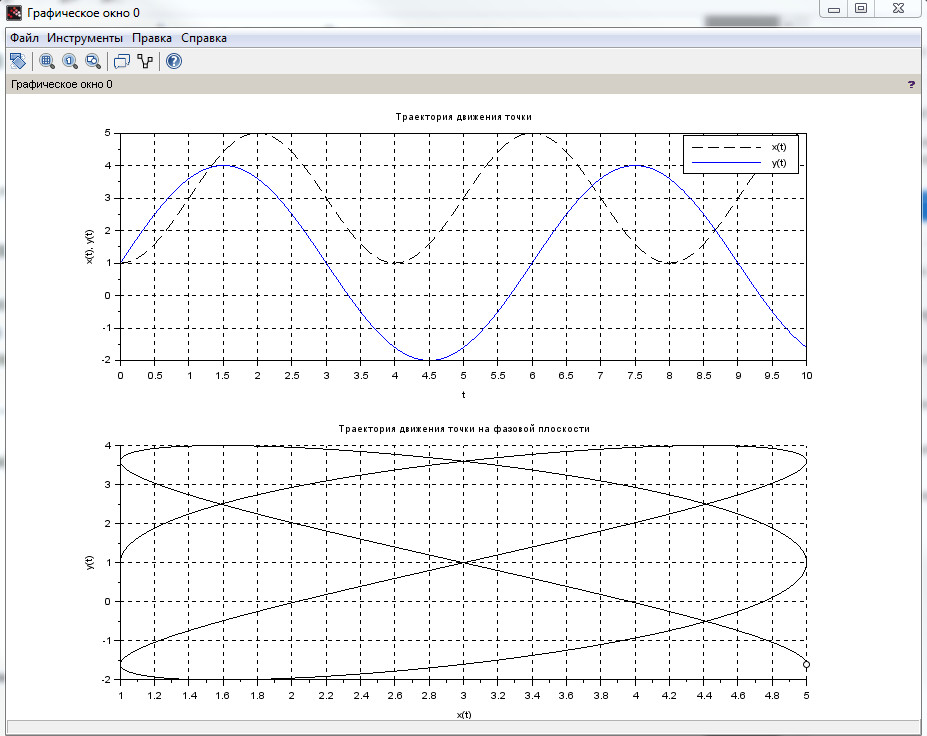
Для демонстрации работы функции plot() построим графики траектории движения точки по заданным уравнениям ( x(t), y(t) ) на плоскости и в заданном диапазоне времени T (таблица 5). Определим внешний вид каждого из графиков, а также оформим систему координат со всеми необходимыми подписями (листинг 13). Результат работы программы представлен на рис. 7.
Таблица 5. Уравнения движения материальной точки и промежуток времени.
Рисунок 7. Построение графиков движения материальной точки.
/* графики траектории движения материальной точки */

// очищаем область консоли и графического окна
clc; clf;

// создаём пользовательскую функцию для координаты х
function z = X(t)
    z = 3 - 2*cos(%pi*t/2);
endfunction;

// создаём пользовательскую функцию для координаты y
function z = Y(t)
    z = 1 + 3*sin(%pi*t/3);
endfunction;


d = 1e-2;    // задаём шаг
T = 0:d:10;   // задаём диапазон времени

x = X(T);   // вызываем пользовательскую функцию X
y = Y(T);   // вызываем пользовательскую функцию Y

subplot(211);       // разделяем графическое окно на 2 строки
plot(T, x, "k--");  // строим график x(t)
plot(T, y);         // строим график у(t) в той же системе координат
xgrid;
xtitle("Траектория движения точки", "t", "x(t), y(t)");
legend("x(t)", "y(t)");

subplot(212);
xgrid;
xtitle("Траектория движения точки на фазовой плоскости", "x(t)", "y(t)");
comet(x, y);      // строим анимированную траекторию движения точки на фазовой плоскости
Листинг 13. Программа построения графиков движения материальной точки.
5.2 Построение трёхмерных изображений
Для построения поверхности в Scilab используются функции plot3d( plot3d1) и plot3d2(plot3d3). Их отличие состоит в том, что первая пара функций plot3d( plot3d1) строит поверхность из отдельно стоящих друг от друга грани (залитую одним цветом и залитую различными цветами соответсвенно), а вторая пара plot3d2(plot3d3) — цельное геометрическое тело.
Процесс построения графика функции вида ( Z(x,y) ) можно разделить на 3 этапа:
1. Создание прямоугольной сетки с помощью функции linspace();
2. Вычисление значений функции ( Z(x,y) ) в узлах сетки;
3. Вызов функции plot3d() или plot3d2().
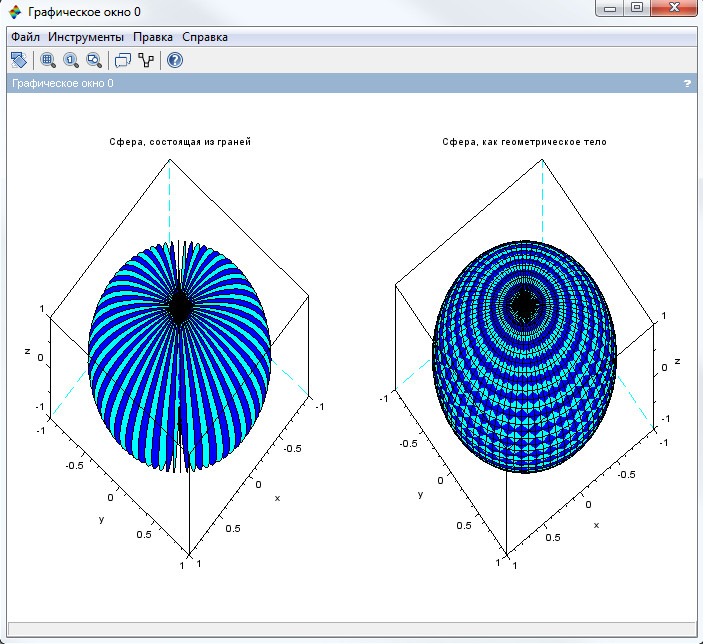
В качестве примера, построим сферу в трехмерной системе координат с помощью функций plot3d1 и plot3d2.
Рисунок 8. Сфера, заданная параметрически, построенная с помощью функции plot3d1 (слева) и plot3d2 (справа).
Поверхность сферы в декартовых координатах ( (x,y,z) ) параметрически задаётся системой уравнений: ( f(n) = begin{cases}
x(u,v)=cos(u)cos(v) \ y(u,v)=cos(u)sin(v) \ z(u,v)=sin(u) end{cases} ),
независимые переменные ( u и v ) изменяются на промежутке ( [-pi; pi] ). Результат работы программы представлен на рис.8, исходный код на листинге 14.
/* работа с трёхмерными графиками */

u = linspace(-%pi, %pi, 40); // задаём сетку для параметра u с 40 значениями в указанном диапазоне
v = linspace(-%pi, %pi, 40); // задаём сетку для параметра v с 40 значениями в указанном диапазоне
/* массивы u и v должны иметь одиноковый размер! */

/* Формируем матрицы значения для каждой координаты */
X = cos(u)'*cos(v);
Y = cos(u)'*sin(v);
Z = sin(u)'*ones(v);

/* Строим трёхмерные графики */
subplot(121);
plot3d(X,Y,Z);
xtitle("Сфера, состоящая из граней", "x", "y", "z");

subplot(122);
plot3d2(X,Y,Z);
xtitle("Сфера, как геометрическое тело", "x", "y", "z");
Листинг 14. Программа, реализующая построения трехмерного изображения сферы с помощью функции plot3d1 и plot3d2.
Обратите внимание, что при построении графиков поверхностей заданных параметрически , (x(u,v), y(u,v) и z(u,v) ), необходимо сформировать матрицы ( X, Y и Z) одинакового размера. Для этого массивы ( u и v ) должны иметь одинаковый размер.
Кроме того, если какая-либо функция из ( X, Y или Z) зависит только от одного параметра ( u или v ), необходимо провести векторное умножение на единичный вектор ones() размерности, равной размерности параметра, от которого эта функция не зависит (см. строку 10 листинга 14).
Данная статья получила продолжение: Как настраивать толщину и начертание графиков в Scilab
Нравится
64
(лайкай без регистрации)
You are running a Bash script, and you see a syntax error: Unexpected end of file.
What does it mean?
This can happen if you create your script using Windows.
Why?
Because Windows uses a combination of two characters, Carriage Return and Line Feed, as line break in text files (also known as CRLF).
On the other side Unix (or Linux) only use the Line Feed character as line break.
So, let’s see what happens if we save a script using Windows and then we execute it in Linux.
Using the Windows notepad I have created a Bash script called end_of_file.sh:
#/bin/bash

if [ $# -gt 0 ]; then
  echo "More than one argument passed"
else
  echo "No arguments passed"
fi
And here is the output I get when I execute it:
[ec2-user@localhost scripts]$ ./end_of_file.sh
./end_of_file.sh: line 2: $'r': command not found
./end_of_file.sh: line 8: syntax error: unexpected end of file
How do we see where the problem is?
Edit the script with the vim editor using the -b flag that runs the editor in binary mode:
[ec2-user@localhost scripts]$ vim -b end_of_file.sh

(Below you can see the content of the script)

#/bin/bash^M
^M
if [ $# -gt 0 ]; then^M
  echo "More than one argument passed"^M
else^M
  echo "No arguments passed"^M
fi^M
At the end of each line we see the ^M character. What is that?
It’s the carriage return we have mentioned before. Used by Windows but not by Unix (Linux) in line breaks.
To solve both errors we need to convert our script into a format that Linux understands.
The most common tool to do that is called dos2unix.
If dos2unix is not present on your system you can use the package manager of your distribution to install it.
For instance, on my server I can use YUM (Yellowdog Updater Modified).
To search for the package I use the yum search command:
[root@localhost ~]$ yum search dos2unix
Loaded plugins: extras_suggestions, langpacks, priorities, update-motd
====================== N/S matched: dos2unix =====================================
dos2unix.x86_64 : Text file format converters
And then the yum install command to install it:
[root@localhost ~]$ yum install dos2unix
Loaded plugins: extras_suggestions, langpacks, priorities, update-motd
amzn2-core                                                   | 2.4 kB  00:00:00
amzn2extra-docker                                            | 1.8 kB  00:00:00
Resolving Dependencies
--> Running transaction check
---> Package dos2unix.x86_64 0:6.0.3-7.amzn2.0.2 will be installed
--> Finished Dependency Resolution

Dependencies Resolved

==================================================================================
  Package       Arch        Version            Repository            Size
==================================================================================
 Installing:
  dos2unix      x86_64      6.0.3-7.amzn2.0.2  amzn2-core            75 k

 Transaction Summary
==================================================================================
 Install  1 Package

 Total download size: 75 k
 Installed size: 194 k
 Is this ok [y/d/N]: y
 Downloading packages:
 dos2unix-6.0.3-7.amzn2.0.2.x86_64.rpm                      |  75 kB  00:00:00
 Running transaction check
 Running transaction test
 Transaction test succeeded
 Running transaction
   Installing : dos2unix-6.0.3-7.amzn2.0.2.x86_64                          1/1
   Verifying  : dos2unix-6.0.3-7.amzn2.0.2.x86_64                          1/1

 Installed:
   dos2unix.x86_64 0:6.0.3-7.amzn2.0.2
 Complete!
We are ready to convert our script using dos2unix!
[ec2-user@localhost scripts]$ dos2unix end_of_file.sh
dos2unix: converting file end_of_file.sh to Unix format ...
And now it’s time to execute it:
[ec2-user@localhost scripts]$ ./end_of_file.sh No arguments passedIt works!
If you are interested I have written an article that explains the basics of Bash script arguments.
Conclusion
I have found myself having to use the dos2unix command several times over the years.
And now you know what to do if you see the syntax error “Unexpected end of file” while running a Bash script 🙂
Related FREE Course: Decipher Bash Scripting
Related posts:
I’m a Tech Lead, Software Engineer and Programming Coach. I want to help you in your journey to become a Super Developer!
function wooc_extra_register_fields() {?>
       <p class="form-row form-row-wide">
       <label for="reg_billing_phone"><?php _e( 'Phone', 'woocommerce' ); ?></label>
       <input type="text" class="input-text" name="billing_phone" id="reg_billing_phone" value="<?php esc_attr_e( $_POST['billing_phone'] ); ?>" />
       </p>
       <p class="form-row form-row-first">
       <label for="reg_billing_first_name"><?php _e( 'First name', 'woocommerce' ); ?>*</label>
       <input type="text" class="input-text" name="billing_first_name" id="reg_billing_first_name" value="<?php if ( ! empty( $_POST['billing_first_name'] ) ) esc_attr_e( $_POST['billing_first_name'] ); ?>" />
       </p>
       <p class="form-row form-row-last">
       <label for="reg_billing_last_name"><?php _e( 'Last name', 'woocommerce' ); ?>*</label>
       <input type="text" class="input-text" name="billing_last_name" id="reg_billing_last_name" value="<?php if ( ! empty( $_POST['billing_last_name'] ) ) esc_attr_e( $_POST['billing_last_name'] ); ?>" />
       </p>
       <div class="clear"></div>
       <?php
 }
 add_action( 'woocommerce_register_form_start', 'wooc_extra_register_fields' );
What I have tried:
function wooc_extra_register_fields() {?>
       <p class="form-row form-row-wide">
       <label for="reg_billing_phone"><?php _e( 'Phone', 'woocommerce' ); ?></label>
       <input type="text" class="input-text" name="billing_phone" id="reg_billing_phone" value="<?php esc_attr_e( $_POST['billing_phone'] ); ?>" />
       </p>
       <p class="form-row form-row-first">
       <label for="reg_billing_first_name"><?php _e( 'First name', 'woocommerce' ); ?>*</label>
       <input type="text" class="input-text" name="billing_first_name" id="reg_billing_first_name" value="<?php if ( ! empty( $_POST['billing_first_name'] ) ) esc_attr_e( $_POST['billing_first_name'] ); ?>" />
       </p>
       <p class="form-row form-row-last">
       <label for="reg_billing_last_name"><?php _e( 'Last name', 'woocommerce' ); ?>*</label>
       <input type="text" class="input-text" name="billing_last_name" id="reg_billing_last_name" value="<?php if ( ! empty( $_POST['billing_last_name'] ) ) esc_attr_e( $_POST['billing_last_name'] ); ?>" />
       </p>
       <div class="clear"></div>
       <?php
 }
 add_action( 'woocommerce_register_form_start', 'wooc_extra_register_fields' );

