Log management
Logs are available at realtime and are saved into your hard disk.
The way your logs are formatted, the way log files are created: everything can be customized.
Access the logs
Real-time logs
# all apps logs
pm2 logs

# only app logs
pm2 logs app
Log files
By default, all logs are saved into $HOME/.pm2/logs.
You can empty all application logs with:
Log files configuration
You can specify a custom location for your logs.
module.exports = {
  apps: [{
      name: 'app',
      script: 'app.js',
      output: './out.log',
      error: './error.log',
	    log: './combined.outerr.log',
    }]
}
outputis only standard output (console.log)erroris only error output (console.error)logcombinesoutputanderror, disabled by default
Rotating Logs
If you want to split logs into multiple files instead of a big one, use the logrotate:
pm2 install pm2-logrotate
Learn how to configure the module here.
Merging Logs
In cluster mode, each cluster has his own log files. You can use the merge options to gather all logs into a single file:
module.exports = {
  apps: [{
      name: 'app',
      script: 'app.js',
      output: './out.log',
      error: './error.log',
      merge_logs: true,
    }]
}
Logs are still splitted into output/error/log
Disabling Logs
You can disable logs by sending them to /dev/null:
module.exports = {
  apps: [{
      name: 'app',
      script: 'app.js',
      output: '/dev/null',
      error: '/dev/null',
    }]
}
Log formating
JSON
You can output the logs in JSON format:
becomes:
{
   "message": "Hello World!n",
   "timestamp": "2017-02-06T14:51:38.896Z",
   "type": "out",
   "process_id": 0,
   "app_name": "app"
}
Add this entry in your ecosystem file:
ecosystem file: “log_type”: “json”`
Timestamp format
You can output the logs adding a timestamp:
becomes:
Add this entry in your ecosystem file:
"log_date_format": "DD-MM-YYYY"
The format must follow a moment.js format, list here.
Next Steps
Startup Hook
Application Logs
Once an application is started with PM2 you can consult and manage logs easily.
Log files are located in the folder $HOME/.pm2/logs.
Log Views
To display application’s log you can use the command pm2 logs
-l --log [path]              specify filepath to output both out and error logs
-o --output <path>           specify out log file
-e --error <path>            specify error log file
--time                       prefix logs with standard formatted timestamp
--log-date-format <format>   prefix logs with custom formatted timestamp
--merge-logs                 when running multiple process with same app name, do not split file by id
| Usage: logs [options] [id | name | namespace] |
stream logs file. Default stream all logs
Options:
--json                json log output
--format              formatted log output
--raw                 raw output
--err                 only shows error output
--out                 only shows standard output
--lines <n>           output the last N lines, instead of the last 15 by default
--timestamp [format]  add timestamps (default format YYYY-MM-DD-HH:mm:ss)
--nostream            print logs without launching the log stream
--highlight [value]   highlights the given value
-h, --help            output usage information ```
Some important commands:
# Display all apps logs in realtime
pm2 logs

# Display only `api` application logs
pm2 logs api

# Display new logs in json
pm2 logs --json

# Display 1000 lines of api log file
pm2 logs big-api --lines 1000
You can also check logs with the CLI dashboard:
For each application line this metadata will be printed:
{
   "message": "echon",                     // the actual message that has been `console.log`
   "timestamp": "2017-02-06T14:51:38.896Z", // timestamp of the message, can be formatted
   "type": "out",                           // the type of logs, can be `err`, `out` or `PM2`
   "process_id": 0,                         // the process id used by PM2
   "app_name": "one-echo"                   // the application name
}
The module pm2-logrotate automatically rotate and keep all the logs file using a limited space on disk.
To install it:
pm2 install pm2-logrotate
Read more about pm2-logrotate here
Flushing logs
This will empty the current application logs managed by PM2:
pm2 flush

pm2 flush <api> # Clear the logs for the app with name/id matching <api>
Application log options
When starting an application you can specify many options on how
CLI
When running pm2 start app.js [OPTIONS] you can pass any of this options to the CLI:
-l --log [path]              specify filepath to output both out and error logs
-o --output <path>           specify out log file
-e --error <path>            specify error log file
--time                       prefix logs with standard formatted timestamp
--log-date-format <format>   prefix logs with custom formatted timestamp
--merge-logs                 when running multiple process with same app name, do not split file by id
Auto prefixing logs with Date
To easily prefix logs of apps you can pass the option --time:
$ pm2 start app.js --time
# Or a running app
$ pm2 restart app --time
Configuration file
Via configuration file you can pass the options:
| Field | Type | Example | Description |
|---|---|---|---|
| error_file | (string) | error file path (default to $HOME/.pm2/logs/<app name>-error-<pid>.log) | |
| out_file | (string) | output file path (default to $HOME/.pm2/logs/<app name>-out-<pid>.log) | |
| log_file | (string) | file path for both output and error logs (disabled by default) | |
| pid_file | (string) | pid file path (default to $HOME/.pm2/pids/<app name>-<pid>.pid) | |
| merge_logs | boolean | true | if set to true, avoid to suffix logs file with the process id |
| log_date_format | (string) | “YYYY-MM-DD HH:mm Z” | log date format (see log section) |
| log_type | (string) | “json” | specify log output style, possible value: ‘json’ (will log raw by default) |
Disabling log suffix
For app in cluster mode (node.js) only;
If you want that all instances of a clustered process logs into the same file you can use the option --merge-logs or merge_logs: true
Disable logging
To disable all logs to be written in disk you can set the option out_file and error_file to /dev/null
module.exports = {
  apps : [{
    name: 'Business News Watcher',
    script: 'app.js',
    instances: 1,
    out_file: "/dev/null",
    error_file: "/dev/null"
    cron_restart: '0 0 * * *'
    [...]
  }]
}
You can provide /dev/null or NULL as output of logs (not depending on the platform, they are a hardcoded string).
Setting up a native logrotate
sudo pm2 logrotate -u user
This will write a basic logrotate configuration to /etc/logrotate.d/pm2-user that will look like this:
/home/user/.pm2/pm2.log /home/user/.pm2/logs/*.log {
        rotate 12
        weekly
        missingok
        notifempty
        compress
        delaycompress
        create 0640 user user
}
Contribute to this page
| layout | title | menu | lang | section | permalink |
|---|---|---|---|---|---|
|
page |
Log Management | Guide | PM2 Documentation |
starter |
en |
runtime |
/en/runtime/guide/log-management/ |
Logs are available at realtime and are saved into your hard disk.
The way your logs are formatted, the way log files are created: everything can be customized.
Access the logs
Real-time logs
# all apps logs
pm2 logs

# only app logs
pm2 logs app
Log files
By default, all logs are saved into $HOME/.pm2/logs.
You can empty all application logs with:
Log files configuration
You can specify a custom location for your logs.
module.exports = {
  apps: [{
      name: 'app',
      script: 'app.js',
      output: './out.log',
      error: './error.log',
	    log: './combined.outerr.log',
    }]
}
outputis only standard output (console.log)erroris only error output (console.error)logcombinesoutputanderror, disabled by default
Rotating Logs
If you want to split logs into multiple files instead of a big one, use the logrotate:
pm2 install pm2-logrotate
Learn how to configure the module here.
Merging Logs
In cluster mode, each cluster has his own log files. You can use the merge options to gather all logs into a single file:
module.exports = {
  apps: [{
      name: 'app',
      script: 'app.js',
      output: './out.log',
      error: './error.log',
      merge_logs: true,
    }]
}
Logs are still splitted into output/error/log
{: .tip}
Disabling Logs
You can disable logs by sending them to /dev/null:
module.exports = {
  apps: [{
      name: 'app',
      script: 'app.js',
      output: '/dev/null',
      error: '/dev/null',
    }]
}
Log formating
JSON
You can output the logs in JSON format:
becomes:
{
   "message": "Hello World!n",
   "timestamp": "2017-02-06T14:51:38.896Z",
   "type": "out",
   "process_id": 0,
   "app_name": "app"
}
Add this entry in your ecosystem file:
ecosystem file: «log_type»: «json»`
Timestamp format
You can output the logs adding a timestamp:
becomes:
Add this entry in your ecosystem file:
"log_date_format": "DD-MM-YYYY"
The format must follow a moment.js format, list here.
Next Steps
[Startup Hook]({{ site.baseurl }}{% link en/runtime/guide/startup-hook.md %})
{: .btn-stylized}
Log handling is an essential key factor in process management. Even though you might not be interested in your logs if everything went smooth. Wait for your first downtime and app failures and you’ll find your fastest way to get proper information about the current application situation within your log files.
This post is part of an extensive series about the Node.js process manager PM2. There might be another interesting post about PM2 in the series overview below.
PM2 Series Overview
- PM2
- Process Management
- Advanced Configuration
- Utility
- Process & App Starts
Introduction
This article shows example snippets from the command line of each executed PM2 command. We’ll use the Future Studio homepage (called homepage) and maintenance (called maintenance) projects to illustrate the log functionality.
Show Real-Time Logs
You can display any logs by your applications in real-time. This might be overwhelming if you’ve many incoming requests, because the logs will append sequentially. To show real-time logs of each started applications, use PM2’s logs command:
pm2 logs
This command will also output previous log information of each application separated by an empty line. You can reduce the amount of previous log entries by passing the --lines option to the logs command. This will reduce the number of previous log entries for the current run by the specified number.
$ pm2 logs --lines=2
[PM2] Tailing last 2 lines for [all] processes

PM2: 2015-10-08 15:24:34: Starting execution sequence in -fork mode- for app name:maintenance id:1
PM2: 2015-10-08 15:24:34: App name:maintenance id:1 online

homepage-0 (out): 151008/152457.897, [response], http://0.0.0.0:3000: get /images/favicon.ico {} 200 (3ms)
homepage-0 (out): 151008/152457.984, [response], http://0.0.0.0:3000: get /images/favicon.ico {} 304 (3ms)

maintenance-1 (out): 151008/152448.194, [response], http://0.0.0.0:2014: get /images/futurestudio-logo-transparent.png {} 304 (3ms)
maintenance-1 (out): 151008/152448.702, [response], http://0.0.0.0:2014: get /images/favicon.ico {} 200 (5ms)
As you can see, the previous entries are reduced to only two lines. Any further log entries get appended to the real-time screen while you’re watching. If there are any error logs available for your applications, you’ll see them within the log view as well.
Show App Specific Logs
Mostly, you’re just interested of logs from a given application. You can add the application name used within PM2 to reduce the shown log entries only to the given app.
pm2 logs homepage
The command above will only display the log entries for the homepage project. We’ll reduce the output of previous logs to 5 lines.
$ pm2 logs homepage --lines=3
pm2 logs homepage --lines=5
[PM2] Tailing last 3 lines for [homepage] process

homepage-0 (out): 151008/152456.582, [response], http://0.0.0.0:3000: get /images/futurestudio-logo-transparent.png {} 304 (4ms)
homepage-0 (out): 151008/152457.181, [response], http://0.0.0.0:3000: get /images/books/retrofit.png {} 304 (7ms)
homepage-0 (out): 151008/152457.897, [response], http://0.0.0.0:3000: get /images/favicon.ico {} 200 (3ms)
You can also reduce the log entries to the error ones. Passing the --err option to the logs command will only print error logs.
Flush Log Entries
There are situations when you want to remove old log entries and get back a fresh state. The section title already indicates the command to delete all log entries with PM2:
pm2 flush
This will delete all log entries from every managed process, also the PM2 process.
$ pm2 flush
[PM2] Flushing /Users/marcuspoehls/.pm2/pm2.log
[PM2] Flushing
[PM2] /Users/marcuspoehls/.pm2/logs/homepage-out-0.log
[PM2] /Users/marcuspoehls/.pm2/logs/homepage-error-0.log
[PM2] Flushing
[PM2] /Users/marcuspoehls/.pm2/logs/maintenance-out-1.log
[PM2] /Users/marcuspoehls/.pm2/logs/maintenance-error-1.log
[PM2] Logs flushed
Reload Logs
If you’re using logrotate or any other application to support you handling the log entries, you can reload the old entries from your PM2 logs.
pm2 reloadLogs
Log Format Specifications
Of course you can adjust the real-time log entries to your needs by adjusting the date format and you can also save the output and error logs to the same file. Let’s start with the date format specification. Therefore, you need to add the --timestamp <format> to the logs command. The <format> is a string representing a timestamp format, like "YYYY-MM-DD HH:mm Z".
$ pm2 logs --timestamp="YYYY-MM-DD HH:mm:ss Z"
[PM2] Streaming realtime logs for [all] processes
2015-10-08 16:16:24 +02:00 homepage-0 151008/161624.499, [response], http://0.0.0.0:3000: get /images/futurestudio-logo-transparent.png {} 304 (2ms)
2015-10-08 16:16:25 +02:00 homepage-0 151008/161625.153, [response], http://0.0.0.0:3000: get /images/books/retrofit.png {} 304 (4ms)
New log entries will have the format of timestamp assigned. PM2 will save the date of creation for every log entry. Even though old entries aren’t formatted in the specified way, there are timestamps available for every entry.
Output and Error Logs in Same File
PM2 allows you to store the output and error log entries in the same file. You have two options to configure this feature for your PM2 processes: either the -l (--log) or the same values for -o (--output) and -e (--error) options.
pm2 start server.js -o="/path/to/file.log" -e="/path/to/file.log"
# or
pm2 start server.js -l="/path/to/file.log"
Be aware that writing output and error logs to the same file may increase your effort to search for error entries within the log file.
Merge Log Entries in Cluster Mode
Using the cluster mode of PM2 will start multiple worker processes of your app and each process will have its own log file for normal output and errors. You can merge all log entries to a single application log file by passing the --merge-logs option during the start command:
pm2 start server.js --instances 2 --merge-logs
Logrotate
PM2 has a module system that allow to extend the default with custom functionality. And there’s a plugin for logrotate integration to PM2: pm2-logrotate. It’s worth a look.
Do you prefer the native integration of PM2 with logrotate? Execute the following command to write a logrotate configuration to /etc/logrotate.d/pm2-<username>:
sudo pm2 logrotate -u <username>
What Comes Next
This article showed you how to show application logs in real-time using available PM2 commands. You’ve learned how to use multiple options to customize the log output, like adding timestamps, reduce the displayed lines of previous log entries to and of course, how to show only log entries from a given app process.
The next article will guide you through the setup of PM2’s auto-completion feature for the command line utility.
Did we miss any useful command when managing application logs with PM2? Leave a comment or reach out @futurestud_io.
Additional Resources
- Native logrotate for PM2
Process management refers to various activities around the creation,
termination, and monitoring of processes. A process manager is a program that
ensures that your applications always stay online after being
launched.
Process managers can prevent downtime in production by automatically restarting your
application after a crash or even after the host machine reboots. They are
also useful in development: they auto-restart an app once its source files or
dependencies are updated. Process managers also typically provide monitoring
tools that access application logs and other key metrics, such as CPU and memory
usage.
PM2 is a Node.js process manager that comes
with a built-in load balancer. It helps facilitate production
deployments and enables you to keep running applications alive indefinitely
(even when accidents occur). It also lets you gain insights into your
application’s runtime performance and resource consumption and scale your
application in real-time through its clustering feature.
In this article, we’ll examine PM2’s most important features and discover how it
can help you increase the resilience of your Node.js applications in production.
Getting Started with PM2
PM2 is available as an NPM package, so you
can install it through npm or yarn:
$ npm install pm2
# or
$ yarn add pm2
After installing PM2, run npx pm2 --version to see the installed version:
$ npx pm2 --version
5.1.2
If you don’t want to prefix the pm2 command with npm every time, you can
install it globally:
$ npm install -g pm2
# or
$ yarn global add pm2
Aside from the main pm2 command, the
installation provides some other executables:
pm2-dev: a development tool for restarting your application when file
changes in the directory are detected (similar to
Nodemon).pm2-runtime: designed to be a drop-in replacement for thenodebinary in
Docker containers. It helps keep the running application in the
foreground (unlikepm2, which sends it to the background) so that the
container keeps running.pm2-docker: an alias forpm2-runtime.
Start Your Node.js App in Development Mode with PM2
It can be quite tedious to restart your application server in development every
time you change the source files. Using the pm2-dev binary to start
your application can take care of that concern automatically:
$ pm2-dev start app.js
===============================================================================
--- PM2 development mode ------------------------------------------------------
Apps started         : app
Processes started    : 1
Watch and Restart    : Enabled
Ignored folder       : node_modules
===============================================================================
app-0  | {"level":30,"time":1638512528047,"pid":4575,"hostname":"Kreig","msg":"Server listening at http://127.0.0.1:3000"}
[rundev] App app restarted
app-0  | {"level":30,"time":1638512535737,"pid":4631,"hostname":"Kreig","msg":"Server listening at http://127.0.0.1:3000"}
At this point, your server will auto-restart each time you create, modify or
delete a source file in your project. It also works when you add or
remove a dependency with npm or yarn.
Start Your Node.js App in Production Mode with PM2
When deploying an application to production, you can use the pm2 binary to
start it in the background. It launches a daemon that monitors your application
and keeps it running indefinitely.
$ pm2 start app.js
[PM2] Starting /home/ayo/dev/demo/covid-node/app.js in fork_mode (1 instance)
[PM2] Done.
┌─────┬────────┬─────────────┬─────────┬─────────┬──────────┬────────┬──────┬───────────┬──────────┬──────────┬──────────┬──────────┐
│ id  │ name   │ namespace   │ version │ mode    │ pid      │ uptime │ ↺    │ status    │ cpu      │ mem      │ user     │ watching │
├─────┼────────┼─────────────┼─────────┼─────────┼──────────┼────────┼──────┼───────────┼──────────┼──────────┼──────────┼──────────┤
│ 0   │ app    │ default     │ 1.0.0   │ fork    │ 16573    │ 0s     │ 0    │ online    │ 0%       │ 19.1mb   │ ayo      │ disabled │
└─────┴────────┴─────────────┴─────────┴─────────┴──────────┴────────┴──────┴───────────┴──────────┴──────────┴──────────┴──────────┘
PM2 defaults to the name of the entry file as the app’s name, but you can
use a more recognizable name through the --name option. This name is what
you’ll use to reference the application in many pm2 subcommands.
$ pm2 start app.js --name "my app"Suppose you need to ensure that your application has established connections with
other services (such as the database or cache) before being considered
«online» by PM2. In that case, you can use the --wait-ready option when starting your
application. This causes PM2 to wait for 3 seconds (by default) or for a ready event
(process.send('ready')) before the application is considered ready. You can
use the --listen-timeout option to change the length of the delay.
$ pm2 start app.js --wait-ready --listen-timeout 5000 # wait for 5 secondsMonitoring Your Running Applications in PM2
To list your running applications, use the pm2 list command. This prints a
table describing the state of all running applications with columns for:
- the app name and id
- CPU and memory usage
- number of restarts (
↺) - uptime
- process id
- the mode (
forkorcluster)
and others.
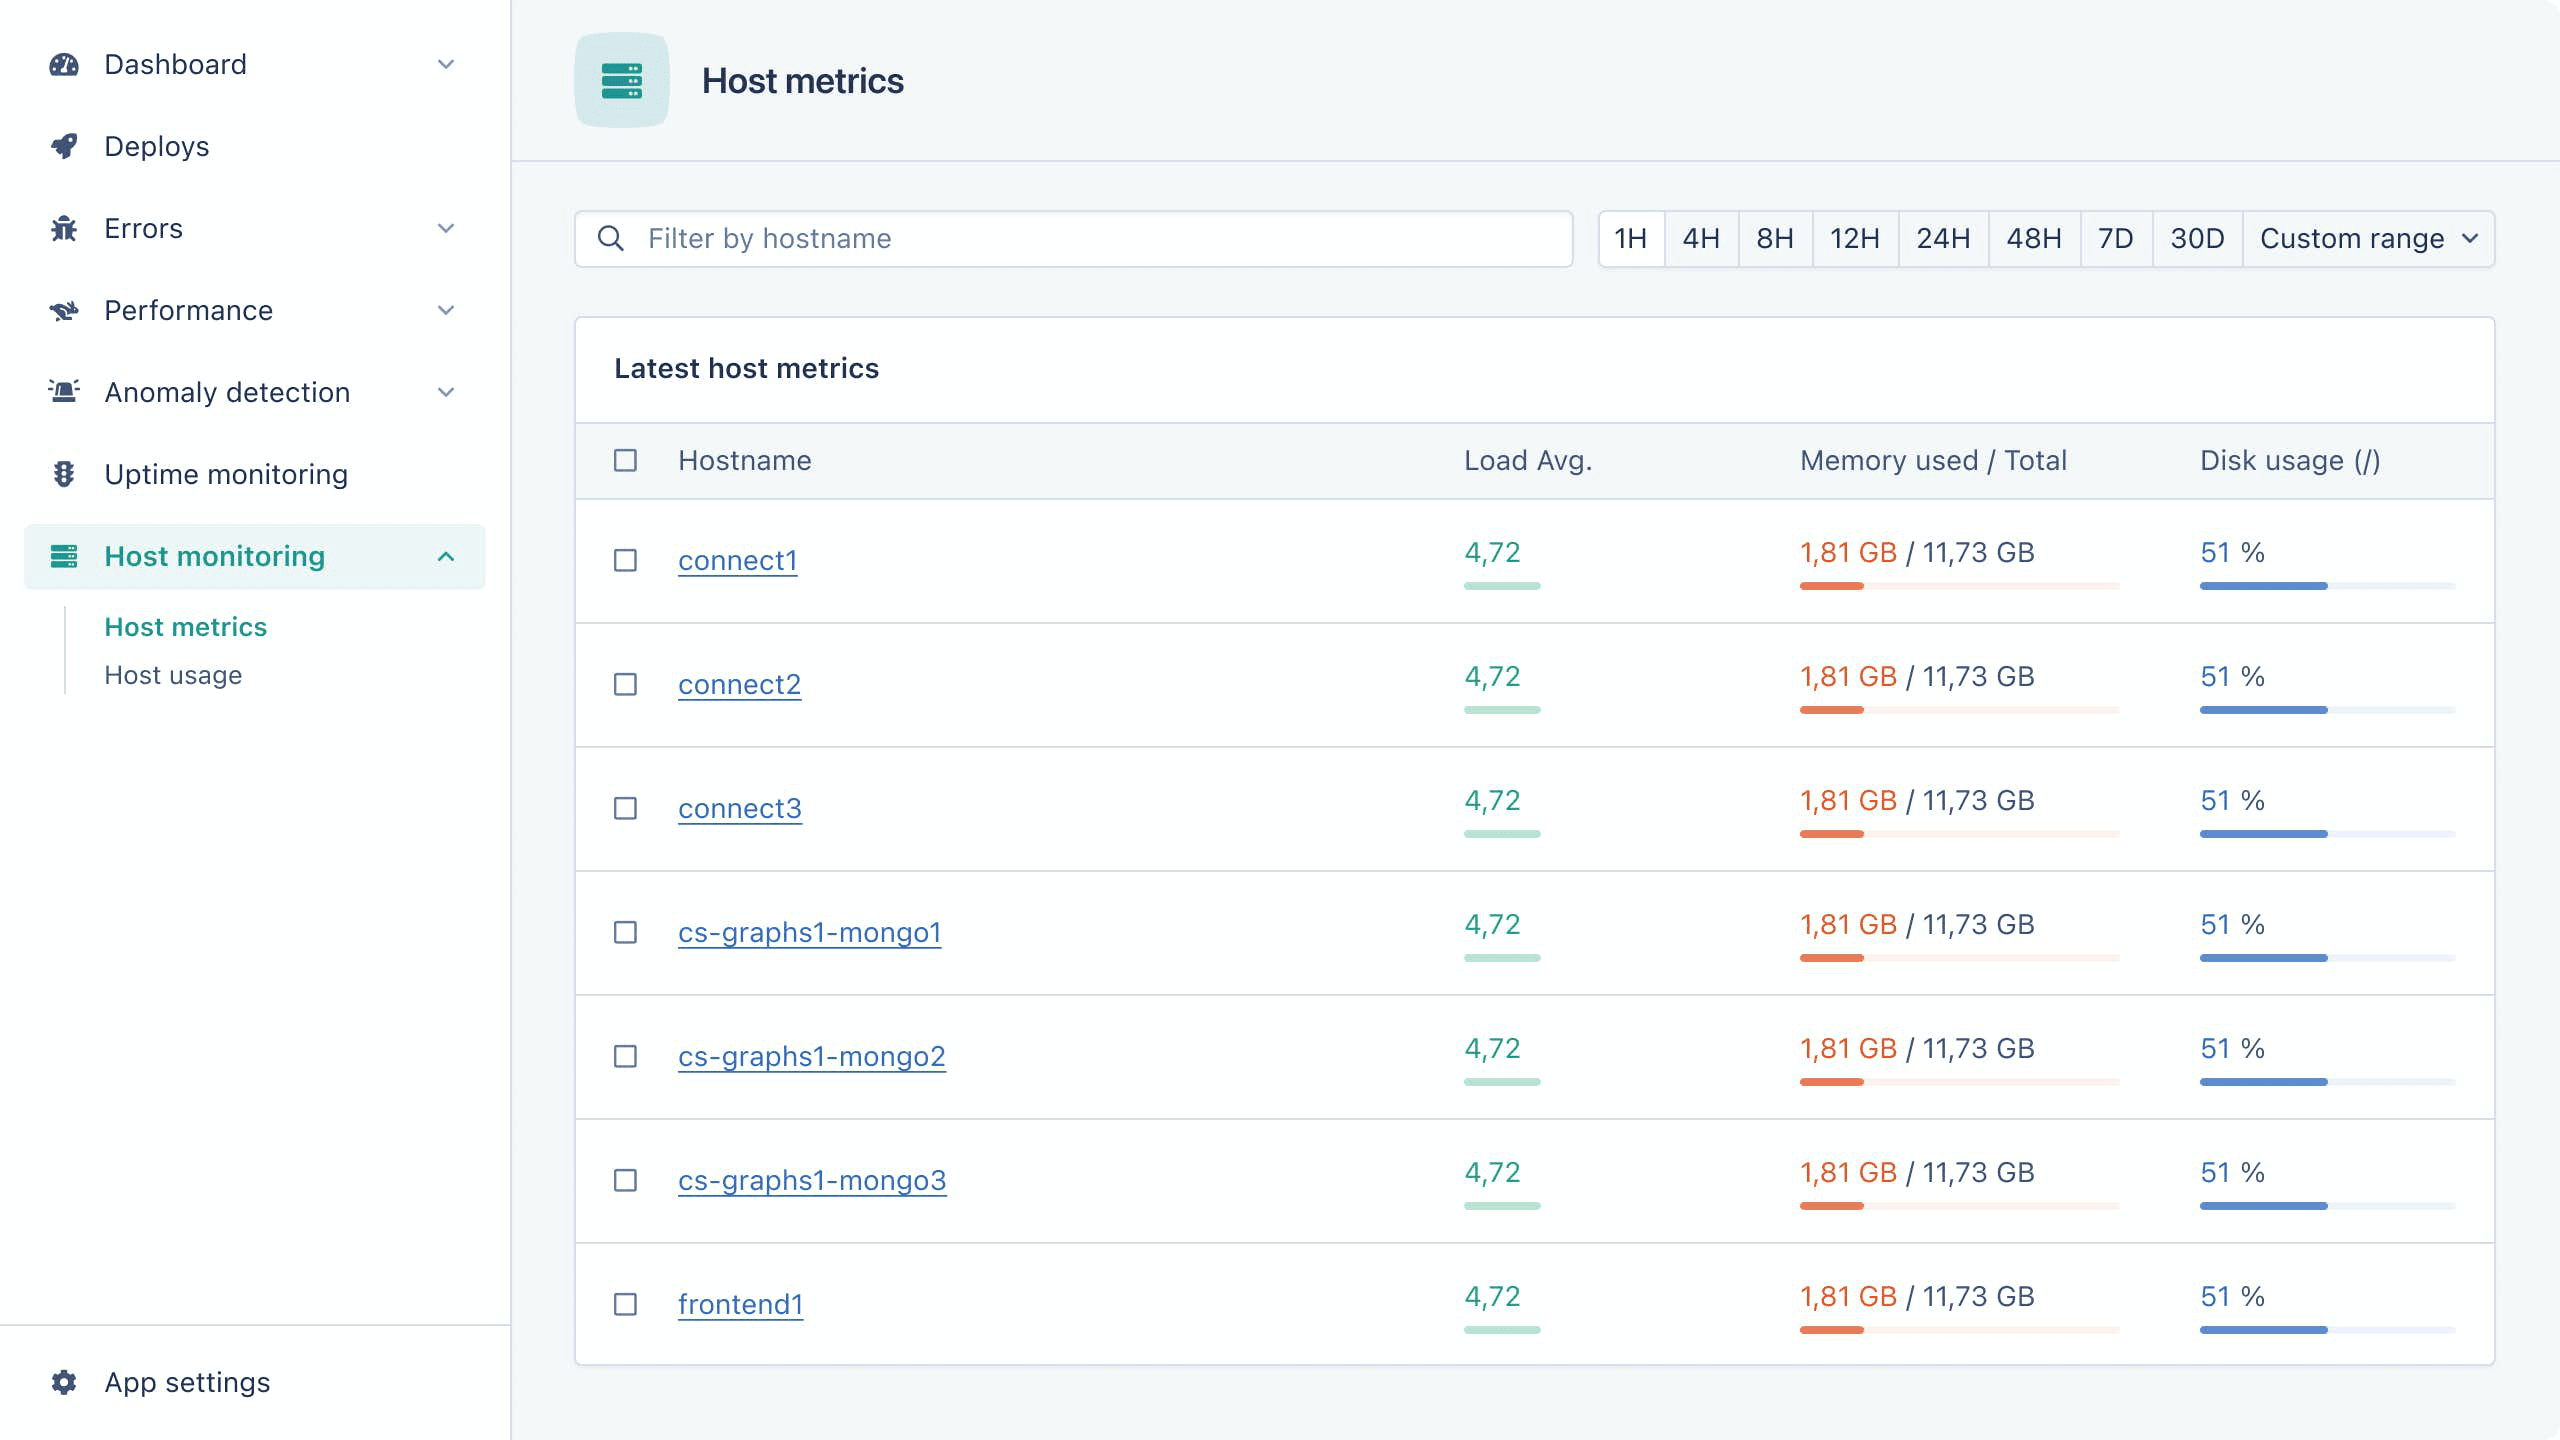
You can use this table alongside a host
monitoring service like AppSignal to give you a complete
picture of your application and its host environment:
$ pm2 list
┌─────┬───────────┬─────────────┬─────────┬─────────┬──────────┬────────┬──────┬───────────┬──────────┬──────────┬──────────┬──────────┐
│ id  │ name      │ namespace   │ version │ mode    │ pid      │ uptime │ ↺    │ status    │ cpu      │ mem      │ user     │ watching │
├─────┼───────────┼─────────────┼─────────┼─────────┼──────────┼────────┼──────┼───────────┼──────────┼──────────┼──────────┼──────────┤
│ 0   │ app       │ default     │ 1.0.0   │ fork    │ 16573    │ 9m     │ 0    │ online    │ 0%       │ 57.3mb   │ ayo      │ disabled │
│ 2   │ index     │ default     │ 1.0.0   │ fork    │ 0        │ 0      │ 16   │ errored   │ 0%       │ 0b       │ ayo      │ disabled │
│ 1   │ server    │ default     │ 0.1.0   │ fork    │ 17471    │ 71s    │ 0    │ online    │ 0%       │ 77.5mb   │ ayo      │ disabled │
└─────┴───────────┴─────────────┴─────────┴─────────┴──────────┴────────┴──────┴───────────┴──────────┴──────────┴──────────┴──────────┘
If you see only a subset of this information, try enlarging your terminal
window. The list subcommand will not display all the columns if your terminal
window is too small. You can also sort the output table according to a metric of
your choice:
$ pm2 list --sort [name|id|pid|memory|cpu|status|uptime][:asc|desc]
# such as
$ pm2 list --sort uptime:desc
If you require more information about a particular app beyond what list
provides, use the show subcommand and pass the app name to view more
detailed application process metadata. Some of the metrics and data
presented in the output include the app’s:
- output and error log files
- heap size and usage
- event loop latency
- uptime
- number of restarts
- source control metadata
and more.
$ pm2 show server
Describing process with id 1 - name server
┌───────────────────┬──────────────────────────────────────────────────┐
│ status │ online │
│ name │ server │
│ namespace │ default │
│ version │ 0.1.0 │
│ restarts │ 0 │
│ uptime │ 60m │
│ script path │ /home/ayo/dev/demo/analytics-dashboard/server.js │
│ script args │ N/A │
│ error log path │ /home/ayo/.pm2/logs/server-error.log │
│ out log path │ /home/ayo/.pm2/logs/server-out.log │
│ pid path │ /home/ayo/.pm2/pids/server-1.pid │
│ interpreter │ node │
│ interpreter args │ N/A │
│ script id │ 1 │
│ exec cwd │ /home/ayo/dev/demo/analytics-dashboard │
│ exec mode │ fork_mode │
│ node.js version │ 17.0.0 │
│ node env │ N/A │
│ watch & reload │ ✘ │
│ unstable restarts │ 0 │
│ created at │ 2021-12-03T08:33:01.489Z │
└───────────────────┴──────────────────────────────────────────────────┘
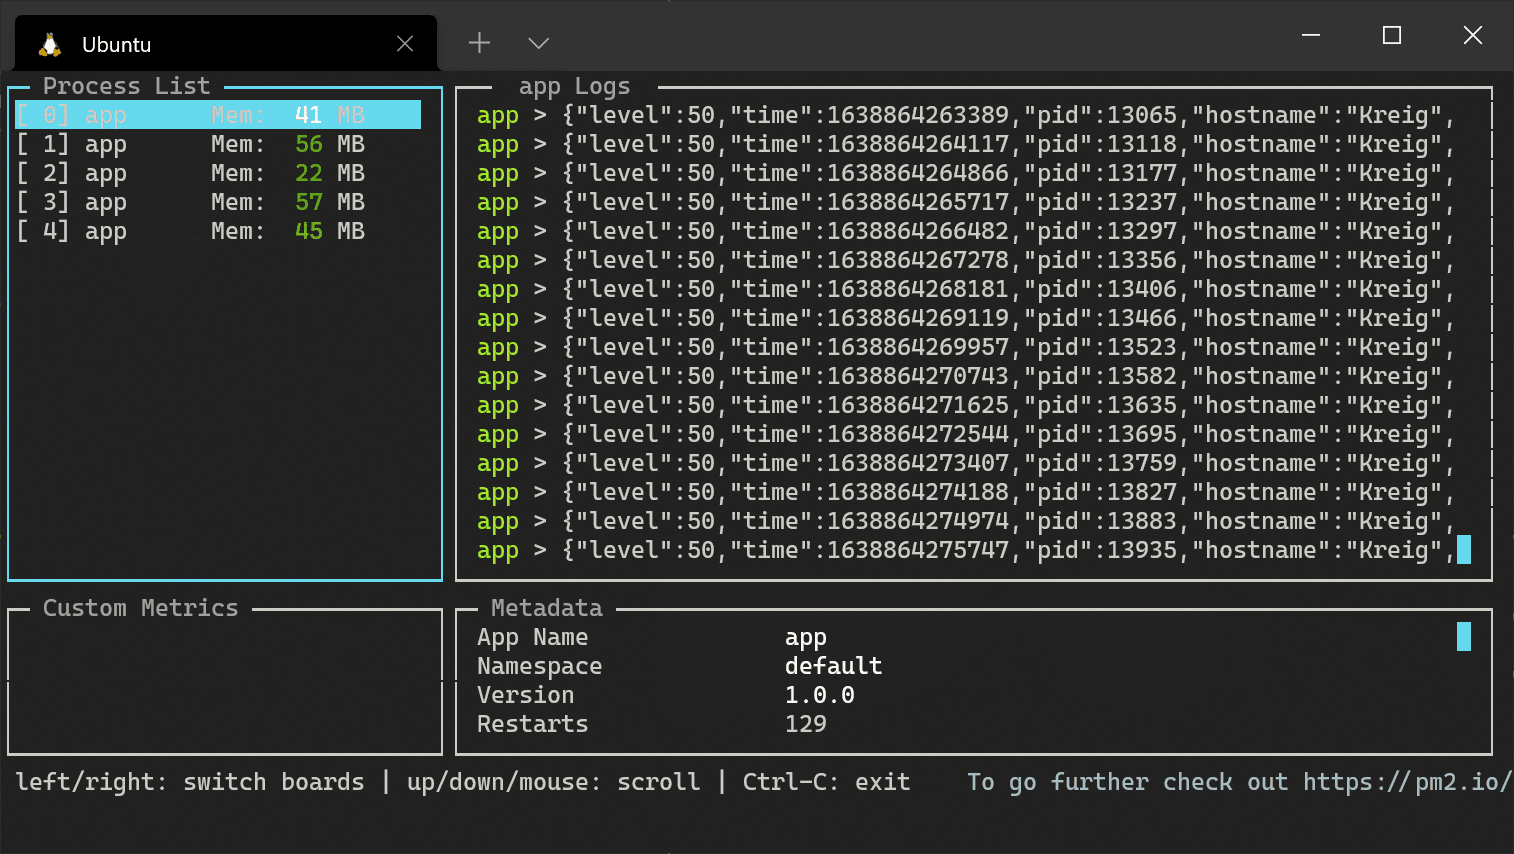
. . .Another way to keep tabs on your running applications is through the built-in
terminal dashboard (accessed through the monit subcommand). This allows
you to view live data on resource usage and logs for each of your applications.
Restarting Your Node.js Application with PM2
PM2 allows you to configure several different strategies for how your
Node.js application should restart. By default, it restarts your application if it exits
or crashes to minimize the impact to your customers in production while the
source of the crash is investigated. The restart subcommand is also
available for manually restarting your application at any time.
To ensure a graceful shutdown, make sure you intercept the SIGINT signal to
stop all new requests and finish up existing ones before allowing your program
to exit.
process.on('SIGINT', function() {
   gracefulShutdown((err) => {
     process.exit(err ? 1 : 0)
   });
})
You can use the --kill-timeout option to ensure that a graceful shutdown does
not take too long:
$ pm2 restart app --kill-timeout 5000 # set a 5 second limitAuto Restart Based on Memory Usage
The --max-memory-restart option is available to restart an app when it
reaches a certain memory threshold. This can help prevent a Node.js heap out of
memory error. You can specify the memory limit in kilobytes
(K), Megabytes (M), or Gigabytes (G).
$ pm2 start app.js --max-memory-restart 1GAuto Restart Based on Cron Schedule
PM2 also offers a restart strategy based on the Cron
syntax.
This allows you to schedule a restart at a specific time each day / on certain days of the
week / a set time interval (such as every 48 hours).
# Restart at 12:00 pm every day
$ pm2 start app.js --cron-restart="0 12 * * *"
Auto Restart on File Change
Remember how pm2-dev auto-restarts your application when you make changes to a file? You can
configure the pm2 command to act in a similar manner through the --watch
subcommand. In the table outputted by pm2 list, look at the watching column to observe the watch status of an application.
$ pm2 start app.js --watchAuto Restart after a Delay
You can configure the --restart-delay option to set a delay for automatic
restarts. The delay should be supplied in milliseconds.
$ pm2 start app.js --restart-delay=5000 # 5s delayIgnore Some Exit Codes When Auto Restarting
PM2 auto-restarts your app when the process exits, but it does not take the exit
code into account by default, so it
restarts regardless of whether the app exits cleanly or crashes. If this
behavior is not desired, you can use the --stop-exit-codes option to set exit
codes that should not prompt PM2 to auto-restart. For example, you can ensure
PM2 does not auto-restart on a clean exit with the following command:
$ pm2 start app.js --stop-exit-codes 0Restarting Processes after a System Reboot
The previous section covered a variety of ways to restart your application after
it is launched. However, none of the strategies there will keep
your application up if your server reboots. Notably, PM2 ships with a
startup feature that can help solve
this problem. You can combine this with a good uptime monitoring
service like AppSignal’s to guarantee that
your application comes back online quickly, even if an accident happens.
You’ll need to generate a startup script for your server’s init system to execute on system boot and launch the PM2 process, which will
subsequently start the configured application processes immediately. You can
allow PM2 to autodetect your startup script or pass the init system used by
your operating system, which could be systemd, upstart, launchd, rcd, or
systemv.
$ pm2 startup # autodetect init system
# or
$ pm2 startup systemd # generate script for systemd
You should receive the following output:
[PM2] Init System found: systemd
-----------------------------------------------------------
 PM2 detected systemd but you precised systemd
 Please verify that your choice is indeed your init system
 If you arent sure, just run : pm2 startup
-----------------------------------------------------------
[PM2] To setup the Startup Script, copy/paste the following command:
sudo env PATH=$PATH:/usr/bin /usr/local/lib/node_modules/pm2/bin/pm2 startup systemd -u ayo --hp /home/ayo
You’ll need to copy and paste the generated command into the terminal, and then
run it as the root:
$ sudo env PATH=$PATH:/usr/bin /usr/local/lib/node_modules/pm2/bin/pm2 startup <distribution> -u <user> --hp <home-path>If everything goes well, you’ll see the following output, indicating that
PM2 is configured to start at boot.
[PM2] Init System found: systemd

. . .

[PM2] [v] Command successfully executed.
+---------------------------------------+
[PM2] Freeze a process list on reboot via:
$ pm2 save

[PM2] Remove init script via:
$ pm2 unstartup systemd
At this point, you can run pm2 save to save your process list. This saves the
processes currently managed by PM2 to disk so they’re accessible to the
daemon on system boot.
$ pm2 save
[PM2] Saving current process list...
[PM2] Successfully saved in /home/<user>/.pm2/dump.pm2
Go ahead and restart your computer or server. Once it boots back up, run
pm2 list to see if all the processes are restored. If PM2 doesn’t restore
them automatically, you can manually relaunch them with the resurrect
subcommand. You then won’t need to start each process individually.
$ pm2 resurrect
[PM2] Resurrecting
[PM2] Restoring processes located in /home/<user>/.pm2/dump.pm2
At any point in the future, you can run pm2 save again to update the list of
processes that should be restored on boot or when using the resurrect
subcommand.
Clustering with PM2
Clustering in
Node.js
refers to creating child processes that run
simultaneously and share the same port in an application. This technique makes it possible to
horizontally scale a Node.js application on a single machine, taking advantage
of the processing capabilities offered by multi-core systems (since an instance
of a Node.js app only runs on a single thread).
The
standard Node.js library provides a cluster module to set up clustering in Node.js applications. In a
nutshell, it creates child processes (workers) and distributes incoming
connections across the simultaneously running worker processes. You’ll need to
modify your source code to spawn and manage the workers and
set up how you’d like to distribute incoming connections amongst them.
PM2 also provides a cluster mode that uses the native cluster module under the
hood. However, it does not require any modifications to the application’s source
code. Instead, all you need to do to start a Node.js program in cluster mode is
to supply the -i option to the start subcommand, as follows:
$ pm2 start app.js -i 0
┌────┬────────────────────┬──────────┬──────┬───────────┬──────────┬──────────┐
│ id │ name               │ mode     │ ↺    │ status    │ cpu      │ memory   │
├────┼────────────────────┼──────────┼──────┼───────────┼──────────┼──────────┤
│ 0  │ app                │ cluster  │ 0    │ online    │ 0%       │ 49.0mb   │
│ 1  │ app                │ cluster  │ 0    │ online    │ 0%       │ 46.8mb   │
│ 2  │ app                │ cluster  │ 0    │ online    │ 0%       │ 44.8mb   │
│ 3  │ app                │ cluster  │ 0    │ online    │ 0%       │ 42.2mb   │
└────┴────────────────────┴──────────┴──────┴───────────┴──────────┴──────────┘
The -i or instances option above allows you to specify the number of workers
(child processes) that PM2 should launch. You can set 0 or max
to specify that PM2 should spawn as many workers as the number of available CPU
cores (as above). Alternatively, you can set the exact number of workers to be
greater than the number of available CPU cores, if desired. If you want to add
additional worker processes on the fly, use the scale subcommand as shown
below:
$ pm2 scale <app_name> +4 # add 4 additional workers in realtimeOnce your application launches in cluster mode, incoming requests to the
server will be automatically load-balanced across all the worker processes, which
can significantly improve throughput. This feature also enables you to restart
your app in production (using pm2 restart) without suffering any downtime
since PM2 waits for the new workers to become operational before it kills the
old ones.
PM2’s clustering feature works best when your application is completely
stateless. You won’t need any code
modifications to scale on the same server or even across multiple servers if
your app doesn’t maintain any state in individual processes. If your application
isn’t stateless, you’ll likely get better results directly using the native cluster
module.
Log Management in PM2
Log management is quite straightforward in PM2. The logs for all your running
applications are placed in the ~/.pm2/logs directory, and they can be
displayed with the logs subcommand. All log entries are prefixed with the application’s name to ensure easy identification.
$ pm2 logs # display all logs in realtime
$ pm2 logs <app_name> # display only a specific app's logs
You can also clear log data with the flush subcommand:
$ pm2 flush # clear all log data
$ pm2 flush <app_name> # flush log data for a specific app
To enable log rotation, install the following module:
$ pm2 install pm2-logrotateWrap Up and Next Steps: Dive Further into PM2
I hope this article has helped to crystallize the importance of process
management in Node.js applications and how to leverage PM2’s robust feature set
to manage your application efficiently.
PM2 offers other capabilities that were
not covered in this article such as Docker integration, a JavaScript API, and a
daemon-less mode, so ensure you check out
PM2’s documentation to learn more
about these advanced features.
Thanks for reading, and happy coding!
P.S. If you liked this post, subscribe to our JavaScript Sorcery list for a monthly deep dive into more magical JavaScript tips and tricks.
P.P.S. If you need an APM for your Node.js app, go and check out the AppSignal APM for Node.js.