Коэффициенты Стьюдента
- Коэффициенты Стьюдента
-
Кванти́ли (проценти́ли) распределе́ния Стью́дента (коэффициенты Стьюдента) — числовые характеристики, широко используемые в задачах математической статистики таких как построение доверительных интервалов и проверка статистических гипотез.
Содержание
- 1 Определение
- 2 Замечания
- 3 Таблица квантилей
- 3.1 Пример
- 4 См. также
Определение
Пусть Fn — функция распределения Стьюдента t(n) с n степенями свободы, и
. Тогда α-квантилью этого распределения называется число tα,n такое, что
.
Замечания
.
- Функция
не имеет простого представления. Однако, возможно вычислить её значения численно.
- Распределение t(n) симметрично. Следовательно,
- t1 − α,n = − tα,n.
Таблица квантилей
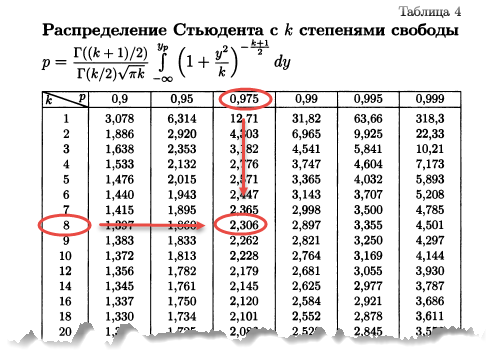
Нижеприведённая таблица получена с помощью функции tinv пакета tα,n, необходимо найти строку, соответствующую нужному n, и колонку, соответствующую нужному α. Искомое число находится в таблице на их пересечении.
Пример
- t0.2,4 = 0.2707;
- t0.8,4 = − t0.2,4 = − 0.2707.
См. также
- Распределение Стьюдента;
- Доверительный интервал для математического ожидания нормальной выборки.
Квантили tα,n
two-tailed test 1-0.9/2 1-0.8/2 1-0.7/2 1-0.6/2 1-0.5/2 1-0.4/2 1-0.3/2 1-0.2/2 1-0.1/2 1-0.05/2 1-0.02/2 one-tailed test 1-0.9 1-0.8 1-0.7 1-0.6 1-0.5 1-0.4 1-0.3 1-0.2 1-0.1 1-0.05 1-0.02 1 0.1584 0.3249 0.5095 0.7265 1.0000 1.3764 1.9626 3.0777 6.3138 12.7062 31.8205 2 0.1421 0.2887 0.4447 0.6172 0.8165 1.0607 1.3862 1.8856 2.9200 4.3027 6.9646 3 0.1366 0.2767 0.4242 0.5844 0.7649 0.9785 1.2498 1.6377 2.3534 3.1824 4.5407 4 0.1338 0.2707 0.4142 0.5686 0.7407 0.9410 1.1896 1.5332 2.1318 2.7764 3.7469 5 0.1322 0.2672 0.4082 0.5594 0.7267 0.9195 1.1558 1.4759 2.0150 2.5706 3.3649 6 0.1311 0.2648 0.4043 0.5534 0.7176 0.9057 1.1342 1.4398 1.9432 2.4469 3.1427 7 0.1303 0.2632 0.4015 0.5491 0.7111 0.8960 1.1192 1.4149 1.8946 2.3646 2.9980 8 0.1297 0.2619 0.3995 0.5459 0.7064 0.8889 1.1081 1.3968 1.8595 2.3060 2.8965 9 0.1293 0.2610 0.3979 0.5435 0.7027 0.8834 1.0997 1.3830 1.8331 2.2622 2.8214 10 0.1289 0.2602 0.3966 0.5415 0.6998 0.8791 1.0931 1.3722 1.8125 2.2281 2.7638 11 0.1286 0.2596 0.3956 0.5399 0.6974 0.8755 1.0877 1.3634 1.7959 2.2010 2.7181 12 0.1283 0.2590 0.3947 0.5386 0.6955 0.8726 1.0832 1.3562 1.7823 2.1788 2.6810 13 0.1281 0.2586 0.3940 0.5375 0.6938 0.8702 1.0795 1.3502 1.7709 2.1604 2.6503 14 0.1280 0.2582 0.3933 0.5366 0.6924 0.8681 1.0763 1.3450 1.7613 2.1448 2.6245 15 0.1278 0.2579 0.3928 0.5357 0.6912 0.8662 1.0735 1.3406 1.7531 2.1314 2.6025 16 0.1277 0.2576 0.3923 0.5350 0.6901 0.8647 1.0711 1.3368 1.7459 2.1199 2.5835 17 0.1276 0.2573 0.3919 0.5344 0.6892 0.8633 1.0690 1.3334 1.7396 2.1098 2.5669 18 0.1274 0.2571 0.3915 0.5338 0.6884 0.8620 1.0672 1.3304 1.7341 2.1009 2.5524 19 0.1274 0.2569 0.3912 0.5333 0.6876 0.8610 1.0655 1.3277 1.7291 2.0930 2.5395 20 0.1273 0.2567 0.3909 0.5329 0.6870 0.8600 1.0640 1.3253 1.7247 2.0860 2.5280 21 0.1272 0.2566 0.3906 0.5325 0.6864 0.8591 1.0627 1.3232 1.7207 2.0796 2.5176 22 0.1271 0.2564 0.3904 0.5321 0.6858 0.8583 1.0614 1.3212 1.7171 2.0739 2.5083 23 0.1271 0.2563 0.3902 0.5317 0.6853 0.8575 1.0603 1.3195 1.7139 2.0687 2.4999 24 0.1270 0.2562 0.3900 0.5314 0.6848 0.8569 1.0593 1.3178 1.7109 2.0639 2.4922 25 0.1269 0.2561 0.3898 0.5312 0.6844 0.8562 1.0584 1.3163 1.7081 2.0595 2.4851 26 0.1269 0.2560 0.3896 0.5309 0.6840 0.8557 1.0575 1.3150 1.7056 2.0555 2.4786 27 0.1268 0.2559 0.3894 0.5306 0.6837 0.8551 1.0567 1.3137 1.7033 2.0518 2.4727 28 0.1268 0.2558 0.3893 0.5304 0.6834 0.8546 1.0560 1.3125 1.7011 2.0484 2.4671 29 0.1268 0.2557 0.3892 0.5302 0.6830 0.8542 1.0553 1.3114 1.6991 2.0452 2.4620 30 0.1267 0.2556 0.3890 0.5300 0.6828 0.8538 1.0547 1.3104 1.6973 2.0423 2.4573 31 0.1267 0.2555 0.3889 0.5298 0.6825 0.8534 1.0541 1.3095 1.6955 2.0395 2.4528 32 0.1267 0.2555 0.3888 0.5297 0.6822 0.8530 1.0535 1.3086 1.6939 2.0369 2.4487 33 0.1266 0.2554 0.3887 0.5295 0.6820 0.8526 1.0530 1.3077 1.6924 2.0345 2.4448 34 0.1266 0.2553 0.3886 0.5294 0.6818 0.8523 1.0525 1.3070 1.6909 2.0322 2.4411 35 0.1266 0.2553 0.3885 0.5292 0.6816 0.8520 1.0520 1.3062 1.6896 2.0301 2.4377 36 0.1266 0.2552 0.3884 0.5291 0.6814 0.8517 1.0516 1.3055 1.6883 2.0281 2.4345 37 0.1265 0.2552 0.3883 0.5289 0.6812 0.8514 1.0512 1.3049 1.6871 2.0262 2.4314 38 0.1265 0.2551 0.3882 0.5288 0.6810 0.8512 1.0508 1.3042 1.6860 2.0244 2.4286 39 0.1265 0.2551 0.3882 0.5287 0.6808 0.8509 1.0504 1.3036 1.6849 2.0227 2.4258 40 0.1265 0.2550 0.3881 0.5286 0.6807 0.8507 1.0500 1.3031 1.6839 2.0211 2.4233 41 0.1264 0.2550 0.3880 0.5285 0.6805 0.8505 1.0497 1.3025 1.6829 2.0195 2.4208 42 0.1264 0.2550 0.3880 0.5284 0.6804 0.8503 1.0494 1.3020 1.6820 2.0181 2.4185 43 0.1264 0.2549 0.3879 0.5283 0.6802 0.8501 1.0491 1.3016 1.6811 2.0167 2.4163 44 0.1264 0.2549 0.3878 0.5282 0.6801 0.8499 1.0488 1.3011 1.6802 2.0154 2.4141 45 0.1264 0.2549 0.3878 0.5281 0.6800 0.8497 1.0485 1.3006 1.6794 2.0141 2.4121 46 0.1264 0.2548 0.3877 0.5281 0.6799 0.8495 1.0483 1.3002 1.6787 2.0129 2.4102 47 0.1263 0.2548 0.3877 0.5280 0.6797 0.8493 1.0480 1.2998 1.6779 2.0117 2.4083 48 0.1263 0.2548 0.3876 0.5279 0.6796 0.8492 1.0478 1.2994 1.6772 2.0106 2.4066 49 0.1263 0.2547 0.3876 0.5278 0.6795 0.8490 1.0475 1.2991 1.6766 2.0096 2.4049 50 0.1263 0.2547 0.3875 0.5278 0.6794 0.8489 1.0473 1.2987 1.6759 2.0086 2.4033 100 0.1260 0.2540 0.3864 0.5261 0.6770 0.8452 1.0418 1.2901 1.6602 1.9840 2.3642 1000 0.1257 0.2534 0.3854 0.5246 0.6747 0.8420 1.0370 1.2824 1.6464 1.9623 2.3301
Wikimedia Foundation.
2010.
Полезное
Смотреть что такое «Коэффициенты Стьюдента» в других словарях:
-
Процентили распределения Стьюдента — Квантили (процентили) распределения Стьюдента (коэффициенты Стьюдента) числовые характеристики, широко используемые в задачах математической статистики таких как построение доверительных интервалов и проверка статистических гипотез. Содержание 1 … Википедия
-
Квантили распределения Стьюдента — Квантили (процентили) распределения Стьюдента (коэффициенты Стьюдента) числовые характеристики, широко используемые в задачах математической статистики таких как построение доверительных интервалов и проверка статистических гипотез.… … Википедия
-
Коэффициент корреляции — (Correlation coefficient) Коэффициент корреляции это статистический показатель зависимости двух случайных величин Определение коэффициента корреляции, виды коэффициентов корреляции, свойства коэффициента корреляции, вычисление и применение… … Энциклопедия инвестора
-
Корреляция — (Correlation) Корреляция это статистическая взаимосвязь двух или нескольких случайных величин Понятие корреляции, виды корреляции, коэффициент корреляции, корреляционный анализ, корреляция цен, корреляция валютных пар на Форекс Содержание… … Энциклопедия инвестора
-
Наименьших квадратов метод — один из методов ошибок теории (См. Ошибок теория) для оценки неизвестных величин по результатам измерений, содержащим случайные ошибки. Н. к. м. применяется также для приближённого представления заданной функции другими (более простыми)… … Большая советская энциклопедия
-
Математи́ческие ме́тоды — в медицине совокупность методов количественного изучения и анализа состояния и (или) поведения объектов и систем, относящихся к медицине и здравоохранению. В биологии, медицине и здравоохранении в круг явлений, изучаемых с помощью М.м., входят… … Медицинская энциклопедия
-
НАИМЕНЬШИХ КВАДРАТОВ МЕТОД — один из методов ошибок теории для оценки неизвестных величин по результатам измерений, содержащим случайные ошибки. Н. к. м. применяется также для приближенного представления заданной функции другими (более простыми) функциями и часто оказывается … Математическая энциклопедия
-
РДМУ 109-77: Методические указания. Методика выбора и оптимизации контролируемых параметров технологических процессов — Терминология РДМУ 109 77: Методические указания. Методика выбора и оптимизации контролируемых параметров технологических процессов: 73. Адекватность модели Соответствие модели с экспериментальными данными по выбранному параметру оптимизации с… … Словарь-справочник терминов нормативно-технической документации
-
ГОСТ Р 50779.10-2000: Статистические методы. Вероятность и основы статистики. Термины и определения — Терминология ГОСТ Р 50779.10 2000: Статистические методы. Вероятность и основы статистики. Термины и определения оригинал документа: 2.3. (генеральная) совокупность Множество всех рассматриваемых единиц. Примечание Для случайной величины… … Словарь-справочник терминов нормативно-технической документации
-
Нахождение дисперсии ошибки определения коэффициента регрессии — 3.9.3. Нахождение дисперсии ошибки определения коэффициента регрессии При равном числе параллельных опытов (m0) во всех точках плана матрицы дисперсию ошибки определения коэффициента регрессии определяют по формуле… … Словарь-справочник терминов нормативно-технической документации
В отличие от критериев
Розенбаума и Манна-Уитни критерий t
Стьюдента является параметрическим,
т. е. основан на определении основных
статистических показателей – средних
значений в каждой выборке (и
)
и их дисперсий (s2x
и s2y),
рассчитываемых по стандартным формулам
(см. раздел 5).
Использование критерия
Стьюдента предполагает соблюдение
следующих условий:
-
Распределения значений
для обеих выборок должны соответствовать
закону нормального распределения (см.
раздел 6). -
Суммарный объем выборок
должен быть не менее 30 (для β1
= 0,95) и не менее 100 (для β2
= 0,99). -
Объемы двух выборок
не должны существенно отличаться друг
от друга (не более чем в 1,5 ÷ 2 раза).
Идея критерия Стьюдента
достаточно проста. Предположим, что
значения переменных в каждой из выборок
распределяются по нормальному закону,
т. е. мы имеем дело с двумя нормальными
распределениями, отличающимися друг
от друга по средним значениям и дисперсии
(соответственно
и
,
и
,
см. рис. 7.1).
sx
sy
Рис.
7.1. Оценка различий между двумя независимыми
выборками:
и
—
средние значения выборок x
и y;
sx
и sy
—
стандартные отклонения
Нетрудно понять, что
различия между двумя выборками будут
тем больше, чем больше разность между
средними значениями и чем меньше их
дисперсии (или стандартные отклонения).
В
случае независимых выборок коэффициент
Стьюдента определяют по формуле:
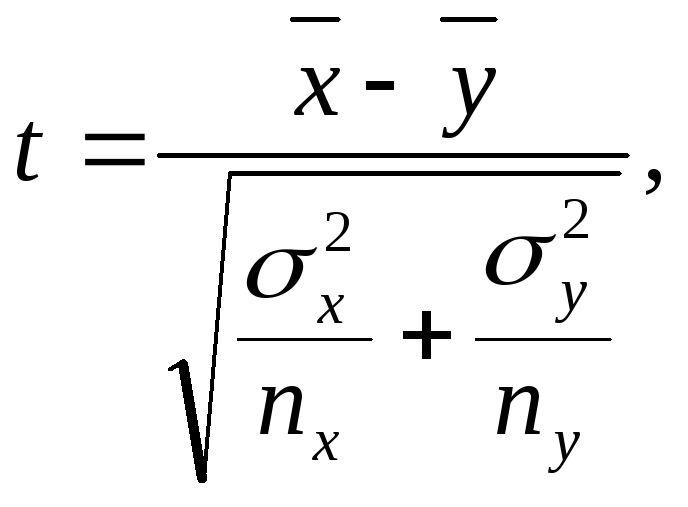
где nx
и ny
– соответственно численность выборок
x
и y.
После вычисления
коэффициента Стьюдента в таблице
стандартных (критических) значений t
(см. Приложение, табл. Х) находят величину,
соответствующую числу степеней свободы
n
= nx
+ ny
– 2, и сравнивают
ее с рассчитанной по формуле. Если tэксп.
£
tкр.,
то гипотезу о достоверности различий
между выборками отвергают, если же
tэксп.
> tкр.,
то ее принимают. Другими словами, выборки
достоверно отличаются друг от друга,
если вычисленный по формуле коэффициент
Стьюдента больше табличного значения
для соответствующего уровня значимости.
В рассмотренной нами
ранее задаче вычисление средних значений
и дисперсий дает следующие значения:
xср.
= 38,5; σх2
= 28,40; уср.
= 36,2; σу2
= 31,72.
Можно видеть, что
среднее значение тревожности в группе
девушек выше, чем в группе юношей. Тем
не менее эти различия настолько
незначительны, что вряд ли они являются
статистически значимыми. Разброс
значений у юношей, напротив, несколько
выше, чем у девушек, но различия между
дисперсиями также невелики.
Подставляем
значения в формулу:
Вывод
tэксп.
= 1,14 < tкр.
= 2,05 (β1
= 0,95). Различия между двумя сравниваемыми
выборками не являются статистически
достоверными. Данный вывод вполне
согласуется с таковым, полученным при
использовании критериев Розенбаума и
Манна-Уитни.
Другой
способ определения различий между двумя
выборками по критерию Стьюдента состоит
в вычислении доверительного интервала
стандартных отклонений. Доверительным
интервалом называется среднеквадратичное
(стандартное) отклонение, деленное на
корень квадратный из объема выборки и
умноженное на стандартное значение
коэффициента Стьюдента для n
– 1 степеней свободы (соответственно,
и
).
Примечание
Величина
=mx
называется
среднеквадратичной ошибкой (см. раздел
5). Следовательно, доверительный интервал
есть среднеквадратичная ошибка,
умноженная на коэффициент Стьюдента
для данного объема выборки, где число
степеней свободы ν = n
– 1, и заданного уровня значимости.
Две
независимые друг от друга выборки
считаются достоверно различающимися,
если доверительные интервалы для этих
выборок не перекрываются друг с другом.
В нашем случае мы имеем для первой
выборки 38,5 ± 2,84, для второй 36,2 ± 3,38.
Следовательно,
случайные вариации xi
лежат в диапазоне 35,66 ¸
41,34, а вариации yi
– в диапазоне 32,82 ¸
39,58. На основании этого можно констатировать,
что различия между выборками x
и y
статистически недостоверны (диапазоны
вариаций перекрываются друг с другом).
При этом следует иметь в виду, что ширина
зоны перекрытия в данном случае не имеет
значения (важен лишь сам факт перекрытия
доверительных интервалов).
Метод
Стьюдента для зависимых друг от друга
выборок (например, для сравнения
результатов, полученных при повторном
тестировании на одной и той же выборке
испытуемых) используют достаточно
редко, поскольку для этих целей существуют
другие, более информативные статистические
приемы (см. раздел 10). Тем не менее, для
данной цели в первом приближении можно
использовать формулу Стьюдента следующего
вида:
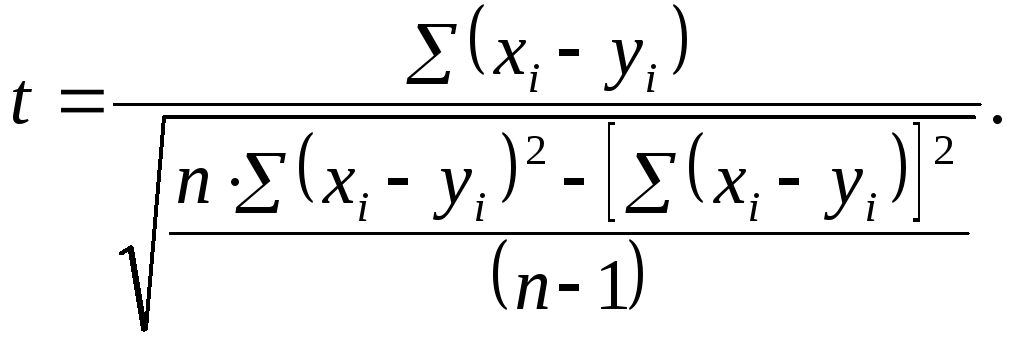
Полученный результат
сравнивают с табличным значением для
n
– 1 степеней свободы, где n
– число пар значений x
и y.
Результаты сравнения интерпретируются
точно так же, как и в случае вычисления
различий между двумя независимыми
выборками.
Соседние файлы в предмете [НЕСОРТИРОВАННОЕ]
- #
- #
23.02.201514.96 Mб37Longman_Advanced_Learners_39_Grammar.pdf
- #
- #
- #
- #
- #
- #
- #
- #
- #
This article is about the mathematics of Student’s t-distribution. For its uses in statistics, see Student’s t-test.
|
Probability density function |
|
|
Cumulative distribution function |
|
| Parameters |
 degrees of freedom (real) degrees of freedom (real) |
|---|---|
| Support |
 |
 |
|
| CDF |
where 2F1 is the hypergeometric function |
| Mean |
0 for  , otherwise undefined , otherwise undefined |
| Median | 0 |
| Mode | 0 |
| Variance |
 for for  , ∞ for , ∞ for  , otherwise undefined , otherwise undefined |
| Skewness |
0 for  , otherwise undefined , otherwise undefined |
| Ex. kurtosis |
 for for  , ∞ for , ∞ for  , otherwise undefined , otherwise undefined |
| Entropy |
|
| MGF | undefined |
| CF |
|
In probability and statistics, Student’s t-distribution (or simply the t-distribution) is any member of a family of continuous probability distributions that arise when estimating the mean of a normally distributed population in situations where the sample size is small and the population’s standard deviation is unknown. It was developed by English statistician William Sealy Gosset under the pseudonym «Student».
The t-distribution plays a role in a number of widely used statistical analyses, including Student’s t-test for assessing the statistical significance of the difference between two sample means, the construction of confidence intervals for the difference between two population means, and in linear regression analysis. Student’s t-distribution also arises in the Bayesian analysis of data from a normal family.
If we take a sample of 


The t-distribution is symmetric and bell-shaped, like the normal distribution. However, the t-distribution has heavier tails, meaning that it is more prone to producing values that fall far from its mean. This makes it useful for understanding the statistical behavior of certain types of ratios of random quantities, in which variation in the denominator is amplified and may produce outlying values when the denominator of the ratio falls close to zero. The Student’s t-distribution is a special case of the generalized hyperbolic distribution.
History and etymology[edit]
Statistician William Sealy Gosset, known as «Student»
In statistics, the t-distribution was first derived as a posterior distribution in 1876 by Helmert[2][3][4] and Lüroth.[5][6][7] The t-distribution also appeared in a more general form as Pearson Type IV distribution in Karl Pearson’s 1895 paper.[8]
In the English-language literature, the distribution takes its name from William Sealy Gosset’s 1908 paper in Biometrika under the pseudonym «Student».[9] One version of the origin of the pseudonym is that Gosset’s employer preferred staff to use pen names when publishing scientific papers instead of their real name, so he used the name «Student» to hide his identity. Another version is that Guinness did not want their competitors to know that they were using the t-test to determine the quality of raw material.[10][11]
Gosset worked at the Guinness Brewery in Dublin, Ireland, and was interested in the problems of small samples – for example, the chemical properties of barley where sample sizes might be as few as 3. Gosset’s paper refers to the distribution as the «frequency distribution of standard deviations of samples drawn from a normal population». It became well known through the work of Ronald Fisher, who called the distribution «Student’s distribution» and represented the test value with the letter t.[12][13]
How Student’s distribution arises from sampling[edit]
Let 


Let
be the sample mean and let
be the (Bessel-corrected) sample variance. Then the random variable
has a standard normal distribution (i.e. normal with expected mean 0 and variance 1), and the random variable
i.e where 


Definition[edit]
Probability density function[edit]
Student’s t-distribution has the probability density function (PDF) given by
where 

where B is the Beta function. In particular for integer valued degrees of freedom 
For 
For 
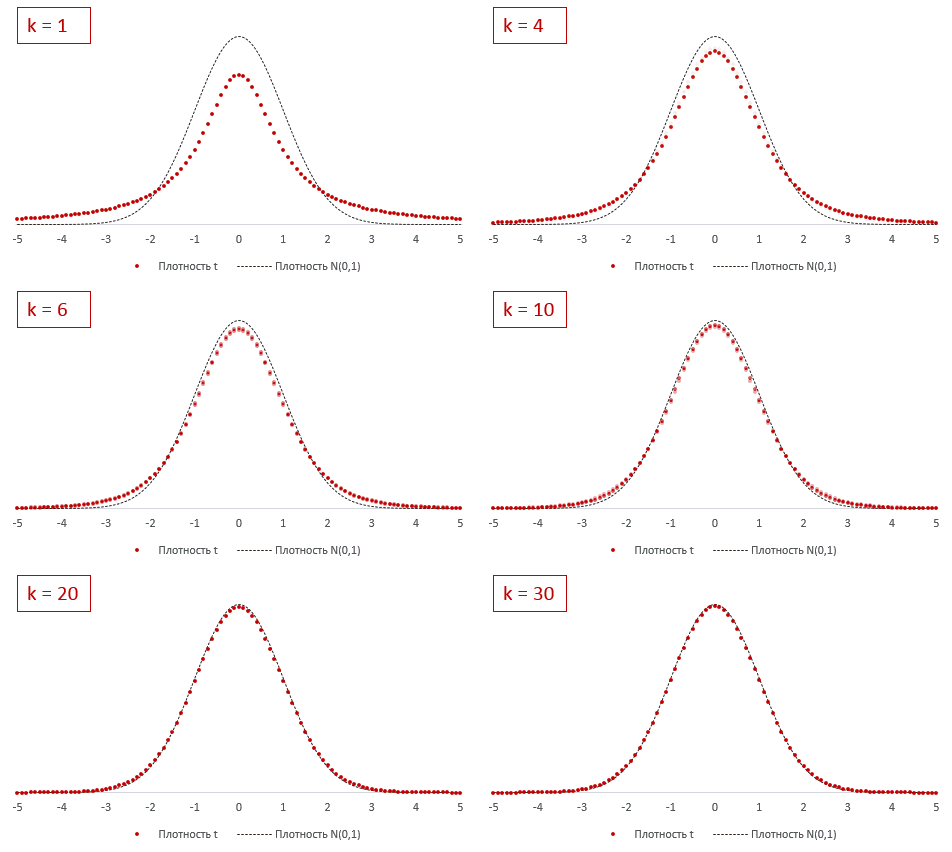
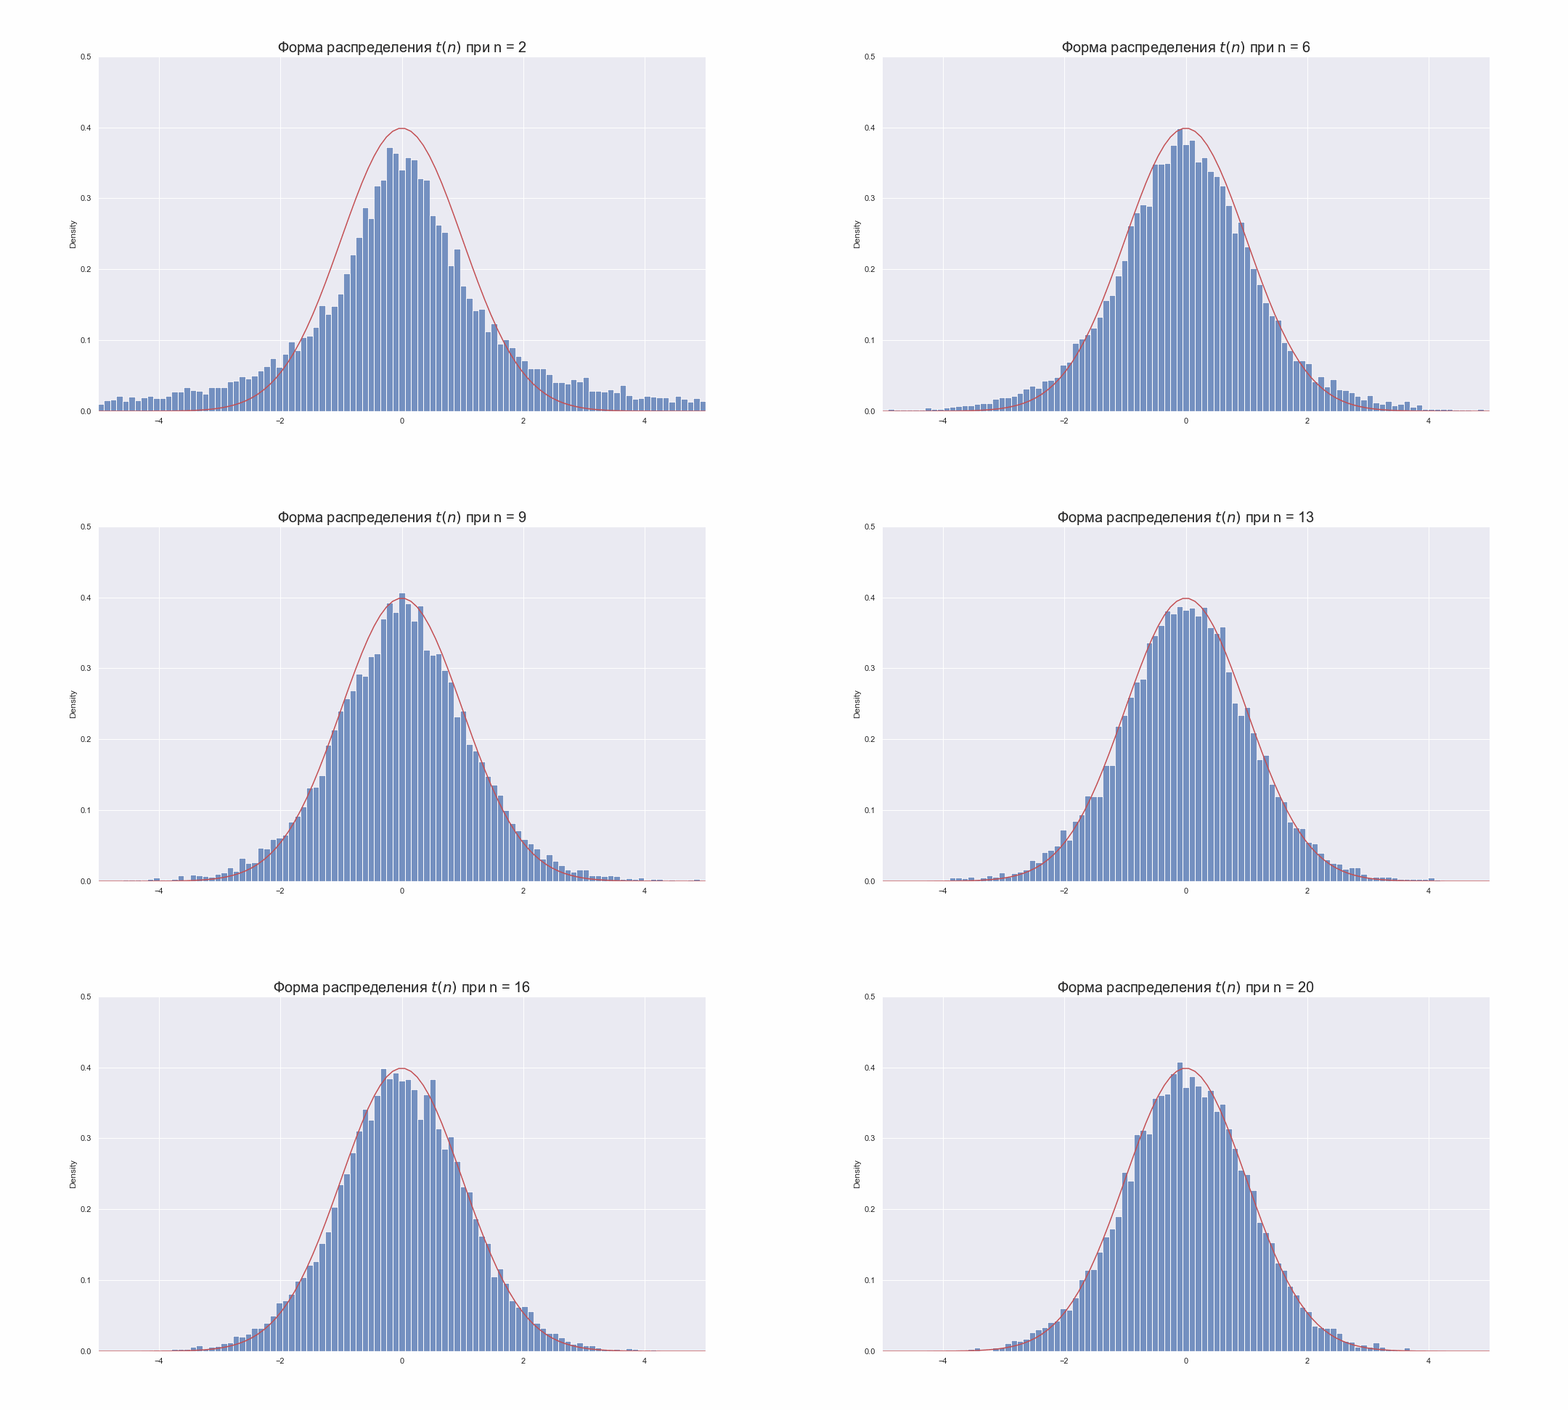
The probability density function is symmetric, and its overall shape resembles the bell shape of a normally distributed variable with mean 0 and variance 1, except that it is a bit lower and wider. As the number of degrees of freedom grows, the t-distribution approaches the normal distribution with mean 0 and variance 1. For this reason 
The following images show the density of the t-distribution for increasing values of 

1 degree of freedom
2 degrees of freedom
3 degrees of freedom
5 degrees of freedom
10 degrees of freedom
30 degrees of freedom
Cumulative distribution function[edit]
The cumulative distribution function (CDF) can be written in terms of I, the regularized
incomplete beta function. For t > 0,[15]
where
Other values would be obtained by symmetry. An alternative formula, valid for 
where 2F1 is a particular case of the hypergeometric function.
For information on its inverse cumulative distribution function, see quantile function § Student’s t-distribution.
Special cases[edit]
Certain values of 

|
CDF | notes | |
|---|---|---|---|
| 1 | 
|

|
See Cauchy distribution |
| 2 | 
|

|
|
| 3 | 
|
![{displaystyle {frac {1}{2}}+{frac {1}{pi }}{left[{frac {1}{sqrt {3}}}{frac {t}{1+{frac {t^{2}}{3}}}}+arctan left({frac {t}{sqrt {3}}}right)right]}}](https://wikimedia.org/api/rest_v1/media/math/render/svg/f0afffc07f0c86a59eaa560dc8a3cf8f6fa83ccd)
|
|
| 4 | 
|
![{displaystyle {frac {1}{2}}+{frac {3}{8}}{frac {t}{sqrt {1+{frac {t^{2}}{4}}}}}{left[1-{frac {1}{12}}{frac {t^{2}}{1+{frac {t^{2}}{4}}}}right]}}](https://wikimedia.org/api/rest_v1/media/math/render/svg/8267697404a72109b22e9add73ef7023d1953235)
|
|
| 5 | 
|
![{displaystyle {frac {1}{2}}+{frac {1}{pi }}{left[{frac {t}{{sqrt {5}}left(1+{frac {t^{2}}{5}}right)}}left(1+{frac {2}{3left(1+{frac {t^{2}}{5}}right)}}right)+arctan left({frac {t}{sqrt {5}}}right)right]}}](https://wikimedia.org/api/rest_v1/media/math/render/svg/aeef99bb2df092bdcc8c708cbc0c29cfe1849232)
|
|

|

|
![{displaystyle {frac {1}{2}}{left[1+operatorname {erf} left({frac {t}{sqrt {2}}}right)right]}}](https://wikimedia.org/api/rest_v1/media/math/render/svg/e86c11ecfcdc01d2a24c4afd9b4e0e0a4aff6424)
|
See Normal distribution, Error function |
How the t-distribution arises[edit]
Sampling distribution[edit]
Let 

The resulting t-value is
The t-distribution with 


Bayesian inference[edit]
In Bayesian statistics, a (scaled, shifted) t-distribution arises as the marginal distribution of the unknown mean of a normal distribution, when the dependence on an unknown variance has been marginalized out:[16]
where 


With 


a normal distribution and a scaled inverse chi-squared distribution respectively, where 
The marginalization integral thus becomes
This can be evaluated by substituting 

so
But the z integral is now a standard Gamma integral, which evaluates to a constant, leaving
This is a form of the t-distribution with an explicit scaling and shifting that will be explored in more detail in a further section below. It can be related to the standardized t-distribution by the substitution
The derivation above has been presented for the case of uninformative priors for 


Characterization[edit]
As the distribution of a test statistic[edit]
Student’s t-distribution with 
where
- Z is a standard normal with expected value 0 and variance 1;
- V has a chi-squared distribution (χ2-distribution) with
degrees of freedom;
- Z and V are independent;
A different distribution is defined as that of the random variable defined, for a given constant μ, by
This random variable has a noncentral t-distribution with noncentrality parameter μ. This distribution is important in studies of the power of Student’s t-test.
Derivation[edit]
Suppose X1, …, Xn are independent realizations of the normally-distributed, random variable X, which has an expected value μ and variance σ2. Let
be the sample mean, and
be an unbiased estimate of the variance from the sample. It can be shown that the random variable
has a chi-squared distribution with 
is normally distributed with mean 0 and variance 1, since the sample mean 
which differs from Z in that the exact standard deviation σ is replaced by the random variable Sn, has a Student’s t-distribution as defined above. Notice that the unknown population variance σ2 does not appear in T, since it was in both the numerator and the denominator, so it canceled. Gosset intuitively obtained the probability density function stated above, with 
The distribution of the test statistic T depends on 
As a maximum entropy distribution[edit]
Student’s t-distribution is the maximum entropy probability distribution for a random variate X for which 
Properties[edit]
Moments[edit]
For 
Moments of order 
The term for 
For a t-distribution with 


Monte Carlo sampling[edit]
There are various approaches to constructing random samples from the Student’s t-distribution. The matter depends on whether the samples are required on a stand-alone basis, or are to be constructed by application of a quantile function to uniform samples; e.g., in the multi-dimensional applications basis of copula-dependency.[citation needed] In the case of stand-alone sampling, an extension of the Box–Muller method and its polar form is easily deployed.[21] It has the merit that it applies equally well to all real positive degrees of freedom, ν, while many other candidate methods fail if ν is close to zero.[21]
Integral of Student’s probability density function and p-value[edit]
The function A(t | ν) is the integral of Student’s probability density function, f(t) between −t and t, for t ≥ 0. It thus gives the probability that a value of t less than that calculated from observed data would occur by chance. Therefore, the function A(t | ν) can be used when testing whether the difference between the means of two sets of data is statistically significant, by calculating the corresponding value of t and the probability of its occurrence if the two sets of data were drawn from the same population. This is used in a variety of situations, particularly in t-tests. For the statistic t, with ν degrees of freedom, A(t | ν) is the probability that t would be less than the observed value if the two means were the same (provided that the smaller mean is subtracted from the larger, so that t ≥ 0). It can be easily calculated from the cumulative distribution function Fν(t) of the t-distribution:
where Ix is the regularized incomplete beta function (a, b).
For statistical hypothesis testing this function is used to construct the p-value.
Generalized Student’s t-distribution[edit]
In terms of scaling parameter σ̂ or σ̂2[edit]
Student’s t distribution can be generalized to a three parameter location-scale family, introducing a location parameter 

or
This means that 

The resulting non-standardized Student’s t-distribution has a density defined by:[22]
Here, 


Equivalently, the distribution can be written in terms of 
Other properties of this version of the distribution are:[22]
This distribution results from compounding a Gaussian distribution (normal distribution) with mean 


Equivalently, this distribution results from compounding a Gaussian distribution with a scaled-inverse-chi-squared distribution with parameters 


This version of the t-distribution can be useful in financial modeling. For example, Platen and Sidorowicz found that among the family of generalized hyperbolic distributions, this form of the t-distribution with about 4 degrees of freedom was the best fit for the (log) return of many worldwide stock indices.[23]
In terms of inverse scaling parameter λ[edit]
An alternative parameterization in terms of an inverse scaling parameter 

Other properties of this version of the distribution are:[24]
This distribution results from compounding a Gaussian distribution with mean 


[edit]
- If
has a Student’s t-distribution with degree of freedom
then X2 has an F-distribution:
- The noncentral t-distribution generalizes the t-distribution to include a location parameter. Unlike the nonstandardized t-distributions, the noncentral distributions are not symmetric (the median is not the same as the mode).
- The discrete Student’s t-distribution is defined by its probability mass function at r being proportional to:[25]
Here a, b, and k are parameters. This distribution arises from the construction of a system of discrete distributions similar to that of the Pearson distributions for continuous distributions.[26]
- One can generate Student-t samples by taking the ratio of variables from the normal distribution and the square-root of χ2-distribution. If we use instead of the normal distribution, e.g., the Irwin–Hall distribution, we obtain over-all a symmetric 4-parameter distribution, which includes the normal, the uniform, the triangular, the Student-t and the Cauchy distribution. This is also more flexible than some other symmetric generalizations of the normal distribution.
- t-distribution is an instance of ratio distributions.
Bayesian inference: prior distribution for the degrees of the freedom[edit]
Suppose that 


With a choice a prior for the degrees of freedom 


Mean squared error comparison between Bayes estimators based on the four priors and maximum likelihood estimator for the degrees of the freedom. Data is simulated from the student t distribution with the degrees of freedom 


Some popular choices of the priors are:
- Jeffreys prior [28]
where 
- Exponential prior [29]

- Gamma prior [30]

- Log-normal prior [31]
![{displaystyle pi _{L}(nu )=logN(nu |1,1)={frac {1}{nu {sqrt {2pi }}}}exp left[-{frac {(log nu -1)^{2}}{2}}right],quad nu in mathbb {R} ^{+}}](https://wikimedia.org/api/rest_v1/media/math/render/svg/2286de11b6b2ca854ad197e07212694e467d1dea)
The right panels show the result of the numerical experiments. The Bayes estimator based on the Jeffreys prior 


Uses[edit]
In frequentist statistical inference[edit]
Student’s t-distribution arises in a variety of statistical estimation problems where the goal is to estimate an unknown parameter, such as a mean value, in a setting where the data are observed with additive errors. If (as in nearly all practical statistical work) the population standard deviation of these errors is unknown and has to be estimated from the data, the t-distribution is often used to account for the extra uncertainty that results from this estimation. In most such problems, if the standard deviation of the errors were known, a normal distribution would be used instead of the t-distribution.
Confidence intervals and hypothesis tests are two statistical procedures in which the quantiles of the sampling distribution of a particular statistic (e.g. the standard score) are required. In any situation where this statistic is a linear function of the data, divided by the usual estimate of the standard deviation, the resulting quantity can be rescaled and centered to follow Student’s t-distribution. Statistical analyses involving means, weighted means, and regression coefficients all lead to statistics having this form.
Quite often, textbook problems will treat the population standard deviation as if it were known and thereby avoid the need to use the Student’s t-distribution. These problems are generally of two kinds: (1) those in which the sample size is so large that one may treat a data-based estimate of the variance as if it were certain, and (2) those that illustrate mathematical reasoning, in which the problem of estimating the standard deviation is temporarily ignored because that is not the point that the author or instructor is then explaining.
Hypothesis testing[edit]
A number of statistics can be shown to have t-distributions for samples of moderate size under null hypotheses that are of interest, so that the t-distribution forms the basis for significance tests. For example, the distribution of Spearman’s rank correlation coefficient ρ, in the null case (zero correlation) is well approximated by the t distribution for sample sizes above about 20.[citation needed]
Confidence intervals[edit]
Suppose the number A is so chosen that
when T has a t-distribution with n − 1 degrees of freedom. By symmetry, this is the same as saying that A satisfies
so A is the «95th percentile» of this probability distribution, or 
and this is equivalent to
Therefore, the interval whose endpoints are
is a 90% confidence interval for μ. Therefore, if we find the mean of a set of observations that we can reasonably expect to have a normal distribution, we can use the t-distribution to examine whether the confidence limits on that mean include some theoretically predicted value – such as the value predicted on a null hypothesis.
It is this result that is used in the Student’s t-tests: since the difference between the means of samples from two normal distributions is itself distributed normally, the t-distribution can be used to examine whether that difference can reasonably be supposed to be zero.
If the data are normally distributed, the one-sided (1 − α)-upper confidence limit (UCL) of the mean, can be calculated using the following equation:
The resulting UCL will be the greatest average value that will occur for a given confidence interval and population size. In other words, 
Prediction intervals[edit]
The t-distribution can be used to construct a prediction interval for an unobserved sample from a normal distribution with unknown mean and variance.
In Bayesian statistics[edit]
The Student’s t-distribution, especially in its three-parameter (location-scale) version, arises frequently in Bayesian statistics as a result of its connection with the normal distribution. Whenever the variance of a normally distributed random variable is unknown and a conjugate prior placed over it that follows an inverse gamma distribution, the resulting marginal distribution of the variable will follow a Student’s t-distribution. Equivalent constructions with the same results involve a conjugate scaled-inverse-chi-squared distribution over the variance, or a conjugate gamma distribution over the precision. If an improper prior proportional to σ−2 is placed over the variance, the t-distribution also arises. This is the case regardless of whether the mean of the normally distributed variable is known, is unknown distributed according to a conjugate normally distributed prior, or is unknown distributed according to an improper constant prior.
Related situations that also produce a t-distribution are:
- The marginal posterior distribution of the unknown mean of a normally distributed variable, with unknown prior mean and variance following the above model.
- The prior predictive distribution and posterior predictive distribution of a new normally distributed data point when a series of independent identically distributed normally distributed data points have been observed, with prior mean and variance as in the above model.
Robust parametric modeling[edit]
The t-distribution is often used as an alternative to the normal distribution as a model for data, which often has heavier tails than the normal distribution allows for; see e.g. Lange et al.[32] The classical approach was to identify outliers (e.g., using Grubbs’s test) and exclude or downweight them in some way. However, it is not always easy to identify outliers (especially in high dimensions), and the t-distribution is a natural choice of model for such data and provides a parametric approach to robust statistics.
A Bayesian account can be found in Gelman et al.[33] The degrees of freedom parameter controls the kurtosis of the distribution and is correlated with the scale parameter. The likelihood can have multiple local maxima and, as such, it is often necessary to fix the degrees of freedom at a fairly low value and estimate the other parameters taking this as given. Some authors[citation needed] report that values between 3 and 9 are often good choices. Venables and Ripley[citation needed] suggest that a value of 5 is often a good choice.
Student’s t-process[edit]
For practical regression and prediction needs, Student’s t-processes were introduced, that are generalisations of the Student t-distributions for functions. A Student’s t-process is constructed from the Student t-distributions like a Gaussian process is constructed from the Gaussian distributions. For a Gaussian process, all sets of values have a multidimensional Gaussian distribution. Analogously, 
![I=[a,b]](https://wikimedia.org/api/rest_v1/media/math/render/svg/6d6214bb3ce7f00e496c0706edd1464ac60b73b5)


Table of selected values[edit]
The following table lists values for t-distributions with ν degrees of freedom for a range of one-sided or two-sided critical regions. The first column is ν, the percentages along the top are confidence levels, and the numbers in the body of the table are the 
The last row with infinite ν gives critical points for a normal distribution since a t-distribution with infinitely many degrees of freedom is a normal distribution. (See Related distributions above).
| One-sided | 75% | 80% | 85% | 90% | 95% | 97.5% | 99% | 99.5% | 99.75% | 99.9% | 99.95% |
|---|---|---|---|---|---|---|---|---|---|---|---|
| Two-sided | 50% | 60% | 70% | 80% | 90% | 95% | 98% | 99% | 99.5% | 99.8% | 99.9% |
| 1 | 1.000 | 1.376 | 1.963 | 3.078 | 6.314 | 12.706 | 31.821 | 63.657 | 127.321 | 318.309 | 636.619 |
| 2 | 0.816 | 1.080 | 1.386 | 1.886 | 2.920 | 4.303 | 6.965 | 9.925 | 14.089 | 22.327 | 31.599 |
| 3 | 0.765 | 0.978 | 1.250 | 1.638 | 2.353 | 3.182 | 4.541 | 5.841 | 7.453 | 10.215 | 12.924 |
| 4 | 0.741 | 0.941 | 1.190 | 1.533 | 2.132 | 2.776 | 3.747 | 4.604 | 5.598 | 7.173 | 8.610 |
| 5 | 0.727 | 0.920 | 1.156 | 1.476 | 2.015 | 2.571 | 3.365 | 4.032 | 4.773 | 5.893 | 6.869 |
| 6 | 0.718 | 0.906 | 1.134 | 1.440 | 1.943 | 2.447 | 3.143 | 3.707 | 4.317 | 5.208 | 5.959 |
| 7 | 0.711 | 0.896 | 1.119 | 1.415 | 1.895 | 2.365 | 2.998 | 3.499 | 4.029 | 4.785 | 5.408 |
| 8 | 0.706 | 0.889 | 1.108 | 1.397 | 1.860 | 2.306 | 2.896 | 3.355 | 3.833 | 4.501 | 5.041 |
| 9 | 0.703 | 0.883 | 1.100 | 1.383 | 1.833 | 2.262 | 2.821 | 3.250 | 3.690 | 4.297 | 4.781 |
| 10 | 0.700 | 0.879 | 1.093 | 1.372 | 1.812 | 2.228 | 2.764 | 3.169 | 3.581 | 4.144 | 4.587 |
| 11 | 0.697 | 0.876 | 1.088 | 1.363 | 1.796 | 2.201 | 2.718 | 3.106 | 3.497 | 4.025 | 4.437 |
| 12 | 0.695 | 0.873 | 1.083 | 1.356 | 1.782 | 2.179 | 2.681 | 3.055 | 3.428 | 3.930 | 4.318 |
| 13 | 0.694 | 0.870 | 1.079 | 1.350 | 1.771 | 2.160 | 2.650 | 3.012 | 3.372 | 3.852 | 4.221 |
| 14 | 0.692 | 0.868 | 1.076 | 1.345 | 1.761 | 2.145 | 2.624 | 2.977 | 3.326 | 3.787 | 4.140 |
| 15 | 0.691 | 0.866 | 1.074 | 1.341 | 1.753 | 2.131 | 2.602 | 2.947 | 3.286 | 3.733 | 4.073 |
| 16 | 0.690 | 0.865 | 1.071 | 1.337 | 1.746 | 2.120 | 2.583 | 2.921 | 3.252 | 3.686 | 4.015 |
| 17 | 0.689 | 0.863 | 1.069 | 1.333 | 1.740 | 2.110 | 2.567 | 2.898 | 3.222 | 3.646 | 3.965 |
| 18 | 0.688 | 0.862 | 1.067 | 1.330 | 1.734 | 2.101 | 2.552 | 2.878 | 3.197 | 3.610 | 3.922 |
| 19 | 0.688 | 0.861 | 1.066 | 1.328 | 1.729 | 2.093 | 2.539 | 2.861 | 3.174 | 3.579 | 3.883 |
| 20 | 0.687 | 0.860 | 1.064 | 1.325 | 1.725 | 2.086 | 2.528 | 2.845 | 3.153 | 3.552 | 3.850 |
| 21 | 0.686 | 0.859 | 1.063 | 1.323 | 1.721 | 2.080 | 2.518 | 2.831 | 3.135 | 3.527 | 3.819 |
| 22 | 0.686 | 0.858 | 1.061 | 1.321 | 1.717 | 2.074 | 2.508 | 2.819 | 3.119 | 3.505 | 3.792 |
| 23 | 0.685 | 0.858 | 1.060 | 1.319 | 1.714 | 2.069 | 2.500 | 2.807 | 3.104 | 3.485 | 3.767 |
| 24 | 0.685 | 0.857 | 1.059 | 1.318 | 1.711 | 2.064 | 2.492 | 2.797 | 3.091 | 3.467 | 3.745 |
| 25 | 0.684 | 0.856 | 1.058 | 1.316 | 1.708 | 2.060 | 2.485 | 2.787 | 3.078 | 3.450 | 3.725 |
| 26 | 0.684 | 0.856 | 1.058 | 1.315 | 1.706 | 2.056 | 2.479 | 2.779 | 3.067 | 3.435 | 3.707 |
| 27 | 0.684 | 0.855 | 1.057 | 1.314 | 1.703 | 2.052 | 2.473 | 2.771 | 3.057 | 3.421 | 3.690 |
| 28 | 0.683 | 0.855 | 1.056 | 1.313 | 1.701 | 2.048 | 2.467 | 2.763 | 3.047 | 3.408 | 3.674 |
| 29 | 0.683 | 0.854 | 1.055 | 1.311 | 1.699 | 2.045 | 2.462 | 2.756 | 3.038 | 3.396 | 3.659 |
| 30 | 0.683 | 0.854 | 1.055 | 1.310 | 1.697 | 2.042 | 2.457 | 2.750 | 3.030 | 3.385 | 3.646 |
| 40 | 0.681 | 0.851 | 1.050 | 1.303 | 1.684 | 2.021 | 2.423 | 2.704 | 2.971 | 3.307 | 3.551 |
| 50 | 0.679 | 0.849 | 1.047 | 1.299 | 1.676 | 2.009 | 2.403 | 2.678 | 2.937 | 3.261 | 3.496 |
| 60 | 0.679 | 0.848 | 1.045 | 1.296 | 1.671 | 2.000 | 2.390 | 2.660 | 2.915 | 3.232 | 3.460 |
| 80 | 0.678 | 0.846 | 1.043 | 1.292 | 1.664 | 1.990 | 2.374 | 2.639 | 2.887 | 3.195 | 3.416 |
| 100 | 0.677 | 0.845 | 1.042 | 1.290 | 1.660 | 1.984 | 2.364 | 2.626 | 2.871 | 3.174 | 3.390 |
| 120 | 0.677 | 0.845 | 1.041 | 1.289 | 1.658 | 1.980 | 2.358 | 2.617 | 2.860 | 3.160 | 3.373 |
| ∞ | 0.674 | 0.842 | 1.036 | 1.282 | 1.645 | 1.960 | 2.326 | 2.576 | 2.807 | 3.090 | 3.291 |
| One-sided | 75% | 80% | 85% | 90% | 95% | 97.5% | 99% | 99.5% | 99.75% | 99.9% | 99.95% |
| Two-sided | 50% | 60% | 70% | 80% | 90% | 95% | 98% | 99% | 99.5% | 99.8% | 99.9% |
Calculating the confidence interval
Let’s say we have a sample with size 11, sample mean 10, and sample variance 2. For 90% confidence with 10 degrees of freedom, the one-sided t-value from the table is 1.372. Then with confidence interval calculated from
we determine that with 90% confidence we have a true mean lying below
In other words, 90% of the times that an upper threshold is calculated by this method from particular samples, this upper threshold exceeds the true mean.
And with 90% confidence we have a true mean lying above
In other words, 90% of the times that a lower threshold is calculated by this method from particular samples, this lower threshold lies below the true mean.
So that at 80% confidence (calculated from 100% − 2 × (1 − 90%) = 80%), we have a true mean lying within the interval
Saying that 80% of the times that upper and lower thresholds are calculated by this method from a given sample, the true mean is both below the upper threshold and above the lower threshold is not the same as saying that there is an 80% probability that the true mean lies between a particular pair of upper and lower thresholds that have been calculated by this method; see confidence interval and prosecutor’s fallacy.
Nowadays, statistical software, such as the R programming language, and functions available in many spreadsheet programs compute values of the t-distribution and its inverse without tables.
See also[edit]
Notes[edit]
- ^ Hurst, Simon. «The Characteristic Function of the Student t Distribution». Financial Mathematics Research Report No. FMRR006-95, Statistics Research Report No. SRR044-95. Archived from the original on February 18, 2010.
- ^ Helmert FR (1875). «Über die Berechnung des wahrscheinlichen Fehlers aus einer endlichen Anzahl wahrer Beobachtungsfehler». Z. Math. U. Physik. 20: 300–3.
- ^ Helmert FR (1876). «Über die Wahrscheinlichkeit der Potenzsummen der Beobachtungsfehler und uber einige damit in Zusammenhang stehende Fragen». Z. Math. Phys. 21: 192–218.
- ^ Helmert FR (1876). «Die Genauigkeit der Formel von Peters zur Berechnung des wahrscheinlichen Beobachtungsfehlers directer Beobachtungen gleicher Genauigkeit» [The accuracy of Peters’ formula for calculating the probable observation error of direct observations of the same accuracy]. Astron. Nachr. (in German). 88 (8–9): 113–132. Bibcode:1876AN…..88..113H. doi:10.1002/asna.18760880802.
- ^ Lüroth J (1876). «Vergleichung von zwei Werten des wahrscheinlichen Fehlers». Astron. Nachr. 87 (14): 209–20. Bibcode:1876AN…..87..209L. doi:10.1002/asna.18760871402.
- ^ Pfanzagl J, Sheynin O (1996). «Studies in the history of probability and statistics. XLIV. A forerunner of the t-distribution». Biometrika. 83 (4): 891–898. doi:10.1093/biomet/83.4.891. MR 1766040.
- ^ Sheynin O (1995). «Helmert’s work in the theory of errors». Arch. Hist. Exact Sci. 49 (1): 73–104. doi:10.1007/BF00374700. S2CID 121241599.
- ^ Pearson, K. (1895-01-01). «Contributions to the Mathematical Theory of Evolution. II. Skew Variation in Homogeneous Material». Philosophical Transactions of the Royal Society A: Mathematical, Physical and Engineering Sciences. 186: 343–414 (374). Bibcode:1895RSPTA.186..343P. doi:10.1098/rsta.1895.0010. ISSN 1364-503X.
- ^ «Student» [William Sealy Gosset] (1908). «The probable error of a mean» (PDF). Biometrika. 6 (1): 1–25. doi:10.1093/biomet/6.1.1. hdl:10338.dmlcz/143545. JSTOR 2331554.
- ^ Wendl MC (2016). «Pseudonymous fame». Science. 351 (6280): 1406. Bibcode:2016Sci…351.1406W. doi:10.1126/science.351.6280.1406. PMID 27013722.
- ^ Mortimer RG (2005). Mathematics for physical chemistry (3rd ed.). Burlington, MA: Elsevier. pp. 326. ISBN 9780080492889. OCLC 156200058.
- ^ a b Fisher RA (1925). «Applications of ‘Student’s’ distribution» (PDF). Metron. 5: 90–104. Archived from the original (PDF) on 5 March 2016.
- ^ Walpole RE, Myers R, Myers S, et al. (2006). Probability & Statistics for Engineers & Scientists (7th ed.). New Delhi: Pearson. p. 237. ISBN 9788177584042. OCLC 818811849.
- ^ Kruschke JK (2015). Doing Bayesian Data Analysis (2nd ed.). Academic Press. ISBN 9780124058880. OCLC 959632184.
- ^ a b c Johnson NL, Kotz S, Balakrishnan N (1995). «Chapter 28». Continuous Univariate Distributions. Vol. 2 (2nd ed.). Wiley. ISBN 9780471584940.
- ^ Gelman AB, Carlin JS, Rubin DB, et al. (1997). Bayesian Data Analysis (2nd ed.). Boca Raton: Chapman & Hall. p. 68. ISBN 9780412039911.
- ^ Hogg RV, Craig AT (1978). Introduction to Mathematical Statistics (4th ed.). New York: Macmillan. ASIN B010WFO0SA. Sections 4.4 and 4.8
{{cite book}}: CS1 maint: postscript (link) - ^ Cochran WG (1934). «The distribution of quadratic forms in a normal system, with applications to the analysis of covariance». Math. Proc. Camb. Philos. Soc. 30 (2): 178–191. Bibcode:1934PCPS…30..178C. doi:10.1017/S0305004100016595. S2CID 122547084.
- ^ Park SY, Bera AK (2009). «Maximum entropy autoregressive conditional heteroskedasticity model». J. Econom. 150 (2): 219–230. doi:10.1016/j.jeconom.2008.12.014.
- ^ Casella G, Berger RL (1990). Statistical Inference. Duxbury Resource Center. p. 56. ISBN 9780534119584.
- ^ a b Bailey RW (1994). «Polar Generation of Random Variates with the t-Distribution». Math. Comput. 62 (206): 779–781. Bibcode:1994MaCom..62..779B. doi:10.2307/2153537. JSTOR 2153537.
- ^ a b Jackman, S. (2009). Bayesian Analysis for the Social Sciences. Wiley Series in Probability and Statistics. Wiley. p. 507. doi:10.1002/9780470686621. ISBN 9780470011546.
- ^ Platen, Eckhard & Sidorowicz, Renata (March 2007). «Empirical Evidence on Student-t Log Returns of Diversified World Stock Indices» (PDF). Quantitative Finance Research Center. ISSN 1441-8010. Archived from the original (PDF) on 2019-04-30. Retrieved 2022-03-22.
{{cite journal}}: CS1 maint: multiple names: authors list (link) - ^ a b Bishop, C.M. (2006). Pattern Recognition and Machine Learning. New York, NY: Springer. ISBN 9780387310732.
- ^ Ord JK (1972). Families of Frequency Distributions. London: Griffin. ISBN 9780852641378. See Table 5.1.
{{cite book}}: CS1 maint: postscript (link) - ^ Ord JK (1972). «Chapter 5». Families of frequency distributions. London: Griffin. ISBN 9780852641378.
- ^ Lee, Se Yoon (2022). «The Use of a Log-Normal Prior for the Student t-Distribution». Axioms. 11 (9): 462. doi:10.3390/axioms11090462.
- ^ Fonseca, T.C.; Ferreira, M.A.; Migon, H.S. (2008). «Objective Bayesian analysis for the Student-t regression model». Biometrika. 95 (2): 325–333. doi:10.1093/biomet/asn001.
- ^ Fernández, C.; Steel, M.F. (1998). «On Bayesian modeling of fat tails and skewness». J. Am. Stat. Assoc.
- ^ Juárez, M.A.; Steel, M.F. (2010). «Model-based clustering of non-Gaussian panel data based on skew-t distributions». J. Bus. Econ. Stat. 28: 52–66. doi:10.1198/jbes.2009.07145. S2CID 10091669.
- ^ Lee, Se Yoon (2022). «The Use of a Log-Normal Prior for the Student t-Distribution». Axioms. 11 (9): 462. doi:10.3390/axioms11090462.
- ^ Lange KL, Little RJ, Taylor JM (1989). «Robust Statistical Modeling Using the t Distribution» (PDF). J. Am. Stat. Assoc. 84 (408): 881–896. doi:10.1080/01621459.1989.10478852. JSTOR 2290063.
- ^ Gelman AB, Carlin JB, Stern HS, et al. (2014). «Computationally efficient Markov chain simulation». Bayesian Data Analysis. Boca Raton, Florida: CRC Press. p. 293. ISBN 9781439898208.
- ^ Shah, Amar; Wilson, Andrew Gordon; Ghahramani, Zoubin (2014). «Student-t processes as alternatives to Gaussian processes» (PDF). JMLR. 33 (Proceedings of the 17th International Conference on Artificial Intelligence and Statistics (AISTATS) 2014, Reykjavik, Iceland): 877–885. arXiv:1402.4306.
- ^ Chen, Zexun; Wang, Bo; Gorban, Alexander N. (2019). «Multivariate Gaussian and Student-t process regression for multi-output prediction». Neural Computing and Applications. 32 (8): 3005–3028. arXiv:1703.04455. doi:10.1007/s00521-019-04687-8.
- ^ Sun, Jingchao; Kong, Maiying; Pal, Subhadip (22 June 2021). «The Modified-Half-Normal distribution: Properties and an efficient sampling scheme». Communications in Statistics — Theory and Methods. 52 (5): 1591–1613. doi:10.1080/03610926.2021.1934700. ISSN 0361-0926. S2CID 237919587.
References[edit]
- Senn, S.; Richardson, W. (1994). «The first t-test». Statistics in Medicine. 13 (8): 785–803. doi:10.1002/sim.4780130802. PMID 8047737.
- Hogg RV, Craig AT (1978). Introduction to Mathematical Statistics (4th ed.). New York: Macmillan. ASIN B010WFO0SA.
- Venables, W. N.; Ripley, B. D. (2002). Modern Applied Statistics with S (Fourth ed.). Springer.
- Gelman, Andrew; John B. Carlin; Hal S. Stern; Donald B. Rubin (2003). Bayesian Data Analysis (Second ed.). CRC/Chapman & Hall. ISBN 1-58488-388-X.
External links[edit]
- «Student distribution», Encyclopedia of Mathematics, EMS Press, 2001 [1994]
- Earliest Known Uses of Some of the Words of Mathematics (S) (Remarks on the history of the term «Student’s distribution»)
- Rouaud, M. (2013), Probability, Statistics and Estimation (PDF) (short ed.) First Students on page 112.
- Student’s t-Distribution, Archived 2021-04-10 at the Wayback Machine ck12
This article is about the mathematics of Student’s t-distribution. For its uses in statistics, see Student’s t-test.
|
Probability density function |
|
|
Cumulative distribution function |
|
| Parameters |
 degrees of freedom (real) degrees of freedom (real) |
|---|---|
| Support |
 |
 |
|
| CDF |
where 2F1 is the hypergeometric function |
| Mean |
0 for  , otherwise undefined , otherwise undefined |
| Median | 0 |
| Mode | 0 |
| Variance |
 for for  , ∞ for , ∞ for  , otherwise undefined , otherwise undefined |
| Skewness |
0 for  , otherwise undefined , otherwise undefined |
| Ex. kurtosis |
 for for  , ∞ for , ∞ for  , otherwise undefined , otherwise undefined |
| Entropy |
|
| MGF | undefined |
| CF |
|
In probability and statistics, Student’s t-distribution (or simply the t-distribution) is any member of a family of continuous probability distributions that arise when estimating the mean of a normally distributed population in situations where the sample size is small and the population’s standard deviation is unknown. It was developed by English statistician William Sealy Gosset under the pseudonym «Student».
The t-distribution plays a role in a number of widely used statistical analyses, including Student’s t-test for assessing the statistical significance of the difference between two sample means, the construction of confidence intervals for the difference between two population means, and in linear regression analysis. Student’s t-distribution also arises in the Bayesian analysis of data from a normal family.
If we take a sample of 


The t-distribution is symmetric and bell-shaped, like the normal distribution. However, the t-distribution has heavier tails, meaning that it is more prone to producing values that fall far from its mean. This makes it useful for understanding the statistical behavior of certain types of ratios of random quantities, in which variation in the denominator is amplified and may produce outlying values when the denominator of the ratio falls close to zero. The Student’s t-distribution is a special case of the generalized hyperbolic distribution.
History and etymology[edit]
Statistician William Sealy Gosset, known as «Student»
In statistics, the t-distribution was first derived as a posterior distribution in 1876 by Helmert[2][3][4] and Lüroth.[5][6][7] The t-distribution also appeared in a more general form as Pearson Type IV distribution in Karl Pearson’s 1895 paper.[8]
In the English-language literature, the distribution takes its name from William Sealy Gosset’s 1908 paper in Biometrika under the pseudonym «Student».[9] One version of the origin of the pseudonym is that Gosset’s employer preferred staff to use pen names when publishing scientific papers instead of their real name, so he used the name «Student» to hide his identity. Another version is that Guinness did not want their competitors to know that they were using the t-test to determine the quality of raw material.[10][11]
Gosset worked at the Guinness Brewery in Dublin, Ireland, and was interested in the problems of small samples – for example, the chemical properties of barley where sample sizes might be as few as 3. Gosset’s paper refers to the distribution as the «frequency distribution of standard deviations of samples drawn from a normal population». It became well known through the work of Ronald Fisher, who called the distribution «Student’s distribution» and represented the test value with the letter t.[12][13]
How Student’s distribution arises from sampling[edit]
Let 


Let
be the sample mean and let
be the (Bessel-corrected) sample variance. Then the random variable
has a standard normal distribution (i.e. normal with expected mean 0 and variance 1), and the random variable
i.e where 


Definition[edit]
Probability density function[edit]
Student’s t-distribution has the probability density function (PDF) given by
where 

where B is the Beta function. In particular for integer valued degrees of freedom 
For 
For 
The probability density function is symmetric, and its overall shape resembles the bell shape of a normally distributed variable with mean 0 and variance 1, except that it is a bit lower and wider. As the number of degrees of freedom grows, the t-distribution approaches the normal distribution with mean 0 and variance 1. For this reason 
The following images show the density of the t-distribution for increasing values of 

1 degree of freedom
2 degrees of freedom
3 degrees of freedom
5 degrees of freedom
10 degrees of freedom
30 degrees of freedom
Cumulative distribution function[edit]
The cumulative distribution function (CDF) can be written in terms of I, the regularized
incomplete beta function. For t > 0,[15]
where
Other values would be obtained by symmetry. An alternative formula, valid for 
where 2F1 is a particular case of the hypergeometric function.
For information on its inverse cumulative distribution function, see quantile function § Student’s t-distribution.
Special cases[edit]
Certain values of 

|
CDF | notes | |
|---|---|---|---|
| 1 | 
|

|
See Cauchy distribution |
| 2 | 
|

|
|
| 3 | 
|
![{displaystyle {frac {1}{2}}+{frac {1}{pi }}{left[{frac {1}{sqrt {3}}}{frac {t}{1+{frac {t^{2}}{3}}}}+arctan left({frac {t}{sqrt {3}}}right)right]}}](https://wikimedia.org/api/rest_v1/media/math/render/svg/f0afffc07f0c86a59eaa560dc8a3cf8f6fa83ccd)
|
|
| 4 | 
|
![{displaystyle {frac {1}{2}}+{frac {3}{8}}{frac {t}{sqrt {1+{frac {t^{2}}{4}}}}}{left[1-{frac {1}{12}}{frac {t^{2}}{1+{frac {t^{2}}{4}}}}right]}}](https://wikimedia.org/api/rest_v1/media/math/render/svg/8267697404a72109b22e9add73ef7023d1953235)
|
|
| 5 | 
|
![{displaystyle {frac {1}{2}}+{frac {1}{pi }}{left[{frac {t}{{sqrt {5}}left(1+{frac {t^{2}}{5}}right)}}left(1+{frac {2}{3left(1+{frac {t^{2}}{5}}right)}}right)+arctan left({frac {t}{sqrt {5}}}right)right]}}](https://wikimedia.org/api/rest_v1/media/math/render/svg/aeef99bb2df092bdcc8c708cbc0c29cfe1849232)
|
|

|

|
![{displaystyle {frac {1}{2}}{left[1+operatorname {erf} left({frac {t}{sqrt {2}}}right)right]}}](https://wikimedia.org/api/rest_v1/media/math/render/svg/e86c11ecfcdc01d2a24c4afd9b4e0e0a4aff6424)
|
See Normal distribution, Error function |
How the t-distribution arises[edit]
Sampling distribution[edit]
Let 

The resulting t-value is
The t-distribution with 


Bayesian inference[edit]
In Bayesian statistics, a (scaled, shifted) t-distribution arises as the marginal distribution of the unknown mean of a normal distribution, when the dependence on an unknown variance has been marginalized out:[16]
where 


With 


a normal distribution and a scaled inverse chi-squared distribution respectively, where 
The marginalization integral thus becomes
This can be evaluated by substituting 

so
But the z integral is now a standard Gamma integral, which evaluates to a constant, leaving
This is a form of the t-distribution with an explicit scaling and shifting that will be explored in more detail in a further section below. It can be related to the standardized t-distribution by the substitution
The derivation above has been presented for the case of uninformative priors for 


Characterization[edit]
As the distribution of a test statistic[edit]
Student’s t-distribution with 
where
- Z is a standard normal with expected value 0 and variance 1;
- V has a chi-squared distribution (χ2-distribution) with
degrees of freedom;
- Z and V are independent;
A different distribution is defined as that of the random variable defined, for a given constant μ, by
This random variable has a noncentral t-distribution with noncentrality parameter μ. This distribution is important in studies of the power of Student’s t-test.
Derivation[edit]
Suppose X1, …, Xn are independent realizations of the normally-distributed, random variable X, which has an expected value μ and variance σ2. Let
be the sample mean, and
be an unbiased estimate of the variance from the sample. It can be shown that the random variable
has a chi-squared distribution with 
is normally distributed with mean 0 and variance 1, since the sample mean 
which differs from Z in that the exact standard deviation σ is replaced by the random variable Sn, has a Student’s t-distribution as defined above. Notice that the unknown population variance σ2 does not appear in T, since it was in both the numerator and the denominator, so it canceled. Gosset intuitively obtained the probability density function stated above, with 
The distribution of the test statistic T depends on 
As a maximum entropy distribution[edit]
Student’s t-distribution is the maximum entropy probability distribution for a random variate X for which 
Properties[edit]
Moments[edit]
For 
Moments of order 
The term for 
For a t-distribution with 


Monte Carlo sampling[edit]
There are various approaches to constructing random samples from the Student’s t-distribution. The matter depends on whether the samples are required on a stand-alone basis, or are to be constructed by application of a quantile function to uniform samples; e.g., in the multi-dimensional applications basis of copula-dependency.[citation needed] In the case of stand-alone sampling, an extension of the Box–Muller method and its polar form is easily deployed.[21] It has the merit that it applies equally well to all real positive degrees of freedom, ν, while many other candidate methods fail if ν is close to zero.[21]
Integral of Student’s probability density function and p-value[edit]
The function A(t | ν) is the integral of Student’s probability density function, f(t) between −t and t, for t ≥ 0. It thus gives the probability that a value of t less than that calculated from observed data would occur by chance. Therefore, the function A(t | ν) can be used when testing whether the difference between the means of two sets of data is statistically significant, by calculating the corresponding value of t and the probability of its occurrence if the two sets of data were drawn from the same population. This is used in a variety of situations, particularly in t-tests. For the statistic t, with ν degrees of freedom, A(t | ν) is the probability that t would be less than the observed value if the two means were the same (provided that the smaller mean is subtracted from the larger, so that t ≥ 0). It can be easily calculated from the cumulative distribution function Fν(t) of the t-distribution:
where Ix is the regularized incomplete beta function (a, b).
For statistical hypothesis testing this function is used to construct the p-value.
Generalized Student’s t-distribution[edit]
In terms of scaling parameter σ̂ or σ̂2[edit]
Student’s t distribution can be generalized to a three parameter location-scale family, introducing a location parameter 

or
This means that 

The resulting non-standardized Student’s t-distribution has a density defined by:[22]
Here, 


Equivalently, the distribution can be written in terms of 
Other properties of this version of the distribution are:[22]
This distribution results from compounding a Gaussian distribution (normal distribution) with mean 


Equivalently, this distribution results from compounding a Gaussian distribution with a scaled-inverse-chi-squared distribution with parameters 


This version of the t-distribution can be useful in financial modeling. For example, Platen and Sidorowicz found that among the family of generalized hyperbolic distributions, this form of the t-distribution with about 4 degrees of freedom was the best fit for the (log) return of many worldwide stock indices.[23]
In terms of inverse scaling parameter λ[edit]
An alternative parameterization in terms of an inverse scaling parameter 

Other properties of this version of the distribution are:[24]
This distribution results from compounding a Gaussian distribution with mean 


[edit]
- If
has a Student’s t-distribution with degree of freedom
then X2 has an F-distribution:
- The noncentral t-distribution generalizes the t-distribution to include a location parameter. Unlike the nonstandardized t-distributions, the noncentral distributions are not symmetric (the median is not the same as the mode).
- The discrete Student’s t-distribution is defined by its probability mass function at r being proportional to:[25]
Here a, b, and k are parameters. This distribution arises from the construction of a system of discrete distributions similar to that of the Pearson distributions for continuous distributions.[26]
- One can generate Student-t samples by taking the ratio of variables from the normal distribution and the square-root of χ2-distribution. If we use instead of the normal distribution, e.g., the Irwin–Hall distribution, we obtain over-all a symmetric 4-parameter distribution, which includes the normal, the uniform, the triangular, the Student-t and the Cauchy distribution. This is also more flexible than some other symmetric generalizations of the normal distribution.
- t-distribution is an instance of ratio distributions.
Bayesian inference: prior distribution for the degrees of the freedom[edit]
Suppose that 


With a choice a prior for the degrees of freedom 


Mean squared error comparison between Bayes estimators based on the four priors and maximum likelihood estimator for the degrees of the freedom. Data is simulated from the student t distribution with the degrees of freedom 


Some popular choices of the priors are:
- Jeffreys prior [28]
where 
- Exponential prior [29]

- Gamma prior [30]

- Log-normal prior [31]
![{displaystyle pi _{L}(nu )=logN(nu |1,1)={frac {1}{nu {sqrt {2pi }}}}exp left[-{frac {(log nu -1)^{2}}{2}}right],quad nu in mathbb {R} ^{+}}](https://wikimedia.org/api/rest_v1/media/math/render/svg/2286de11b6b2ca854ad197e07212694e467d1dea)
The right panels show the result of the numerical experiments. The Bayes estimator based on the Jeffreys prior 


Uses[edit]
In frequentist statistical inference[edit]
Student’s t-distribution arises in a variety of statistical estimation problems where the goal is to estimate an unknown parameter, such as a mean value, in a setting where the data are observed with additive errors. If (as in nearly all practical statistical work) the population standard deviation of these errors is unknown and has to be estimated from the data, the t-distribution is often used to account for the extra uncertainty that results from this estimation. In most such problems, if the standard deviation of the errors were known, a normal distribution would be used instead of the t-distribution.
Confidence intervals and hypothesis tests are two statistical procedures in which the quantiles of the sampling distribution of a particular statistic (e.g. the standard score) are required. In any situation where this statistic is a linear function of the data, divided by the usual estimate of the standard deviation, the resulting quantity can be rescaled and centered to follow Student’s t-distribution. Statistical analyses involving means, weighted means, and regression coefficients all lead to statistics having this form.
Quite often, textbook problems will treat the population standard deviation as if it were known and thereby avoid the need to use the Student’s t-distribution. These problems are generally of two kinds: (1) those in which the sample size is so large that one may treat a data-based estimate of the variance as if it were certain, and (2) those that illustrate mathematical reasoning, in which the problem of estimating the standard deviation is temporarily ignored because that is not the point that the author or instructor is then explaining.
Hypothesis testing[edit]
A number of statistics can be shown to have t-distributions for samples of moderate size under null hypotheses that are of interest, so that the t-distribution forms the basis for significance tests. For example, the distribution of Spearman’s rank correlation coefficient ρ, in the null case (zero correlation) is well approximated by the t distribution for sample sizes above about 20.[citation needed]
Confidence intervals[edit]
Suppose the number A is so chosen that
when T has a t-distribution with n − 1 degrees of freedom. By symmetry, this is the same as saying that A satisfies
so A is the «95th percentile» of this probability distribution, or 
and this is equivalent to
Therefore, the interval whose endpoints are
is a 90% confidence interval for μ. Therefore, if we find the mean of a set of observations that we can reasonably expect to have a normal distribution, we can use the t-distribution to examine whether the confidence limits on that mean include some theoretically predicted value – such as the value predicted on a null hypothesis.
It is this result that is used in the Student’s t-tests: since the difference between the means of samples from two normal distributions is itself distributed normally, the t-distribution can be used to examine whether that difference can reasonably be supposed to be zero.
If the data are normally distributed, the one-sided (1 − α)-upper confidence limit (UCL) of the mean, can be calculated using the following equation:
The resulting UCL will be the greatest average value that will occur for a given confidence interval and population size. In other words, 
Prediction intervals[edit]
The t-distribution can be used to construct a prediction interval for an unobserved sample from a normal distribution with unknown mean and variance.
In Bayesian statistics[edit]
The Student’s t-distribution, especially in its three-parameter (location-scale) version, arises frequently in Bayesian statistics as a result of its connection with the normal distribution. Whenever the variance of a normally distributed random variable is unknown and a conjugate prior placed over it that follows an inverse gamma distribution, the resulting marginal distribution of the variable will follow a Student’s t-distribution. Equivalent constructions with the same results involve a conjugate scaled-inverse-chi-squared distribution over the variance, or a conjugate gamma distribution over the precision. If an improper prior proportional to σ−2 is placed over the variance, the t-distribution also arises. This is the case regardless of whether the mean of the normally distributed variable is known, is unknown distributed according to a conjugate normally distributed prior, or is unknown distributed according to an improper constant prior.
Related situations that also produce a t-distribution are:
- The marginal posterior distribution of the unknown mean of a normally distributed variable, with unknown prior mean and variance following the above model.
- The prior predictive distribution and posterior predictive distribution of a new normally distributed data point when a series of independent identically distributed normally distributed data points have been observed, with prior mean and variance as in the above model.
Robust parametric modeling[edit]
The t-distribution is often used as an alternative to the normal distribution as a model for data, which often has heavier tails than the normal distribution allows for; see e.g. Lange et al.[32] The classical approach was to identify outliers (e.g., using Grubbs’s test) and exclude or downweight them in some way. However, it is not always easy to identify outliers (especially in high dimensions), and the t-distribution is a natural choice of model for such data and provides a parametric approach to robust statistics.
A Bayesian account can be found in Gelman et al.[33] The degrees of freedom parameter controls the kurtosis of the distribution and is correlated with the scale parameter. The likelihood can have multiple local maxima and, as such, it is often necessary to fix the degrees of freedom at a fairly low value and estimate the other parameters taking this as given. Some authors[citation needed] report that values between 3 and 9 are often good choices. Venables and Ripley[citation needed] suggest that a value of 5 is often a good choice.
Student’s t-process[edit]
For practical regression and prediction needs, Student’s t-processes were introduced, that are generalisations of the Student t-distributions for functions. A Student’s t-process is constructed from the Student t-distributions like a Gaussian process is constructed from the Gaussian distributions. For a Gaussian process, all sets of values have a multidimensional Gaussian distribution. Analogously, 
![I=[a,b]](https://wikimedia.org/api/rest_v1/media/math/render/svg/6d6214bb3ce7f00e496c0706edd1464ac60b73b5)


Table of selected values[edit]
The following table lists values for t-distributions with ν degrees of freedom for a range of one-sided or two-sided critical regions. The first column is ν, the percentages along the top are confidence levels, and the numbers in the body of the table are the 
The last row with infinite ν gives critical points for a normal distribution since a t-distribution with infinitely many degrees of freedom is a normal distribution. (See Related distributions above).
| One-sided | 75% | 80% | 85% | 90% | 95% | 97.5% | 99% | 99.5% | 99.75% | 99.9% | 99.95% |
|---|---|---|---|---|---|---|---|---|---|---|---|
| Two-sided | 50% | 60% | 70% | 80% | 90% | 95% | 98% | 99% | 99.5% | 99.8% | 99.9% |
| 1 | 1.000 | 1.376 | 1.963 | 3.078 | 6.314 | 12.706 | 31.821 | 63.657 | 127.321 | 318.309 | 636.619 |
| 2 | 0.816 | 1.080 | 1.386 | 1.886 | 2.920 | 4.303 | 6.965 | 9.925 | 14.089 | 22.327 | 31.599 |
| 3 | 0.765 | 0.978 | 1.250 | 1.638 | 2.353 | 3.182 | 4.541 | 5.841 | 7.453 | 10.215 | 12.924 |
| 4 | 0.741 | 0.941 | 1.190 | 1.533 | 2.132 | 2.776 | 3.747 | 4.604 | 5.598 | 7.173 | 8.610 |
| 5 | 0.727 | 0.920 | 1.156 | 1.476 | 2.015 | 2.571 | 3.365 | 4.032 | 4.773 | 5.893 | 6.869 |
| 6 | 0.718 | 0.906 | 1.134 | 1.440 | 1.943 | 2.447 | 3.143 | 3.707 | 4.317 | 5.208 | 5.959 |
| 7 | 0.711 | 0.896 | 1.119 | 1.415 | 1.895 | 2.365 | 2.998 | 3.499 | 4.029 | 4.785 | 5.408 |
| 8 | 0.706 | 0.889 | 1.108 | 1.397 | 1.860 | 2.306 | 2.896 | 3.355 | 3.833 | 4.501 | 5.041 |
| 9 | 0.703 | 0.883 | 1.100 | 1.383 | 1.833 | 2.262 | 2.821 | 3.250 | 3.690 | 4.297 | 4.781 |
| 10 | 0.700 | 0.879 | 1.093 | 1.372 | 1.812 | 2.228 | 2.764 | 3.169 | 3.581 | 4.144 | 4.587 |
| 11 | 0.697 | 0.876 | 1.088 | 1.363 | 1.796 | 2.201 | 2.718 | 3.106 | 3.497 | 4.025 | 4.437 |
| 12 | 0.695 | 0.873 | 1.083 | 1.356 | 1.782 | 2.179 | 2.681 | 3.055 | 3.428 | 3.930 | 4.318 |
| 13 | 0.694 | 0.870 | 1.079 | 1.350 | 1.771 | 2.160 | 2.650 | 3.012 | 3.372 | 3.852 | 4.221 |
| 14 | 0.692 | 0.868 | 1.076 | 1.345 | 1.761 | 2.145 | 2.624 | 2.977 | 3.326 | 3.787 | 4.140 |
| 15 | 0.691 | 0.866 | 1.074 | 1.341 | 1.753 | 2.131 | 2.602 | 2.947 | 3.286 | 3.733 | 4.073 |
| 16 | 0.690 | 0.865 | 1.071 | 1.337 | 1.746 | 2.120 | 2.583 | 2.921 | 3.252 | 3.686 | 4.015 |
| 17 | 0.689 | 0.863 | 1.069 | 1.333 | 1.740 | 2.110 | 2.567 | 2.898 | 3.222 | 3.646 | 3.965 |
| 18 | 0.688 | 0.862 | 1.067 | 1.330 | 1.734 | 2.101 | 2.552 | 2.878 | 3.197 | 3.610 | 3.922 |
| 19 | 0.688 | 0.861 | 1.066 | 1.328 | 1.729 | 2.093 | 2.539 | 2.861 | 3.174 | 3.579 | 3.883 |
| 20 | 0.687 | 0.860 | 1.064 | 1.325 | 1.725 | 2.086 | 2.528 | 2.845 | 3.153 | 3.552 | 3.850 |
| 21 | 0.686 | 0.859 | 1.063 | 1.323 | 1.721 | 2.080 | 2.518 | 2.831 | 3.135 | 3.527 | 3.819 |
| 22 | 0.686 | 0.858 | 1.061 | 1.321 | 1.717 | 2.074 | 2.508 | 2.819 | 3.119 | 3.505 | 3.792 |
| 23 | 0.685 | 0.858 | 1.060 | 1.319 | 1.714 | 2.069 | 2.500 | 2.807 | 3.104 | 3.485 | 3.767 |
| 24 | 0.685 | 0.857 | 1.059 | 1.318 | 1.711 | 2.064 | 2.492 | 2.797 | 3.091 | 3.467 | 3.745 |
| 25 | 0.684 | 0.856 | 1.058 | 1.316 | 1.708 | 2.060 | 2.485 | 2.787 | 3.078 | 3.450 | 3.725 |
| 26 | 0.684 | 0.856 | 1.058 | 1.315 | 1.706 | 2.056 | 2.479 | 2.779 | 3.067 | 3.435 | 3.707 |
| 27 | 0.684 | 0.855 | 1.057 | 1.314 | 1.703 | 2.052 | 2.473 | 2.771 | 3.057 | 3.421 | 3.690 |
| 28 | 0.683 | 0.855 | 1.056 | 1.313 | 1.701 | 2.048 | 2.467 | 2.763 | 3.047 | 3.408 | 3.674 |
| 29 | 0.683 | 0.854 | 1.055 | 1.311 | 1.699 | 2.045 | 2.462 | 2.756 | 3.038 | 3.396 | 3.659 |
| 30 | 0.683 | 0.854 | 1.055 | 1.310 | 1.697 | 2.042 | 2.457 | 2.750 | 3.030 | 3.385 | 3.646 |
| 40 | 0.681 | 0.851 | 1.050 | 1.303 | 1.684 | 2.021 | 2.423 | 2.704 | 2.971 | 3.307 | 3.551 |
| 50 | 0.679 | 0.849 | 1.047 | 1.299 | 1.676 | 2.009 | 2.403 | 2.678 | 2.937 | 3.261 | 3.496 |
| 60 | 0.679 | 0.848 | 1.045 | 1.296 | 1.671 | 2.000 | 2.390 | 2.660 | 2.915 | 3.232 | 3.460 |
| 80 | 0.678 | 0.846 | 1.043 | 1.292 | 1.664 | 1.990 | 2.374 | 2.639 | 2.887 | 3.195 | 3.416 |
| 100 | 0.677 | 0.845 | 1.042 | 1.290 | 1.660 | 1.984 | 2.364 | 2.626 | 2.871 | 3.174 | 3.390 |
| 120 | 0.677 | 0.845 | 1.041 | 1.289 | 1.658 | 1.980 | 2.358 | 2.617 | 2.860 | 3.160 | 3.373 |
| ∞ | 0.674 | 0.842 | 1.036 | 1.282 | 1.645 | 1.960 | 2.326 | 2.576 | 2.807 | 3.090 | 3.291 |
| One-sided | 75% | 80% | 85% | 90% | 95% | 97.5% | 99% | 99.5% | 99.75% | 99.9% | 99.95% |
| Two-sided | 50% | 60% | 70% | 80% | 90% | 95% | 98% | 99% | 99.5% | 99.8% | 99.9% |
Calculating the confidence interval
Let’s say we have a sample with size 11, sample mean 10, and sample variance 2. For 90% confidence with 10 degrees of freedom, the one-sided t-value from the table is 1.372. Then with confidence interval calculated from
we determine that with 90% confidence we have a true mean lying below
In other words, 90% of the times that an upper threshold is calculated by this method from particular samples, this upper threshold exceeds the true mean.
And with 90% confidence we have a true mean lying above
In other words, 90% of the times that a lower threshold is calculated by this method from particular samples, this lower threshold lies below the true mean.
So that at 80% confidence (calculated from 100% − 2 × (1 − 90%) = 80%), we have a true mean lying within the interval
Saying that 80% of the times that upper and lower thresholds are calculated by this method from a given sample, the true mean is both below the upper threshold and above the lower threshold is not the same as saying that there is an 80% probability that the true mean lies between a particular pair of upper and lower thresholds that have been calculated by this method; see confidence interval and prosecutor’s fallacy.
Nowadays, statistical software, such as the R programming language, and functions available in many spreadsheet programs compute values of the t-distribution and its inverse without tables.
See also[edit]
Notes[edit]
- ^ Hurst, Simon. «The Characteristic Function of the Student t Distribution». Financial Mathematics Research Report No. FMRR006-95, Statistics Research Report No. SRR044-95. Archived from the original on February 18, 2010.
- ^ Helmert FR (1875). «Über die Berechnung des wahrscheinlichen Fehlers aus einer endlichen Anzahl wahrer Beobachtungsfehler». Z. Math. U. Physik. 20: 300–3.
- ^ Helmert FR (1876). «Über die Wahrscheinlichkeit der Potenzsummen der Beobachtungsfehler und uber einige damit in Zusammenhang stehende Fragen». Z. Math. Phys. 21: 192–218.
- ^ Helmert FR (1876). «Die Genauigkeit der Formel von Peters zur Berechnung des wahrscheinlichen Beobachtungsfehlers directer Beobachtungen gleicher Genauigkeit» [The accuracy of Peters’ formula for calculating the probable observation error of direct observations of the same accuracy]. Astron. Nachr. (in German). 88 (8–9): 113–132. Bibcode:1876AN…..88..113H. doi:10.1002/asna.18760880802.
- ^ Lüroth J (1876). «Vergleichung von zwei Werten des wahrscheinlichen Fehlers». Astron. Nachr. 87 (14): 209–20. Bibcode:1876AN…..87..209L. doi:10.1002/asna.18760871402.
- ^ Pfanzagl J, Sheynin O (1996). «Studies in the history of probability and statistics. XLIV. A forerunner of the t-distribution». Biometrika. 83 (4): 891–898. doi:10.1093/biomet/83.4.891. MR 1766040.
- ^ Sheynin O (1995). «Helmert’s work in the theory of errors». Arch. Hist. Exact Sci. 49 (1): 73–104. doi:10.1007/BF00374700. S2CID 121241599.
- ^ Pearson, K. (1895-01-01). «Contributions to the Mathematical Theory of Evolution. II. Skew Variation in Homogeneous Material». Philosophical Transactions of the Royal Society A: Mathematical, Physical and Engineering Sciences. 186: 343–414 (374). Bibcode:1895RSPTA.186..343P. doi:10.1098/rsta.1895.0010. ISSN 1364-503X.
- ^ «Student» [William Sealy Gosset] (1908). «The probable error of a mean» (PDF). Biometrika. 6 (1): 1–25. doi:10.1093/biomet/6.1.1. hdl:10338.dmlcz/143545. JSTOR 2331554.
- ^ Wendl MC (2016). «Pseudonymous fame». Science. 351 (6280): 1406. Bibcode:2016Sci…351.1406W. doi:10.1126/science.351.6280.1406. PMID 27013722.
- ^ Mortimer RG (2005). Mathematics for physical chemistry (3rd ed.). Burlington, MA: Elsevier. pp. 326. ISBN 9780080492889. OCLC 156200058.
- ^ a b Fisher RA (1925). «Applications of ‘Student’s’ distribution» (PDF). Metron. 5: 90–104. Archived from the original (PDF) on 5 March 2016.
- ^ Walpole RE, Myers R, Myers S, et al. (2006). Probability & Statistics for Engineers & Scientists (7th ed.). New Delhi: Pearson. p. 237. ISBN 9788177584042. OCLC 818811849.
- ^ Kruschke JK (2015). Doing Bayesian Data Analysis (2nd ed.). Academic Press. ISBN 9780124058880. OCLC 959632184.
- ^ a b c Johnson NL, Kotz S, Balakrishnan N (1995). «Chapter 28». Continuous Univariate Distributions. Vol. 2 (2nd ed.). Wiley. ISBN 9780471584940.
- ^ Gelman AB, Carlin JS, Rubin DB, et al. (1997). Bayesian Data Analysis (2nd ed.). Boca Raton: Chapman & Hall. p. 68. ISBN 9780412039911.
- ^ Hogg RV, Craig AT (1978). Introduction to Mathematical Statistics (4th ed.). New York: Macmillan. ASIN B010WFO0SA. Sections 4.4 and 4.8
{{cite book}}: CS1 maint: postscript (link) - ^ Cochran WG (1934). «The distribution of quadratic forms in a normal system, with applications to the analysis of covariance». Math. Proc. Camb. Philos. Soc. 30 (2): 178–191. Bibcode:1934PCPS…30..178C. doi:10.1017/S0305004100016595. S2CID 122547084.
- ^ Park SY, Bera AK (2009). «Maximum entropy autoregressive conditional heteroskedasticity model». J. Econom. 150 (2): 219–230. doi:10.1016/j.jeconom.2008.12.014.
- ^ Casella G, Berger RL (1990). Statistical Inference. Duxbury Resource Center. p. 56. ISBN 9780534119584.
- ^ a b Bailey RW (1994). «Polar Generation of Random Variates with the t-Distribution». Math. Comput. 62 (206): 779–781. Bibcode:1994MaCom..62..779B. doi:10.2307/2153537. JSTOR 2153537.
- ^ a b Jackman, S. (2009). Bayesian Analysis for the Social Sciences. Wiley Series in Probability and Statistics. Wiley. p. 507. doi:10.1002/9780470686621. ISBN 9780470011546.
- ^ Platen, Eckhard & Sidorowicz, Renata (March 2007). «Empirical Evidence on Student-t Log Returns of Diversified World Stock Indices» (PDF). Quantitative Finance Research Center. ISSN 1441-8010. Archived from the original (PDF) on 2019-04-30. Retrieved 2022-03-22.
{{cite journal}}: CS1 maint: multiple names: authors list (link) - ^ a b Bishop, C.M. (2006). Pattern Recognition and Machine Learning. New York, NY: Springer. ISBN 9780387310732.
- ^ Ord JK (1972). Families of Frequency Distributions. London: Griffin. ISBN 9780852641378. See Table 5.1.
{{cite book}}: CS1 maint: postscript (link) - ^ Ord JK (1972). «Chapter 5». Families of frequency distributions. London: Griffin. ISBN 9780852641378.
- ^ Lee, Se Yoon (2022). «The Use of a Log-Normal Prior for the Student t-Distribution». Axioms. 11 (9): 462. doi:10.3390/axioms11090462.
- ^ Fonseca, T.C.; Ferreira, M.A.; Migon, H.S. (2008). «Objective Bayesian analysis for the Student-t regression model». Biometrika. 95 (2): 325–333. doi:10.1093/biomet/asn001.
- ^ Fernández, C.; Steel, M.F. (1998). «On Bayesian modeling of fat tails and skewness». J. Am. Stat. Assoc.
- ^ Juárez, M.A.; Steel, M.F. (2010). «Model-based clustering of non-Gaussian panel data based on skew-t distributions». J. Bus. Econ. Stat. 28: 52–66. doi:10.1198/jbes.2009.07145. S2CID 10091669.
- ^ Lee, Se Yoon (2022). «The Use of a Log-Normal Prior for the Student t-Distribution». Axioms. 11 (9): 462. doi:10.3390/axioms11090462.
- ^ Lange KL, Little RJ, Taylor JM (1989). «Robust Statistical Modeling Using the t Distribution» (PDF). J. Am. Stat. Assoc. 84 (408): 881–896. doi:10.1080/01621459.1989.10478852. JSTOR 2290063.
- ^ Gelman AB, Carlin JB, Stern HS, et al. (2014). «Computationally efficient Markov chain simulation». Bayesian Data Analysis. Boca Raton, Florida: CRC Press. p. 293. ISBN 9781439898208.
- ^ Shah, Amar; Wilson, Andrew Gordon; Ghahramani, Zoubin (2014). «Student-t processes as alternatives to Gaussian processes» (PDF). JMLR. 33 (Proceedings of the 17th International Conference on Artificial Intelligence and Statistics (AISTATS) 2014, Reykjavik, Iceland): 877–885. arXiv:1402.4306.
- ^ Chen, Zexun; Wang, Bo; Gorban, Alexander N. (2019). «Multivariate Gaussian and Student-t process regression for multi-output prediction». Neural Computing and Applications. 32 (8): 3005–3028. arXiv:1703.04455. doi:10.1007/s00521-019-04687-8.
- ^ Sun, Jingchao; Kong, Maiying; Pal, Subhadip (22 June 2021). «The Modified-Half-Normal distribution: Properties and an efficient sampling scheme». Communications in Statistics — Theory and Methods. 52 (5): 1591–1613. doi:10.1080/03610926.2021.1934700. ISSN 0361-0926. S2CID 237919587.
References[edit]
- Senn, S.; Richardson, W. (1994). «The first t-test». Statistics in Medicine. 13 (8): 785–803. doi:10.1002/sim.4780130802. PMID 8047737.
- Hogg RV, Craig AT (1978). Introduction to Mathematical Statistics (4th ed.). New York: Macmillan. ASIN B010WFO0SA.
- Venables, W. N.; Ripley, B. D. (2002). Modern Applied Statistics with S (Fourth ed.). Springer.
- Gelman, Andrew; John B. Carlin; Hal S. Stern; Donald B. Rubin (2003). Bayesian Data Analysis (Second ed.). CRC/Chapman & Hall. ISBN 1-58488-388-X.
External links[edit]
- «Student distribution», Encyclopedia of Mathematics, EMS Press, 2001 [1994]
- Earliest Known Uses of Some of the Words of Mathematics (S) (Remarks on the history of the term «Student’s distribution»)
- Rouaud, M. (2013), Probability, Statistics and Estimation (PDF) (short ed.) First Students on page 112.
- Student’s t-Distribution, Archived 2021-04-10 at the Wayback Machine ck12
Доверительные интервалы
Общий обзор
Доверительный интервал для среднего
Доверительный интервал для пропорции
Интерпретация доверительных интервалов
Общий обзор
Взяв выборку из популяции, мы получим точечную оценку интересующего нас параметра и вычислим стандартную ошибку для того, чтобы указать точность оценки.
Однако, для большинства случаев стандартная ошибка как такова не приемлема. Гораздо полезнее объединить эту меру точности с интервальной оценкой для параметра популяции.
Это можно сделать, используя знания о теоретическом распределении вероятности выборочной статистики (параметра) для того, чтобы вычислить доверительный интервал (CI – Confidence Interval, ДИ – Доверительный интервал) для параметра.
Вообще, доверительный интервал расширяет оценки в обе стороны некоторой величиной, кратной стандартной ошибке (данного параметра); два значения (доверительные границы), определяющие интервал, обычно отделяют запятой и заключают в скобки.
Доверительный интервал для среднего
Использование нормального распределения
Выборочное среднее имеет нормальное распределение, если объем выборки большой, поэтому можно применить знания о нормальном распределении при рассмотрении выборочного среднего.
В частности, 95% распределения выборочных средних находится в пределах 1,96 стандартных отклонений (SD) среднего популяции.
Когда у нас есть только одна выборка, мы называем это стандартной ошибкой среднего (SEM) и вычисляем 95% доверительного интервала для среднего следующим образом:
Если повторить этот эксперимент несколько раз, то интервал будет содержать истинное среднее популяции в 95% случаев.
Обычно это доверительный интервал как, например, интервал значений, в пределах которого с доверительной вероятностью 95% находится истинное среднее популяции (генеральное среднее).
Хотя это не вполне строго (среднее в популяции есть фиксированное значение и поэтому не может иметь вероятность, отнесённую к нему) таким образом интерпретировать доверительный интервал, но концептуально это удобнее для понимания.
Использование t-распределения
Можно использовать нормальное распределение, если знать значение дисперсии в популяции. Кроме того, когда объем выборки небольшой, выборочное среднее отвечает нормальному распределению, если данные, лежащие в основе популяции, распределены нормально.
Если данные, лежащие в основе популяции, распределены ненормально и/или неизвестна генеральная дисперсия (дисперсия в популяции), выборочное среднее подчиняется t-распределению Стьюдента.
Вычисляем 95% доверительный интервал для генерального среднего в популяции следующим образом:
где — процентная точка (процентиль) t-распределения Стьюдента с (n-1) степенями свободы, которая даёт двухстороннюю вероятность 0,05.
Вообще, она обеспечивает более широкий интервал, чем при использовании нормального распределения, поскольку учитывает дополнительную неопределенность, которую вводят, оценивая стандартное отклонение популяции и/или из-за небольшого объёма выборки.
Когда объём выборки большой (порядка 100 и более), разница между двумя распределениями (t-Стьюдента и нормальным) незначительна. Тем не менее всегда используют t-распределение при вычислении доверительных интервалов, даже если объем выборки большой.
Обычно указывают 95% ДИ. Можно вычислить другие доверительные интервалы, например 99% ДИ для среднего.
Вместо произведения стандартной ошибки и табличного значения t-распределения, которое соответствует двусторонней вероятности 0,05, умножают её (стандартную ошибку) на значение, которое соответствует двусторонней вероятности 0,01. Это более широкий доверительный интервал, чем в случае 95%, поскольку он отражает увеличенное доверие к тому, что интервал действительно включает среднее популяции.
Доверительный интервал для пропорции
Выборочное распределение пропорций имеет биномиальное распределение. Однако если объём выборки n разумно большой, тогда выборочное распределение пропорции приблизительно нормально со средним .
Оцениваем выборочным отношением p=r/n (где r– количество индивидуумов в выборке с интересующими нас характерными особенностями), и стандартная ошибка оценивается:
95% доверительный интервал для пропорции оценивается:
Если объём выборки небольшой (обычно когда np или n(1-p) меньше 5), тогда необходимо использовать биномиальное распределение для того, чтобы вычислить точные доверительные интервалы.
Заметьте, что если p выражается в процентах, то (1-p) заменяют на (100-p).
Интерпретация доверительных интервалов
При интерпретации доверительного интервала нас интересуют следующие вопросы:
Насколько широк доверительный интервал?
Широкий доверительный интервал указывает на то, что оценка неточна; узкий указывает на точную оценку.
Ширина доверительного интервала зависит от размера стандартной ошибки, которая, в свою очередь, зависит от объёма выборки и при рассмотрении числовой переменной от изменчивости данных дают более широкие доверительные интервалы, чем исследования многочисленного набора данных немногих переменных.
Включает ли ДИ какие-либо значения, представляющие особенный интерес?
Можно проверить, ложится ли вероятное значение для параметра популяции в пределы доверительного интервала. Если да, то результаты согласуются с этим вероятным значением. Если нет, тогда маловероятно (для 95% доверительного интервала шанс почти 5%), что параметр имеет это значение.
Связанные определения:
Доверительный интервал
Доверительный предел
Коэффициент доверия
Оценка
Оценочная функция
Свободный от распределения доверительный интервал
В начало
Содержание портала
Проверка статистической гипотезы позволяет сделать строгий вывод о характеристиках генеральной совокупности на основе выборочных данных. Гипотезы бывают разные. Одна из них – это гипотеза о средней (математическом ожидании). Суть ее в том, чтобы на основе только имеющейся выборки сделать корректное заключение о том, где может или не может находится генеральная средняя (точную правду мы никогда не узнаем, но можем сузить круг поиска).
Распределение Стьюдента
Общий подход в проверке гипотез описан здесь, поэтому сразу к делу. Предположим для начала, что выборка извлечена из нормальной совокупности случайных величин X с генеральной средней μ и дисперсией σ2. Средняя арифметическая из этой выборки, очевидно, сама является случайной величиной. Если извлечь много таких выборок и посчитать по ним средние, то они также будут иметь нормальное распределение с математическим ожиданием μ и дисперсией
Тогда случайная величина
имеет стандартное нормальное распределение со всеми вытекающими отсюда последствиями. Например, с вероятностью 95% ее значение не выйдет за пределы ±1,96.
Однако такой подход будет корректным, если известна генеральная дисперсия. В реальности, как правило, она не известна. Вместо нее берут оценку – несмещенную выборочную дисперсию:
где
Возникает вопрос: будет ли генеральная средняя c вероятностью 95% находиться в пределах ±1,96sx̅. Другими словами, являются ли распределения случайных величин
и
эквивалентными.
Впервые этот вопрос был поставлен (и решен) одним химиком, который трудился на пивной фабрике Гиннесса в г. Дублин (Ирландия). Химика звали Уильям Сили Госсет и он брал пробы пива для проведения химического анализа. В какой-то момент, видимо, Уильяма стали терзать смутные сомнения на счет распределения средних. Оно получалось немного более размазанным, чем должно быть у нормального распределения.
Собрав математическое обоснование и рассчитав значения функции обнаруженного им распределения, химик из Дублина Уильям Госсет написал заметку, которая была опубликована в мартовском выпуске 1908 года журнала «Биометрика» (главред – Карл Пирсон). Гиннесс строго-настрого запретил выдавать секреты пивоварения, и Госсет подписался псевдонимом Стьюдент.
Несмотря на то что, К. Пирсон уже изобрел распределение Хи-квадрат, все-таки всеобщее представление о нормальности еще доминировало. Никто не собирался думать, что распределение выборочных оценок может быть не нормальным. Поэтому статья У. Госсета осталась практически не замеченной и забытой. И только Рональд Фишер по достоинству оценил открытие Госсета. Фишер использовал новое распределение в своих работах и дал ему название t-распределение Стьюдента. Критерий для проверки гипотез, соответственно, стал t-критерием Стьюдента. Так произошла «революция» в статистике, которая шагнула в эру анализа выборочных данных. Это был краткий экскурс в историю.
Посмотрим, что же мог увидеть У. Госсет. Сгенерируем 20 тысяч нормальных выборок из 6-ти наблюдений со средней (X̅) 50 и среднеквадратичным отклонением (σ) 10. Затем нормируем выборочные средние, используя генеральную дисперсию:
Получившиеся 20 тысяч средних сгруппируем в интервалы длинной 0,1 и подсчитаем частоты. Изобразим на диаграмме фактическое (Norm) и теоретическое (ENorm) распределение частот выборочных средних.
Точки (наблюдаемые частоты) практически совпадают с линией (теоретическими частотами). Оно и понятно, ведь данные взяты из одной и то же генеральной совокупности, а отличия – это лишь ошибки выборки.
Проведем новый эксперимент. Нормируем средние, используя выборочную дисперсию.
Снова подсчитаем частоты и нанесем их на диаграмму в виде точек, оставив для сравнения линию стандартного нормального распределения. Обозначим эмпирическое частоты средних, скажем, через букву t.
Видно, что распределения на этот раз не очень-то и совпадают. Близки, да, но не одинаковы. Хвосты стали более «тяжелыми».
У Госсета-Стьюдента не было последней версии MS Excel, но именно этот эффект он и заметил. Почему так получается? Объяснение заключается в том, что случайная величина
зависит не только от ошибки выборки (числителя), но и от стандартной ошибки средней (знаменателя), которая также является случайной величиной.
Давайте немного разберемся, какое распределение должно быть у такой случайной величины. Вначале придется кое-что вспомнить (или узнать) из математической статистики. Есть такая теорема Фишера, которая гласит, что в выборке из нормального распределения:
1. средняя X̅ и выборочная дисперсия s2 являются независимыми величинами;
2. соотношение выборочной и генеральной дисперсии, умноженное на количество степеней свободы, имеет распределение χ2(хи-квадрат) с таким же количеством степеней свободы, т.е.
где k – количество степеней свободы (на английском degrees of freedom (d.f.))
Вернемся к распределению средней. Разделим числитель и знаменатель выражения
на σX̅. Получим
Числитель – это стандартная нормальная случайная величина (обозначим ξ (кси)). Знаменатель выразим из теоремы Фишера.
Тогда исходное выражение примет вид
Это и есть t-критерий Стьюдента в общем виде (стьюдентово отношение). Вывести функцию его распределения можно уже непосредственно, т.к. распределения обеих случайных величин в данном выражении известны. Оставим это удовольствие математикам.
Функция t-распределения Стьюдента имеет довольно сложную для понимания формулу, поэтому не имеет смысла ее разбирать. Вероятности и квантили t-критерия приведены в специальных таблицах распределения Стьюдента и забиты в функции разных ПО вроде Excel.
Итак, вооружившись новыми знаниями, вы сможете понять официальное определение распределения Стьюдента.
Случайной величиной, подчиняющейся распределению Стьюдента с k степенями свободы, называется отношение независимых случайных величин
где ξ распределена по стандартному нормальному закону, а χ2k подчиняется распределению χ2 c k степенями свободы.
Таким образом, формула критерия Стьюдента для средней арифметической
есть частный случай стьюдентова отношения
Из формулы и определения следует, что распределение т-критерия Стьюдента зависит лишь от количества степеней свободы.
При k > 30 t-критерий практически не отличается от стандартного нормального распределения.
В отличие от хи-квадрат, t-критерий может быть одно- и двусторонним. Обычно пользуются двусторонним, предполагая, что отклонение может происходить в обе стороны от средней. Но если условие задачи допускает отклонение только в одну сторону, то разумно применять односторонний критерий. От этого немного увеличивается мощность критерия.
Несмотря на то, что открытие Стьюдента в свое время совершило переворот в статистике, t-критерий все же довольно сильно ограничен в возможностях применения, т.к. сам по себе происходит из предположения о нормальном распределении исходных данных. Если данные не являются нормальными (что обычно и бывает), то и t-критерий уже не будет иметь распределения Стьюдента. Однако в силу действия центральной предельной теоремы средняя даже у ненормальных данных быстро приобретает колоколообразную форму распределения.
Рассмотрим, для примера, данные, имеющие выраженный скос вправо, как у распределения хи-квадрат с 5-ю степенями свободы.
Теперь создадим 20 тысяч выборок и будет наблюдать, как меняется распределение средних в зависимости от их объема.
Отличие довольно заметно в малых выборках до 15-20-ти наблюдений. Но дальше оно стремительно исчезает. Таким образом, ненормальность распределения – это, конечно, нехорошо, но некритично.
Больше всего t-критерий «боится» выбросов, т.е. аномальных отклонений. Возьмем 20 тыс. нормальных выборок по 15 наблюдений и в часть из них добавим по одному случайном выбросу.
Картина получается нерадостная. Фактические частоты средних сильно отличаются от теоретических. Использование t-распределения в такой ситуации становится весьма рискованной затеей.
Итак, в не очень малых выборках (от 15-ти наблюдений) t-критерий относительно устойчив к ненормальному распределению исходных данных. А вот выбросы в данных сильно искажают распределение t-критерия, что, в свою очередь, может привести к ошибкам статистического вывода, поэтому от аномальных наблюдений следует избавиться. Часто из выборки удаляют все значения, выходящие за пределы ±2 стандартных отклонения от средней.
Пример проверки гипотезы о математическом ожидании с помощью t- критерия Стьюдента в MS Excel
В Excel есть несколько функций, связанных с t-распределением. Рассмотрим их.
СТЬЮДЕНТ.РАСП – «классическое» левостороннее t-распределение Стьюдента. На вход подается значение t-критерия, количество степеней свободы и опция (0 или 1), определяющая, что нужно рассчитать: плотность или значение функции. На выходе получаем, соответственно, плотность или вероятность того, что случайная величина окажется меньше указанного в аргументе t-критерия, т.е. левосторонний p-value.
СТЬЮДЕНТ.РАСП.2Х – двухсторонне распределение. В качестве аргумента подается абсолютное значение (по модулю) t-критерия и количество степеней свободы. На выходе получаем вероятность получить такое или еще больше значение t-критерия (по модулю), т.е. фактический уровень значимости (p-value).
СТЬЮДЕНТ.РАСП.ПХ – правостороннее t-распределение. Так, 1-СТЬЮДЕНТ.РАСП(2;5;1) = СТЬЮДЕНТ.РАСП.ПХ(2;5) = 0,05097. Если t-критерий положительный, то полученная вероятность – это p-value.
СТЬЮДЕНТ.ОБР – используется для расчета левостороннего обратного значения t-распределения. В качестве аргумента подается вероятность и количество степеней свободы. На выходе получаем соответствующее этой вероятности значение t-критерия. Отсчет вероятности идет слева. Поэтому для левого хвоста нужен сам уровень значимости α, а для правого 1 — α.
СТЬЮДЕНТ.ОБР.2Х – обратное значение для двухстороннего распределения Стьюдента, т.е. значение t-критерия (по модулю). Также на вход подается уровень значимости α. Только на этот раз отсчет ведется с двух сторон одновременно, поэтому вероятность распределяется на два хвоста. Так, СТЬЮДЕНТ.ОБР(1-0,025;5) = СТЬЮДЕНТ.ОБР.2Х(0,05;5) = 2,57058
СТЬЮДЕНТ.ТЕСТ – функция для проверки гипотезы о равенстве математических ожиданий в двух выборках. Заменяет кучу расчетов, т.к. достаточно указать лишь два диапазона с данными и еще пару параметров. На выходе получим p-value.
ДОВЕРИТ.СТЬЮДЕНТ – расчет доверительного интервала средней с учетом t-распределения.
Рассмотрим такой учебный пример. На предприятии фасуют цемент в мешки по 50кг. В силу случайности в отдельно взятом мешке допускается некоторое отклонение от ожидаемой массы, но генеральная средняя должна оставаться 50кг. В отделе контроля качества случайным образом взвесили 9 мешков и получили следующие результаты: средняя масса (X̅) составила 50,3кг, среднеквадратичное отклонение (s) – 0,5кг.
Согласуется ли полученный результат с нулевой гипотезой о том, что генеральная средняя равна 50кг? Другими словами, можно ли получить такой результат по чистой случайности, если оборудование работает исправно и выдает среднее наполнение 50 кг? Если гипотеза не будет отклонена, то полученное различие вписывается в диапазон случайных колебаний, если же гипотеза будет отклонена, то, скорее всего, в настройках аппарата, заполняющего мешки, произошел сбой. Требуется его проверка и настройка.
Краткое условие в обще принятых обозначениях выглядит так.
H0: μ = 50 кг
Ha: μ ≠ 50 кг
Есть основания предположить, что распределение заполняемости мешков подчиняются нормальному распределению (или не сильно от него отличается). Значит, для проверки гипотезы о математическом ожидании можно использовать t-критерий Стьюдента. Случайные отклонения могут происходить в любую сторону, значит нужен двусторонний t-критерий.
Вначале применим допотопные средства: ручной расчет t-критерия и сравнение его с критическим табличным значением. Расчетный t-критерий:
Теперь определим, выходит ли полученное число за критический уровень при уровне значимости α = 0,05. Воспользуемся таблицей для критерия Стьюдента (есть в любом учебнике по статистике).
По столбцам идет вероятность правой части распределения, по строкам – число степеней свободы. Нас интересует двусторонний t-критерий с уровнем значимости 0,05, что равносильно t-значению для половины уровня значимости справа: 1 — 0,05/2 = 0,975. Количество степеней свободы – это объем выборки минус 1, т.е. 9 — 1 = 8. На пересечении находим табличное значение t-критерия – 2,306. Если бы мы использовали стандартное нормальное распределение, то критической точкой было бы значение 1,96, а тут она больше, т.к. t-распределение на небольших выборках имеет более приплюснутый вид.
Сравниваем фактическое (1,8) и табличное значение (2.306). Расчетный критерий оказался меньше табличного. Следовательно, имеющиеся данные не противоречат гипотезе H0 о том, что генеральная средняя равна 50 кг (но и не доказывают ее). Это все, что мы можем узнать, используя таблицы. Можно, конечно, еще p-value попробовать найти, но он будет приближенным. А, как правило, именно p-value используется для проверки гипотез. Поэтому далее переходим в Excel.
Готовой функции для расчета t-критерия в Excel нет. Но это и не страшно, ведь формула t-критерия Стьюдента довольно проста и ее можно легко соорудить прямо в ячейке Excel.
Получили те же 1,8. Найдем вначале критическое значение. Альфа берем 0,05, критерий двусторонний. Нужна функция обратного значения t-распределения для двухсторонней гипотезы СТЬЮДЕНТ.ОБР.2Х.
Полученное значение отсекает критическую область. Наблюдаемый t-критерий в нее не попадает, поэтому гипотеза не отклоняется.
Однако это тот же способ проверки гипотезы с помощью табличного значения. Более информативно будет рассчитать p-value, т.е. вероятность получить наблюдаемое или еще большее отклонение от средней 50кг, если эта гипотеза верна. Потребуется функция распределения Стьюдента для двухсторонней гипотезы СТЬЮДЕНТ.РАСП.2Х.
P-value равен 0,1096, что больше допустимого уровня значимости 0,05 – гипотезу не отклоняем. Но теперь можно судить о степени доказательства. P-value оказался довольно близок к тому уровню, когда гипотеза отклоняется, а это наводит на разные мысли. Например, что выборка оказалась слишком мала для обнаружения значимого отклонения.
Пусть через некоторое время отдел контроля снова решил проверить, как выдерживается стандарт заполняемости мешков. На этот раз для большей надежности было отобрано не 9, а 25 мешков. Интуитивно понятно, что разброс средней уменьшится, а, значит, и шансов найти сбой в системе становится больше.
Допустим, были получены те же значения средней и стандартного отклонения по выборке, что и в первый раз (50,3 и 0,5 соответственно). Рассчитаем t-критерий.
Критическое значение для 24-х степеней свободы и α = 0,05 составляет 2,064. На картинке ниже видно, что t-критерий попадает в область отклонения гипотезы.
Можно сделать вывод о том, что с доверительной вероятностью более 95% генеральная средняя отличается от 50кг. Для большей убедительности посмотрим на p-value (последняя строка в таблице). Вероятность получить среднюю с таким или еще большим отклонением от 50, если гипотеза верна, составляет 0,0062, или 0,62%, что при однократном измерении практически невозможно. В общем, гипотезу отклоняем, как маловероятную.
Расчет доверительного интервала для математического ожидания с помощью t-распределения Стьюдента в Excel
С проверкой гипотез тесно связан еще один статистический метод – расчет доверительных интервалов. Если в полученный интервал попадает значение, соответствующее нулевой гипотезе, то это равносильно тому, что нулевая гипотеза не отклоняется. В противном случае, гипотеза отклоняется с соответствующей доверительной вероятностью. В некоторых случаях аналитики вообще не проверяют гипотез в классическом виде, а рассчитывают только доверительные интервалы. Такой подход позволяет извлечь еще больше полезной информации.
Рассчитаем доверительные интервалы для средней при 9 и 25 наблюдениях. Для этого воспользуемся функцией Excel ДОВЕРИТ.СТЬЮДЕНТ. Здесь, как ни странно, все довольно просто. В аргументах функции нужно указать только уровень значимости α, стандартное отклонение по выборке и размер выборки. На выходе получим полуширину доверительного интервала, то есть значение которое нужно отложить по обе стороны от средней. Проведя расчеты и нарисовав наглядную диаграмму, получим следующее.
Как видно, при выборке в 9 наблюдений значение 50 попадает в доверительный интервал (гипотеза не отклоняется), а при 25-ти наблюдениях не попадает (гипотеза отклоняется). При этом в эксперименте с 25-ю мешками можно утверждать, что с вероятностью 97,5% генеральная средняя превышает 50,1 кг (нижняя граница доверительного интервала равна 50,094кг). А это довольно ценная информация.
Таким образом, мы решили одну и ту же задачу тремя способами:
1. Древним подходом, сравнивая расчетное и табличное значение t-критерия
2. Более современным, рассчитав p-value, добавив степень уверенности при отклонении гипотезы.
3. Еще более информативным, рассчитав доверительный интервал и получив минимальное значение генеральной средней.
Важно помнить, что t-критерий относится к параметрическим методам, т.к. основан на нормальном распределении (у него два параметра: среднее и дисперсия). Поэтому для его успешного применения важна хотя бы приблизительная нормальность исходных данных и отсутствие выбросов.
Напоследок предлагаю видеоролик о том, как рассчитать критерий Стьюдента и проверить гипотезу о генеральной средней в Excel.
Иногда просят объяснить, как делаются такие наглядные диаграммы с распределением. Ниже можно скачать файл, где проводились расчеты для этой статьи.
Скачать файл с примером.
Всего доброго, будьте здоровы.
Поделиться в социальных сетях:
Доброго времени суток, хабраледи и хабраджентельмены! В этой статье мы продолжим погружение в статистику вместе с Python. Если кто пропустил начало погружения, то вот ссылка на первую часть. Ну, а если нет, то я по-прежнему рекомендую держать под рукой открытую книгу Сары Бослаф «Статистика для всех». Так же рекомендую запустить блокнот, чтобы поэкспериментировать с кодом и графиками.
Как сказал Эндрю Ланг: «Статистика для политика – все равно что уличный фонарь для пьяного забулдыги: скорее опора, чем освещение.» Тоже самое можно сказать и про эту статью для новичков. Вряд ли вы почерпнете здесь много новых знаний, но надеюсь, эта статья поможет вам разобраться с тем, как использовать Python для облегчения самостоятельного изучения статистики.
Зачем выдумывать новые распределения?
Представим… так, прежде чем нам что-то представлять, давайте снова сделаем все необходимые импорты:
import numpy as np
from scipy import stats
import matplotlib.pyplot as plt
import seaborn as sns
from pylab import rcParams
sns.set()
rcParams['figure.figsize'] = 10, 6
%config InlineBackend.figure_format = 'svg'
np.random.seed(42)
А вот теперь давайте представим, что мы пивовары, придумавшие рецепт и технологию варки классного пива. Продажи идут хорошо, да и в целом все неплохо, но все-таки очень интересно, как потребители оценивают качество нашего пива. Мы решили опросить 1000 человек и оценить качество напитка по 100-бальной шкале в сравнении с другими сортами пива, которые им доводилось пробовать ранее. Данные опроса могли бы выглядеть так:
gen_pop = np.trunc(stats.norm.rvs(loc=80, scale=5, size=1000))
gen_pop[gen_pop>100]=100
print(f'mean = {gen_pop.mean():.3}')
print(f'std = {gen_pop.std():.3}')
mean = 79.5
std = 4.95В данном случае, мы можем предположить, что оценки распределены нормально с мат. ожиданием и стандартным отклонением 80 и 5 баллов соответственно. Такой результат означает, что массовый потребитель, конечно же, не считает наше пиво лучшим в мире, но в среднем, видит его где-то в числе лучших.
Все могло бы быть ровно да гладко, особенно в нашем воображении. Но теперь давайте представим, что случилась внезапная неприятность — поставщик хмеля пострадал от неурожая и нам пришлось срочно покупать сырье у другого производителя. Очевидно, что это как-то скажется на качестве пива, но как? Единственный способ проверить это — сварить небольшую партию с новым хмелем и провести опрос у небольшой группы респондентов. Допустим, в оценке качества нового пива приняли участие всего 10 человек, а их оценки распределились следующим образом:
Теперь мы можем вычислить Z-статистику по уже известной нам формуле:
где — это среднее значение для нашей выборки,
и
среднее значение и стандартное отклонение для генеральной совокупности, а
— размер выборки. Вот среднее нашей выборки:
sample = np.array([89,99,93,84,79,61,82,81,87,82])
sample.mean()83.7Вот значение Z-статистики:
z = 10**0.5*(sample.mean()-80)/5
z2.340085468524603И еще обязательно вычисляем p-value:
1 - (stats.norm.cdf(z) - stats.norm.cdf(-z))0.019279327322753836Для нас, как для пивоваров, это крайне интересные цифры и вот почему: Z-значение отстоит от 0 более чем на 2 сигмы, т.е. отклонение среднего балла 10 респондентов находится очень далеко от среднего бала генеральной совокупности, а вероятность того, что это отклонение произошло случайно, всего около 0.02. Другими словами, если взять 10 человек из совокупности людей, которые оценивают наше «старое» пиво как , то вероятность того, что эти 10 человек могут случайно дать среднюю оценку «новому» пиву равную 83.7 баллам составляет всего около 2%. Скорее всего, если мы проведем полномасштабный опрос, то увидим, что потребители не просто не заметят изменения качества пива, а даже отметят его небольшое улучшение. Круто.
Но вот что странно — стандартное отклонение оценок тех самых срочно найденных 10 респондентов в два раза больше, чем то, которым мы оценили всю генеральную совокупность потребителей:
sample.std(ddof=1)10.055954565441423Врезка по поводу ddof в std
Стандартное отклонение можно рассматривать либо как параметр , если речь идет о генеральной совокупности, либо как статистику
, если мы говорим о выборке. Оба значения могут быть вычислены по следующим формулам:
Как видите, отличия не очень сильные и заключаются только в том, что при расчете мы используем мат. ожидание генеральной совокупности —
и делим на
, а при вычислении
используем среднее значение выборки и делим на
. Зачем делить на
вместо
? Все дело в том, что при расчете отклонения выборки вместо
используется
из-за чего значения
получаются несколько ниже, чем реальное значение
для генеральной совокупности. Поэтому знаменатель
нужен для того, чтобы несколько подправить результат — пододвинуть его чуть поближе к истинному значению.
Для того, чтобы учитывать поправку в методе std() пакета NumPy есть параметр ddof, который по умолчанию равен 0, но если мы применяем std() к небольшой выборке, то необходимо явно указать, что ddof=1. Влияние данного параметра на расчеты может быть очень значимым. Например, если мы возьмем 10000 выборок по 10 элементов из и построим распределение стандартных отклонений, то увидим, что при ddof=0 пик распределения находится левее реального значения стандартного отклонения. При ddof=1 пик распределения так же расположен левее реального значения, но все-таки ближе к нему, чем при ddof=0:
fig, ax = plt.subplots(nrows=1, ncols=2, figsize = (12, 5))

for i in [0, 1]:
    deviations = np.std(stats.norm.rvs(80, 5, (10000, 10)), axis=1, ddof=i)
    sns.histplot(x=deviations ,stat='probability', ax=ax[i])
    ax[i].vlines(5, 0, 0.06, color='r', lw=2)
    ax[i].set_title('ddof = ' + str(i), fontsize = 15)
    ax[i].set_ylim(0, 0.07)
    ax[i].set_xlim(0, 11)
fig.suptitle(r'$s={sqrt {{frac {1}{10 - mathrm{ddof}}}sum _{i=1}^{10}left(x_{i}-{bar {x}}right)^{2}}}$',
             fontsize = 20, y=1.15);
Является ли этот факт важным и можно ли теперь быть уверенными в выводе, который мы сделали на основе Z-статистики? Первое, что приходит в голову — посмотреть, как может быть распределено стандартное отклонение большого количества выборок из генеральной совокупности. Давайте сделаем 5000 тысяч выборок по 10 человек, взятых из распределения и посмотрим на распределение стандартного отклонения баллов этих выборок:
deviations  = np.std(stats.norm.rvs(80, 5, (5000, 10)), axis=1, ddof=1)
sns.histplot(x=deviations ,stat='probability');
Это похоже на колокол нормального распределения, но важнее то, что стандартное отклонение выборочных оценок не отклоняется до значения равного 10-и баллам. А это крайне настораживающе. Судите сами, если вероятность того, что отклонение среднего балла наших 10 респондентов от среднего генеральной совокупности составляет всего 2%, то вероятность того, что стандартное отклонение (уж простите за каламбур) может отклониться до значения в 10 баллов стремится к 0. А это означает, что для наших выводов об улучшении качества пива, есть вполне уместное замечание: может быть опрос 10-и респондентов свидетельствует не только об изменении среднего генеральной совокупности, может быть ее стандартное отклонение тоже изменилось.
В конце концов, добавление нового сорта хмеля могло привести к большей специфичности вкуса, следовательно, вызвать большую разнонаправленность в предпочтениях: кому-то этот вкус пива стал нравиться больше, кому-то меньше, но средняя оценка могла остаться прежней. Например, если генеральная совокупность оценок «нового» пива теперь распределена как , то Z-статистика и p-value для имеющихся 10-и оценок будет выглядеть не так обнадеживающе:
z = 10**0.5*(sample.mean()-80)/10
p = 1 - (stats.norm.cdf(z) - stats.norm.cdf(-z))
print(f'z = {z:.3}')
print(f'p-value = {p:.4}')
z = 1.17
p-value = 0.242Оказывается, что для распределения резульататы оказались значимыми, но как только мы оценили стандартное отклонение генеральной совокупности тем же значением, что и у выборки, т.е. представили, что генеральная совокупность распределена как
, то это очень сильно отразилось на значимости имеющихся оценок. Ведь вероятность получить такое же или даже еще более отклоненное среднее теперь равна не 2%, а почти 25%. Хотя, всего-то заменили
на
.
В конце концов, не является ли оценка стандартного отклонения генеральной совокупности значением отклонения выборки более разумным решением? Давайте выясним это! Для этого просто сравним то, как могут быть распределены две статистики: (напомню, что параметрами называют характеристики генеральной совокупности, а статистиками — характеристики выборок)
По сути мы просто придумали новую T-статистику, которая отличается от Z-статистики только тем, что в знаменателе стоит не генеральной совокупности, а
выборки. А теперь сделаем 10000 выборок из
, вычислим для каждой выборки Z- и T-статистику, а распределение значений изобразим в виде гистограмм:
fig, ax = plt.subplots(nrows=1, ncols=2, figsize = (12, 5))

N = 10000
samples = stats.norm.rvs(80, 5, (N, 10))
statistics = [lambda x: 10**0.5*(np.mean(x, axis=1) - 80)/5,
              lambda x: 10**0.5*(np.mean(x, axis=1) - 80)/np.std(x, axis=1, ddof=1)]
title = 'ZT'
bins = np.linspace(-6, 6, 80, endpoint=True)

for i in range(2):
    values = statistics[i](samples)
    sns.histplot(x=values ,stat='probability', bins=bins, ax=ax[i])
    p = values[(values > -2)&(values < 2)].size/N
    ax[i].set_title('P(-2 < {} < 2) = {:.3}'.format(title[i], p))
    ax[i].set_xlim(-6, 6)
    ax[i].vlines([-2, 2], 0, 0.06, color='r');
Я все-таки не удержался и сделал гифку:
Код для гифки
import matplotlib.animation as animation

fig, axes = plt.subplots(nrows=1, ncols=2, figsize = (18, 8))

def animate(i):
    for ax in axes:
        ax.clear()
    N = 10000
    samples = stats.norm.rvs(80, 5, (N, 10))
    statistics = [lambda x: 10**0.5*(np.mean(x, axis=1) - 80)/5,
                  lambda x: 10**0.5*(np.mean(x, axis=1) - 80)/np.std(x, axis=1, ddof=1)]
    title = 'ZT'
    bins = np.linspace(-6, 6, 80, endpoint=True)

    for j in range(2):
        values = statistics[j](samples)
        sns.histplot(x=values ,stat='probability', bins=bins, ax=axes[j])
        p = values[(values > -2)&(values < 2)].size/N
        axes[j].set_title(r'$P(-2sigma < {} < 2sigma) = {:.3}$'.format(title[j], p))
        axes[j].set_xlim(-6, 6)
        axes[j].set_ylim(0, 0.07)
        axes[j].vlines([-2, 2], 0, 0.06, color='r')
    return axes

dist_animation = animation.FuncAnimation(fig,
                                      animate,
                                      frames=np.arange(7),
                                      interval = 200,
                                      repeat = False)

dist_animation.save('statistics_dist.gif',
                 writer='imagemagick',
                 fps=1)
Просто мне кажется, что так можно продемонстрировать, как едва заметные черты могут оказаться чрезвычайно важными для исследователя. На что я хочу обратить ваше внимание? Во-первых, и слева, и справа мы видим свиду два одинаковых колоколообразных распределения. Вполне уместно предположить, что это два стандартных нормальных распределения, верно? Но, вот что любопытно, в интервал
должен содержать около 95.5% всех значений. Для Z-статистики это требование выполняется, а для придуманной нами T-статистики не очень, потому что только 92-93% ее значений укладываются в заданный интервал. Казалось бы, что отличие не столь велико, чтобы заподозрить какую-то закономерность, но мы можем провести больше экспериментов:
statistics = [lambda x: 10**0.5*(np.mean(x, axis=1) - 80)/5,
              lambda x: 10**0.5*(np.mean(x, axis=1) - 80)/np.std(x, axis=1, ddof=1)]

quantity = 50
N=10000
result = []
for i in range(quantity):
    samples = stats.norm.rvs(80, 5, (N, 10))
    Z = statistics[0](samples)
    p_z = Z[(Z > -2)&((Z < 2))].size/N
    T = statistics[1](samples)
    p_t = T[(T > -2)&((T < 2))].size/N
    result.append([p_z, p_t])

result = np.array(result)
fig, ax = plt.subplots()

line1, line2 = ax.plot(np.arange(quantity), result)
ax.legend([line1, line2],
          [r'$P(-2sigma < {} < 2sigma)$'.format(i) for i in 'ZT'])
ax.hlines(result.mean(axis=0), 0, 50, color='0.6');
В каждом из 50 экспериментов мы видим одно и тоже. Можно было бы заподозрить, что есть ошибка в коде, но его не так много, и легко убедиться в том, что вычисления выполняются верно. Так в чем же дело? А дело в том, что мы получили совершенно новый тип распределения! Снова взгляните на гифку с гистограммами распределений значений Z- и T- статистик, присмотритесь к основанию колокола каждой из них. Вам не кажется, что у распределения T-статистик основание чуть шире? Это хорошо видно по выпирающим за красные линии, так называемым — хвостам. А то, что эти хвосты несколько больше, или как еще говорят — тяжелее, чем у нормального распределения, так же будет означать, что мы будем наблюдать несколько больше сильных отклонений от вершины распределения. Проще говоря, мы теперь можем учитывать дисперсию выборки при оценке параметров генеральной совокупности. Однако, мы так и не ответили на вопрос — хорошо ли, можно ли, да и вообще зачем оценивать генеральной совокупности значением стандартного отклонения
выборки.
Задумаемся о дисперсии
Когда мы рассматривали распределение значений Z-статистик, мы обращали внимание только на распределение выборочного среднего и даже не задавались вопросом о том, что выборочное стандартное отклонение
тоже может как-то распределяться. Давайте возьмем 10000 выборок из
по 10 элементов в каждой и посмотрим, как будет выглядеть зависимость стандартного отклонения выборок от их среднего значения:
# если график строиться слишком долго,
# то смените формат svg на png:
#%config InlineBackend.figure_format = 'png'

N = 10000
samples = stats.norm.rvs(80, 5, (N, 10))

means = samples.mean(axis=1)
deviations = samples.std(ddof=1, axis=1)
T = statistics[1](samples)
P = (T > -2)&((T < 2))

fig, ax = plt.subplots()

ax.scatter(means[P], deviations[P], c='b', alpha=0.7,
           label=r'$left | T right | < 2sigma$')
ax.scatter(means[~P], deviations[~P], c='r', alpha=0.7,
           label=r'$left | T right | > 2sigma$')

mean_x = np.linspace(75, 85, 300)
s = np.abs(10**0.5*(mean_x - 80)/2)
ax.plot(mean_x, s, color='k',
        label=r'$frac{sqrt{n}(bar{x}-mu)}{2}$')
ax.legend(loc = 'upper right', fontsize = 15)
ax.set_title('Зависимость выборочного стандартного отклоненияnот выборочного среднего',
             fontsize=15)
ax.set_xlabel(r'Среднее значение выборки ($bar{x}$)',
              fontsize=15)
ax.set_ylabel(r'Стандартное отклонение выборки ($s$)',
              fontsize=15);
Данный график интересен тем, что показывает зависимость среднего выборки от ее стандартного отклонения. На нем видно, что выборки, у которых и
отклоняется очень сильно и одновременно практически не встречаются, т.е. точки стараются избегать углов графика. Это значит, что, если мы берем выборку из нормального распределения
, то мы вряд ли увидим слишком большое значение
при большом значении
. А еще из данного графика следует, что экстремальные значения (красные точки) могут быть получены, только если выполняется следующее соотношение:
Учитывая, что , т.е. то, что мы снова измеряем расстояние от вершины распределения в сигмах, и то, что для нашего конкретного примера
, а
мы можем записать это условие следующим образом:
Границы данного условия обозначены на графике черной линией, а поскольку мы раньше уже вычисляли доли значений которые попадали в интервал , то мы можем сказать, что над черной линией находится около 92,5% всех точек.
Как интерпретировать это расположение и цвет точек? Давайте вспомним пример, от которого мы отталкивались. Мы сварили пиво с новым сортом хмеля, нашли десять человек (наша выборка) и попросили их оценить качество нового пива по 100-больной шкале. На основании их оценок мы пытаемся понять, как могут оценить качество пива все, кто его купит в дальнейшем (генеральная совокупность). Допустим среднее полученных 10-и оценок равно 82-м баллам, а стандартное отклонение равно всего 2-м баллам. Могут ли такие оценки быть получены случайно, если предположить, что генеральная совокупность имеет мат.ожидание , а стандартное отклонение такое же как у выборки, т.е.
? Чтобы выяснить это нужно вычислить Z-статистику:
Чтобы оценить вероятность случайного получения такого значения из нужно вычислить p-value:
z = 10**0.5*(82-80)/2
p = 1 - (stats.norm.cdf(z) - stats.norm.cdf(-z))
print(f'p-value = {p:.2}')
p-value = 0.0016Вероятность того что 10 человек случайно дадут средню оценку равную 82-м баллам очень мала и составляет менее 2%. Но данное утверждение является верным только если мы предполагаем что эти десять человек взяты из генеральной совокупности всех потребителей в которой их оценки распределены как . И если мы действительно предполагаем, что
, то мы можем быть вполне уверены, что оценки обусловлены новым сортом хмеля в составе пива, а не случайностью.
Такой результат может наблюдаться, например, в том случае, если мы пригласили экспертов в качестве респондентов. Только эксперты могли бы отметить небольшое улучшение качества пива (малое ) и при этом быть единодушны в оценках (малое
).
С другой стороны мы могли бы пригласить крайне разношерстную публику в качестве 10 респондентов. Они могли бы оценить качество пива так же в 82 балла, но со стандартным отклонением равным, допустим, 9-и баллам. Может ли такая оценка быть получена случайно? Проверим:
z = 10**0.5*(82-80)/9
p = 1 - (stats.norm.cdf(z) - stats.norm.cdf(-z))
print(f'p-value = {p:.2}')
p-value = 0.48Значит получить случайным образом 10 оценок с результатом и
из распределения
более чем вероятно. Следовательно, мы не можем утверждать, что новый сорт хмеля в составе пива как-то повлиял на изменение мнения генеральной совокупности о его качестве.
Кстати, сейчас вполне уместно поинтересоваться тем, что произойдет если мы будем менять размер выборки. Давайте сделаем вот такую гифку:
Код для гифки
import matplotlib.animation as animation

fig, ax = plt.subplots(figsize = (15, 9))

def animate(i):
    ax.clear()
    N = 10000

    samples = stats.norm.rvs(80, 5, (N, i))

    means = samples.mean(axis=1)
    deviations = samples.std(ddof=1, axis=1)
    T = i**0.5*(np.mean(samples, axis=1) - 80)/np.std(samples, axis=1, ddof=1)
    P = (T > -2)&((T < 2))

    prob = T[P].size/N
    ax.set_title(r'зависимость $s$ от $bar{x}$ при $n = $' + r'${}$'.format(i),
                 fontsize = 20)
    ax.scatter(means[P], deviations[P], c='b', alpha=0.7,
               label=r'$left | T right | < 2sigma$')
    ax.scatter(means[~P], deviations[~P], c='r', alpha=0.7,
               label=r'$left | T right | > 2sigma$')

    mean_x = np.linspace(75, 85, 300)
    s = np.abs(i**0.5*(mean_x - 80)/2)
    ax.plot(mean_x, s, color='k',
            label=r'$frac{sqrt{n}(bar{x}-mu)}{2}$')
    ax.legend(loc = 'upper right', fontsize = 15)
    ax.set_xlim(70, 90)
    ax.set_ylim(0, 10)
    ax.set_xlabel(r'Среднее значение выборки ($bar{x}$)',
              fontsize='20')
    ax.set_ylabel(r'Стандартное отклонение выборки ($s$)',
              fontsize='20')
    return ax

dist_animation = animation.FuncAnimation(fig,
                                      animate,
                                      frames=np.arange(5, 21),
                                      interval = 200,
                                      repeat = False)

dist_animation.save('sigma_rel.gif',
                 writer='imagemagick',
                 fps=3)
С увеличением элементов в выборке мы наблюдаем, что выборочные и
стремятся к
и
распределения
,из которого эти выборки были взяты. Так что при больших значениях
мы можем спокойно пользоваться Z-статистиками, зная что при увеличении
стандартные отклонения выборки и генеральной совокупности будут все меньше отличаться друг от друга.
Но постойте! Разве мы не вернулись к тому, с чего начали? Ведь мы снова так и не ответили на вопрос — почему при малых размерах выборки мы предполагаем, что стандартное отклонение генеральной совокупности должно быть таким же, как у выборки. В нашем конкретном примере, с которого все началось, оценки 10-и респондентов выглядели так:
Среднее этой выборки , а стандартное оклонение
, причем мы приняли во внимание, что полномасштабный опрос, до введения в состав нового сорта хмеля, показал, что оценки распределены как
. Но вместо Z-статистики, мы решили использовать придуманную T-статистику, единственное отличие которой от Z-статистики состоит в том, что мы просто заменили в формуле
генеральной совокупности на
выборки. По сути мы просто решили проверить гипотезу относительно генеральной совокупности, которая теперь по каким-то причинам распределена не как
, а как
— это вообще правильно? Разве не нужно было бы проверить это предположение для самых разных значений
?: Почему мы не предполагаем, что
,
,
или любое другое значение
?
Чтобы ответить на этот вопрос, давайте снова вернемся к изначальному смыслу доказательства гипотез. Суть состоит в том, чтобы на основании выборки из генеральной совокупности сделать какие-то выводы о параметрах распределения этой генеральной совокупности. В нашем примере мы были уверены, что оценки его качества распределены как , однако, когда мы сварили пиво с новым сортом хмеля, то мы получили 10 оценок, стандартное отклонение которых составило 10 баллов. В самом начале мы видели, что получить выборку с таким отклонением из
просто невозможно. А это значит, что мы просто вынуждены как-то по новому оценить стандартное отклонение генеральной совокупности, иначе все наши выводы не будут иметь никакого отношения к реальности.
Давайте сделаем вот что: среднее нашей выборки , а стандартное оклонение
, попробуем оценить вероятность получить такую выборку из
при разных значениях
. Но поскольку вероятность получить конкретное значение из непрерывного распределения стремится к нулю, то мы оценим вероятность получения выборки, у которой
и
:
N = 10000
sigma = np.linspace(5, 20, 151)
prob = []

for i in sigma:
    p = []
    for j in range(10):
        samples = stats.norm.rvs(80, i, (N, 10))
        means = samples.mean(axis=1)
        deviations = samples.std(ddof=1, axis=1)
        p_m = means[(means >= 83) & (means <= 84)].size/N
        p_d = deviations[(deviations >= 9.5) & (deviations <= 10.5)].size/N
        p.append(p_m*p_d)
    prob.append(sum(p)/len(p))
prob = np.array(prob)

fig, ax = plt.subplots()
ax.plot(sigma, prob)
ax.set_xlabel(r'Стандартное отклонение генеральной совокупности ($sigma$)',
              fontsize=20)
ax.set_ylabel('Вероятность',
              fontsize=20);
Как видите, максимум вероятности достигается при . Именно по этой причине, когда мы имеем дело с небольшими выборками, мы проверяем гипотезу о распределении генеральной совокупности не относительно известного нам значения ее стандартного отклонения
, а относительно стандартного отклонения выборки
. Если параметры генеральной совокупности как-то изменились, то мы заранее предполагаем, что ее стандартное отклонение теперь равно стандартному отклонению выборки, просто потому, что вероятность такого изменения максимальна. Вот и все.
А это точно мы изобрели T-статистику?
Давайте представим, что некий инженер в какой-нибудь компании по производству шариков для пинг-понга решил задачу по сверхплотной упаковке шаров. После этого в один грузовой контейнер стало влезать на 1% больше шариков, что в общем-то не густо. Но тем не менее, глава компании мог посчитать этот результат очень важным и запретить инженеру распространять свое решение, так как это решение теперь является коммерческой тайной. Вот так, важный для цивилизации теоретический результат мог бы остаться в тайне ради ничтожного увеличения прибыли какой-то компании по производству шариков для пинг-понга. Абсурд?
Несомненно — абсурд! Однако, что-то подобное чуть не произошло с Уильямом Госсетом, когда он работал на пивоварне «Гиннес» и открыл t-распределение. Оценить практическую значимость некоторых статистических открытий очень сложно, но не в тех случаях, когда на кону астрономические потенциальные прибыли и стратегическое развитие компании, или даже государства. Например, последовательный критерий отношений правдоподобия Вальда, открытый в 1943 году во время войны вообще засекретили, так как этот критерий позволял на 50% уменьшить среднее число наблюдений в выборке. Короче, статистика — это крайне полезная наука.
Итак, Уильям Госсет отвечал за контроль качества в пивоварне «Гиннес» и пытался решить проблему появления ошибок при использовании выборок ограниченного размера. Госсет проделал все то же самое, что мы проделали с вами выше (только без компьютера!) и сделал вывод о том, что если выборка берется из «нормальной» генеральной совокупности и что если использовать стандартное отклонение выборки для оценки стандартного отклонение этой самой генеральной совокупности, то распрделение выборочного среднего можно описать уже знакомой нам формулой:
Данная формула и является формулой так называемого t-распределения, оно же распределение Стьюдента. Учитывая, что история о том, как Госсет использовал псевдоним «Стьюдент», для обхода наложенным Гиннесом запрета на публикации работ, довольно широко известна, то, наверное, было бы правильнее называть это распределение — распределением Госсета. Но названия «распределение Стьюдента», или используемое немного реже «t-распределение» так сильно устоялись, что мы не будем нарушать эту общепринятую договоренность.
Еще один способ получить распределение Стьюдента заключается в использовании вот этой формулы:
которая позволяет прояснить понятие «степени свободы» выборки. Пусть случайные переменные берутся из стандартного нормального распределения, т.е.
, тогда значение
, т.е. объем выборки, как раз и определяет степень свободы распределения Стьюдента. А принадлежность какой-нибудь случайной величины к распределению Стьюдента с определенным числом степеней свободы обозначается, как:
Давайте попробуем взглянуть на то, как будет меняться распределение Стьюдента при увеличении числа степеней свободы:
Код для гифки
import matplotlib.animation as animation

fig, ax = plt.subplots(figsize = (15, 9))

def animate(i):
    ax.clear()
    N = 15000

    x = np.linspace(-5, 5, 100)
    ax.plot(x, stats.norm.pdf(x, 0, 1), color='r')

    samples = stats.norm.rvs(0, 1, (N, i))

    t = samples[:, 0]/np.sqrt(np.mean(samples[:, 1:]**2, axis=1))
    t = t[(t>-5)&(t<5)]
    sns.histplot(x=t, bins=np.linspace(-5, 5, 100), stat='density', ax=ax)

    ax.set_title(r'Форма распределения $t(n)$ при n = ' + str(i), fontsize = 20)
    ax.set_xlim(-5, 5)
    ax.set_ylim(0, 0.5)
    return ax

dist_animation = animation.FuncAnimation(fig,
                                      animate,
                                      frames=np.arange(2, 21),
                                      interval = 200,
                                      repeat = False)

dist_animation.save('t_rel_of_df.gif',
                 writer='imagemagick',
                 fps=3)
На этой гифке видно, как по мере увеличения , гистограмма распределения Стьюдента подбирает свои хвосты, стараясь занять всю площадь под красной линией, которая соответствует функции распределения плотности вероятности
. Чтобы увидеть это более наглядно, распределение Стьюдента лучше так же изображать в виде линий функций плотности вероятности, которые можно вычислить по следующей формуле:
Но лучше воспользуемся готовой реализацией в SciPy:
Код для гифки
import matplotlib.animation as animation

fig, ax = plt.subplots(figsize = (15, 9))

def animate(i):
    ax.clear()
    N = 15000

    x = np.linspace(-5, 5, 100)
    ax.plot(x, stats.norm.pdf(x, 0, 1), color='r')
    ax.plot(x, stats.t.pdf(x, df=i))

    ax.set_title(r'Форма распределения $t(n)$ при n = ' + str(i), fontsize = 20)
    ax.set_xlim(-5, 5)
    ax.set_ylim(0, 0.45)
    return ax

dist_animation = animation.FuncAnimation(fig,
                                      animate,
                                      frames=np.arange(2, 21),
                                      interval = 200,
                                      repeat = False)

dist_animation.save('t_pdf_rel_of_df.gif',
                 writer='imagemagick',
                 fps=3)
Здесь гораздо лучше видно, что при увеличении (параметр df в коде) распределение Стьюдента стремится к нормальному распределению. Что в общем-то и неудивительно, так как ранее мы уже видели, что при увеличении
выборки, ее стандартное отклонение все меньше колеблется вокруг стандартного отклонения генеральной совокупности.
t-распределение на практике
Давайте сразу выполним t-тест из модуля SciPy для выборки из нашего примера с пивом:
sample = np.array([89,99,93,84,79,61,82,81,87,82])

stats.ttest_1samp(sample, 80)
Ttest_1sampResult(statistic=1.163532240174695, pvalue=0.2745321678073461)А теперь попробуем получить тот же самый результат самостоятельно:
T = 9**0.5*(sample.mean() -80)/sample.std()
T1.163532240174695Обратите внимание, что при вычислении мы использовали не размер выборки , а количество степеней свободы
, которое вычисляется как
. Да, количество степеней свободы распределения Стьюдента на 1 меньше объема выборки, а связано это, как вы уже догадались, с разницей в вычислениях стандартного отклонения для выборки и генеральной совокупности. Добиться такого же результата мы можем и так:
T = 10**0.5*(sample.mean() -80)/sample.std(ddof=1)
T1.1635322401746953Хорошо, значение t-статистики мы вычислили, как вычислить значение p-value? Думаю, вы и до этого уже догадались — нужно проделать все то же самое, что мы делали при вычислении p-value для Z-статистики, но только с использованием t-распределения:
t = stats.t(df=9)
fig, ax = plt.subplots()
x = np.linspace(t.ppf(0.001), t.ppf(0.999), 300)
ax.plot(x, t.pdf(x))
ax.hlines(0, x.min(), x.max(), lw=1, color='k')
ax.vlines([-T, T], 0, 0.4, color='g', lw=2)
x_le_T, x_ge_T = x[x<-T], x[x>T]
ax.fill_between(x_le_T, t.pdf(x_le_T), np.zeros(len(x_le_T)), alpha=0.3, color='b')
ax.fill_between(x_ge_T, t.pdf(x_ge_T), np.zeros(len(x_ge_T)), alpha=0.3, color='b')

p = 1 - (t.cdf(T) - t.cdf(-T))
ax.set_title(r'$P(left | T right | geqslant {:.3}) = {:.3}$'.format(T, p));
Мы видим, что p-value чуть больше 27%, т.е. вероятность того, что результат получен случайно — довольно велика, особенно в соответствии с самым распространенным уровнем значимости , который меньше p-value более, чем в 5 раз. Что ж, наши результаты не являются значимыми, но они пригодны для демонстрации вычисления доверительного интервала — границы значений математического ожидания генеральной совокупности, в пределах которых оно находится с заданной вероятностью
, обычно равной 0.95:
Чтобы вычислить данный интервал в SciPy, достаточно воспользоваться методом interval с заданными параметрами loc (смещение) и scale (масштаб) для нашей выборки:
sample_loc = sample.mean()
sample_scale = sample.std(ddof=1)/10**0.5
ci = stats.t.interval(0.95, df=9, loc=sample_loc, scale=sample_scale)
ci
(76.50640345566619, 90.89359654433382)Учитывая, что , то мы можем утверждать, что с вероятностью
математическое ожидание генеральной совокупности находится в пределах интервала
. Чем шире доверительный интервал, тем больше вероятность того, что мы получим совсем другое выборочное среднее
, если возьмем другую выборку такого же объема из генеральной совокупности.
Напоследок
Что ж, прошу прощения, друзья, но продолжать и улучшать статью больше нет никаких сил (аврал выбил из колеи). Надеюсь, этого материала будет достаточно, чтобы вы самостоятельно смогли заглянуть под капот t-критерия для независимых выборок, t-критерия для парных измерений, а так же t-критерия для выборок с неравной дисперсией.
Конечно, хотелось бы в конце вставить какую-нибудь гифку, но хочу закончить фразой Герберта Спенсера: «Величайшая цель образования — не знание, а действие«, так что запускайте свои анаконды и действуйте! Особенно это касается самоучек, вроде меня.
Жму F5 и жду ваших комментариев!

![alpha in [0,1]](https://dic.academic.ru/pictures/wiki/files/55/74f725ac10fd07911d173c277b58814f.png) . Тогда
. Тогда  .
. .
. не имеет простого представления. Однако, возможно вычислить её значения численно.
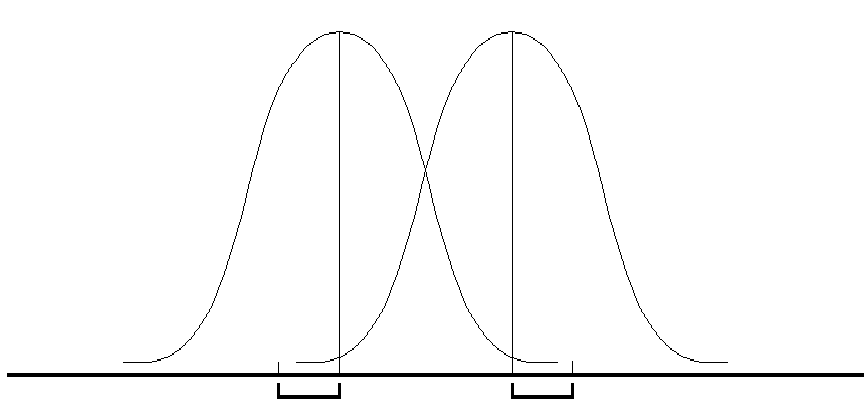

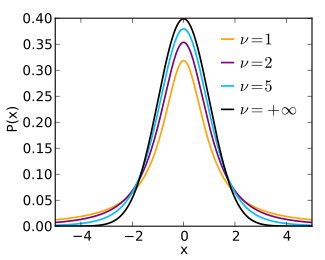
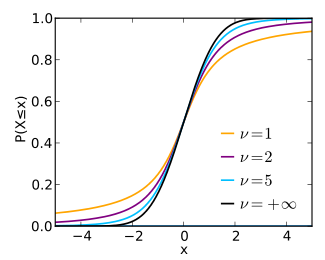
![begin{matrix}
frac{1}{2} + x Gamma left( frac{nu+1}{2} right) times\[0.5em]
frac{,_2F_1 left ( frac{1}{2},frac{nu+1}{2};frac{3}{2};
-frac{x^2}{nu} right)}
{sqrt{pinu},Gamma left(frac{nu}{2}right)}
end{matrix}](https://wikimedia.org/api/rest_v1/media/math/render/svg/7c3c84e8f1257dce799724d08e3b08389944045d)
![{displaystyle {begin{matrix}{frac {nu +1}{2}}left[psi left({frac {1+nu }{2}}right)-psi left({frac {nu }{2}}right)right]\[0.5em]+ln {left[{sqrt {nu }}Bleft({frac {nu }{2}},{frac {1}{2}}right)right]},{scriptstyle {text{(nats)}}}end{matrix}}}](https://wikimedia.org/api/rest_v1/media/math/render/svg/8e64e6a7fd1bb08a7129701a00f10b4dc673c589)


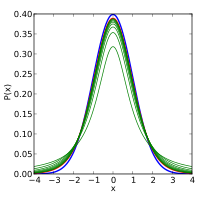


![{displaystyle {begin{aligned}{bar {x}}&={frac {x_{1}+cdots +x_{n}}{n}},\[5pt]s^{2}&={frac {1}{n-1}}sum _{i=1}^{n}(x_{i}-{bar {x}})^{2}.end{aligned}}}](https://wikimedia.org/api/rest_v1/media/math/render/svg/3b254594b738c8226106dced8dcc81c7f7c4d2ae)


![{displaystyle operatorname {E} (T^{k})={begin{cases}0&k{text{ odd}},quad 0<k<nu \{frac {1}{{sqrt {pi }}Gamma left({frac {nu }{2}}right)}}left[Gamma left({frac {k+1}{2}}right)Gamma left({frac {nu -k}{2}}right)nu ^{frac {k}{2}}right]&k{text{ even}},quad 0<k<nu .\end{cases}}}](https://wikimedia.org/api/rest_v1/media/math/render/svg/876ddf907881d570498829eb97d785812295cf58)


![{displaystyle {begin{aligned}operatorname {E} (X)&={hat {mu }}&&{text{ for }}nu >1\[5pt]operatorname {var} (X)&={frac {1}{lambda }}{frac {nu }{nu -2}}&&{text{ for }}nu >2\[5pt]operatorname {mode} (X)&={hat {mu }}end{aligned}}}](https://wikimedia.org/api/rest_v1/media/math/render/svg/5d718430b8350f0ada28d216c96d8944e72d7e2a)


