-
#1
Hi everyone,
some days ago it started that some of my VMs are getting a yellow triangle and when hovering it says «status: io-error». I have learnt that this could mean I run out of space, but haven’t found any culprit. I am using a NFS connection to a synology, where all VM reside.
At the moment all is green. But if I want to create a new VM, the new one gets a io-error soon, so some other VMs and stop responsing. All other VMs seem to run fine.
I am running 7.1.8.
lvs:
Code:
  LV   VG  Attr       LSize    Pool Origin Data%  Meta%  Move Log Cpy%Sync Convert
  data pve twi-a-tz-- <338.60g             0.00   0.50
  root pve -wi-ao----   96.00g
  swap pve -wi-ao----    8.00g
pvesm status:
Code:
Name             Type     Status           Total            Used       Available        %
Moria             pbs     active      3777797632       700177920      3077619712   18.53%
VMlinux           nfs     active     11238298112      2017643392      9220654720   17.95%
VMwin             nfs     active     11238298112      2017643392      9220654720   17.95%
local             dir     active        98559220        11831228        81678444   12.00%
local-lvm     lvmthin     active       355045376               0       355045376    0.00%
Regards,
Stefan
![]()
mira
Proxmox Staff Member
-
#2
Have you checked the journal (journalctl) for any disk or I/O errors?
-
#3
Thanks for your reply. I don’t see any I/O errors with journalctl, this is what I get when the errors occur:
Code:
Dec 09 12:09:43 argo pvedaemon[1135]: VM 128 qmp command failed - VM 128 qmp command 'guest-ping' failed - got timeout
Dec 09 12:09:29 argo pvedaemon[2395699]: <root@pam> successful auth for user 'root@pam'
Dec 09 12:09:20 argo pvedaemon[2395699]: <root@pam> end task UPID:argo:002493AE:030CD61E:61B1E3DD:aptupdate::root@pam: OK
Dec 09 12:09:18 argo pvedaemon[2397102]: update new package list: /var/lib/pve-manager/pkgupdates
Dec 09 12:09:17 argo pvedaemon[2395699]: <root@pam> starting task UPID:argo:002493AE:030CD61E:61B1E3DD:aptupdate::root@pam:
Dec 09 12:08:59 argo pvedaemon[1135]: VM 128 qmp command failed - VM 128 qmp command 'guest-ping' failed - got timeout
Dec 09 12:08:53 argo pvedaemon[2395699]: VM 130 qmp command failed - VM 130 qmp command 'guest-ping' failed - got timeout
Dec 09 12:08:51 argo pvedaemon[1133]: <root@pam> end task UPID:argo:0024928C:030CC85F:61B1E3BA:vncproxy:130:root@pam: OK
Dec 09 12:08:42 argo pvedaemon[1133]: <root@pam> starting task UPID:argo:0024928C:030CC85F:61B1E3BA:vncproxy:130:root@pam:
Dec 09 12:08:42 argo pvedaemon[2396812]: starting vnc proxy UPID:argo:0024928C:030CC85F:61B1E3BA:vncproxy:130:root@pam:
Dec 09 12:08:34 argo pvedaemon[1135]: VM 130 qmp command failed - VM 130 qmp command 'guest-ping' failed - got timeout
Dec 09 12:08:28 argo pvedaemon[1133]: <root@pam> end task UPID:argo:00249233:030CC131:61B1E3A8:vncproxy:128:root@pam: OK
Dec 09 12:08:26 argo pveproxy[1142]: worker 2396726 started
Dec 09 12:08:26 argo pveproxy[1142]: starting 1 worker(s)
Dec 09 12:08:26 argo pveproxy[1142]: worker 2380211 finished
Dec 09 12:08:26 argo pveproxy[2380211]: worker exit
Dec 09 12:08:24 argo pvedaemon[2396723]: starting vnc proxy UPID:argo:00249233:030CC131:61B1E3A8:vncproxy:128:root@pam:
Dec 09 12:08:24 argo pvedaemon[1133]: <root@pam> starting task UPID:argo:00249233:030CC131:61B1E3A8:vncproxy:128:root@pam:
Dec 09 12:08:18 argo pvedaemon[1133]: VM 128 qmp command failed - VM 128 qmp command 'guest-ping' failed - got timeout
Dec 09 12:08:13 argo pveproxy[1142]: worker 2396678 started
Dec 09 12:08:13 argo pveproxy[1142]: starting 1 worker(s)
Dec 09 12:08:13 argo pveproxy[1142]: worker 2379903 finished
Dec 09 12:08:13 argo pveproxy[2379903]: worker exit
Dec 09 12:07:59 argo pvedaemon[1135]: VM 128 qmp command failed - VM 128 qmp command 'guest-ping' failed - got timeout
Dec 09 12:07:53 argo pvedaemon[1133]: VM 130 qmp command failed - VM 130 qmp command 'guest-ping' failed - got timeout
Dec 09 12:07:50 argo pvedaemon[2395699]: VM 128 qmp command failed - VM 128 qmp command 'guest-ping' failed - got timeout
Dec 09 12:07:44 argo pvedaemon[1135]: <root@pam> end task UPID:argo:00249172:030CB1DE:61B1E380:qmreset:128:root@pam: OK
Dec 09 12:07:44 argo pvedaemon[1135]: <root@pam> starting task UPID:argo:00249172:030CB1DE:61B1E380:qmreset:128:root@pam:
Dec 09 12:07:33 argo pvedaemon[1135]: <root@pam> end task UPID:argo:0024900E:030C957F:61B1E338:qmreboot:128:root@pam: VM quit/powerdown failed
Dec 09 12:07:33 argo pvedaemon[2396174]: VM quit/powerdown failed
Dec 09 12:07:33 argo pvedaemon[2396174]: VM 128 qmp command failed - received interrupt
Dec 09 12:07:31 argo pvedaemon[1135]: VM 128 qmp command failed - VM 128 qmp command 'guest-ping' failed - got timeout
Dec 09 12:07:25 argo pvedaemon[1133]: <root@pam> end task UPID:argo:00249119:030CAA63:61B1E36D:qmreset:130:root@pam: OK
Dec 09 12:07:25 argo pvedaemon[1133]: <root@pam> starting task UPID:argo:00249119:030CAA63:61B1E36D:qmreset:130:root@pam:
Dec 09 12:07:17 argo pvedaemon[2395699]: VM 130 qmp command failed - VM 130 qmp command 'guest-ping' failed - got timeout
Dec 09 12:07:10 argo pvedaemon[1135]: <root@pam> end task UPID:argo:0024909A:030C9FC7:61B1E352:vncproxy:130:root@pam: OK
Dec 09 12:06:58 argo pvedaemon[2396314]: starting vnc proxy UPID:argo:0024909A:030C9FC7:61B1E352:vncproxy:130:root@pam:
Dec 09 12:06:58 argo pvedaemon[1135]: <root@pam> starting task UPID:argo:0024909A:030C9FC7:61B1E352:vncproxy:130:root@pam:
Dec 09 12:06:58 argo pvedaemon[1133]: VM 130 qmp command failed - VM 130 qmp command 'guest-ping' failed - got timeout
Dec 09 12:06:43 argo pvedaemon[2395699]: VM 128 qmp command failed - VM 128 qmp command 'guest-ping' failed - got timeout
Dec 09 12:06:32 argo pvedaemon[1135]: <root@pam> starting task UPID:argo:0024900E:030C957F:61B1E338:qmreboot:128:root@pam:
Dec 09 12:06:32 argo pvedaemon[2396174]: requesting reboot of VM 128: UPID:argo:0024900E:030C957F:61B1E338:qmreboot:128:root@pam:
Dec 09 12:06:24 argo pvedaemon[1133]: VM 128 qmp command failed - VM 128 qmp command 'guest-ping' failed - got timeout
Dec 09 12:06:05 argo pvedaemon[2395699]: VM 128 qmp command failed - VM 128 qmp command 'guest-ping' failed - got timeout
Dec 09 12:06:01 argo pvedaemon[1135]: <root@pam> end task UPID:argo:00248F70:030C87C1:61B1E315:vncproxy:128:root@pam: OK
Dec 09 12:05:57 argo pvedaemon[1135]: <root@pam> starting task UPID:argo:00248F70:030C87C1:61B1E315:vncproxy:128:root@pam:
Dec 09 12:05:57 argo pvedaemon[2396016]: starting vnc proxy UPID:argo:00248F70:030C87C1:61B1E315:vncproxy:128:root@pam:
Dec 09 12:05:55 argo pvedaemon[2395699]: <root@pam> successful auth for user 'root@pam'
Dec 09 12:04:48 argo pvedaemon[1132]: worker 2395699 started
Dec 09 12:04:48 argo pvedaemon[1132]: starting 1 worker(s)
Dec 09 12:04:48 argo pvedaemon[1132]: worker 1134 finished
Dec 09 12:04:48 argo pvedaemon[1134]: worker exit
Dec 09 12:00:35 argo pmxcfs[999]: [dcdb] notice: data verification successful
Dec 09 12:00:33 argo smartd[670]: Device: /dev/sda [SAT], SMART Usage Attribute: 194 Temperature_Celsius changed from 62 to 69
Dec 09 11:50:54 argo pvedaemon[1135]: <root@pam> successful auth for user 'root@pam'
Dec 09 11:50:32 argo pveproxy[1142]: worker 2391725 started
Dec 09 11:50:32 argo pveproxy[1142]: starting 1 worker(s)
Dec 09 11:50:32 argo pveproxy[1142]: worker 2374478 finished
Dec 09 11:50:32 argo pveproxy[2374478]: worker exit
Dec 09 11:38:50 argo pveproxy[2379903]: Clearing outdated entries from certificate cache
Dec 09 11:35:55 argo pvedaemon[1134]: <root@pam> successful auth for user 'root@pam'
Dec 09 11:30:33 argo smartd[670]: Device: /dev/sda [SAT], SMART Usage Attribute: 194 Temperature_Celsius changed from 72 to 62
Dec 09 11:21:29 argo pveproxy[2374478]: Clearing outdated entries from certificate cache
Dec 09 11:20:53 argo pvedaemon[1133]: <root@pam> successful auth for user 'root@pam'
Dec 09 11:17:02 argo CRON[2382327]: pam_unix(cron:session): session closed for user root
Dec 09 11:17:02 argo CRON[2382328]: (root) CMD (   cd / && run-parts --report /etc/cron.hourly)
Dec 09 11:17:02 argo CRON[2382327]: pam_unix(cron:session): session opened for user root(uid=0) by (uid=0)
Dec 09 11:09:59 argo pveproxy[2380211]: Clearing outdated entries from certificate cache
Dec 09 11:09:25 argo pveproxy[1142]: worker 2380211 started
Dec 09 11:09:25 argo pveproxy[1142]: starting 1 worker(s)
Dec 09 11:09:25 argo pveproxy[1142]: worker 2192325 finished
Dec 09 11:09:25 argo pveproxy[2192325]: worker exit
Dec 09 11:09:02 argo pveproxy[2192325]: Clearing outdated entries from certificate cache
Dec 09 11:08:42 argo pveproxy[2379903]: Clearing outdated entries from certificate cache
-
#4
And this is journactl around the new VM create (115), I guess:
Code:
Dec 10 11:10:45 argo pvedaemon[1139]: VM 106 qmp command failed - VM 106 qmp command 'guest-ping' failed - got timeout
Dec 10 11:10:42 argo pvedaemon[1139]: <root@pam> end task UPID:argo:000520F5:006CAFE3:61B327A1:qmstart:106:root@pam: OK
Dec 10 11:10:42 argo kernel: fwbr106i0: port 2(tap106i0) entered forwarding state
Dec 10 11:10:42 argo kernel: fwbr106i0: port 2(tap106i0) entered blocking state
Dec 10 11:10:42 argo kernel: fwbr106i0: port 2(tap106i0) entered disabled state
Dec 10 11:10:42 argo kernel: fwbr106i0: port 2(tap106i0) entered blocking state
Dec 10 11:10:42 argo kernel: vmbr0: port 3(fwpr106p0) entered forwarding state
Dec 10 11:10:42 argo kernel: vmbr0: port 3(fwpr106p0) entered blocking state
Dec 10 11:10:42 argo kernel: device fwpr106p0 entered promiscuous mode
Dec 10 11:10:42 argo kernel: vmbr0: port 3(fwpr106p0) entered disabled state
Dec 10 11:10:42 argo kernel: vmbr0: port 3(fwpr106p0) entered blocking state
Dec 10 11:10:42 argo kernel: fwbr106i0: port 1(fwln106i0) entered forwarding state
Dec 10 11:10:42 argo kernel: fwbr106i0: port 1(fwln106i0) entered blocking state
Dec 10 11:10:42 argo kernel: device fwln106i0 entered promiscuous mode
Dec 10 11:10:42 argo kernel: fwbr106i0: port 1(fwln106i0) entered disabled state
Dec 10 11:10:42 argo kernel: fwbr106i0: port 1(fwln106i0) entered blocking state
Dec 10 11:10:42 argo systemd-udevd[336139]: Using default interface naming scheme 'v247'.
Dec 10 11:10:42 argo systemd-udevd[336139]: ethtool: autonegotiation is unset or enabled, the speed and duplex are not writable.
Dec 10 11:10:42 argo systemd-udevd[336132]: ethtool: autonegotiation is unset or enabled, the speed and duplex are not writable.
Dec 10 11:10:42 argo systemd-udevd[336132]: ethtool: autonegotiation is unset or enabled, the speed and duplex are not writable.
Dec 10 11:10:42 argo kernel: device tap106i0 entered promiscuous mode
Dec 10 11:10:42 argo systemd-udevd[336132]: ethtool: autonegotiation is unset or enabled, the speed and duplex are not writable.
Dec 10 11:10:42 argo systemd-udevd[336132]: Using default interface naming scheme 'v247'.
Dec 10 11:10:42 argo systemd[1]: Started 106.scope.
Dec 10 11:10:41 argo pvedaemon[1139]: <root@pam> starting task UPID:argo:000520F5:006CAFE3:61B327A1:qmstart:106:root@pam:
Dec 10 11:10:41 argo pvedaemon[336117]: start VM 106: UPID:argo:000520F5:006CAFE3:61B327A1:qmstart:106:root@pam:
Dec 10 11:09:29 argo pvedaemon[313009]: <root@pam> successful auth for user 'root@pam'
Dec 10 11:09:21 argo pmxcfs[996]: [status] notice: received log
Dec 10 11:09:20 argo pmxcfs[996]: [status] notice: received log
Dec 10 10:58:08 argo pveproxy[323843]: Clearing outdated entries from certificate cache
Dec 10 10:56:56 argo pveproxy[323290]: Clearing outdated entries from certificate cache
Dec 10 10:54:29 argo pvedaemon[313377]: <root@pam> successful auth for user 'root@pam'
Dec 10 10:46:33 argo pveproxy[328843]: Clearing outdated entries from certificate cache
Dec 10 10:44:38 argo pveproxy[1146]: worker 328843 started
Dec 10 10:44:38 argo pveproxy[1146]: starting 1 worker(s)
Dec 10 10:44:38 argo pveproxy[1146]: worker 315744 finished
Dec 10 10:44:38 argo pveproxy[315744]: worker exit
Dec 10 10:39:28 argo pvedaemon[1139]: <root@pam> successful auth for user 'root@pam'
Dec 10 10:29:56 argo pveproxy[315744]: Clearing outdated entries from certificate cache
Dec 10 10:28:03 argo pveproxy[323843]: Clearing outdated entries from certificate cache
Dec 10 10:26:52 argo pveproxy[323290]: Clearing outdated entries from certificate cache
Dec 10 10:26:47 argo pveproxy[1146]: worker 323843 started
Dec 10 10:26:47 argo pveproxy[1146]: starting 1 worker(s)
Dec 10 10:26:47 argo pveproxy[1146]: worker 309756 finished
Dec 10 10:26:47 argo pveproxy[309756]: worker exit
Dec 10 10:26:21 argo pveproxy[309756]: Clearing outdated entries from certificate cache
Dec 10 10:24:53 argo pveproxy[1146]: worker 323290 started
Dec 10 10:24:53 argo pveproxy[1146]: starting 1 worker(s)
Dec 10 10:24:53 argo pveproxy[1146]: worker 310545 finished
Dec 10 10:24:53 argo pveproxy[310545]: worker exit
Dec 10 10:24:27 argo pvedaemon[313377]: <root@pam> successful auth for user 'root@pam'
Dec 10 10:23:40 argo pmxcfs[996]: [dcdb] notice: data verification successful
Dec 10 10:17:01 argo CRON[321096]: pam_unix(cron:session): session closed for user root
Dec 10 10:17:01 argo CRON[321097]: (root) CMD (   cd / && run-parts --report /etc/cron.hourly)
Dec 10 10:17:01 argo CRON[321096]: pam_unix(cron:session): session opened for user root(uid=0) by (uid=0)
Dec 10 10:09:27 argo pvedaemon[313009]: <root@pam> successful auth for user 'root@pam'
Dec 10 10:08:30 argo pvedaemon[1139]: <root@pam> successful auth for user 'root@pam'
Dec 10 10:08:01 argo cron[1086]: (*system*vzdump) RELOAD (/etc/cron.d/vzdump)
Dec 10 10:07:41 argo pvedaemon[313377]: <root@pam> successful auth for user 'root@pam'
Dec 10 10:07:32 argo pmxcfs[996]: [status] notice: received log
Dec 10 10:07:31 argo pmxcfs[996]: [status] notice: received log
Dec 10 10:07:24 argo qmeventd[318406]: Finished cleanup for 106
Dec 10 10:07:24 argo qmeventd[318406]: Starting cleanup for 106
Dec 10 10:07:24 argo pvedaemon[1139]: <root@pam> end task UPID:argo:0004DBA5:0066E3FC:61B318CB:qmstop:106:root@pam: OK
Dec 10 10:07:23 argo systemd[1]: 106.scope: Consumed 10min 22.730s CPU time.
Dec 10 10:07:23 argo systemd[1]: 106.scope: Succeeded.
Dec 10 10:07:23 argo qmeventd[673]: read: Connection reset by peer
Dec 10 10:07:23 argo kernel: vmbr0: port 3(fwpr106p0) entered disabled state
Dec 10 10:07:23 argo kernel: device fwpr106p0 left promiscuous mode
Dec 10 10:07:23 argo kernel: fwbr106i0: port 1(fwln106i0) entered disabled state
Dec 10 10:07:23 argo kernel: device fwln106i0 left promiscuous mode
Dec 10 10:07:23 argo kernel: vmbr0: port 3(fwpr106p0) entered disabled state
Dec 10 10:07:23 argo kernel: fwbr106i0: port 1(fwln106i0) entered disabled state
Dec 10 10:07:23 argo kernel: fwbr106i0: port 2(tap106i0) entered disabled state
Dec 10 10:07:23 argo pvedaemon[1139]: <root@pam> starting task UPID:argo:0004DBA5:0066E3FC:61B318CB:qmstop:106:root@pam:
Dec 10 10:07:23 argo pvedaemon[318373]: stop VM 106: UPID:argo:0004DBA5:0066E3FC:61B318CB:qmstop:106:root@pam:
Dec 10 10:07:07 argo pmxcfs[996]: [status] notice: received log
Dec 10 10:07:07 argo pmxcfs[996]: [status] notice: received log
Dec 10 10:06:49 argo pvedaemon[313009]: <root@pam> end task UPID:argo:0004DB15:0066D672:61B318A8:vncproxy:115:root@pam: Failed to run vncproxy.
Dec 10 10:06:49 argo pvedaemon[318229]: Failed to run vncproxy.
Dec 10 10:06:48 argo pmxcfs[996]: [status] notice: received log
Dec 10 10:06:48 argo pvedaemon[313009]: <root@pam> starting task UPID:argo:0004DB15:0066D672:61B318A8:vncproxy:115:root@pam:
Dec 10 10:06:48 argo pvedaemon[318229]: starting vnc proxy UPID:argo:0004DB15:0066D672:61B318A8:vncproxy:115:root@pam:
Dec 10 10:06:48 argo pvedaemon[1139]: <root@pam> end task UPID:argo:0004D944:0066AF97:61B31844:vncproxy:115:root@pam: OK
Dec 10 10:06:47 argo pmxcfs[996]: [status] notice: received log
Dec 10 10:06:33 argo pvedaemon[1139]: <root@pam> end task UPID:argo:0004D7C5:00669201:61B317F9:vncshell::root@pam: OK
Dec 10 10:05:56 argo pmxcfs[996]: [status] notice: received log
Dec 10 10:05:56 argo pmxcfs[996]: [status] notice: received log
Dec 10 10:05:30 argo pmxcfs[996]: [status] notice: received log
Dec 10 10:05:30 argo pmxcfs[996]: [status] notice: received log
Dec 10 10:05:09 argo pvedaemon[317764]: starting vnc proxy UPID:argo:0004D944:0066AF97:61B31844:vncproxy:115:root@pam:
Dec 10 10:05:09 argo pvedaemon[1139]: <root@pam> starting task UPID:argo:0004D944:0066AF97:61B31844:vncproxy:115:root@pam:
Dec 10 10:04:37 argo pmxcfs[996]: [status] notice: received log
Dec 10 10:04:37 argo pmxcfs[996]: [status] notice: received log
Dec 10 10:03:53 argo pvedaemon[313377]: <root@pam> successful auth for user 'root@pam'
Dec 10 10:03:53 argo pvedaemon[1139]: <root@pam> starting task UPID:argo:0004D7C5:00669201:61B317F9:vncshell::root@pam:
Dec 10 10:03:53 argo pvedaemon[317381]: starting termproxy UPID:argo:0004D7C5:00669201:61B317F9:vncshell::root@pam:
Dec 10 10:03:28 argo pvedaemon[313009]: <root@pam> end task UPID:argo:0004D2A9:00662438:61B316E0:vncproxy:115:root@pam: OK
Dec 10 09:59:12 argo pvedaemon[313009]: <root@pam> starting task UPID:argo:0004D2A9:00662438:61B316E0:vncproxy:115:root@pam:
Dec 10 09:59:12 argo pvedaemon[316073]: starting vnc proxy UPID:argo:0004D2A9:00662438:61B316E0:vncproxy:115:root@pam:
Dec 10 09:59:09 argo pmxcfs[996]: [status] notice: received log
Dec 10 09:59:08 argo pmxcfs[996]: [status] notice: received log
Dec 10 09:58:59 argo pmxcfs[996]: [status] notice: received log
Dec 10 09:58:50 argo pveproxy[315744]: Clearing outdated entries from certificate cache
Dec 10 09:58:46 argo pmxcfs[996]: [status] notice: received log
Dec 10 09:58:23 argo pmxcfs[996]: [status] notice: received log
Dec 10 09:58:22 argo pmxcfs[996]: [status] notice: received log
Dec 10 09:58:15 argo pmxcfs[996]: [status] notice: received log
Dec 10 09:58:06 argo pmxcfs[996]: [status] notice: received log
Dec 10 09:58:02 argo pveproxy[315743]: worker exit
Dec 10 09:58:01 argo pveproxy[1146]: worker 315744 started
Dec 10 09:58:01 argo pveproxy[1146]: starting 1 worker(s)
Dec 10 09:58:01 argo pveproxy[1146]: worker 147470 finished
Dec 10 09:57:54 argo pvedaemon[313377]: <root@pam> end task UPID:argo:0004D0CD:0065FBB9:61B31678:vncproxy:115:root@pam: OK
Dec 10 09:57:48 argo pvedaemon[1139]: <root@pam> successful auth for user 'root@pam'
Dec 10 09:57:28 argo pvedaemon[313377]: <root@pam> starting task UPID:argo:0004D0CD:0065FBB9:61B31678:vncproxy:115:root@pam:
Dec 10 09:57:28 argo pvedaemon[315597]: starting vnc proxy UPID:argo:0004D0CD:0065FBB9:61B31678:vncproxy:115:root@pam:
Dec 10 09:57:16 argo pmxcfs[996]: [status] notice: received log
Dec 10 09:57:16 argo pmxcfs[996]: [status] notice: received log
Dec 10 09:57:16 argo pmxcfs[996]: [status] notice: received log
Dec 10 09:56:31 argo pveproxy[310545]: Clearing outdated entries from certificate cache
Dec 10 09:56:21 argo pveproxy[147470]: Clearing outdated entries from certificate cache
Dec 10 09:56:21 argo pveproxy[309756]: Clearing outdated entries from certificate cache
Dec 10 09:54:22 argo kernel: fwbr130i0: port 2(tap130i0) entered forwarding state
Dec 10 09:54:22 argo kernel: fwbr130i0: port 2(tap130i0) entered blocking state
Dec 10 09:54:22 argo kernel: fwbr130i0: port 2(tap130i0) entered disabled state
Dec 10 09:54:22 argo kernel: fwbr130i0: port 2(tap130i0) entered blocking state
Dec 10 09:54:22 argo kernel: vmbr0: port 10(fwpr130p0) entered forwarding state
Dec 10 09:54:22 argo kernel: vmbr0: port 10(fwpr130p0) entered blocking state
Dec 10 09:54:22 argo kernel: device fwpr130p0 entered promiscuous mode
Dec 10 09:54:22 argo kernel: vmbr0: port 10(fwpr130p0) entered disabled state
Dec 10 09:54:22 argo kernel: vmbr0: port 10(fwpr130p0) entered blocking state
Dec 10 09:54:22 argo kernel: fwbr130i0: port 1(fwln130i0) entered forwarding state
Dec 10 09:54:22 argo kernel: fwbr130i0: port 1(fwln130i0) entered blocking state
Dec 10 09:54:22 argo kernel: device fwln130i0 entered promiscuous mode
Dec 10 09:54:22 argo kernel: fwbr130i0: port 1(fwln130i0) entered disabled state
Dec 10 09:54:22 argo kernel: fwbr130i0: port 1(fwln130i0) entered blocking state
Dec 10 09:54:22 argo systemd-udevd[314662]: ethtool: autonegotiation is unset or enabled, the speed and duplex are not writable.
Dec 10 09:54:22 argo systemd-udevd[314661]: ethtool: autonegotiation is unset or enabled, the speed and duplex are not writable.
Dec 10 09:54:22 argo systemd-udevd[314661]: ethtool: autonegotiation is unset or enabled, the speed and duplex are not writable.
Dec 10 09:54:22 argo systemd-udevd[314661]: Using default interface naming scheme 'v247'.
Dec 10 09:54:22 argo kernel: device tap130i0 entered promiscuous mode
Dec 10 09:54:21 argo systemd-udevd[314662]: ethtool: autonegotiation is unset or enabled, the speed and duplex are not writable.
Dec 10 09:54:21 argo systemd-udevd[314662]: Using default interface naming scheme 'v247'.
Dec 10 09:54:21 argo systemd[1]: Started 130.scope.
-
#5
Oh, sorry, the two above are on another host. I do have a cluster with three nodes, that’s the one where I wanted to create a new VM:
Code:
ec 10 08:58:55 fro pvestatd[1104]: status update time (5.240 seconds)
Dec 10 08:57:46 fro pmxcfs[991]: [status] notice: received log
Dec 10 08:56:33 fro pvestatd[1104]: closing with write buffer at /usr/share/perl5/IO/Multiplex.pm line 928.
Dec 10 08:54:15 fro pvestatd[1104]: status update time (5.202 seconds)
Dec 10 08:52:43 fro pvescheduler[257622]: INFO: Starting Backup of VM 122 (qemu)
Dec 10 08:52:43 fro pvescheduler[257622]: INFO: Finished Backup of VM 118 (00:02:32)
Dec 10 08:52:36 fro pvestatd[1104]: status update time (6.230 seconds)
Dec 10 08:52:36 fro pvestatd[1104]: VM 118 qmp command failed - VM 118 qmp command 'query-proxmox-support' failed - got timeout
Dec 10 08:52:07 fro pvestatd[1104]: status update time (6.550 seconds)
Dec 10 08:52:06 fro pvestatd[1104]: VM 118 qmp command failed - VM 118 qmp command 'query-proxmox-support' failed - got timeout
Dec 10 08:50:11 fro pvescheduler[257622]: INFO: Starting Backup of VM 118 (qemu)
Dec 10 08:50:10 fro pvescheduler[257622]: INFO: Finished Backup of VM 113 (01:21:08)
Dec 10 08:50:05 fro pvestatd[1104]: status update time (5.008 seconds)
Dec 10 08:48:46 fro pvestatd[1104]: status update time (5.907 seconds)
Dec 10 08:48:07 fro pvestatd[1104]: status update time (6.452 seconds)
Dec 10 08:48:07 fro pvestatd[1104]: VM 113 qmp command failed - VM 113 qmp command 'query-proxmox-support' failed - got timeout
Dec 10 08:43:05 fro pvestatd[1104]: status update time (5.047 seconds)
Dec 10 08:42:56 fro pmxcfs[991]: [status] notice: received log
Dec 10 08:41:55 fro pvestatd[1104]: status update time (5.085 seconds)
Dec 10 08:39:35 fro pvestatd[1104]: status update time (5.167 seconds)
Dec 10 08:37:45 fro pvestatd[1104]: status update time (5.246 seconds)
Dec 10 08:36:35 fro pvestatd[1104]: status update time (5.013 seconds)
Dec 10 08:35:53 fro pvestatd[1104]: closing with write buffer at /usr/share/perl5/IO/Multiplex.pm line 928.
Dec 10 08:29:12 fro pvescheduler[257622]: VM 113 qmp command failed - VM 113 qmp command 'guest-fsfreeze-thaw' failed - got timeout
Dec 10 08:29:02 fro pvescheduler[257622]: VM 113 qmp command failed - VM 113 qmp command 'guest-fsfreeze-freeze' failed - got timeout
Dec 10 08:23:40 fro pmxcfs[991]: [dcdb] notice: data verification successful
Dec 10 08:17:01 fro CRON[278839]: pam_unix(cron:session): session closed for user root
Dec 10 08:17:01 fro CRON[278840]: (root) CMD (   cd / && run-parts --report /etc/cron.hourly)
Dec 10 08:17:01 fro CRON[278839]: pam_unix(cron:session): session opened for user root(uid=0) by (uid=0)
-
#6
Today it happend again with one VM:
Code:
Dec 11 08:15:47 fro pvedaemon[1136]: <root@pam> end task UPID:fro:000A4386:00E06B8A:61B45023:qmstart:124:root@pam: >
Dec 11 08:15:47 fro kernel: fwbr124i0: port 2(tap124i0) entered forwarding state
Dec 11 08:15:47 fro kernel: fwbr124i0: port 2(tap124i0) entered blocking state
Dec 11 08:15:47 fro kernel: fwbr124i0: port 2(tap124i0) entered disabled state
Dec 11 08:15:47 fro kernel: fwbr124i0: port 2(tap124i0) entered blocking state
Dec 11 08:15:47 fro kernel: vmbr0: port 2(fwpr124p0) entered forwarding state
Dec 11 08:15:47 fro kernel: vmbr0: port 2(fwpr124p0) entered blocking state
Dec 11 08:15:47 fro kernel: device fwpr124p0 entered promiscuous mode
Dec 11 08:15:47 fro kernel: vmbr0: port 2(fwpr124p0) entered disabled state
Dec 11 08:15:47 fro kernel: vmbr0: port 2(fwpr124p0) entered blocking state
Dec 11 08:15:47 fro kernel: fwbr124i0: port 1(fwln124i0) entered forwarding state
Dec 11 08:15:47 fro kernel: fwbr124i0: port 1(fwln124i0) entered blocking state
Dec 11 08:15:47 fro kernel: device fwln124i0 entered promiscuous mode
Dec 11 08:15:47 fro kernel: fwbr124i0: port 1(fwln124i0) entered disabled state
Dec 11 08:15:47 fro kernel: fwbr124i0: port 1(fwln124i0) entered blocking state
Dec 11 08:15:47 fro systemd-udevd[672668]: Using default interface naming scheme 'v247'.
Dec 11 08:15:47 fro systemd-udevd[672668]: ethtool: autonegotiation is unset or enabled, the speed and duplex are not>
Dec 11 08:15:47 fro systemd-udevd[672661]: ethtool: autonegotiation is unset or enabled, the speed and duplex are not>
Dec 11 08:15:47 fro systemd-udevd[672661]: ethtool: autonegotiation is unset or enabled, the speed and duplex are not>
Dec 11 08:15:47 fro kernel: device tap124i0 entered promiscuous mode
Dec 11 08:15:47 fro systemd-udevd[672661]: ethtool: autonegotiation is unset or enabled, the speed and duplex are not>
Dec 11 08:15:47 fro systemd-udevd[672661]: Using default interface naming scheme 'v247'.
Dec 11 08:15:47 fro systemd[1]: Started 124.scope.
Dec 11 08:15:47 fro pvedaemon[1136]: <root@pam> starting task UPID:fro:000A4386:00E06B8A:61B45023:qmstart:124:root@>
Dec 11 08:15:47 fro pvedaemon[672646]: start VM 124: UPID:fro:000A4386:00E06B8A:61B45023:qmstart:124:root@pam:
Dec 11 08:15:22 fro pvedaemon[1136]: <root@pam> end task UPID:fro:000A4301:00E06160:61B45009:qmstop:124:root@pam: OK
Dec 11 08:15:22 fro qmeventd[672528]: Finished cleanup for 124
Dec 11 08:15:22 fro qmeventd[672528]:  OK
Dec 11 08:15:22 fro qmeventd[672528]: trying to acquire lock...
Dec 11 08:15:22 fro qmeventd[672528]: Starting cleanup for 124
Dec 11 08:15:21 fro systemd[1]: 124.scope: Consumed 22min 48.234s CPU time.
Dec 11 08:15:21 fro systemd[1]: 124.scope: Succeeded.
Dec 11 08:15:21 fro pvestatd[1104]: VM 124 qmp command failed - VM 124 qmp command 'query-proxmox-support' failed - c>
Dec 11 08:15:21 fro qmeventd[659]: read: Connection reset by peer
Dec 11 08:15:21 fro kernel: vmbr0: port 2(fwpr124p0) entered disabled state
Dec 11 08:15:21 fro kernel: device fwpr124p0 left promiscuous mode
Dec 11 08:15:21 fro kernel: fwbr124i0: port 1(fwln124i0) entered disabled state
Dec 11 08:15:21 fro kernel: device fwln124i0 left promiscuous mode
Dec 11 08:15:21 fro kernel: vmbr0: port 2(fwpr124p0) entered disabled state
Dec 11 08:15:21 fro kernel: fwbr124i0: port 1(fwln124i0) entered disabled state
Dec 11 08:15:21 fro kernel: fwbr124i0: port 2(tap124i0) entered disabled state
Dec 11 08:15:21 fro pvedaemon[1136]: <root@pam> starting task UPID:fro:000A4301:00E06160:61B45009:qmstop:124:root@p>
Dec 11 08:15:21 fro pvedaemon[672513]: stop VM 124: UPID:fro:000A4301:00E06160:61B45009:qmstop:124:root@pam:
-
#7
I did a kernel update to 5.15.5-1, rebootet, and again there were some io-errors. I have no idea what this could be, as it was smooth until some days ago. It could be that it started with upgrade to 7.1.7 with kernel 5.13 (which I did some days ago, maybe a week), but I am not sure about that. Nothing changed in cabeling, there was no update for synology.
-
#8
I also did a downgrade if pve-qemu-kvm to 6.0.0.4, but that made it even worse. Is there a way to downgrade to let’s say 7.1.5 with all necessary parts like qemu-kvm and kernel?
-
#9
Ok…as I have tried several things, now I have some VMs which are broken…I wanted to bring them back via Restore, but:
Code:
blk_pwrite failed at offset 75329699840 length 4194304 (-5) - Input/output error
pbs-restore: Failed to flush the L2 table cache: Disk quota exceeded
pbs-restore: Failed to flush the refcount block cache: Disk quota exceeded
What Disk quota is meant by this? Maybe that’s what is wrong here?
-
#10
Next step taken:
Recovery to local-thin has worked.
Maybe there is something wrong with NFS shares?
For the initial post:
I have set Async IO to «threads» and haven’t got an io-error since then. Hopefully that was the solution.
-
#11
Oh, dear…oh, dear…
Sorry for spaming this forum…yes, indeed there was something wrong with NFS shares. Always remind yourself about quotas when creating NFS shares!
-
#12
How to fix that problem ?
-
#13
Any update on this or a solution? I have a similar issue with my VMs not starting any more with yellow triangle since I’ve updated my PVE from 7.0-xx to most recent version 7.2-11 today. These VMs also reside on an NFS storage. Nothing was changed on the storage. No quotas should be in place, afaik.
Update: Set default Kernel back to 5.11.22-7-pve (from 5.15.53-1-pve) as described here https://forum.proxmox.com/threads/select-default-boot-kernel.79582/post-398029 and now the issue seems to be gone.
Last edited: Sep 16, 2022
-
#14
thanks for the response, so we just set back the kernel version to the previous version?
-
#15
Well at least that’s what worked for me after the most recent update put my proxmox cluster into a state where it wasn’t able to launch any VMs due to this I/O error.
Содержание
- io-error how to identify, fix and check?
- eiger3970
- eiger3970
- [SOLVED] Crash VM with io-error
- carcella
- carcella
- carcella
- carcella
- VM shows io-error and locks up
- Sandbo
- VM I/O error when mounting a RAIDZ partition
- VM Status: io-error ZFS full
- wowkisame
- LnxBil
- wowkisame
- Dunuin
- wowkisame
- Dunuin
- wowkisame
- Dunuin
- wowkisame
- itNGO
- LnxBil
io-error how to identify, fix and check?
eiger3970
Active Member
Hello, I’ve received an io-error. I would like to know how to pinpoint what the cause of the problem is, to address the correct issue and avoid repeats.
I ran some tests
I’m guessing the hard drive is faulty, but would like to confirm which hard drive, before physically replacing.
Also, how do I check all the hard drives in the server without physically opening up the machine?
I would like to confirm harddrives running Proxmox and if or what hard drives are running the servers, such as CentOS where the io-error appeared on the GUI. The Proxmox GUI also showed the CPU usage at 101.5%, but was running fine, until I logged in and saw the io-error.
Famous Member
Hi,
where do you see the io-error?
For looking at your hdds use smartmontools.
Which storage do you use for your VM? Which cache settings?
eiger3970
Active Member
Thank you for the reply.
The io-error is in VM 4 and 5 on the Proxmox GUI > Server View > Datacenter > proxmox > VM > Summary > Status > Status > io-error.
I’ve had a look at smartmontools and it looks like I install on the Proxmox machine.
The storage used is a hard disk drive (virtio0) local:VMID/vm-VMID-disk-1.raw,format=raw,size=50G.
Cache (memory?): 2.00GB.
VMs 1 — 3 run fine.
VMs 4 — 5 had the io-errors.
I deleted VMs 4 — 5, then restored VMs 4 — 5.
VM 4 has the same error. Odd as the restore is from 20160313, but VM 4 worked until 20160319.
Yes, I have run the fsck manually, however after fixing issues, a reboot returns to the same error.
Actually, I ran the fsck manually on the restore, and it’s fixed.
So, how can I avoid this.
I guess setting up RAID or knowing what causes the io-error would be good.
Источник
[SOLVED] Crash VM with io-error
carcella
New Member

Proxmox Staff Member
Best regards,
Mira
Do you already have a Commercial Support Subscription? — If not, Buy now and read the documentation
carcella
New Member
# pveversion -v
proxmox-ve: 7.3-1 (running kernel: 5.11.22-7-pve)
pve-manager: 7.3-3 (running version: 7.3-3/c3928077)
pve-kernel-5.15: 7.2-14
pve-kernel-helper: 7.2-14
pve-kernel-5.13: 7.1-9
pve-kernel-5.15.74-1-pve: 5.15.74-1
pve-kernel-5.15.64-1-pve: 5.15.64-1
pve-kernel-5.13.19-6-pve: 5.13.19-15
pve-kernel-5.13.19-2-pve: 5.13.19-4
pve-kernel-5.11.22-7-pve: 5.11.22-12
ceph-fuse: 15.2.15-pve1
corosync: 3.1.7-pve1
criu: 3.15-1+pve-1
glusterfs-client: 9.2-1
ifupdown2: 3.1.0-1+pmx3
ksm-control-daemon: 1.4-1
libjs-extjs: 7.0.0-1
libknet1: 1.24-pve2
libproxmox-acme-perl: 1.4.2
libproxmox-backup-qemu0: 1.3.1-1
libpve-access-control: 7.2-5
libpve-apiclient-perl: 3.2-1
libpve-common-perl: 7.3-1
libpve-guest-common-perl: 4.2-3
libpve-http-server-perl: 4.1-5
libpve-storage-perl: 7.3-1
libspice-server1: 0.14.3-2.1
lvm2: 2.03.11-2.1
lxc-pve: 5.0.0-3
lxcfs: 4.0.12-pve1
novnc-pve: 1.3.0-3
proxmox-backup-client: 2.2.7-1
proxmox-backup-file-restore: 2.2.7-1
proxmox-mini-journalreader: 1.3-1
proxmox-offline-mirror-helper: 0.5.0-1
proxmox-widget-toolkit: 3.5.3
pve-cluster: 7.3-1
pve-container: 4.4-2
pve-docs: 7.3-1
pve-edk2-firmware: 3.20220526-1
pve-firewall: 4.2-7
pve-firmware: 3.5-6
pve-ha-manager: 3.5.1
pve-i18n: 2.8-1
pve-qemu-kvm: 7.1.0-4
pve-xtermjs: 4.16.0-1
qemu-server: 7.3-1
smartmontools: 7.2-pve3
spiceterm: 3.2-2
swtpm: 0.8.0
bpo11+2
vncterm: 1.7-1
zfsutils-linux: 2.1.6-pve1
root@pve:
carcella
New Member
# qm config 100
boot: order=ide0;ide2;net0
cores: 2
description: administrator / AzPan!c02020
ide0: local-lvm:vm-100-disk-0,size=62G
ide2: cdrom,media=cdrom
machine: pc-i440fx-6.1
memory: 6144
meta: creation-qemu=6.1.0,ctime=1642289339
name: Win19srv
net0: e1000=A2:4F:4C:1D:A1 2,bridge=vmbr0,firewall=1
numa: 0
ostype: win10
parent: win2019_18122022
scsihw: virtio-scsi-pci
smbios1: uuid=ecd0cefd-2aa5-45c1-b123-f3c00946843d
sockets: 3
usb0: spice,usb3=1
vga: qxl
vmgenid: 284cb1d3-c3bc-4298-8495-4606211b5504
carcella
New Member
Proxmox Staff Member
Best regards,
Mira
Do you already have a Commercial Support Subscription? — If not, Buy now and read the documentation
Источник
VM shows io-error and locks up
Sandbo
Member
I am setting up one VM to do plotting for Chia, it has the following disks:
-3 pass-through 1TB SSDs
-5 SATA 400GB SSDs as RAID0 in Proxmox, used as a directory and is assigned as virtual hard disk to the VM (volume set was 1800 GiB, after checking df -BGiB in Proxmox shell)
-1 PCI-E RAID card (LSI 9266-8i)
After some times, can be a day or some times as short as a couple hours, the VM becomes unresponsive to SSH. By logging in to the GUI, the console simply says «Guest disabled display», and there is a yellow «!» saying «io-error». The OS is completely frozen and I can only reboot it, and it does work after the reboot but can freeze later. I checked and when it locks up, the SATA arrays are at most at 80% and are not yet full.
May I know where to start to look into the issue? As I have a few IO devices, can I see which one of the above three is the cause?
Update 1: Adding some context after some tests. Turns out it was caused by the SATA drives as I isolate them one by one.
They are 5*400GB SATA SSDs (Intel DC S3700 400 GB) attached to the mainboard directly (X399 Taichi). I set them up as ZFS RAID 0 and created a directory under /CSCP2. I checked by «df -BGiB» that the volume is (for example, not when it had the error)
CSCP2 1802GiB 343GiB 1459GiB 20% /CSCP2
So I assigned to VM as a harddisk with 1800 GiB. As the drive is being filled, and before it has been fully filled, it threw the io-error at some point, seemingly up to 80% use of the drive as indicated from df from host.
Источник
VM I/O error when mounting a RAIDZ partition
New Member
First of all, I should say I’m a total beginner regarding these matters, so please bear with me for a moment. Thank you.
My company accidentally fill one RAIDZ partition (sdb1) up to 100% of its capacity yesterday causing the VM in which such partition was originally mounted to go unresponsive.
We stopped and then started the VM succesfully, but the part is now unmounted as it is absent in df (see below). 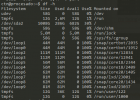
When checking with lsblk I can see the disk and its partition without a mount point indeed (see figure below for details). 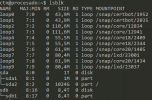
The problem is that when I try to mount the partition from the console using the typical mount /dev/sdb1 , the terminal hangs indefinitely, and when checking it out in the proxmox VE dashboard the VM appears with a warning icon indicating io-error, although apparently the VM is still running as indicated in the Status flag (I don’t know why it says that, because it effectively goes unresponsive). The figure below shows the specific error. 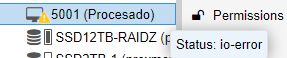
I assume the problem comes from the lack of any free space in the partition, so, do you have any ideas about how can I proceed without losing the data? I have searched and searched for solutions and had no luck yet. The fact I’m only a begginer does not help at all, to be honest.
Thank you very much in advance for your time!
Источник
VM Status: io-error ZFS full
wowkisame
New Member
Since yesterday I had a VM with status : io-error. I can’t find a way to make free space on it . When I check my ZFS pool :
root@pve:
# zpool list
NAME SIZE ALLOC FREE CKPOINT EXPANDSZ FRAG CAP DEDUP HEALTH ALTROOT
rpool 222G 115G 107G — — 68% 51% 1.00x ONLINE —
stockage 43.6T 42.3T 1.36T — — 10% 96% 1.00x ONLINE —
ZFS list :
root@pve:
# zfs list
NAME USED AVAIL REFER MOUNTPOINT
rpool 115G 100G 104K /rpool
rpool/ROOT 4.34G 100G 96K /rpool/ROOT
rpool/ROOT/pve-1 4.34G 100G 4.34G /
rpool/data 110G 100G 96K /rpool/data
rpool/data/vm-100-disk-0 1.74G 100G 1.74G —
rpool/data/vm-101-disk-0 108G 100G 108G —
rpool/data/vm-105-disk-0 56K 100G 56K —
stockage 30.7T 0B 140K /stockage
stockage/vm-101-disk-0 30.7T 0B 30.7T —
I think that the free space in zpool is use to parity for raidz, so ZFS don’t have any space.
I can start a live Linux on the VM but when I try to mount the filesystem, the VM freeze and I got status : io-error in Proxmox.
I don’t know if is-it possible to mount the filesystem directly to the host proxmox and make some cleanup .
Any others ideas ?
LnxBil
Famous Member
No, the free space is unusable, therefore you cannot store anything new on it.
First, I’d look for any refreservation values, then I’d see if there are any snapshots that can be deleted, then I’d temporarily send/receive one dataset to another pool and delete the source . and do your maintenance stuff.
wowkisame
New Member
Hi LnxBil,
First of all, thanks for your time.
Unfortunately, no snapshot, no reservation, no quota (may be there are others commands ?) :
Could you explain this part please ?
Of course I will create an alert for storage next time .
Dunuin
Famous Member
Better you set a quota too and not just an alarm. In general its recommended to keep around 20% of your ZFS pool always empty because the pool will become slower when the pool gets full. I always set a quota of 90% for the entire pool and set a alarm when 80% is exceeded to clean up stuff to bring it under 80% again. That way you can’t run into such a situation where your pools gets full to a point where it stops working.
And you only checked «reservation» but not «refreservation».
Output of zfs list -o space stockage or even zfs list -o space would be useful too. Then you also see snapshot and refreservation space usage.
wowkisame
New Member
Thanks for your time and your answer.
I don’t understand the «Sending and Receiving ZFS Data» part. I can only send a part of stockage to rpool/data for exemple ?
Dunuin
Famous Member
Thanks for your time and your answer.
wowkisame
New Member
I don’t have 31+TB to copy my volume. So I don’t have any solution to clean or reduce the volume
Dunuin
Famous Member
wowkisame
New Member
Oh
May be someone else have others ideas ?

itNGO
Well-Known Member
Oh
May be someone else have others ideas ?
LnxBil
Famous Member
The problem is that you have only one zvol stored on your pool stockage without any snapshots or any kind of reservation and you ran out of space. The send/receive route is not a viable option, because you only have one volume.
The problem with freeing up used space is that this probably needs to write in order to clean it up a bit, which is not real option. Yet, as you’ve already descibed, you already ran out of space and the guest noticed that, so you’re already a filesystem with errors on it. As you described, you cannot mount the disk in a live system due to the space problem, so cleaning it now won’t help — or maybe it does.
Источник
Hi all,
Since a few days I get the error «io-error» message for one of my VMs when I try to boot it.
I can’t explain why this happened, this setup has been running the last 10 months without problems.
On the host I have installed Proxmox 6.1-7, the VM which has problems uses OpenMediaVault 4.1.x.
The host has 8 hard disks and one SSD installed, the hard disks are divided into two ZFS raids. (volume1 and volume2)
The VM itself was set up with two virtual disks. On one disk is the operating system, on the other disk there is only data.
The OS disk is located on the SSD and the data disk can be found on volume1. (vm-100-disk-0)
If I detache the data disk, I can boot the VM normally.
So my guess is there’s something wrong with the raid, but I can’t find anything out of the ordinary.
My second guess would be that the data disk on volume1 is somehow corrupt.
I’ve run a «zpool scrub» for voume1, but no error was found.
Here some info’s regarding the storage situation:
root@pve:/# df -h
Filesystem            Size  Used Avail Use% Mounted on
udev                   16G     0   16G   0% /dev
tmpfs                 3.1G  9.2M  3.1G   1% /run
/dev/mapper/pve-root   57G  7.2G   47G  14% /
tmpfs                  16G   37M   16G   1% /dev/shm
tmpfs                 5.0M     0  5.0M   0% /run/lock
tmpfs                  16G     0   16G   0% /sys/fs/cgroup
/dev/nvme0n1p2        511M  304K  511M   1% /boot/efi
volume2                11T  256K   11T   1% /volume2
volume1               2.0M  256K  1.8M  13% /volume1
/dev/fuse              30M   16K   30M   1% /etc/pve
tmpfs                 3.1G     0  3.1G   0% /run/user/0
root@pve:/# lvs
  LV            VG  Attr       LSize    Pool Origin Data%  Meta%  Move Log Cpy%Sync Convert
  data          pve twi-aotz-- <147.38g             39.62  2.86
  root          pve -wi-ao----   58.00g
  swap          pve -wi-ao----    8.00g
  vm-100-disk-0 pve Vwi-aotz--   60.00g data        63.63
  vm-101-disk-0 pve Vwi-aotz--   25.00g data        80.86
root@pve:/# vgs
  VG  #PV #LV #SN Attr   VSize   VFree
  pve   1   5   0 wz--n- 232.38g 16.00g
root@pve:/# pvs
  PV             VG  Fmt  Attr PSize   PFree
  /dev/nvme0n1p3 pve lvm2 a--  232.38g 16.00g
root@pve:/# zpool list -v
NAME        SIZE  ALLOC   FREE  CKPOINT  EXPANDSZ   FRAG    CAP  DEDUP    HEALTH  ALTROOT
volume1    36.2T  35.1T  1.13T        -         -    11%    96%  1.00x    ONLINE  -
  raidz1   36.2T  35.1T  1.13T        -         -    11%  96.9%      -  ONLINE
    sda        -      -      -        -         -      -      -      -  ONLINE
    sdb        -      -      -        -         -      -      -      -  ONLINE
    sdc        -      -      -        -         -      -      -      -  ONLINE
    sdd        -      -      -        -         -      -      -      -  ONLINE
volume2    14.5T  53.3G  14.5T        -         -     0%     0%  1.00x    ONLINE  -
  raidz1   14.5T  53.3G  14.5T        -         -     0%  0.35%      -  ONLINE
    sde        -      -      -        -         -      -      -      -  ONLINE
    sdf        -      -      -        -         -      -      -      -  ONLINE
    sdg        -      -      -        -         -      -      -      -  ONLINE
    sdh        -      -      -        -         -      -      -      -  ONLINE
root@pve:/# zpool status -v
  pool: volume1
 state: ONLINE
  scan: scrub repaired 0B in 0 days 19:38:40 with 0 errors on Wed Feb 26 13:07:48 2020
config:

        NAME        STATE     READ WRITE CKSUM
        volume1     ONLINE       0     0     0
          raidz1-0  ONLINE       0     0     0
            sda     ONLINE       0     0     0
            sdb     ONLINE       0     0     0
            sdc     ONLINE       0     0     0
            sdd     ONLINE       0     0     0

errors: No known data errors

  pool: volume2
 state: ONLINE
  scan: scrub repaired 0B in 0 days 00:00:02 with 0 errors on Sun Feb  9 00:24:05 2020
config:

        NAME        STATE     READ WRITE CKSUM
        volume2     ONLINE       0     0     0
          raidz1-0  ONLINE       0     0     0
            sde     ONLINE       0     0     0
            sdf     ONLINE       0     0     0
            sdg     ONLINE       0     0     0
            sdh     ONLINE       0     0     0

errors: No known data errors
Something that seems strange to me, why does the command «df -h» show a much smaller size for volume1? Is the volume not mounted correctly?
Now to my question, what can i do to fix this problem? If it cannot be fixed, is there any way I can save my data?
Thanks in advance for your help!
Sorry if I forgot to add some important information.
-

-
July 18 2013, 13:44
Приветствую.
Debian x64 (Proxmox), 2.6.32 на Hp Prolliant G6. Контроллер Hewlett-Packard Company Smart Array G6 controllers. В dmesg валятся такие ошибки:
ext3_orphan_cleanup: deleting unreferenced inode 2712868
ext3_orphan_cleanup: deleting unreferenced inode 2712867
ext3_orphan_cleanup: deleting unreferenced inode 2712866
lost page write due to I/O error on dm-5
Buffer I/O error on device dm-5, logical block 23265409
lost page write due to I/O error on dm-5
EXT3-fs error (device dm-5): ext3_get_inode_loc: unable to read inode block — inode=11075712, block=44302345
EXT3-fs error (device dm-5): ext3_get_inode_loc: unable to read inode block — inode=8503794, block=34013217
EXT3-fs error (device dm-5): ext3_get_inode_loc: unable to read inode block — inode=11075586, block=44302338
EXT3-fs error (device dm-5): ext3_get_inode_loc: unable to read inode block — inode=5818417, block=23265413
JBD: I/O error detected when updating journal superblock for dm-5
EXT3-fs (dm-5): error: ext3_journal_start_sb: Detected aborted journal
EXT3-fs (dm-5): error: remounting filesystem read-only
Не могу найти, какой раздел он перемонтировал в RO и не пойму, что такое dm-5?
# ls /dev/dm*
/dev/dm-0 /dev/dm-1 /dev/dm-2 /dev/dm-3 /dev/dm-4
root@reserv:/dev/mapper# ls -l
total 0
crw——- 1 root root 10, 61 Jun 5 21:18 control
lrwxrwxrwx 1 root root 7 Jul 17 23:03 pve-data -> ../dm-4
lrwxrwxrwx 1 root root 7 Jun 5 21:18 pve-root -> ../dm-0
lrwxrwxrwx 1 root root 7 Jul 18 10:26 pve-swap -> ../dm-3
lrwxrwxrwx 1 root root 7 Jul 18 10:26 storage1-backups -> ../dm-2
lrwxrwxrwx 1 root root 7 Jul 18 10:26 storage1-iso -> ../dm-1
HPшная утилитка говорит, что с винтами всё OK.
# hpacucli ctrl slot=0 pd all show
Smart Array P410i in Slot 0 (Embedded)
array A
physicaldrive 1I:1:3 (port 1I:box 1:bay 3, SAS, 300 GB, OK)
physicaldrive 1I:1:4 (port 1I:box 1:bay 4, SAS, 300 GB, OK)
array B
physicaldrive 1I:1:1 (port 1I:box 1:bay 1, SAS, 500 GB, OK)
physicaldrive 1I:1:2 (port 1I:box 1:bay 2, SAS, 500 GB, OK)
Так же I/O errors валятся в одной из гостевых kvm-виртуалок, (файловый образ в формате RAW). Может кто-нибудь пояснить, где повреждена FS, в гостевой или в хост-системе, и как это вообще всё локализовать?