Discover 23 more articles on this topic
Anyone who reads polls on the internet, or in newspapers, should be aware that sampling errors could vastly influence the data and lead people to draw incorrect conclusions.
To further compound the random sampling errors, many survey companies, newspapers and pundits are well aware of this, and deliberately manipulate polls to give favorable results.
In any experiment where it is impossible to sample an entire population, usually due to practicality and expense, a representative sample must be used.
Of course, when you use a sample group, it can never fully match the entire population, and there will always be some likelihood of random sampling error.
Any researcher must strive to ensure that the sample is as representative as possible, and statistical tests have inbuilt checks and balances to take this into account.
To illustrate how to ensure that your statistics are as accurate as possible, we are going to use the example of an opinion poll. These are one of the most commonly misinterpreted representations of data, and failure to take into account the nuances of statistics can paint an incorrect picture.

Margin of Error — A False Picture
The problem is, when you see an opinion poll in a newspaper or internet site, you will usually see a margin of error, such a + or — 3%. The temptation is to think that the polls will be accurate within this figure.
For example, if a poll gives one political party (A) a 42% share of the vote, and the other (B) 39%, this opens up a number of possible results. (A) could have 45%, (B) 36%. Both could be 39% or (B) could actually be ahead, 42% versus 39%. Of course, the results could show any variation in between those extremes. Complicated enough?
To complicate the picture further, even this random sampling error can be wildly inaccurate. Any opinion poll may give the margin of error, but this can convey a false sense of security and make people assume that the results ‘must’ lie within this range.
In fact, these figures could actually be completely wrong, and the numbers are only ever an estimate.

The Problem With Random Sampling Error
The problem is that these results only show the random sampling error within that specific group. They show the chances of the results in that group occurring purely by chance, exactly like the 95% confidence margin employed by many scientific researchers.
However, this is a very narrow definition and is often misunderstood.
In an opinion poll, there is no guarantee that the sample of 1000 or 10 000 people is truly representative of the larger population as a whole.
There have been many extremely inaccurate polls conducted over the years, and they fell down due to poor design and not understanding all of the relevant factors.
For example, an opinion poll company conducting telephone polls may make the mistake of only telephoning during office hours, when most of the population is at work, skewing the data.
In addition, poorer families do not always have a fixed line telephone and use unregistered cell phones, again leaving a huge potential for inaccuracy. The margins of error would be perfectly acceptable, in these cases, but the overall findings would still be horribly wrong.
Modern polling companies are very skilled at designing polls to select samples from many elements of the population, and via various media, so big errors rarely happen. Despite this, opinion polls must always be taken as a guide only, not an exact representation of how an election is likely to unfold.
Random Sampling Error and Experimental Design
The mistakes made by pollsters relate directly to any type of experiment involving random sample groups.
Statistics can only work with the data provided and, if your design is poorly thought out, will not be able to cover up these errors. Garbage in definitely equals garbage out.
Bibliography
Husch, B. (1971). Planning a Forest Inventory. Rome, Italy: Food and Agriculture Organization of the United Nations
Urdan, T.C. (2005). Statistics in Plain English, Mahwah, NJ: Lawrence Erlbaum
Weisberg, H.F. (2005).The Total Survey Error Approach: A Guide to the New Science of Survey Research. Chicago: University of Chicago Press
What Is a Sampling Error?
A sampling error is a statistical error that occurs when an analyst does not select a sample that represents the entire population of data. As a result, the results found in the sample do not represent the results that would be obtained from the entire population.
Sampling is an analysis performed by selecting a number of observations from a larger population. The method of selection can produce both sampling errors and non-sampling errors.
Key Takeaways
- A sampling error occurs when the sample used in the study is not representative of the whole population.
- Sampling is an analysis performed by selecting a number of observations from a larger population.
- Even randomized samples will have some degree of sampling error because a sample is only an approximation of the population from which it is drawn.
- The prevalence of sampling errors can be reduced by increasing the sample size.
- In general, sampling errors can be placed into four categories: population-specific error, selection error, sample frame error, or non-response error.
Understanding Sampling Errors
A sampling error is a deviation in the sampled value versus the true population value. Sampling errors occur because the sample is not representative of the population or is biased in some way. Even randomized samples will have some degree of sampling error because a sample is only an approximation of the population from which it is drawn.
Calculating Sampling Error
The sampling error formula is used to calculate the overall sampling error in statistical analysis. The sampling error is calculated by dividing the standard deviation of the population by the square root of the size of the sample, and then multiplying the resultant with the Z-score value, which is based on the confidence interval.
Sampling Error
=
Z
×
σ
n
where:
Z
=
Z
score value based on the
confidence interval (approx
=
1.96
)
σ
=
Population standard deviation
n
=
Size of the sample
begin{aligned}&text{Sampling Error}=Ztimesfrac{sigma}{sqrt{n}}\&textbf{where:}\&Z=Ztext{ score value based on the}\&qquad text{confidence interval (approx}=1.96)\&sigma=text{Population standard deviation}\&n=text{Size of the sample}end{aligned}
Sampling Error=Z×nσwhere:Z=Z score value based on the confidence interval (approx=1.96)σ=Population standard deviationn=Size of the sample
Types of Sampling Errors
There are different categories of sampling errors.
Population-Specific Error
A population-specific error occurs when a researcher doesn’t understand who to survey.
Selection Error
Selection error occurs when the survey is self-selected, or when only those participants who are interested in the survey respond to the questions. Researchers can attempt to overcome selection error by finding ways to encourage participation.
Sample Frame Error
A sample frame error occurs when a sample is selected from the wrong population data.
Non-response Error
A non-response error occurs when a useful response is not obtained from the surveys because researchers were unable to contact potential respondents (or potential respondents refused to respond).
Eliminating Sampling Errors
The prevalence of sampling errors can be reduced by increasing the sample size. As the sample size increases, the sample gets closer to the actual population, which decreases the potential for deviations from the actual population. Consider that the average of a sample of 10 varies more than the average of a sample of 100. Steps can also be taken to ensure that the sample adequately represents the entire population.
Researchers might attempt to reduce sampling errors by replicating their study. This could be accomplished by taking the same measurements repeatedly, using more than one subject or multiple groups, or by undertaking multiple studies.
Random sampling is an additional way to minimize the occurrence of sampling errors. Random sampling establishes a systematic approach to selecting a sample. For example, rather than choosing participants to be interviewed haphazardly, a researcher might choose those whose names appear first, 10th, 20th, 30th, 40th, and so on, on the list.
Examples of Sampling Errors
Assume that XYZ Company provides a subscription-based service that allows consumers to pay a monthly fee to stream videos and other types of programming via an Internet connection.
The firm wants to survey homeowners who watch at least 10 hours of programming via the Internet per week and that pay for an existing video streaming service. XYZ wants to determine what percentage of the population is interested in a lower-priced subscription service. If XYZ does not think carefully about the sampling process, several types of sampling errors may occur.
A population specification error would occur if XYZ Company does not understand the specific types of consumers who should be included in the sample. For example, if XYZ creates a population of people between the ages of 15 and 25 years old, many of those consumers do not make the purchasing decision about a video streaming service because they may not work full-time. On the other hand, if XYZ put together a sample of working adults who make purchase decisions, the consumers in this group may not watch 10 hours of video programming each week.
Selection error also causes distortions in the results of a sample. A common example is a survey that only relies on a small portion of people who immediately respond. If XYZ makes an effort to follow up with consumers who don’t initially respond, the results of the survey may change. Furthermore, if XYZ excludes consumers who don’t respond right away, the sample results may not reflect the preferences of the entire population.
Sampling Error vs. Non-sampling Error
There are different types of errors that can occur when gathering statistical data. Sampling errors are the seemingly random differences between the characteristics of a sample population and those of the general population. Sampling errors arise because sample sizes are inevitably limited. (It is impossible to sample an entire population in a survey or a census.)
A sampling error can result even when no mistakes of any kind are made; sampling errors occur because no sample will ever perfectly match the data in the universe from which the sample is taken.
Company XYZ will also want to avoid non-sampling errors. Non-sampling errors are errors that result during data collection and cause the data to differ from the true values. Non-sampling errors are caused by human error, such as a mistake made in the survey process.
If one group of consumers only watches five hours of video programming a week and is included in the survey, that decision is a non-sampling error. Asking questions that are biased is another type of error.
What Is Sampling Error vs. Sampling Bias?
In statistics, sampling means selecting the group that you will actually collect data from in your research.
Sampling bias is the expectation, which is known in advance, that a sample won’t be representative of the true population. For instance, if the sample ends up having proportionally more women or young people than the overall population.
Sampling errors are statistical errors that arise when a sample does not represent the whole population once analyses have been undertaken.
Why Is Sampling Error Important?
Being aware of the presence of sampling errors is important because it can be an indicator of the level of confidence that can be placed in the results. Sampling error is also important in the context of a discussion about how much research results can vary.
How Do You Find the Sampling Error?
In survey research, sampling errors occur because all samples are representative samples: a smaller group that stands in for the whole of your research population. It’s impossible to survey the entire group of people you’d like to reach.
It’s not usually possible to quantify the degree of sampling error in a study since it’s impossible to collect the relevant data from the entire population you are studying. This is why researchers collect representative samples (and representative samples are the reason why there are sampling errors).
What Is Sampling Error vs. Standard Error?
Sampling error is derived from the standard error (SE) by multiplying it by a Z-score value to produce a confidence interval.
The standard error is computed by dividing the standard deviation by the square root of the sample size.
The Bottom Line
Sampling error occurs when a sample drawn from a population deviates somewhat from that true population. Large sampling errors can lead to incorrect estimates or inferences made about the population based on statistical analysis of that sample.
In general, sampling errors can be placed into four categories: population-specific error, selection error, sample frame error, or non-response error. A population-specific error occurs when the researcher does not understand who they should survey. A selection error occurs when respondents self-select their participation in the study. (This results in only those that are interested in responding, which skews the results.) A sample frame error occurs when the wrong sub-population is used to select a sample. Finally, a non-response error occurs when potential respondents are not successfully contacted or refuse to respond.
From Wikipedia, the free encyclopedia
In statistics, sampling errors are incurred when the statistical characteristics of a population are estimated from a subset, or sample, of that population. Since the sample does not include all members of the population, statistics of the sample (often known as estimators), such as means and quartiles, generally differ from the statistics of the entire population (known as parameters). The difference between the sample statistic and population parameter is considered the sampling error.[1] For example, if one measures the height of a thousand individuals from a population of one million, the average height of the thousand is typically not the same as the average height of all one million people in the country.
Since sampling is almost always done to estimate population parameters that are unknown, by definition exact measurement of the sampling errors will not be possible; however they can often be estimated, either by general methods such as bootstrapping, or by specific methods incorporating some assumptions (or guesses) regarding the true population distribution and parameters thereof.
Description[edit]
Sampling Error[edit]
The sampling error is the error caused by observing a sample instead of the whole population.[1] The sampling error is the difference between a sample statistic used to estimate a population parameter and the actual but unknown value of the parameter.[2]
Effective Sampling[edit]
In statistics, a truly random sample means selecting individuals from a population with an equivalent probability; in other words, picking individuals from a group without bias. Failing to do this correctly will result in a sampling bias, which can dramatically increase the sample error in a systematic way. For example, attempting to measure the average height of the entire human population of the Earth, but measuring a sample only from one country, could result in a large over- or under-estimation. In reality, obtaining an unbiased sample can be difficult as many parameters (in this example, country, age, gender, and so on) may strongly bias the estimator and it must be ensured that none of these factors play a part in the selection process.
Even in a perfectly non-biased sample, the sample error will still exist due to the remaining statistical component; consider that measuring only two or three individuals and taking the average would produce a wildly varying result each time. The likely size of the sampling error can generally be reduced by taking a larger sample.[3]
Sample Size Determination[edit]
The cost of increasing a sample size may be prohibitive in reality. Since the sample error can often be estimated beforehand as a function of the sample size, various methods of sample size determination are used to weigh the predicted accuracy of an estimator against the predicted cost of taking a larger sample.
Bootstrapping and Standard Error[edit]
As discussed, a sample statistic, such as an average or percentage, will generally be subject to sample-to-sample variation.[1] By comparing many samples, or splitting a larger sample up into smaller ones (potentially with overlap), the spread of the resulting sample statistics can be used to estimate the standard error on the sample.
In Genetics[edit]
The term «sampling error» has also been used in a related but fundamentally different sense in the field of genetics; for example in the bottleneck effect or founder effect, when natural disasters or migrations dramatically reduce the size of a population, resulting in a smaller population that may or may not fairly represent the original one. This is a source of genetic drift, as certain alleles become more or less common), and has been referred to as «sampling error»,[4] despite not being an «error» in the statistical sense.
See also[edit]
- Margin of error
- Propagation of uncertainty
- Ratio estimator
- Sampling (statistics)
References[edit]
- ^ a b c Sarndal, Swenson, and Wretman (1992), Model Assisted Survey Sampling, Springer-Verlag, ISBN 0-387-40620-4
- ^ Burns, N.; Grove, S. K. (2009). The Practice of Nursing Research: Appraisal, Synthesis, and Generation of Evidence (6th ed.). St. Louis, MO: Saunders Elsevier. ISBN 978-1-4557-0736-2.
- ^ Scheuren, Fritz (2005). «What is a Margin of Error?». What is a Survey? (PDF). Washington, D.C.: American Statistical Association. Archived from the original (PDF) on 2013-03-12. Retrieved 2008-01-08.
- ^ Campbell, Neil A.; Reece, Jane B. (2002). Biology. Benjamin Cummings. pp. 450–451. ISBN 0-536-68045-0.

In statistics, a sample refers to a subset of a larger population. The sample allows researchers to conduct their study on a part of their target population so that they can work with manageable data, in a timely and cost-effective manner. In order to acquire data that is generalizable to your target population, is integral to select a sample group that is representative of your target population.
A representative sample will have the same composition as that of the larger population. However, when researchers fail to select a target population that is representative, it results in sampling error.

What are the most Common Sampling Errors in Market research?
Sampling error can be defined as a statistical error that occurs when a researcher fails to select a sample that is representative of the entire population. When sampling error occurs, the results obtained from the sample are not reflective of the results that would be obtained from the target population itself. Therefore, the findings of the study are less generalizable to the target population.
The only way to completely eliminate sampling error from a study is by observing every element in a population, which is not feasible and is even impossible in some cases. Therefore, sampling error cannot be completely avoided as no sample will ever be fully representative of the target population. However, by having an understanding of sampling error, we can estimate the size of it and take measures to minimize it, so as to make the findings of our study as generalizable to the larger population as possible.
Types of Sampling Errors
Sampling errors can be caused by a range of different causes. By having an understanding of what causes sampling error, we can take measures to minimize it.
The following is a list of the five most common types of sampling errors:
1. Sample Frame Error
Sample frame error occurs when the sample is selected from the wrong population data. Therefore, in such cases, the sample frame does not represent the population of interest from which the researcher thinks they are sampling. This error generally includes targeting the wrong population segments or completely missing out on certain demographics within the correct segments.
2. Selection Error
This error occurs when participants themselves opt to be a part of the study, and therefore only those who are interested participate in the survey. If researchers overlook respondents who didn’t initially respond, the outcome of the study will not be reflective of the target market. If instead, the researcher decides to follow up with the respondents that didn’t initially participate in the survey, the outcome is very likely to change.
3. Population Specification Error
This is a type of sample design issue that is caused when a researcher fails to clearly outline who they want to survey and therefore does not have a clear idea of their target population. When you don’t have a clearly defined target population, you may end up selecting inappropriate elements to be a part of your sample group. This error is generally the result of a lack of knowledge on which group(s) would be of most use and relevance to the study.
Schedule a guided tour of Voxco
4. Non-Response Error
Non-response errors occur from the failure to obtain responses from all units in the selected sample group. The decrease in the sample size and amount of information collected will result in a larger standard error. Additionally, a bias is introduced at the risk of non-respondents differing from the respondents within the selected sample. Many reasons could cause this, for example, a percentage of the sample group may not use the channel through which the survey was conducted. The extent of non-response error can be checked by using follow-up surveys through additional channels to obtain responses from those respondents who didn’t initially respond to the survey.
5. Sampling Errors
Sampling errors occur when there is a lack of representativeness of the target population in the sample group. This is generally the result of poor sample designing. Therefore, this error can be minimized or eliminated through careful sample designing and by ensuring the sample size is large enough to reflect the entire population.
Example of Sampling Error
To gain a deeper understanding of sampling error, let’s take a look at a real-life example where a study had a large sampling error. We will also take a look at what caused this sampling error.
In the 1936 presidential election, Alfred Landon, the Republican governor of Kansas was pitted against the incumbent President, Franklin D. Roosevelt. At the time, Literary Digest was one of the most respected magazines and had accurately predicted the winners of multiple presidential elections within the previous decades. For this election, Literary Digest conducted a poll about the election, and with the data collected, they predicted that Landon would win the election with 57% of the votes while Roosevelt will lose with 43%.
The actual outcome of the election was jarringly different, with 62% of the votes going to Roosevelt and 38% going to Landon.
In this case, the sampling error was a shocking 19% even though this was one of the largest and most expensive polls conducted by Literary Digest and had a sample size of around 2.4 million people.
This large sampling error was caused specifically due to sampling frame error, as the sample frame was from telephone directories and car registrations. However, at the time, many Americans did not own cars and phones and the ones who did were largely Republicans. For this reason, the results wrongly predicted a Republican Victory.
How to Estimate the Sampling Error?
The margin of error that is seen in survey results is an estimate of sampling error. The following formula can be used to calculate your sampling error:
Sampling Error= Z x (σ/n)
where,
Z = Z score value based on the confidence interval (approx=1.96)
σ = Population standard deviation
n = Size of the sample
It is important to note that as this value is simply an estimate, there is a small chance (5% or less) that the margin of error is more than what is stated in the report.
[Related Read: How to Ensure your Survey Delivers Better Result]
Want to know how to increase your survey response rates?
Learn how to meet respondents where they are, drive survey completion while offering a seamless experience, Every Time!
Ways to Reduce Sampling Errors
There are many different measures that can be taken to reduce the 5 types of sampling error.
Let’s explore a few of the most effective ways to do so:
1. Select a Larger Sample Size
When you select a larger sample size, your sample size gets closer to the actual population size. This makes the sample more representative of your target population and reduces the margin of error.
2. Improve Sample Design
You can reduce your sampling error by improving your sample design and accounting for the different sub-populations within your target population. For example, if a specific demographic makes up 40% of your target population, then you should ensure that 40% of your sample group’s population is also made up of this demographic.
This can be done by using a type of probability sampling known as stratified random sampling. In this method of sampling, a population is first divided into homogeneous sub-groups known as strata before simple random sampling is used to select elements from each stratum. This ensures that the sample group has a similar composition to that of the target population, and is, therefore, more representative of it.
3. Study your Target Population
Before you select a sample, it is integral that you have a thorough understanding of your target population and its demographic mix. Study your target population well so that you can clearly and accurately outline who makes up your target population so that this subpopulation can be targeted effectively.
To gain a more comprehensive understanding of sampling error, watch this video by Elon University’s Political Science Professor Kenneth Fernandez where he defines sampling error and how to reduce it:
https://www.youtube.com/watch?v=uGuWrPFStdg
Conclusion;
Sampling error is the arch nemesis of a research. It ruins the credibility of your research outcomes and leads to wasted effort. Thankfully, there are many ways to control and prevent these sampling error as mentioned in the article.
Stay cautious of these types of sampling errors to avoid them from sneaking into your research.
Wondering what will be the cost of conducting survey research using Voxco?
FAQs on Sampling Error
Sampling error occurs when the sample group employed in a study is not representative of the entire target population.
Let’s consider the following example of sampling error;
you want to conduct a study about kid’s shoes. Although children use these shoes and have an influence on the purchasing decision, their parents are ultimately the ones who make the final purchase. In such cases, it’s hard to discern whose opinions matter more and therefore who must be surveyed. This can cause a common kind of sampling error known as a population specification error.
Sampling error is generally caused by the following market research errors:
- Sample frame error
- Selection error
- Population specification error
- Non-response error
- Sampling errors
Some of the most common sampling errors are sample frame errors, selection errors, population specification errors, and non-response errors.

Predictive Analytics
June 2, 2021 No Comments
Predictive Analytics Voxco is trusted by 450+ Global Brands in 40+ countries See what question types are possible with a sample survey! Try a Sample
Read More »
All About Financial Analytics Software
April 14, 2022 No Comments
Financial Analytics: Definition, Significance, Advantages, Disadvantages, Utilization by Business SHARE THE ARTICLE ON Share on facebook Share on twitter Share on linkedin Table of Contents
Read More »
Suppose we are interested in the value of a population parameter, the true value of which is $$theta $$ but is unknown. The knowledge about $$theta $$ can be obtained either from sample data or from population data. In both cases, there is a possibility of not reaching the true value of the parameter. The difference between the calculated value (from the sample data or from population data) and the true value of the parameter is called an error.
Thus, error is something which cannot be determined accurately if the population is large and the units of the population are to be measured. Suppose we are interested in finding the total production of wheat in Pakistan in a certain year. Sufficient funds and time are at our disposal and we want to get the ‘true’ figure of the production of wheat. The maximum we can do is contact all the farmers, and suppose all the farmers cooperate completely and supply the information as honestly as possible. But the information supplied by the farmers will have errors in most cases, so we may not be able to identify the ‘true’ figure. In spite of all efforts, we shall be in the dark.
The calculated or observed figure may be good for all practical purposes but we can never claim that a true value of the parameter has been obtained. If the study of the units is based on counting,we can possibly get the true figure of the population parameter. There are two kinds of errors, (i) sampling errors or random errors and (ii) non-sampling errors.
Sampling Errors
Sampling errors occur due to the nature of sampling. The sample selected from the population is one of all possible samples. Any value calculated from the sample is based on the sample data and is called a sample statistic. The sample statistic may or may not be close to the population parameter. If the statistic is $$widehat theta $$ and the true value of the population parameter is $$theta $$, then the difference $$widehat theta – theta $$ is called the sampling error. It is important to note that a statistic is a random variable and it may take any value.
A particular example of sampling error is the difference between the sample mean $$overline X $$ and the population mean $$mu $$. Thus sampling error is also a random term. The population parameter is usually not known; therefore the sampling error is estimated from the sample data. The sampling error is due to the fact that a certain part of the population is incorporated in the sample. Obviously, one part of the population cannot give the true picture of the properties of the population. But one should not get the impression that a sample always gives a result which is full of errors. We can design a sample and collect sample data in a manner so that sampling errors are reduced. Sampling errors can be reduced by the following methods: (1) by increasing the size of the sample (2) by stratification.
Reducing Sampling Errors
-
Increasing the size of the sample: The sampling error can be reduced by increasing the sample size. If the sample size n is equal to the population size $$N$$, then the sampling error is zero.
-
Stratification: When the population contains homogeneous units, a simple random sample is likely to be representative of the population. But if the population contains dissimilar units, a simple random sample may fail to be representative of all kinds of units in the population. To improve the result of the sample, the sample design is modified. The population is divided into different groups containing similar units, and these groups are called strata. From each group (stratum), a sub-sample is selected in a random manner. Thus all groups are represented in the sample and the sampling error is reduced. This method is called stratified-random sampling. The size of the sub-sample from each stratum is frequently in proportion to the size of the stratum.
Suppose a population consists of 1000 students, out of which 600 are intelligent and 400 are unintelligent. We are assuming here that we do have much information about the population. A stratified sample of size $$n = $$100 is to be selected. The size of the stratum is denoted by $${N_1}$$ and $${N_2}$$ respectively, and the size of the samples from each stratum may be denoted by $${n_1}$$ and $${n_2}$$. It is written as:
|
Stratum # |
Size of stratum |
Size of sample from each stratum |
|
1 |
$${N_1} = 600$$ |
$${n_1} = frac{{n times {N_1}}}{N} = frac{{100 times 600}}{{1000}} = 60$$ |
|
2 |
$${N_2} = 400$$ |
$${n_2} = frac{{n times {N_2}}}{N} = frac{{100 times 400}}{{1000}} = 40$$ |
|
$${N_1} + {N_2} = N = 1000$$ |
$${n_1} + {n_2} = n = 100$$ |
The size of the sample from each stratum has been calculated according to the size of the stratum. This is called proportional allocation. In the above sample design, the sampling fraction in the population is $$frac{n}{N} = frac{{100}}{{1000}} = frac{1}{{10}}$$ and the sampling fraction in both the strata is also $$frac{1}{{10}}$$. Thus this design is also called a fixed sampling fraction. This modified sample & sign is frequently used in sample surveys. But this design requires some prior information about the units of the population, and the population is divided into different strata based on this information. If the prior information is not available then the stratification is not applicable.
When data is randomly sampled from a population, the randomness with which observations are selected from the population ensures that the value of statistics computed by analyzing the sample will differ to some extent from the values computed if analyzing the entire population. Differences between the sample values and the population values are known as sampling error.
When computing a statistic using a sample, it is often possible to compute the likely extent of sampling error. This makes it possible to make conclusions about the extent to which statistics computed from a sample will reflect the truth about the world.
The amount of sampling error is determined by four things. These are the sample size, the sampling method, the inherent variability in the population, and the population size.
Worked example
Stack Overflow, a popular online question-and-answer forum for software developers, recently conducted a survey that found that about 10% of people on their site were female. How much sampling error is attached to such an estimate? To understand the extent of sampling error, we will start by investigating the amount of sampling error we might expect if:
- We assume that it is true that 10% of people who use Stack Overflow are women.
- We have a sample of ten people.
If we randomly select ten people and 10% of people are female, this means that each of the people we choose will have a 10% chance of being female (this is a heroic assumption, due to factors discussed later in this article and also to non-sampling error, but it greatly simplifies the explanation of sampling error).
So, the chance of ten out of ten people in our sample being female is 0.1*0.1*0.1*0.1*0.1*0.1*0.1*0.1*0.1*0.1 = 0.00000001%. That is, there is essentially no chance that if in truth 10% of Stack Overflow users were women, that we would observe this as being 100% in a survey of 10 people.
By contrast, the probability of there being no women in our sample is 0.9*0.9*0.9*0.9*0.9*0.9*0.9*0.9*0.9*0.9 = 34.9%, where 0.9 is the probability that a man is selected at random, where this is 1 minus the probability of being a woman.
With a bit more math we can compute the chart below, which shows the probability that in our sample of ten people we would get 0% women, 10% women, etc.

What we really want to know is the true value in the population. Is it 10%, 5%, or 20%? Without talking to everybody we cannot know for sure, but we can make some inferences. We can see from the chart that if the true figure is 10% (which is what was assumed when creating the chart), there is a 34.9% chance of observing 0% women, 38.7% chance of observing 10% women, and 19.4% chance of observing 20% (2 or fewer) women. If we add these up, we can say if the true value is 10%, there is 93% chance that we would observe either 0%, 10%, or 20% – and virtually no chance of observing a sample of more than 40% female.
The next chart shows the calculations again, this time for 100 people. This chart tells us that if it was true that 10% of Stack Overflow visitors were female, then we could be confident of observing a value in a sample of 100 between 0% and 20%.

The actual Stack Overflow survey question about gender was answered by 35,990 people. Using the same math again, we can be extremely confident that if the truth is that 10% of all people on Stack Overflow are women, sampling error will mean that we observe a value between 9.4% and 10.5%. “Extremely confident” here means that there is a 99.9% probability that we would observe a value between 9.4% and 10.5%. Here, 9.4% and 10.5% are called the 99.9% confidence interval.
The role of sample size
As has been illustrated above, the bigger the sample size, the smaller the sampling error. The sampling error increases in proportion to the square root of the sample size. For example, when sample size is increased from 10 to 100, the sampling error halves, all else being equal.
The sampling method
In the calculations above, it was implicitly assumed that the samples were selected randomly (i.e., a simple random sample). With other types of samples, the math works differently. For example, with cluster sampling, the degree of sampling error is larger.
The inherent variability in the population
The example above investigated the sampling error for a proportion (i.e., a percentage). When investigating the sampling error for a mean (i.e., the average), we need to factor into the calculation the inherent variability in the population. The more variability, the greater the sampling error. For example, just as people vary more in their weights than their heights, the sampling error for weights is bigger than for heights.
The population size
The calculations above implicitly assumed an infinite population size. This assumption is rarely correct. If we modify the math to take into account the population size, the math gets more complicated. We see that the smaller the population, the smaller the sampling error. However, this effect is negligible unless the sample size is greater than 10% of the population size, so the effect of sample size can be safely ignored in most analyses.
Need to know more market research terminology? Brush up with our «What is» guides.
Statistical errors that arise when a sample does not represent the whole population
What are Sampling Errors?
Sampling errors are statistical errors that arise when a sample does not represent the whole population. They are the difference between the real values of the population and the values derived by using samples from the population.

Sampling errors occur when numerical parameters of an entire population are derived from a sample of the entire population. Since the whole population is not included in the sample, the parameters derived from the sample differ from those of the actual population.
They may create distortions in the results, leading users to draw incorrect conclusions. When analysts do not select samples that represent the entire population, the sampling errors are significant.
Summary
- Sampling errors occur when numerical parameters of an entire population are derived from samples of the entire population.
- The difference between the values derived from the sample of a population and the true values of the population parameters is considered a sampling error.
- The errors can be eliminated by increasing the sample size or the number of samples.
Sampling Errors Explained
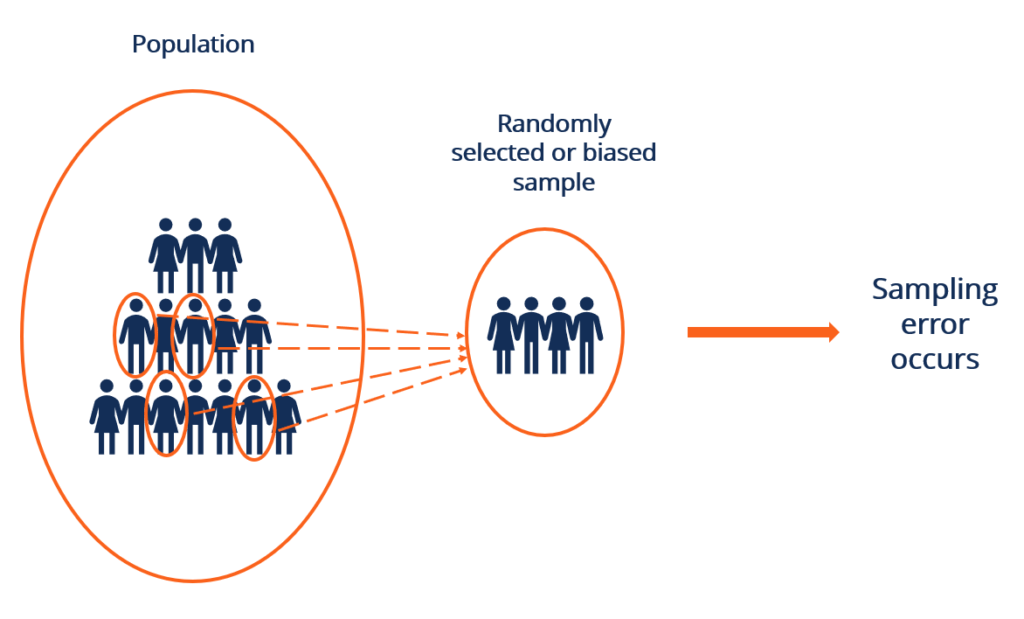
Sampling errors are deviations in the sampled values from the values of the true population emanating from the fact that a sample is not an actual representative of a population of data.
Since there is a fault in the data collection, the results obtained from sampling become invalid. Furthermore, when a sample is selected randomly, or the selection is based on bias, it fails to denote the whole population, and sampling errors will certainly occur.
They can be prevented if the analysts select subsets or samples of data to represent the whole population effectively. Sampling errors are affected by factors such as the size and design of the sample, population variability, and sampling fraction.
Increasing the size of samples can eliminate sampling errors. However, to reduce them by half, the sample size needs to be increased by four times. If the selected samples are small and do not adequately represent the whole data, the analysts can select a greater number of samples for satisfactory representation.
The population variability causes variations in the estimates derived from different samples, leading to larger errors. The effect of population variability can be reduced by increasing the size of the samples so that these can more effectively represent the population.
Moreover, sampling errors must be considered when publishing survey results so that the accuracy of the estimates and the related interpretations can be established.
Practical Example
Suppose the producers of Company XYZ want to determine the viewership of a local program that airs twice a week. The producers will need to determine the samples that can represent various types of viewers. They may need to consider factors like age, level of education, and gender.
For example, people between the ages of 14 and 18 usually have fewer commitments, and most of them can spare time to watch the program twice weekly. On the contrary, people between the age of 18 and 35 usually have tighter schedules and will not have time to watch TV.
Hence, it is important to draw a sample proportionately. Otherwise, the results will not represent the real population.
Since the exact population parameter is not known, sampling errors for samples are generally unknown. However, analysts can use analytical methods to measure the amount of variation caused by sampling errors.
Categories of Sampling Errors
- Population Specification Error – Happens when the analysts do not understand who to survey. For example, for a survey of breakfast cereals, the population can be the mother, children, or the entire family.
- Selection Error – Occurs when the respondents’ survey participation is self-selected, implying only those who are interested respond. Selection errors can be reduced by encouraging participation.
- Sample Frame Error – Occurs when a sample is selected from the wrong population data.
- Non-Response Error – Occurs when a useful response is not obtained from the surveys. It may happen due to the inability to contact potential respondents or their refusal to respond.
More Resources
Thank you for reading CFI’s guide to Sampling Errors. To keep advancing your career, the additional resources below will be useful:
- Free Introduction to Statistics Course
- Statistical Significance
- Non-Sampling Error
- Sample Selection Bias
- Standard Error
- See all data science resources