Sampling Error Formula (Table of Contents)
- Formula
- Examples
- Calculator
What is the Sampling Error Formula?
The term “Sampling Error” refers to the estimation error due to variance between the statistical characteristic of a population and a sample, which is the subset of the same population. In other words, it is the measure of the inaccuracy of the sample’s statistical characteristics from that of the population since the sample doesn’t include all members of the population. The higher value of sampling error indicates that the sample statistics are less representative of the actual population parameters. The formula for sampling error can be derived based on the confidence level of the estimation, sample size, population size and proportion of the population who are expected to respond in a certain way. Mathematically, it is represented as,
Formula
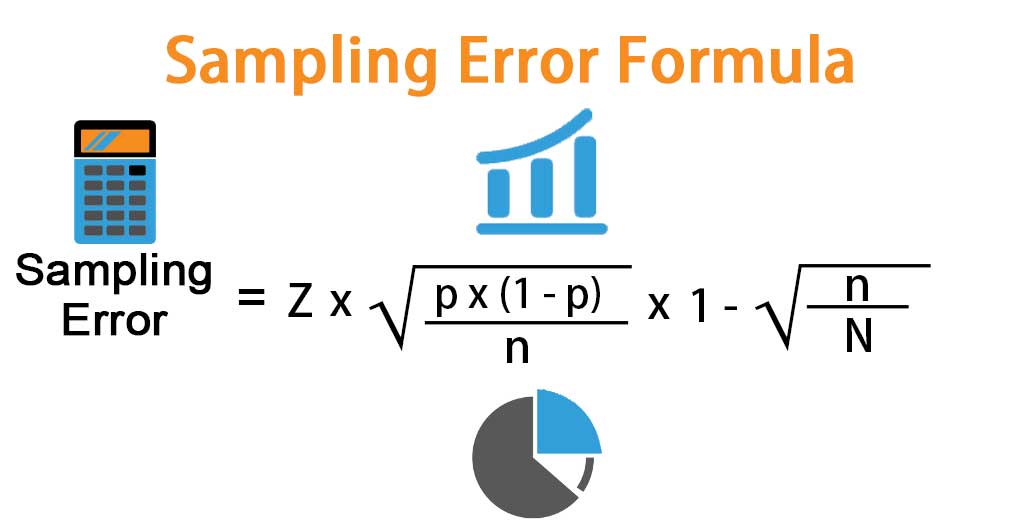
Sampling Error = Z * √(p * (1 – p) / n] * [1 – √(n / N))
Where,
- Z: Z-Score for the Confidence Level Selected.
- n: Sample Size.
- N: Population Size.
- p: Proportion or Percentage of people surveyed who are Expected to respond in a certain way.
Example of Sampling Error Formula (With Excel Template)
Let’s take an example to understand the calculation of Sampling Error in a better manner.
You can download this Sampling Error Formula Excel Template here – Sampling Error Formula Excel Template
Sampling Error Formula – Example #1
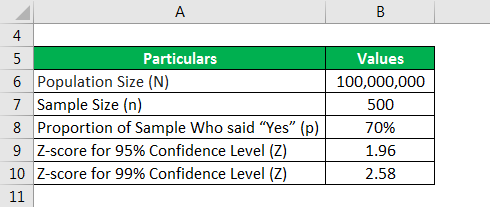
Let us take the example of a sample of 500 people from an entire population of 100 million who were surveyed whether or not they like Vanilla ice creams. 70% of the sample responded positively, saying that they like Vanilla ice creams. Calculate the sampling error for a 95% Confidence Level and 99% Confidence Level.
Solution:
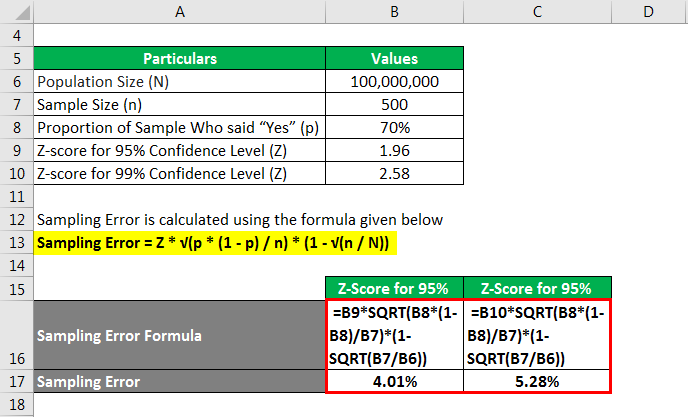
Sampling Error is calculated using the formula given below
Sampling Error = Z * √(p * (1 – p) / n) * (1 – √(n /N))
z-score at 95%
- Sampling Error = 1.96 * √[70% * (1 – 70%) / 500] * [1 – √(500 / 100000000)]
- Sampling Error = 4.01%
Therefore, the sampling error for the sample at 95% confidence level is 4.01%.
z-score at 99%
- Sampling Error = 2.58 * √[70% * (1 – 70%) / 500] * [1 – √(500 / 100000000)]
- Sampling Error = 5.28%
Therefore, the sample’s sampling error at a 99% confidence level has gone up to 5.28%.
Therefore, it can be observed that the sampling error of any sample increases with the increase in confidence level.
Sampling Error Formula – Example #2
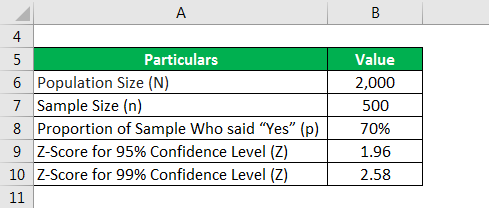
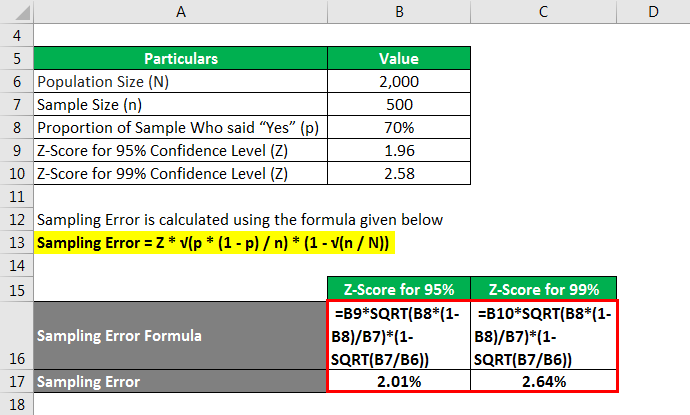
Now, again let us take the example of the above example and keep everything the same except the population size, which is to be assumed to be significantly lower in this case, say 2,000. Calculate the sampling error for a 95% confidence level and a 99% confidence level.
Solution:
Sampling Error is calculated using the formula given below
Sampling Error = Z * √(p * (1 – p) / n) * (1 – √(n /N))
z-score at 95%
- Sampling Error = 1.96 * √[70% * (1 – 70%) / 500] * [1 – √(500 / 2000)]
- Sampling Error = 2.01%
Therefore, the sampling error for the sample at 95% confidence level is 2.01%.
z-score at 99%
- Sampling Error = 2.58 * √[70% * (1 – 70%) / 500] * [1 – √(500 / 2000)]
- Sampling Error = 2.64%
Therefore, the sampling error for the sample at a 99% confidence level is 2.64%.
Therefore, it can be seen that the sampling error decreases with a decrease in population size. So, samples are a better representative of the smaller data population.
Explanation
The formula for Sampling Error analysis can be computed by using the following steps:
Step 1: Firstly, decide on the confidence level to be used for the estimation. Based on the selected confidence level, the z-score can be determined that is denoted by “Z”. For instance, the z-score for a 95% confidence level is 1.96.
Step 2: Next, determine the sample size for the estimation. It is the proportion of the population that is expected to represent the entire population, i.e. its sample characteristics will mostly be similar to that of the entire population. It is denoted by “n”.
Step 3: Next, determine the size of the entire population that is denoted by “N”.
Step 4: Next, determine the proportion of the people surveyed who are likely to respond either in a positive way or say “yes” as an answer to the survey question. It is expressed in percentage and denoted by “p”. So, (1 – p) denotes the percentage of the people with the alternate response.
Step 5: Final, the formula for sampling error can be derived based on the confidence level of the estimation (step 1), sample size (step 2), population size (step 3) and proportion of the population with a set response (step 4) as shown below.
Sampling Error = Z * √(p * (1 – p) / n) * (1 – √(n /N))
Relevance and Use of Sampling Error Formula
It is very important to understand the concept of sampling error as it indicates the inaccuracy of the sample survey. A higher value of sampling error means that the survey may not be the true reflection of the population. On the other hand, a smaller value is desirable as it indicates that the sample parameters are close to that of the total population.
Sampling Error Formula Calculator
You can use the following Sampling Error Formula Calculator
| Sampling Error = | Z * √[p * (1 — p) / n] * [1 — √(n/N)] | |
| 0 * √[0 * (1 — 0) / 0] * [1 — √(0/0)] = | 0 |
Recommended Articles
This is a guide to Sampling Error Formula. Here we discuss how to calculate the Sampling Error along with practical examples. We also provide a Sampling Error calculator with a downloadable excel template. You may also look at the following articles to learn more –
- Calculation in Sample Standard Deviation Formula
- How to Calculate Margin of Error?
- Example of Percent Error Formula
- Calculator of Sample Size Formula
What Is a Sampling Error?
A sampling error is a statistical error that occurs when an analyst does not select a sample that represents the entire population of data. As a result, the results found in the sample do not represent the results that would be obtained from the entire population.
Sampling is an analysis performed by selecting a number of observations from a larger population. The method of selection can produce both sampling errors and non-sampling errors.
Key Takeaways
- A sampling error occurs when the sample used in the study is not representative of the whole population.
- Sampling is an analysis performed by selecting a number of observations from a larger population.
- Even randomized samples will have some degree of sampling error because a sample is only an approximation of the population from which it is drawn.
- The prevalence of sampling errors can be reduced by increasing the sample size.
- In general, sampling errors can be placed into four categories: population-specific error, selection error, sample frame error, or non-response error.
Understanding Sampling Errors
A sampling error is a deviation in the sampled value versus the true population value. Sampling errors occur because the sample is not representative of the population or is biased in some way. Even randomized samples will have some degree of sampling error because a sample is only an approximation of the population from which it is drawn.
Calculating Sampling Error
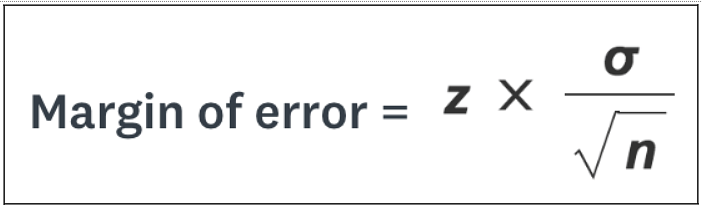
The sampling error formula is used to calculate the overall sampling error in statistical analysis. The sampling error is calculated by dividing the standard deviation of the population by the square root of the size of the sample, and then multiplying the resultant with the Z-score value, which is based on the confidence interval.
Sampling Error
=
Z
×
σ
n
where:
Z
=
Z
score value based on the
confidence interval (approx
=
1.96
)
σ
=
Population standard deviation
n
=
Size of the sample
begin{aligned}&text{Sampling Error}=Ztimesfrac{sigma}{sqrt{n}}\&textbf{where:}\&Z=Ztext{ score value based on the}\&qquad text{confidence interval (approx}=1.96)\&sigma=text{Population standard deviation}\&n=text{Size of the sample}end{aligned}
Sampling Error=Z×nσwhere:Z=Z score value based on the confidence interval (approx=1.96)σ=Population standard deviationn=Size of the sample
Types of Sampling Errors
There are different categories of sampling errors.
Population-Specific Error
A population-specific error occurs when a researcher doesn’t understand who to survey.
Selection Error
Selection error occurs when the survey is self-selected, or when only those participants who are interested in the survey respond to the questions. Researchers can attempt to overcome selection error by finding ways to encourage participation.
Sample Frame Error
A sample frame error occurs when a sample is selected from the wrong population data.
Non-response Error
A non-response error occurs when a useful response is not obtained from the surveys because researchers were unable to contact potential respondents (or potential respondents refused to respond).
Eliminating Sampling Errors
The prevalence of sampling errors can be reduced by increasing the sample size. As the sample size increases, the sample gets closer to the actual population, which decreases the potential for deviations from the actual population. Consider that the average of a sample of 10 varies more than the average of a sample of 100. Steps can also be taken to ensure that the sample adequately represents the entire population.
Researchers might attempt to reduce sampling errors by replicating their study. This could be accomplished by taking the same measurements repeatedly, using more than one subject or multiple groups, or by undertaking multiple studies.
Random sampling is an additional way to minimize the occurrence of sampling errors. Random sampling establishes a systematic approach to selecting a sample. For example, rather than choosing participants to be interviewed haphazardly, a researcher might choose those whose names appear first, 10th, 20th, 30th, 40th, and so on, on the list.
Examples of Sampling Errors
Assume that XYZ Company provides a subscription-based service that allows consumers to pay a monthly fee to stream videos and other types of programming via an Internet connection.
The firm wants to survey homeowners who watch at least 10 hours of programming via the Internet per week and that pay for an existing video streaming service. XYZ wants to determine what percentage of the population is interested in a lower-priced subscription service. If XYZ does not think carefully about the sampling process, several types of sampling errors may occur.
A population specification error would occur if XYZ Company does not understand the specific types of consumers who should be included in the sample. For example, if XYZ creates a population of people between the ages of 15 and 25 years old, many of those consumers do not make the purchasing decision about a video streaming service because they may not work full-time. On the other hand, if XYZ put together a sample of working adults who make purchase decisions, the consumers in this group may not watch 10 hours of video programming each week.
Selection error also causes distortions in the results of a sample. A common example is a survey that only relies on a small portion of people who immediately respond. If XYZ makes an effort to follow up with consumers who don’t initially respond, the results of the survey may change. Furthermore, if XYZ excludes consumers who don’t respond right away, the sample results may not reflect the preferences of the entire population.
Sampling Error vs. Non-sampling Error
There are different types of errors that can occur when gathering statistical data. Sampling errors are the seemingly random differences between the characteristics of a sample population and those of the general population. Sampling errors arise because sample sizes are inevitably limited. (It is impossible to sample an entire population in a survey or a census.)
A sampling error can result even when no mistakes of any kind are made; sampling errors occur because no sample will ever perfectly match the data in the universe from which the sample is taken.
Company XYZ will also want to avoid non-sampling errors. Non-sampling errors are errors that result during data collection and cause the data to differ from the true values. Non-sampling errors are caused by human error, such as a mistake made in the survey process.
If one group of consumers only watches five hours of video programming a week and is included in the survey, that decision is a non-sampling error. Asking questions that are biased is another type of error.
What Is Sampling Error vs. Sampling Bias?
In statistics, sampling means selecting the group that you will actually collect data from in your research.
Sampling bias is the expectation, which is known in advance, that a sample won’t be representative of the true population. For instance, if the sample ends up having proportionally more women or young people than the overall population.
Sampling errors are statistical errors that arise when a sample does not represent the whole population once analyses have been undertaken.
Why Is Sampling Error Important?
Being aware of the presence of sampling errors is important because it can be an indicator of the level of confidence that can be placed in the results. Sampling error is also important in the context of a discussion about how much research results can vary.
How Do You Find the Sampling Error?
In survey research, sampling errors occur because all samples are representative samples: a smaller group that stands in for the whole of your research population. It’s impossible to survey the entire group of people you’d like to reach.
It’s not usually possible to quantify the degree of sampling error in a study since it’s impossible to collect the relevant data from the entire population you are studying. This is why researchers collect representative samples (and representative samples are the reason why there are sampling errors).
What Is Sampling Error vs. Standard Error?
Sampling error is derived from the standard error (SE) by multiplying it by a Z-score value to produce a confidence interval.
The standard error is computed by dividing the standard deviation by the square root of the sample size.
The Bottom Line
Sampling error occurs when a sample drawn from a population deviates somewhat from that true population. Large sampling errors can lead to incorrect estimates or inferences made about the population based on statistical analysis of that sample.
In general, sampling errors can be placed into four categories: population-specific error, selection error, sample frame error, or non-response error. A population-specific error occurs when the researcher does not understand who they should survey. A selection error occurs when respondents self-select their participation in the study. (This results in only those that are interested in responding, which skews the results.) A sample frame error occurs when the wrong sub-population is used to select a sample. Finally, a non-response error occurs when potential respondents are not successfully contacted or refuse to respond.
-
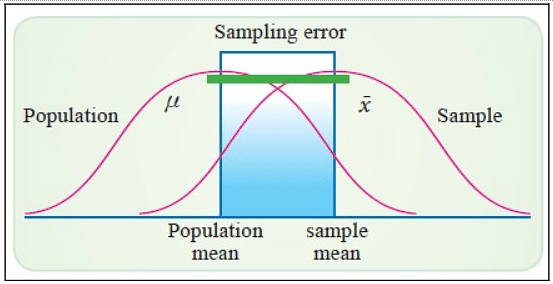
Let’s know what Sampling Error is. When the sample mean is used as a point estimate of the population mean, then we can expect some Error can be expected owing to the fact that a subset, or sample of the population,is used to compute the point estimate.
-
The absolute value of the difference between the sample mean denoted as x̄, and the population mean is denoted by μ, written as |x̄ − μ|, is known as the Sampling Error.
-
Probability statements about the Magnitude of the Sampling Error can be incorporated by Interval estimation.
-
The Sampling distribution of x̄ basically provides the basis for such a statement.
In this article we are going to discuss what is Sampling Error, Sampling and Sampling Error, Sampling Error definition, Sampling Error formula and Sampling Error examples.
Sampling Error Definition
A Sampling Error can be defined as a Statistical Error that occurs when a sample that represents the entire population of data is not selected by an analyst and the results we find in the sample do not represent the actual results that can be obtained from the entire population.
What is Sampling and Sampling Error?
We can define Sampling as an analysis performed by selecting a number of observations generally from a larger population, and this selection produces both Sampling and Non-Sampling Errors.
Key Takeaways
-
Sampling Error can be defined as a Statistical Error that generally occurs when an analyst does not select a sample that represents the entire population of data and selects some part of the data.
-
The results found in the sample do not represent the results which can be obtained from the entire population.
-
This Error can be reduced by randomizing sample selection or by increasing the number of observations.
Sampling Error Meaning:
Let’s know the Sampling Error meaning. It can be defined as a deviation in sampled value versus the true population value due to the fact the sample selected is not representative of the population or biased in any way. Even the randomized samples will have some Sampling Error as it is only an approximation of the population from which it is drawn.
The Role of Sample Size
As has been illustrated above, the bigger is the sample size, the smaller will be the Sampling Error. The Sampling Error increases in proportion to the square root of the sample size that is denoted by n. For example, when we increase the sample size from 10 to 100, the Sampling Error halves, all else being equal.
Formula for Sampling Error
The Formula for Sampling Error refers to the formula that’s utilized in order to calculate statistical Error that happens within the situation where person conducting the test doesn’t select sample that represents the entire population into account and as per the formula Sampling Error is calculated by dividing the quality deviation of the population by the root of the dimensions of sample then multiplying the resultant with the Z score value which is predicated on confidence interval.
Sampling Error = [Ztimes frac{sigma }{sqrt{n}}]
Where,
-
Z score value based on the confidence interval
-
σ denotes the population standard deviation
-
n denotes the sample size
Step by Step Calculation of Sampling and Sampling Error
Step 1) Gather all sets of knowledge called the population. Compute the population means and population variance .
Step 2) Now, one must determine the dimensions of the sample, and further the sample size has got to be but the population and it shouldn’t be greater.
Step 3) Now you need to determine the confidence level and accordingly one can determine the value of the Z score from its table.
Step 4) Now multiply Z score by the population variance and divide an equivalent by the root of the sample size so as to reach a margin of Error or sample size Error.
How can Sampling Error be Corrected?
Here are the steps for minimizing and controlling Sampling Error-
-
You can simply increase the sample size. A larger sample size generally leads to a more precise result because the study gets closer to the actual population size and the results obtained are more accurate.
-
Dividing the population into groups.
-
Important to know your population.
-
Random selection results in the elimination of bias.
-
You can train your team.
-
Performing an external record check.
-
Careful sample designs.
-
Take large enough samples.
Questions to be Solved (Sampling Error Example):
Sampling Error example 1) Suppose that the population standard deviation given is 0.40 and the size of the sample is equal to 2500 then find the Sampling Error at confidence level equal to 95%.
Solution) Let’s list down the data,
σ is equal to 0.40
Sample size (n) = 2500
The value of z at 95% of confidence level is equal to 1.96
Formula of Sampling error = [Ztimes frac{sigma }{sqrt{n}}]
= [frac{0.40}{sqrt{2500}}times 1.96]
= [frac{0.40}{sqrt{50}}times 1.96=0.01568]
Sampling Error example 2 ) Find the Sampling Error of the sample size equal to 100 of the population with a standard deviation equal to 0.5 at 90% confidence level.
Answer)From the given data,
σ is equal to 0.5
Sample size (n) = 100
The value of z at 90% of confidence level is equal to 1.645
Formula of Sampling error = [Ztimes frac{sigma }{sqrt{n}}]
= [frac{0.5}{sqrt{100}}times 1.645]
= [frac{0.5}{sqrt{10}}times 1.645=0.08225].
Note: Z-value at 90% confidence level is equal to 1.64.
Common mistakes to avoid on Sampling Errors
Some common mistakes that should be avoided while solving Sampling Error problems are-
-
Sample Frame Error-Sample Frame Errors happen when the false subpopulation is used to determine a sample. This type of Error rises when there was a mistake in understanding the population and their choices before surveying them. This can take place often when the population’s choices are not studied before handling the surveys and has often resulted in big tragedies.
-
Selection Error-Selection Error happens when the respondent’s sect themselves as the participants in the survey. Selection Errors can be controlled by going to additional lengths to get participation. The survey process includes the processes of initiating pre-survey communication requesting cooperation, actual surveying, and post-survey follow-ups. If no reaction is received, a 2nd survey request follows, and maybe several discussions using different modes such as calls or person-to-person meetups.
-
Population Specification Error- Population Specification Error happens when the investigator does not comprehend who they are. There is no particular or precise population in mind to take the survey. These types of Errors occur because of multiple layers of decision-making in the first place. Here the population can be anyone as there are many generalized populations who participate in the activity.
-
Non-Response- Non-response Errors happen when the respondents are dissimilar to those who do not respond. This may happen because the potential respondent was not contacted. This case can also happen if the respondent refuses to respond. The size of this non-response Error can be prevented through follow-up surveys using different modes. This Error can be minimized with a little extra attention towards managing the respondents.
-
Sampling Errors- Sampling Errors happen due to variations in the number of representatives of the sample that responds to the program. It can be controlled and reduced by using various methods. One of the ways is to carefully choose sample designs. Another solution is to take large samples in the first place. One more thing can be used and that is to use multiple contacts to assure the representative response.
Improve Article
Save Article
Improve Article
Save Article
Sampling error technique is employed to compute the total selection bias in statistical analysis, as the name implies. To refresh your memory, sampling error is a statistical mistake caused by the nature of sampling. The atypical-ness of the observations in the samples collected causes statistical analysis errors.
Because sampling is used to identify the characteristics of a full population, the discrepancy between the sample values and the population is referred to as sampling error. It’s important to remember that calculating the precise value of sampling is impossible because the population value is unknown, yet sampling error may typically be calculated using statistical models of a sample.
Formula
SE = Z x σ/√n
where,
- Z denotes the score value
- σ refers to the population standard deviation
- n is the sample size
Sample Problems
Question 1. Find the sampling error at a 95% confidence level given the standard deviation of the population is 0.23 and the sample size is 2145.
Solution:
Given: Z = 95%, σ = 0.23 and n = 2145
Since, SE = Z x σ/√n
= 1.96 x (0.23/√2145)
= 1.96 x 0.00496608
SE = 0.009733
Question 2. Find the sampling error at a 90% confidence level given the standard deviation of the population is 0.2 and the sample size is 100.
Solution:
Given: Z = 92%, σ = 0.2 and n = 100
Since, SE = Z x σ/√n
= 1.645 x (0.2/√100)
= 1.645 x 0.02
SE = 0.0329
Question 3. Find the sampling error at a 99% confidence level given the standard deviation of the population is 0.2 and the sample size is 36.
Solution:
Given: Z = 99%, σ = 0.2 and n = 100
Since, SE = Z x σ/√n
= 2.58 x (0.2/√36)
= 2.58 x 0.0333
SE = 0.085914
Question 4. Find the sampling error at a 99% confidence level given the standard deviation of the population is 0.9 and the sample size is 49.
Solution:
Given: Z = 99%, σ = 0.9 and n = 49
Since, SE = Z x σ/√n
= 2.58 x (0.9/√49)
= 2.58 x 0.1285
SE = 0.33153
Question 5. Find the sampling error at a 95% confidence level given the standard deviation of the population is 0.3 and the sample size is 81.
Solution:
Given: Z = 95%, σ = 0.3 and n = 81
Since, SE = Z x σ/√n
= 1.96 x (0.3/√81)
= 1.96 x 0.03333
SE = 0.0653268


Senior Content Specialist | Updated On — Dec 28, 2022
Sampling Error means the difference between the sample mean and the population mean. Sampling error represents the uncertainty related to the test statistic as a result of taking an incomplete sample from a population instead of an entire population. Sampling error is also termed sampling variability or insampling variability. Sampling Error describes the variation that might be expected by taking different sets of observations in a study. The larger the sample size, the easier it is to calculate sampling error, but the smaller the impact of sampling error is likely to be. In statistical surveys, we find sampling error is observed when the true value of the population parameter differs from the estimated value. The difference between these two values is called ‘Sampling Error’.
Key Terms: Sampling Error, Sampling, Sample Size, Variation, Mean, Population, Census, Statistical Error, Deviation
Definition of Sampling Error
[Click Here for Sample Questions]
A sampling error means that the results obtained from a sample are different from the actual results that can be obtained from the entire population. This can often occur when an analyst decides not to survey an entire population and instead selects a small sample of subjects. The results that are returned by analyzing this small sample are not necessarily identical to what would be obtained if the entire population were surveyed rather than a sample.
It is important to consider whether there is likely to be any significant impact on the results of your study given its scale and the characteristics of those you are surveying; if not, then there may be little or no benefit in calculating sampling error.
Sampling Error
Read More: Mean and Variance of Random Variable
Role of Sample Size
[Click Here for Sample Questions]
The biggest difference between a sample study and a full census of the population is the size of the statistical error. The smaller your sample, the greater the difference between the result and what it would be if you had asked everyone in the population. With a larger sample, that error gets smaller but only in proportion to the square root of n. For example, doubling your sample size will reduce your sampling error by 40%.
Formula For Sampling Error
[Click Here for Sample Questions]
Calculations of the sampling error is vital while you are drawing the statistical inference from a huge population but cannot afford to test it physically. This is because many organizations, governments, etc. don’t conduct census due to their large population size and depend on a sample of the population for their decision-making process.
Sampling error is the difference between the sample statistic and the parameter of the population. Estimating this error gives you some idea of how close your sample estimate is to the true population value. This formula is easily understandable.
Sampling Error = Z × σ/√n Where
- Z score value based on the confidence interval
- σ denotes the population standard deviation
- n denotes the sample size
Sampling Error Formula
Read More: Difference Between Variance and Standard Deviation
Step By Step Calculation of Sampling Error
[Click Here for Sample Questions]
The sample error is a form of error that occurs in experiments and surveys when the data which is collected doesn’t represent and depict the whole population. For example, it is essential to obtain data from various parts of the country whereas you only focus on one specific region. This mistake can be corrected by accurately determining the representative sample size with knowledge and information while eliminating biases.
- First, the population is defined and the sampling frame is determined. Then a sample size is chosen which should be greater than 10% of the value of the population.
- Next, the precise frequency isn’t important because it is too cumbersome to calculate so one just approximates. Finally, probability sampling techniques are used to obtain a random sample
- The size of a population is referred to as n. Sampling error refers to the differences that exist between sample means and the true population mean.
- When sampling error is small, then this would indicate a closer resemblance between sample means and the true population mean. In order to realize this, we must obtain information through sampling and consequently analyze results by making inferences on those results using statistics.
- Sampling error is a measurement of the individual errors in a sample.
- A high standard deviation is an indicator that the data points are more spread out, and hence indicate less precision.
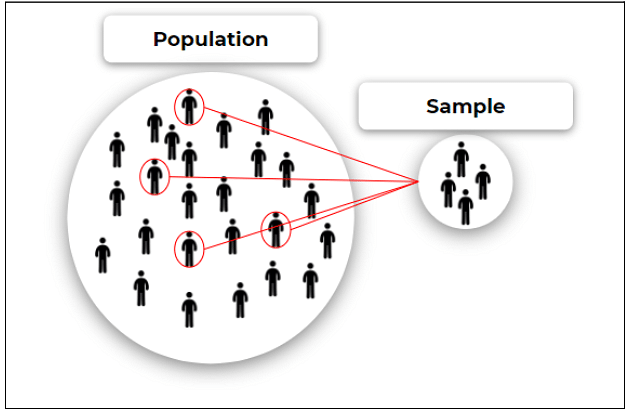
Population and Sample
The amount of sampling error depends on the sampling method used, along with its size. There are four main steps to determining sampling error:
- defining your population,
- selecting a sample size,
- selecting a sampling method
- calculating the margin of error in your sample
Things to Remember
- Sampling error means that a number of the observations or data picked out of a list will vary on where they are chosen, which lead to two types of sampling errors which are an estimation and non-sampling errors.
- In a sample survey, the difference between the sample statistic and the population parameter is known as sampling error. A larger population size reduces the margin of error.
- Calculating sampling error becomes simple when it is taken as the first step towards the calculation of the confidence interval.
- It is done by comparing an estimated value to a chosen theoretical value and describing the error in terms of missing values, known values and estimated values.
- Sampling error is an error that occurs due to the use of unavailable population data in the sample.
- Non-sampling errors happen because of a multitude of factors, including limited resources, such as time and budget, inaccurate data collection procedures, and problems with questionnaires or survey design.
Solved Questions
Ques. Mind Laboratories is a research company that is willing to calculate the sampling error for one of its studies. They had a sample size of 100 people. The standard deviation of the population is given as 0.50. For a 99% confidence level, the score is 2.58. (3 Marks)
Ans. From the given data, σ= 0.50
Sample size (n) = 100
Value of z at confidence level 99% = 2.58
Formula of sampling error = Z × σ/√n
= 0.50 / √100 × 2.58
= 0.50 / 10 × 2.58
= 0.05 × 2.58
= 0.129
Ques. Suppose that the population standard deviation given is 0.40 and the size of the sample is equal to 2500 then find the sampling error at a confidence level equal to 95%. (3 Marks)
Ans. Let’s list down from the given data, σ = 0.40
Sample size (n) = 2500
Value of z at confidence level 95% = 1.96
Formula of sampling error =Z × σ /√n
= 0.40/ √2500 × 1.96
= 0.40 / 50 × 1.96
= 0.008 × 1.96
= 0.01568
Ques. A sample consists of (3 Marks)
(a) All units of the population
(b) 5% units of the population
(c) 10% units of the population
(d) Any fraction of the population
Ans. (d) Any fraction of the population
In Sampling, the population indicates the entire group from which you want to draw conclusions about while the sample refers to the specific group from which one will collect data. One must note that the size of the sample is always less than the total size of the population.
Ques. Sampling is used in the situations(3 Marks)
(a) Blood test of the patients
(b) Cooking rice in a utensil
(c) Purchase of food commodity from the shopkeeper
(d) All the above
Ans. All of the above
The Sampling process is used in order to quantify a system, process, issue, or problem. There are many real-world applications for sampling such as teams for a game are chosen by putting everyone’s name into a jar, employees are assigned a random number using computer software, etc.
Ques. For the N population size in SRSWOR, the number of possible samples of size n is equal to(1 Marks)
(a) Ncn
(b) Nn
(c) (N-n)/N
(d) n/N
Ans. (a) Ncn
Ques. Find the sampling error of the sample size equal to 100 of the population with a standard deviation equal to 0.5 at a 90% confidence level. (3 Marks)
Ans. From the given data, σ= 0.5
Sample size (n) = 100
The value of z at 90% of confidence level = 1.645
Formula of sampling error = Z × σ / √n
0.5/√100 × 1.645
0.5/10 × 1.645
0.08225
Note: Z-value at 90% confidence level is equal to 1.64.
Ques. Suppose that the population standard deviation is 0.30, and the size of the sample is 100. What will the sampling error be at a 95% confidence level? (3 Marks)
Ans. Here we have given the population standard deviation as well as the size of the sample. Therefore, the below formula calculates the same.
Use the following data for the calculation
- Z Factor Value at 95%: 1.96
- Population of Standard Deviation: 0.3
- Sample Size: 100
Thus, the calculation of the sampling error is mentioned below
Formula of sampling error = Z × σ / √n
= 0.3/ √100 × 1.96
= 0.3 / 10 × 1.96
= 0.03 × 1.96
= 0.0588
Ques. What will be the number of possible samples of size 2 out of 5 population size in SRSWOR? (1 Marks)
(a) 10
(b) 4
(c) 2
(d) 12
Ans. 10
Ques. Give one example for sample, population and variable each. (3 Marks)
Ans. A study was conducted to know the average weight of students of class seventh in Delhi. There were a total of 2860 students in class seventh. From this, 200 students were randomly selected and their weight was recorded.
In this example
- Here, the population indicates the the number of students of class seventh in Delhi, the total number of which is equal to 2860.
- The sample is the 200 students selected whose weight was recorded.
- The weight of the students is the Variable that is under study.
Ques. For the N population size in SRSWR, the number of possible samples of size n is equal to ( 1 Marks)
(a) Ncn
(b)Nn
(c) (N-n)/N
(d) n/N
Ans. Nn
Ques. What is meant by simple random sampling? (3 Marks)
Ans. The random sampling method is considered to be the simplest of the methods of probability sampling. Here, an equal probability of selection is given to all the available unit of the population at the first and then to each subsequent draw. Thus, here in this case, the number of units in the population is N, so, the probability of selection of any unit at the first draw is 1/N and at the second draw is 1/N-1 etc, which are ultimately equal to 1/N.
Also Read:
CBSE CLASS XII Related Questions
1.
2, b, c are in A.P. and the range of determinant $begin{vmatrix}1&1&1\ 2&b&c\ 4&b^{2}&c^{2}end{vmatrix}$ is [2, 16]. Then find range of c is
1.
2, b, c are in A.P. and the range of determinant $begin{vmatrix}1&1&1\ 2&b&c\ 4&b^{2}&c^{2}end{vmatrix}$ is [2, 16]. Then find range of c is
- CBSE CLASS XII
- Mathematics
- applications of determinants
2.
A committee of 11 members is to be formed from 8 males and 5 females. Let m denotes the number of ways of selecting committee having atleast 6 males and n denotes the number of ways of selecting atleast 3 females then
2.
A committee of 11 members is to be formed from 8 males and 5 females. Let m denotes the number of ways of selecting committee having atleast 6 males and n denotes the number of ways of selecting atleast 3 females then
- CBSE CLASS XII
- Mathematics
- Permutations