Систематическая погрешность (или, на физическом жаргоне, систематика) характеризует неточность измерительного инструмента или метода обработки данных. Если точнее, то она показывает наше ограниченное знание этой неточности: ведь если инструмент «врет», но мы хорошо знаем, насколько именно, то мы сможем скорректировать его показания и устранить инструментальную неопределенность результата. Слово «систематическая» означает, что вы можете повторять какое-то измерение на этой установке миллионы раз, но если у нее «сбит прицел», то вы систематически будете получать значение, отличающееся от истинного.
Конечно, систематические погрешности хочется взять под контроль. Поскольку это чисто инструментальный эффект, ответственность за это целиком лежит на экспериментаторах, собиравших, настраивавших и работающих на этой установке. Они прилагают все усилия для того, чтобы, во-первых, корректно определить эти погрешности, а во-вторых, их минимизировать. Собственно, они этим начинают заниматься с самых первых дней работы установки, даже когда еще собственно научная программа исследований и не началась.
Возможные источники систематических погрешностей
Современный коллайдерный эксперимент очень сложен. В нём есть место огромному количеству источников систематических погрешностей на самых разных стадиях получения экспериментального результата. Вот некоторые из них.
Погрешности могут возникать на уровне «железа», при получении сырых данных:
- дефектные или неработающие отдельные регистрирующие компоненты или считывающие элементы. В детекторе миллионы отдельных компонентов, и даже если 1% из них оказался дефектным, это может ухудшить «зоркость» детектора и четкость регистрации сигналов. Надо подчеркнуть, что, даже если при запуске детектор работает на все 100%, постоянное детектирование частиц (это же жесткая радиация!) с течением времени выводит из строя отдельные компоненты, так что следить за поведением детектора абсолютно необходимо;
- наличие «слепых зон» детектора; например, если частица вылетает близко к оси пучков, то она улетит в трубу и детектор ее просто не заметит.
Погрешности могут возникать на этапе распознавания сырых данных и их превращение в физическое событие:
- погрешность при измерении энергии частиц в калориметре;
- погрешность при измерении траектории частиц в трековых детекторах, из-за которой неточно измеряется точка вылета и импульс частицы;
- неправильная идентификация типа частицы (например, система неудачно распознала след от π-мезона и приняла его за K-мезон). Более тонкий вариант: неправильное объединение адронов в одну адронную струю и неправильная оценка ее энергии;
- неправильный подсчет числа частиц (две частицы случайно вылетели так близко друг к другу, что детектор «увидел» только один след и посчитал их за одну).
Наконец, новые систематические погрешности добавляются на этапе позднего анализа события:
- неточность в измерении светимости пучков, которая влияет на пересчет числа событий в сечение процесса;
- наличие посторонних процессов рождения частиц, которые отличаются с физической точки зрения, но, к сожалению, выглядят для детектора одинаковыми. Такие процессы порождают неустранимый фон, который часто мешает разглядеть искомый эффект;
- необходимость моделировать процессы (в особенности, адронизацию, превращение кварков в адроны), опираясь частично на теорию, частично на прошлые эксперименты. Несовершенство того и другого привносит неточности и в новый экспериментальный результат. По этой причине теоретическую погрешность тоже часто относят к систематике.
В отдельных случаях встречаются источники систематических погрешностей, которые умудряются попасть сразу во все категории, они совмещают в себе и свойства детекторного «железа», и методы обработки и интерпретации данных. Например, если вы хотите сравнить друг с другом количество рожденных частиц и античастиц какого-то сорта (например, мюонов и антимюонов), то вам не стоит забывать, что ваш детектор состоит из вещества, а не из антивещества! Этот «перекос» в сторону вещества может привести к тому, что детектор будет видеть мюонов меньше, чем антимюонов, подробности см. в заметке Немножко про CP-нарушение, или Как жаль, что у нас нет детекторов из антивещества!.
Всю эту прорву источников потенциальных проблем надо распознать и оценить их влияние на выполняемый анализ. Здесь никаких абсолютно универсальных алгоритмов нет; исследователь должен сам понять, на какие погрешности надо обращать внимание и как грамотно их оценить. Конечно, тут на помощь приходят разные калибровочные измерения, выполненные в первые год-два работы детектора, и программы моделирования, которые позволяют виртуально протестировать поведение детектора в тех или иных условиях. Но главным в этом искусстве всё же является физическое чутье экспериментатора, его квалификация и накопленный опыт.
Почему важна грамотная оценка систематики
Беспечная оценка систематических погрешностей может привести к двум крайностям, причем обе очень нежелательны.
Заниженная погрешность — то есть неоправданная уверенность экспериментатора в том, что погрешности в его детекторе маленькие, хотя они на самом деле намного больше, — исключительно опасна, поскольку она может привести к совершенно неправильным научным выводам. Например, экспериментатор может на их основании решить, что измерения отличаются от теоретических предсказаний на уровне статистической значимости 10 стандартных отклонений (сенсация!), хотя истинная причина расхождения может просто состоять в том, что он проглядел источник ошибок, в 10 раз увеличивающий неопределенность измерения, и никакого расхождения на самом деле нет.
В борьбе с этой опасностью есть соблазн впасть в другую крайность: «А вдруг там есть еще какие-то погрешности? Может, я что-то не учел? Давай-ка я на всякий случай увеличу погрешности измерения в 10 раз для пущей безопасности.» Такая крайность плоха тем, что она обессмысливает измерение. Неоправданно завышая погрешность, вы рискуете получить результат, который будет, конечно, правильным, но очень неопределенным, ничем не лучше тех результатов, которые уже были получены до вас на гораздо более скромных установках. Такой подход, фактически, перечеркивает всю работу по разработке технологий, по изготовлению компонентов, по сборке детектора, все затраты на его работу и на анализ результатов.
Грамотный и ответственный анализ систематики должен удерживать оптимальный баланс (максимальная достоверность при максимальной научной ценности), не допуская таких крайностей. Это очень тонкая и сложная работа, и первые страницы в большинстве современных экспериментальных статей по физике частиц посвящены тщательному обсуждению систематических (а также статистических) погрешностей.
Мы не будем обсуждать подробности того, как обсчитывать систематические погрешности. Подчеркнем только, что это серьезная наука с множеством тонкостей и подводных камней. В качестве примера умеренно простого обсуждения некоторых вопросов см. статью Systematic Errors: facts and fictions.
При прямых измеренияхзначение
измеряемой величины отсчитывается
непосредственно по шкале измерительного
прибора. Ошибка в отсчете может достигать
нескольких десятых долей деления шкалы.
Обычно при таких измерениях величину
систематической погрешности считают
равной половине цены деления шкалы
измерительного прибора. Например, при
измерении штангенциркулем с ценой
деления 0,05 мм величина приборной
погрешности измерения принимают равной
0,025 мм.
Цифровые измерительные приборы дают
значение измеряемых ими величин с
погрешностью, равной значению одной
единицы последнего разряда на шкале
прибора. Так, если цифровой вольтметр
показывает значение20,45 мВ, то абсолютная
погрешность при измерении равна
![]() мВ.
мВ.
Систематические погрешности возникают
и при использовании постоянных величин,
определяемых из таблиц. В подобных
случаях погрешность принимается равной
половине последнего значащего разряда.
Например, если в таблице значение
плотности стали дается величиной, равной
7,9∙103кг/м3, то абсолютная
погрешность в этом случае равна![]() кг/м3.
кг/м3.
Некоторые особенности в расчете приборных
погрешностей электроизмерительных
приборов будут рассмотрены ниже.
При определении систематической
(приборной) погрешности косвенных
измеренийфункциональной величины![]() используется
используется
формула
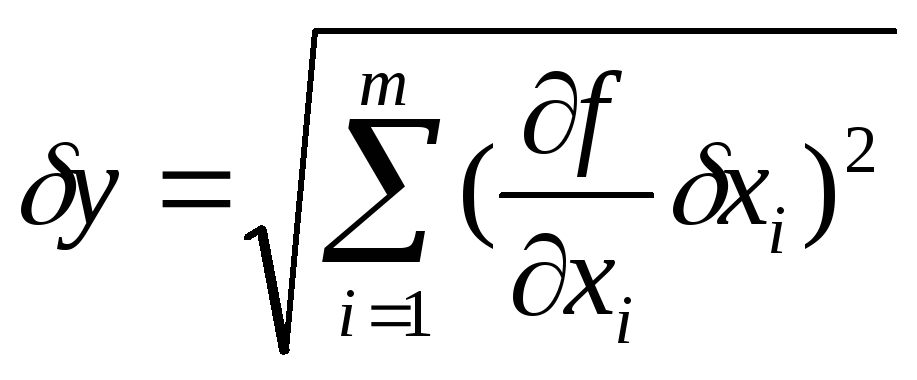 ,
,
(1)
где
![]() — приборные ошибки прямых измерений
— приборные ошибки прямых измерений
величины![]() ,
,![]() —
—
частные производные функции по переменной![]() .
.
В качестве примера, получим формулу для
расчета систематической погрешности
при измерении объема цилиндра. Формула
вычисления объема цилиндра имеет вид
![]() .
.
Частные производные по переменным d
и hбудут равны
![]() ,
,![]()
![]() .
.
Таким образом, формула для определения
абсолютной систематической погрешности
при измерении объема цилиндра в
соответствии с (2. ..) имеет следующий вид
![]() ,
,
где
![]() и
и![]() приборные
приборные
ошибки при измерении диаметра и высоты
цилиндра
3. Оценка случайной погрешности. Доверительный интервал и доверительная вероятность
Д

Рис. 1
ля подавляющего большинства простых
измерений достаточно хорошо выполняется
так называемый нормальный закон случайных
погрешностей (закон Гаусса), выведенный
из следующих эмпирических положений.
-
погрешности измерений могут принимать
непрерывный ряд значений; -
при большом числе измерений погрешности
одинаковой величины, но разного знака
встречаются одинаково часто, -
чем больше величина случайной погрешности,
тем меньше вероятность ее появления.
График нормального закона распределения
Гаусса представлен на рис.1. Уравнение
кривой имеет вид
![]()
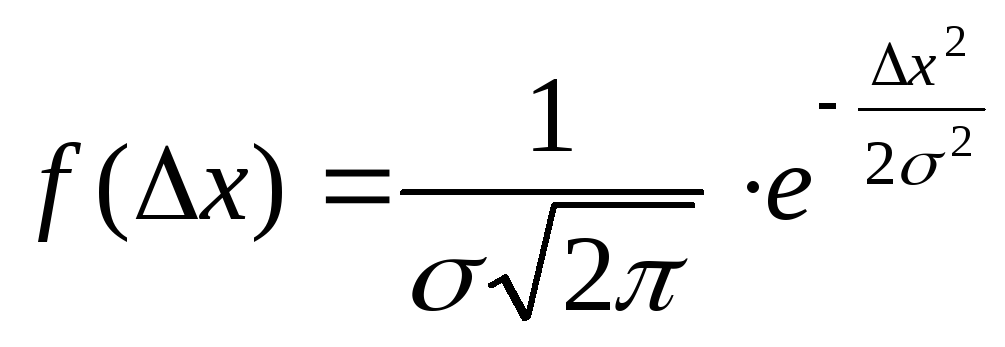 ,
,
(2)
где
![]() — функция распределения случайных ошибок
— функция распределения случайных ошибок
(погрешностей), характеризующая
вероятность появления ошибки![]()
![]() ,σ– средняя
,σ– средняя
квадратичная ошибка.
Величина σне
является случайной величиной и
характеризует процесс измерений. Если
условия измерений не изменяются, то σ
остается постоянной величиной. Квадрат
этой величины называютдисперсией
измерений.Чем меньше дисперсия, тем
меньше разброс отдельных значений и
тем выше точность измерений.
Точное значение средней квадратичной
ошибки σ, как
и истинное значение измеряемой величины,
неизвестно. Существует так называемая
статистическая оценка этого параметра,
в соответствии с которой средняя
квадратичная ошибка равняется средней
квадратичной ошибке среднего
арифметического![]() .
.
Величина которой определяется по формуле
 ,
,
(3)
где
![]() — результатi-го
— результатi-го
измерения;![]() —
—
среднее арифметическое полученных
значений;n – число
измерений.
Чем больше число измерений, тем меньше
![]() и тем больше оно приближается кσ.
и тем больше оно приближается кσ.
Если истинное значение измеряемой
величины μ, ее среднее арифметическое
значение, полученное в результате
измерений ![]() ,
,
а случайная абсолютная погрешность![]() ,
,
то результат измерений запишется в виде![]() .
.
Интервал значений от
![]() до
до![]() ,
,
в который попадает истинное значение
измеряемой величины μ, называетсядоверительным интервалом.Поскольку![]() является случайной величиной, то истинное
является случайной величиной, то истинное
значение попадает в доверительный
интервал с вероятностью α, которая
называетсядоверительной вероятностью,илинадежностью измерений. Эта
величина численно равна площади
заштрихованной криволинейной трапеции.
(см. рис.)
Все это справедливо для достаточно
большого числа измерений, когда
![]() близка к σ. Для отыскания доверительного
близка к σ. Для отыскания доверительного
интервала и доверительной вероятности
при небольшом числе измерений, с которым
мы имеем дело в ходе выполнения
лабораторных работ, используетсяраспределение вероятностей Стьюдента.
Это распределение вероятностей
случайной величины![]() ,
,
называемойкоэффициентом Стьюдента,
дает значение доверительного интервала![]() в долях средней квадратичной ошибки
в долях средней квадратичной ошибки
среднего арифметического![]() .
.
![]() .
.
(4)
Распределение вероятностей этой величины
не зависит от σ2, а существенно
зависит от числа опытовn.С увеличением числа опытовnраспределение
Стьюдента стремится к распределению
Гаусса.
Функция распределения табулирована
(табл.1). Значение коэффициента Стьюдента
находится на пересечении строки,
соответствующей числу измерений n,
и столбца, соответствующего доверительной
вероятности α
Таблица 1.
|
n |
α |
n |
α |
||||||
|
0,8 |
0,9 |
0,95 |
0,98 |
0,8 |
0,9 |
0,95 |
0,98 |
||
|
3 |
1,9 |
2,9 |
4,3 |
7,0 |
6 |
1,5 |
2,0 |
2,6 |
3,4 |
|
4 |
1,6 |
2,4 |
3,2 |
4,5 |
7 |
1,4 |
1,9 |
2,4 |
3,1 |
|
5 |
1,5 |
2,1 |
2,8 |
3,7 |
8 |
1,4 |
1,9 |
2,4 |
3,9 |
Пользуясь данными таблицы, можно:
-
определить доверительный интервал,
задаваясь определенной вероятностью; -
выбрать доверительный интервал и
определить доверительную вероятность.
При косвенных измерениях среднюю
квадратичную ошибку среднего
арифметического значения функции
![]() вычисляют по формуле
вычисляют по формуле
![]() .
.
(5)
Доверительный интервал и доверительная
вероятность определяются так же, как и
в случае прямых измерений.
Оценка суммарной погрешности измерений.
Запись окончательного результата.
Суммарную погрешность результата
измерений величины Х будем определять
как среднее квадратичное значение
систематической и случайной погрешностей
![]() ,
,
(6)
где δх – приборная погрешность, Δх
– случайная погрешность.
В качестве Х может быть как непосредственно,
так и косвенно измеряемая величина.
Окончательный результат измерений
рекомендуется представлять в следующем
виде
![]() ,
,
α=…, Е=…(7)
Следует иметь в виду, что сами формулы
теории ошибок справедливы для большого
число измерений. Поэтому значение
случайной, а следовательно, и суммарной
погрешности определяется при малом nс большой ошибкой. При вычислении Δхпри числе измерений![]() рекомендуется
рекомендуется
ограничиваться одной значащей цифрой,
если она больше 3 и двумя, если первая
значащая цифра меньше 3. Например, если
Δх= 0,042, то отбрасываем 2 и пишем
Δх=0,04, а если Δх=0,123, то пишем
Δх=0,12.
Число разрядов результата и суммарной
погрешности должно быть одинаковым.
Поэтому среднее арифметическое
погрешности должно быть одинаковым.
Поэтому среднее арифметическое
вычисляется вначале на один разряд
больше, чем измерение, а при записи
результата его значение уточняется до
числа разрядов суммарной ошибки.
Соседние файлы в предмете [НЕСОРТИРОВАННОЕ]
- #
- #
- #
- #
- #
- #
- #
- #
- #
- #
- #
From Wikipedia, the free encyclopedia
«Systematic bias» redirects here. For the sociological and organizational phenomenon, see Systemic bias.
Observational error (or measurement error) is the difference between a measured value of a quantity and its true value.[1] In statistics, an error is not necessarily a «mistake». Variability is an inherent part of the results of measurements and of the measurement process.
Measurement errors can be divided into two components: random and systematic.[2]
Random errors are errors in measurement that lead to measurable values being inconsistent when repeated measurements of a constant attribute or quantity are taken. Systematic errors are errors that are not determined by chance but are introduced by repeatable processes inherent to the system.[3] Systematic error may also refer to an error with a non-zero mean, the effect of which is not reduced when observations are averaged.[citation needed]
Measurement errors can be summarized in terms of accuracy and precision.
Measurement error should not be confused with measurement uncertainty.
Science and experiments[edit]
When either randomness or uncertainty modeled by probability theory is attributed to such errors, they are «errors» in the sense in which that term is used in statistics; see errors and residuals in statistics.
Every time we repeat a measurement with a sensitive instrument, we obtain slightly different results. The common statistical model used is that the error has two additive parts:
- Systematic error which always occurs, with the same value, when we use the instrument in the same way and in the same case.
- Random error which may vary from observation to another.
Systematic error is sometimes called statistical bias. It may often be reduced with standardized procedures. Part of the learning process in the various sciences is learning how to use standard instruments and protocols so as to minimize systematic error.
Random error (or random variation) is due to factors that cannot or will not be controlled. One possible reason to forgo controlling for these random errors is that it may be too expensive to control them each time the experiment is conducted or the measurements are made. Other reasons may be that whatever we are trying to measure is changing in time (see dynamic models), or is fundamentally probabilistic (as is the case in quantum mechanics — see Measurement in quantum mechanics). Random error often occurs when instruments are pushed to the extremes of their operating limits. For example, it is common for digital balances to exhibit random error in their least significant digit. Three measurements of a single object might read something like 0.9111g, 0.9110g, and 0.9112g.
Characterization[edit]
Measurement errors can be divided into two components: random error and systematic error.[2]
Random error is always present in a measurement. It is caused by inherently unpredictable fluctuations in the readings of a measurement apparatus or in the experimenter’s interpretation of the instrumental reading. Random errors show up as different results for ostensibly the same repeated measurement. They can be estimated by comparing multiple measurements and reduced by averaging multiple measurements.
Systematic error is predictable and typically constant or proportional to the true value. If the cause of the systematic error can be identified, then it usually can be eliminated. Systematic errors are caused by imperfect calibration of measurement instruments or imperfect methods of observation, or interference of the environment with the measurement process, and always affect the results of an experiment in a predictable direction. Incorrect zeroing of an instrument leading to a zero error is an example of systematic error in instrumentation.
The Performance Test Standard PTC 19.1-2005 “Test Uncertainty”, published by the American Society of Mechanical Engineers (ASME), discusses systematic and random errors in considerable detail. In fact, it conceptualizes its basic uncertainty categories in these terms.
Random error can be caused by unpredictable fluctuations in the readings of a measurement apparatus, or in the experimenter’s interpretation of the instrumental reading; these fluctuations may be in part due to interference of the environment with the measurement process. The concept of random error is closely related to the concept of precision. The higher the precision of a measurement instrument, the smaller the variability (standard deviation) of the fluctuations in its readings.
Sources[edit]
Sources of systematic error[edit]
Imperfect calibration[edit]
Sources of systematic error may be imperfect calibration of measurement instruments (zero error), changes in the environment which interfere with the measurement process and sometimes imperfect methods of observation can be either zero error or percentage error. If you consider an experimenter taking a reading of the time period of a pendulum swinging past a fiducial marker: If their stop-watch or timer starts with 1 second on the clock then all of their results will be off by 1 second (zero error). If the experimenter repeats this experiment twenty times (starting at 1 second each time), then there will be a percentage error in the calculated average of their results; the final result will be slightly larger than the true period.
Distance measured by radar will be systematically overestimated if the slight slowing down of the waves in air is not accounted for. Incorrect zeroing of an instrument leading to a zero error is an example of systematic error in instrumentation.
Systematic errors may also be present in the result of an estimate based upon a mathematical model or physical law. For instance, the estimated oscillation frequency of a pendulum will be systematically in error if slight movement of the support is not accounted for.
Quantity[edit]
Systematic errors can be either constant, or related (e.g. proportional or a percentage) to the actual value of the measured quantity, or even to the value of a different quantity (the reading of a ruler can be affected by environmental temperature). When it is constant, it is simply due to incorrect zeroing of the instrument. When it is not constant, it can change its sign. For instance, if a thermometer is affected by a proportional systematic error equal to 2% of the actual temperature, and the actual temperature is 200°, 0°, or −100°, the measured temperature will be 204° (systematic error = +4°), 0° (null systematic error) or −102° (systematic error = −2°), respectively. Thus the temperature will be overestimated when it will be above zero and underestimated when it will be below zero.
Drift[edit]
Systematic errors which change during an experiment (drift) are easier to detect. Measurements indicate trends with time rather than varying randomly about a mean. Drift is evident if a measurement of a constant quantity is repeated several times and the measurements drift one way during the experiment. If the next measurement is higher than the previous measurement as may occur if an instrument becomes warmer during the experiment then the measured quantity is variable and it is possible to detect a drift by checking the zero reading during the experiment as well as at the start of the experiment (indeed, the zero reading is a measurement of a constant quantity). If the zero reading is consistently above or below zero, a systematic error is present. If this cannot be eliminated, potentially by resetting the instrument immediately before the experiment then it needs to be allowed by subtracting its (possibly time-varying) value from the readings, and by taking it into account while assessing the accuracy of the measurement.
If no pattern in a series of repeated measurements is evident, the presence of fixed systematic errors can only be found if the measurements are checked, either by measuring a known quantity or by comparing the readings with readings made using a different apparatus, known to be more accurate. For example, if you think of the timing of a pendulum using an accurate stopwatch several times you are given readings randomly distributed about the mean. Hopings systematic error is present if the stopwatch is checked against the ‘speaking clock’ of the telephone system and found to be running slow or fast. Clearly, the pendulum timings need to be corrected according to how fast or slow the stopwatch was found to be running.
Measuring instruments such as ammeters and voltmeters need to be checked periodically against known standards.
Systematic errors can also be detected by measuring already known quantities. For example, a spectrometer fitted with a diffraction grating may be checked by using it to measure the wavelength of the D-lines of the sodium electromagnetic spectrum which are at 600 nm and 589.6 nm. The measurements may be used to determine the number of lines per millimetre of the diffraction grating, which can then be used to measure the wavelength of any other spectral line.
Constant systematic errors are very difficult to deal with as their effects are only observable if they can be removed. Such errors cannot be removed by repeating measurements or averaging large numbers of results. A common method to remove systematic error is through calibration of the measurement instrument.
Sources of random error[edit]
The random or stochastic error in a measurement is the error that is random from one measurement to the next. Stochastic errors tend to be normally distributed when the stochastic error is the sum of many independent random errors because of the central limit theorem. Stochastic errors added to a regression equation account for the variation in Y that cannot be explained by the included Xs.
Surveys[edit]
The term «observational error» is also sometimes used to refer to response errors and some other types of non-sampling error.[1] In survey-type situations, these errors can be mistakes in the collection of data, including both the incorrect recording of a response and the correct recording of a respondent’s inaccurate response. These sources of non-sampling error are discussed in Salant and Dillman (1994) and Bland and Altman (1996).[4][5]
These errors can be random or systematic. Random errors are caused by unintended mistakes by respondents, interviewers and/or coders. Systematic error can occur if there is a systematic reaction of the respondents to the method used to formulate the survey question. Thus, the exact formulation of a survey question is crucial, since it affects the level of measurement error.[6] Different tools are available for the researchers to help them decide about this exact formulation of their questions, for instance estimating the quality of a question using MTMM experiments. This information about the quality can also be used in order to correct for measurement error.[7][8]
Effect on regression analysis[edit]
If the dependent variable in a regression is measured with error, regression analysis and associated hypothesis testing are unaffected, except that the R2 will be lower than it would be with perfect measurement.
However, if one or more independent variables is measured with error, then the regression coefficients and standard hypothesis tests are invalid.[9]: p. 187 This is known as attenuation bias.[10]
See also[edit]
- Bias (statistics)
- Cognitive bias
- Correction for measurement error (for Pearson correlations)
- Errors and residuals in statistics
- Error
- Replication (statistics)
- Statistical theory
- Metrology
- Regression dilution
- Test method
- Propagation of uncertainty
- Instrument error
- Measurement uncertainty
- Errors-in-variables models
- Systemic bias
References[edit]
- ^ a b Dodge, Y. (2003) The Oxford Dictionary of Statistical Terms, OUP. ISBN 978-0-19-920613-1
- ^ a b John Robert Taylor (1999). An Introduction to Error Analysis: The Study of Uncertainties in Physical Measurements. University Science Books. p. 94, §4.1. ISBN 978-0-935702-75-0.
- ^ «Systematic error». Merriam-webster.com. Retrieved 2016-09-10.
- ^ Salant, P.; Dillman, D. A. (1994). How to conduct your survey. New York: John Wiley & Sons. ISBN 0-471-01273-4.
- ^ Bland, J. Martin; Altman, Douglas G. (1996). «Statistics Notes: Measurement Error». BMJ. 313 (7059): 744. doi:10.1136/bmj.313.7059.744. PMC 2352101. PMID 8819450.
- ^ Saris, W. E.; Gallhofer, I. N. (2014). Design, Evaluation and Analysis of Questionnaires for Survey Research (Second ed.). Hoboken: Wiley. ISBN 978-1-118-63461-5.
- ^ DeCastellarnau, A. and Saris, W. E. (2014). A simple procedure to correct for measurement errors in survey research. European Social Survey Education Net (ESS EduNet). Available at: http://essedunet.nsd.uib.no/cms/topics/measurement Archived 2019-09-15 at the Wayback Machine
- ^ Saris, W. E.; Revilla, M. (2015). «Correction for measurement errors in survey research: necessary and possible» (PDF). Social Indicators Research. 127 (3): 1005–1020. doi:10.1007/s11205-015-1002-x. hdl:10230/28341. S2CID 146550566.
- ^ Hayashi, Fumio (2000). Econometrics. Princeton University Press. ISBN 978-0-691-01018-2.
- ^ Angrist, Joshua David; Pischke, Jörn-Steffen (2015). Mastering ‘metrics : the path from cause to effect. Princeton, New Jersey. p. 221. ISBN 978-0-691-15283-7. OCLC 877846199.
The bias generated by this sort of measurement error in regressors is called attenuation bias.
Further reading[edit]
- Cochran, W. G. (1968). «Errors of Measurement in Statistics». Technometrics. 10 (4): 637–666. doi:10.2307/1267450. JSTOR 1267450.
Термин и определение
Систематическая ошибка
Опубликовано:
zaripov_fanis
Предмет:
Теория вероятностей
👍 Проверено Автор24
разность между истинным, но обычно неизвестным, значением измеряемого количества и средним значением наблюдаемой величины, которая оценивалась бы посредством выборочного среднего значения бесконечного множества наблюдений.
Научные статьи на тему «Систематическая ошибка»
1.
Статистические характеристики
Классификация ошибок:
За характером ошибки различают:
случайные ошибки, те которые вызываются любыми…
Случайные ошибки не особо влияют на весь результат;
систематические ошибки, искажают явление только в…
одну из сторон более опасные и, иногда, вызывают действие систематического фактора….
За стадией возникновения:
ошибки при регистрации;
ошибки во время подготовки данных к обработке;
ошибки…
Все специальные ошибки являются систематическими.
Статья от экспертов
![]()
2.
О систематических ошибках повторных измерений
Рассмотрен вопрос обнаружения систематических ошибок путем сравнения результатов оценки точности измерений до уравнивания, по разностям двойных измерений и после уравнивания с использованием доверительного оценивания.
3.
Содержательные выборочные методы определения ожидаемой ошибки в аудите
Методы определения ожидаемой ошибки в аудите
Определение 1
Ожидаемая ошибка выборки — это значение…
ошибки в бухгалтерском учете, которое аудитор еще до начала аудиторской проверки хочет обнаружить в…
совокупностей со случайными и равновозможными ошибками….
Систематические ошибки – это ошибки, которые произошли неслучайно, т.е. ошибки которые появились в связи…
На появление систематических ошибок влияют 2 причины.
Статья от экспертов
![]()
4.
Алгоритм обработки измерений, устойчивый к систематическим ошибкам
Рассматривается задача оценивания характеристик случайного процесса по дискретным измерениям. Полагается, что измерения содержат кусочно-непрерывные помехи, имеющие конечное число разрывов первого рода на всем отрезке наблюдения и описываемые на интервалах непрерывности степенными полиномами со случайными коэффициентами.
Повышай знания с онлайн-тренажером от Автор24!
- 📝 Напиши термин
- ✍️ Выбери определение из предложенных или загрузи свое
-
🤝 Тренажер от Автор24 поможет тебе выучить термины, с помощью удобных и приятных
карточек
Систематические погрешности при повторных измерениях остаются постоянными или изменяются по определенному закону.
Когда судят о погрешности, подразумевают не значение, а интервал значений, в котором с заданной вероятностью находится истинное значение. Поэтому говорят об оценке погрешности. Если бы погрешность оказалась измеренной, т.е. стали бы известны её знак и значение, то её можно было бы исключить из действительного значения измеряемой физической величины и получить истинное значение.
Для получения результатов, минимально отличающихся от истинного значения измеряемой физической величины, проводят многократные наблюдения и проводят математическую обработку полученного массива с целью определения и минимизации случайной составляющей погрешности.
Минимизация систематической погрешности в процессе наблюдений выполняется следующими методами: метод замещения (состоит в замещении измеряемой величины мерой), метод противопоставления (состоит в двух поочерёдных измерениях при замене местами меры и измеряемого объекта), метод компенсации погрешности по знаку (состоит в двух поочерёдных измерениях, при которых влияющая величина становится противоположной).
При многократных наблюдениях возможно апостериорное (после выполнения наблюдений) исключение систематической погрешности в результате анализа рядов наблюдений. Рассмотрим графический анализ. При этом результаты последовательных наблюдений представляются функцией времени либо ранжируются в порядке возрастания погрешности.
Рассмотрим временную зависимость. Будем проводить наблюдения через одинаковые интервалы времени. Результаты последовательных наблюдений являются случайной функцией времени. В серии экспериментов, состоящих из ряда последовательных наблюдений, получаем одну реализацию этой функции. При повторении серии получаем новую реализацию, отличающуюся от первой.
Реализации отличаются преимущественно из-за влияния факторов, определяющих случайную погрешность, а факторы, определяющие систематическую погрешность, одинаково проявляются для соответствующих моментов времени в каждой реализации. Значение, соответствующее каждому моменту времени, называется сечением случайной функции времени. Для каждого сечения можно найти среднее по всем реализациям значение. Очевидно, что эта составляющая и определяет систематическую погрешность. Если через значения систематической погрешности для всех моментов времени провести плавную кривую, то она будет характеризовать временную закономерность изменения погрешности. Зная закономерность изменения, можем определить поправку для исключения систематической погрешности. После исключения систематической погрешности получаем «исправленный ряд результатов наблюдений».
Известен ряд способов исключения систематических погрешностей, которые условно можно разделить па 4 основные группы:
- устранение источников погрешностей до начала измерений;
- исключение почетностей в процессе измерения способами замещения, компенсации погрешностей по знаку, противопоставления, симметричных наблюдений;
- внесение известных поправок в результат измерения (исключение погрешностей начислением);
- оценка границ систематических погрешностей, если их нельзя исключить.
По характеру проявления систематические погрешности подразделяют на постоянные, прогрессивные и периодические.
Постоянные систематические погрешности сохраняют свое значение в течение всего времени измерений (например, погрешность в градуировке шкалы прибора переносится на все результаты измерений).
Прогрессивные погрешности – погрешности, которые в процессе измерении подрастают или убывают (например, погрешности, возникающие вследствие износа контактирующих деталей средств измерения).
И группу систематических погрешностей можно отнести: инструментальные погрешности; погрешности из-за неправильной установки измерительного устройства; погрешности, возникающие вследствие внешних влияний; погрешности метода измерения (теоретические погрешности); субъективные погрешности.