The standard error of the mean is a way to measure how spread out values are in a dataset. It is calculated as:
Standard error of the mean = s / √n
where:
- s: sample standard deviation
- n: sample size
This tutorial explains two methods you can use to calculate the standard error of the mean for a dataset in Python. Note that both methods produce the exact same results.
Method 1: Use SciPy
The first way to calculate the standard error of the mean is to use the sem() function from the SciPy Stats library.
The following code shows how to use this function:
from scipy.stats import sem

#define dataset
data = [3, 4, 4, 5, 7, 8, 12, 14, 14, 15, 17, 19, 22, 24, 24, 24, 25, 28, 28, 29]

#calculate standard error of the mean
sem(data)

2.001447
The standard error of the mean turns out to be 2.001447.
Method 2: Use NumPy
Another way to calculate the standard error of the mean for a dataset is to use the std() function from NumPy.
Note that we must specify ddof=1 in the argument for this function to calculate the sample standard deviation as opposed to the population standard deviation.
The following code shows how to do so:
import numpy as np

#define dataset
data = np.array([3, 4, 4, 5, 7, 8, 12, 14, 14, 15, 17, 19, 22, 24, 24, 24, 25, 28, 28, 29])

#calculate standard error of the mean
np.std(data, ddof=1) / np.sqrt(np.size(data))

2.001447
Once again, the standard error of the mean turns out to be 2.001447.
How to Interpret the Standard Error of the Mean
The standard error of the mean is simply a measure of how spread out values are around the mean. There are two things to keep in mind when interpreting the standard error of the mean:
1. The larger the standard error of the mean, the more spread out values are around the mean in a dataset.
To illustrate this, consider if we change the last value in the previous dataset to a much larger number:
from scipy.stats import sem

#define dataset
data = [3, 4, 4, 5, 7, 8, 12, 14, 14, 15, 17, 19, 22, 24, 24, 24, 25, 28, 28, 150]

#calculate standard error of the mean
sem(data)

6.978265
Notice how the standard error jumps from 2.001447 to 6.978265. This is an indication that the values in this dataset are more spread out around the mean compared to the previous dataset.
2. As the sample size increases, the standard error of the mean tends to decrease.
To illustrate this, consider the standard error of the mean for the following two datasets:
from scipy.stats import sem

#define first dataset and find SEM
data1 = [1, 2, 3, 4, 5]
sem(data1)

0.7071068

#define second dataset and find SEM
data2 = [1, 2, 3, 4, 5, 1, 2, 3, 4, 5]
sem(data2)

0.4714045
The second dataset is simply the first dataset repeated twice. Thus, the two datasets have the same mean but the second dataset has a larger sample size so it has a smaller standard error.
Additional Resources
How to Calculate the Standard Error of the Mean in R
How to Calculate the Standard Error of the Mean in Excel
How to Calculate Standard Error of the Mean in Google Sheets
- numpy.std(a, axis=None, dtype=None, out=None, ddof=0, keepdims=<no value>, *, where=<no value>)[source]#
-
Compute the standard deviation along the specified axis.
Returns the standard deviation, a measure of the spread of a distribution,
of the array elements. The standard deviation is computed for the
flattened array by default, otherwise over the specified axis.- Parameters:
-
- aarray_like
-
Calculate the standard deviation of these values.
- axisNone or int or tuple of ints, optional
-
Axis or axes along which the standard deviation is computed. The
default is to compute the standard deviation of the flattened array.New in version 1.7.0.
If this is a tuple of ints, a standard deviation is performed over
multiple axes, instead of a single axis or all the axes as before. - dtypedtype, optional
-
Type to use in computing the standard deviation. For arrays of
integer type the default is float64, for arrays of float types it is
the same as the array type. - outndarray, optional
-
Alternative output array in which to place the result. It must have
the same shape as the expected output but the type (of the calculated
values) will be cast if necessary. - ddofint, optional
-
Means Delta Degrees of Freedom. The divisor used in calculations
isN - ddof, whereNrepresents the number of elements.
By default ddof is zero. - keepdimsbool, optional
-
If this is set to True, the axes which are reduced are left
in the result as dimensions with size one. With this option,
the result will broadcast correctly against the input array.If the default value is passed, then keepdims will not be
passed through to thestdmethod of sub-classes of
ndarray, however any non-default value will be. If the
sub-class’ method does not implement keepdims any
exceptions will be raised. - wherearray_like of bool, optional
-
Elements to include in the standard deviation.
Seereducefor details.New in version 1.20.0.
- Returns:
-
- standard_deviationndarray, see dtype parameter above.
-
If out is None, return a new array containing the standard deviation,
otherwise return a reference to the output array.
Notes
The standard deviation is the square root of the average of the squared
deviations from the mean, i.e.,std = sqrt(mean(x)), where
x = abs(a - a.mean())**2.The average squared deviation is typically calculated as
x.sum() / N,
whereN = len(x). If, however, ddof is specified, the divisor
N - ddofis used instead. In standard statistical practice,ddof=1
provides an unbiased estimator of the variance of the infinite population.
ddof=0provides a maximum likelihood estimate of the variance for
normally distributed variables. The standard deviation computed in this
function is the square root of the estimated variance, so even with
ddof=1, it will not be an unbiased estimate of the standard deviation
per se.Note that, for complex numbers,
stdtakes the absolute
value before squaring, so that the result is always real and nonnegative.For floating-point input, the std is computed using the same
precision the input has. Depending on the input data, this can cause
the results to be inaccurate, especially for float32 (see example below).
Specifying a higher-accuracy accumulator using thedtypekeyword can
alleviate this issue.Examples
>>> a = np.array([[1, 2], [3, 4]])
>>> np.std(a)
1.1180339887498949 # may vary
>>> np.std(a, axis=0)
array([1.,  1.])
>>> np.std(a, axis=1)
array([0.5,  0.5])
In single precision, std() can be inaccurate:
>>> a = np.zeros((2, 512*512), dtype=np.float32)
>>> a[0, :] = 1.0
>>> a[1, :] = 0.1
>>> np.std(a)
0.45000005
Computing the standard deviation in float64 is more accurate:
>>> np.std(a, dtype=np.float64)
0.44999999925494177 # may vary
Specifying a where argument:
>>> a = np.array([[14, 8, 11, 10], [7, 9, 10, 11], [10, 15, 5, 10]])
>>> np.std(a)
2.614064523559687 # may vary
>>> np.std(a, where=[[True], [True], [False]])
2.0
Стандартная ошибка среднего — это способ измерить, насколько разбросаны значения в наборе данных. Он рассчитывается как:
Стандартная ошибка среднего = s / √n
куда:
- s : стандартное отклонение выборки
- n : размер выборки
В этом руководстве объясняются два метода, которые вы можете использовать для вычисления стандартной ошибки среднего значения для набора данных в Python. Обратите внимание, что оба метода дают одинаковые результаты.
Способ 1: используйте SciPy
Первый способ вычислить стандартную ошибку среднего — использовать функцию sem() из библиотеки SciPy Stats.
Следующий код показывает, как использовать эту функцию:
from scipy. stats import sem

#define dataset
data = [3, 4, 4, 5, 7, 8, 12, 14, 14, 15, 17, 19, 22, 24, 24, 24, 25, 28, 28, 29]

#calculate standard error of the mean
sem(data)

2.001447
Стандартная ошибка среднего оказывается равной 2,001447 .
Способ 2: использовать NumPy
Другой способ вычислить стандартную ошибку среднего для набора данных — использовать функцию std() из NumPy.
Обратите внимание, что мы должны указать ddof=1 в аргументе этой функции, чтобы вычислить стандартное отклонение выборки, а не стандартное отклонение генеральной совокупности.
Следующий код показывает, как это сделать:
import numpy as np

#define dataset
data = np.array([3, 4, 4, 5, 7, 8, 12, 14, 14, 15, 17, 19, 22, 24, 24, 24, 25, 28, 28, 29])

#calculate standard error of the mean
np.std(data, ddof= 1 ) / np.sqrt (np.size (data))

2.001447
И снова стандартная ошибка среднего оказывается равной 2,001447 .
Как интерпретировать стандартную ошибку среднего
Стандартная ошибка среднего — это просто мера того, насколько разбросаны значения вокруг среднего. При интерпретации стандартной ошибки среднего следует помнить о двух вещах:
1. Чем больше стандартная ошибка среднего, тем более разбросаны значения вокруг среднего в наборе данных.
Чтобы проиллюстрировать это, рассмотрим, изменим ли мы последнее значение в предыдущем наборе данных на гораздо большее число:
from scipy. stats import sem

#define dataset
data = [3, 4, 4, 5, 7, 8, 12, 14, 14, 15, 17, 19, 22, 24, 24, 24, 25, 28, 28, 150 ]

#calculate standard error of the mean
sem(data)

6.978265
Обратите внимание на скачок стандартной ошибки с 2,001447 до 6,978265.Это указывает на то, что значения в этом наборе данных более разбросаны вокруг среднего значения по сравнению с предыдущим набором данных.
2. По мере увеличения размера выборки стандартная ошибка среднего имеет тенденцию к уменьшению.
Чтобы проиллюстрировать это, рассмотрим стандартную ошибку среднего для следующих двух наборов данных:
from scipy.stats import sem

#define first dataset and find SEM
data1 = [1, 2, 3, 4, 5]
sem(data1)

0.7071068

#define second dataset and find SEM
data2 = [1, 2, 3, 4, 5, 1, 2, 3, 4, 5]
sem(data2)

0.4714045
Второй набор данных — это просто первый набор данных, повторенный дважды. Таким образом, два набора данных имеют одинаковое среднее значение, но второй набор данных имеет больший размер выборки, поэтому стандартная ошибка меньше.
Дополнительные ресурсы
Как рассчитать стандартную ошибку среднего в R
Как рассчитать стандартную ошибку среднего в Excel
Как рассчитать стандартную ошибку среднего в Google Sheets
The Standard Error of the Mean (SEM) describes how far a sample mean varies from the actual population mean.
It is used to estimate the approximate confidence intervals for the mean.
In this tutorial, we will discuss two methods you can use to calculate the Standard Error of the Mean in python with step-by-step examples.
The Standard error of the mean for a sample is calculated using below formula:
Standard error of the mean (SEM) = s / √n
where:
s : sample standard deviation
n : sample size
Method 1: Use Numpy
We will be using the numpy available in python, it provides std() function to calculate the standard error of the mean.
If you don’t have numpy package installed, use the below command on windows command prompt for numpy library installation.
pip install numpy
Example 1: How to calculate SEM in Python
Let’s understand, how to calculate the standard error of mean (SEM) with the given below python code.
#import modules
import numpy as np

#define dataset
data = np.array([4,7,3,9,12,8,14,10,12,12])

#calculate standard error of the mean
result = np.std(data, ddof=1) / np.sqrt(np.size(data))

#Print the result
print("The Standard error of the mean : %.3f"%result)
In the above code, we import numpy library to define the dataset.
Using std() function we calculated the standard error of the mean.
Note that we must specify ddof=1 in the argument for std() function to calculate the sample standard deviation instead of population standard deviation.
The Output of the above code is shown below.
#Output
The Standard error of the mean : 1.149
The Standard error of the mean is 1.149.
Method 2: Use Scipy
We will be using Scipy library available in python, it provides sem() function to calculate the standard error of the mean.
If you don’t have the scipy library installed then use the below command on windows command prompt for scipy library installation.
pip install scipy
Example 2: How to calculate SEM in Python
Lets assume we have dataset as below
data = [4,7,3,9,12,8,14,10,12,12]
Lets calculate the standard error of mean by using below python code.
#import modules
import scipy.stats as stat

#define dataset
data = [4,7,3,9,12,8,14,10,12,12]

#calculate standard error of the mean
result = stat.sem(data)

#Print the result
print("The Standard error of the mean : %.3f"%result)
In the above code, we import numpy library to define the dataset.
Using sem() function we calculated the standard error of the mean.
The Output of the above code is shown below.
#Output
The Standard error of the mean : 1.149
How to Interpret the Standard Error of the Mean
The two important factors to keep in mind while interpreting the SEM are as follows:-
1 Sample Size:- With the increase in sample size, the standard error of mean tends to decrease.
Let’s see this with below example:-
#import modules
import scipy.stats as stat

#define dataset 1
data1 = [4,7,3,9,12,8,14,10,12,12]

#define dataset 2 by repeated the first dataset twice
data2 = [4,7,3,9,12,8,14,10,12,12,4,7,3,9,12,8,14,10,12,12]

#calculate standard error of the mean
result1 = stat.sem(data1)
result2 = stat.sem(data2)

#Print the result
print("The Standard error of the mean for the original dataset: %.3f"%result1)
print("The Standard error of the mean for the repeated dataset : %.3f"%result2)
In the above example, we created the two datasets i.e. data1 & data2 where data2 is just the twice of data1.
The Output of the above code is shown below:-
# Output
The Standard error of the mean for the original dataset: 1.149
The Standard error of the mean for the repeated dataset : 0.791
We seen that for data1 the SEM is 1.149 and for data2 SEM is 0.791.
It clearly shows that with an increase in size the SEM decreases.
Values of data2 are less spread out around the mean as compared to data1, although both have the same mean value.
2 The Value of SEM : The larger value of the SEM indicates that the values are more spread around the mean .
Let’s discuss this with below example:-
#import modules
import scipy.stats as stat

#define dataset 1
data1 = [4,7,3,9,12,8,14,10,12,12]

#define dataset 2 by replace last value with 120
data2 = [4,7,3,9,12,8,14,10,12,120]

#calculate standard error of the mean
result1 = stat.sem(data1)
result2 = stat.sem(data2)

#Print the result
print("The Standard error of the mean for the original dataset: %.3f"%result1)
print("The Standard error of the mean for the repeated dataset : %.3f"%result2)
In the above example, we created the two datasets i.e. data1 & data2 where data2 is created by replacing the last value with 120.
The Output of the above code is shown below:-
#Output
The Standard error of the mean for the original dataset: 1.149
The Standard error of the mean for the repeated dataset : 11.177
We seen that for data1 the SEM is 1.149 and for data2 SEM is 11.177.
It clearly shows that SEM for data2 is larger as compared to data1.
It means the values of data2 are more spread out around the mean as compared to data1.
Conclusion
I hope, you may find how to calculate the Standard Error of the Mean in the python tutorial with a step-by-step illustration of examples educational and helpful.
To calculate the standard error of the mean (SEM) in Python, use scipy library’s sem() function.
For instance, let’s calculate the SEM for a group of numbers:
from scipy.stats import sem

# Create a dataset
data = [19, 2, 12, 3, 100, 2, 3, 2, 111, 82, 4]

# Calculate the standard error of mean
s = sem(data)

print(s)
Output:
13.172598656753378
If you do not have scipy installed, run:
pip install scipy
That was the quick answer. But make sure to read along to learn about the standard error and how to implement the function yourself.
What Is the Standard Error of Mean (SEM)
The standard error of the mean (SEM) is an estimate of the standard deviation.
The SEM is used to measure how close sample means are likely to be to the true population mean. This gives a good indication as to where a given sample actually lies in relation to its corresponding population.
The standard error of the mean follows the following formula:

Where σ is the standard deviation and n is the number of samples.
How to Implement Standard Error of Mean Function in Python
To write a function that calculates the standard error of the mean in Python, you first need to implement a function that calculates the standard deviation of the data.
What Is Standard Deviation
Standard deviation is a measure of how far numbers lie from the average.
For example, if we look at a group of men we find that most of them are between 5’8” and 6’2” tall. Those who lie outside this range make up only a small percentage of the group. The standard deviation identifies the percentage by which the numbers tend to vary from the average.
The standard deviation follows the formula:

Where:
 = sample standard deviation
 = the size of the population
 = each value from the population
 = the sample mean (average)
How to Calculate Standard Deviation in Python
Assuming you do not use a built-in standard deviation function, you need to implement the above formula as a Python function to calculate the standard deviation.
Here is the implementation of standard deviation in Python:
from math import sqrt

def stddev(data):
    N = len(data)
    mu = float(sum(data) / len(data))
    s = [(x_i - mu) ** 2 for x_i in data]

    return sqrt(float(sum(s) / (N - 1)))
The Standard Error of Mean in Python
Now that you have set up a function to calculate the standard deviation, you can write the function that calculates the standard error of the mean.
Here is the code:
def sem(data):
    return stddev(data) / sqrt(len(data))
Now you can use this function.
For example:
data = [19, 2, 12, 3, 100, 2, 3, 2, 111, 82, 4]
sem_data = sem(data)

print(sem_data)
Output:
13.172598656753378
To verify that this really is the SEM, use a built-in SEM function to double-check. Let’s use the one you already saw in the introduction:
from scipy.stats import sem

# Create a dataset
data = [19, 2, 12, 3, 100, 2, 3, 2, 111, 82, 4]

# Calculate the standard error of mean
s = sem(data)

print(s)
As a result, you get the same output as the custom implementation yielded.
13.172598656753378
This completes our example of building the functionality for calculating the standard error of the mean in Python.
Here is the full code used in this example for your convenience:
from math import sqrt

def stddev(data):
    N = len(data)
    mu = float(sum(data) / len(data))
    s = [(x_i - mu) ** 2 for x_i in data]
    return sqrt(float(sum(s) / (N - 1)))

def sem(data):
    return stddev(data) / sqrt(len(data))

data = [19, 2, 12, 3, 100, 2, 3, 2, 111, 82, 4]
sem_data = sem(data)

print(sem_data)
This is the hard way to obtain the standard error of the mean in Python.
Usually, when you have a common problem, you should rely on using existing functionality as much as possible.
Let’s next take a look at the two ways to find the standard error of mean in Python using built-in functionality.
How to Use Existing Functionality to Calculate the Standard Error of Mean in Python
Standard Error of Mean Using Scipy
You have seen this approach already twice in this guide.
The scipy module comes in with a built-in sem() function. This directly calculates the standard mean of error for a given dataset.
For instance:
from scipy.stats import sem

# Create a dataset
data = [19, 2, 12, 3, 100, 2, 3, 2, 111, 82, 4]

# Calculate the standard error of mean
s = sem(data)

print(s)
Output:
13.172598656753378
Standard Error of Mean Using Numpy
You can also use NumPy module to calculate the standard error of the mean in Python.
However, there is no dedicated sem() function in numpy. But there is a function called std() that calculates the standard deviation.
So, to calculate the SEM with NumPy, calculate the standard deviation and divide it by the square root of the data size.
For example:
import numpy as np

data = [19, 2, 12, 3, 100, 2, 3, 2, 111, 82, 4]
sem_data = np.std(data, ddof=1) / np.sqrt(np.size(data))

print(sem_data)
Output:
13.172598656753378
Conclusion
Today you learned how to calculate the standard error of the mean in Python.
To recap, the standard error of the mean is an estimate of the standard deviation of all samples that could be drawn from a particular population.
To calculate the SEM in Python, you can use scipy‘s sem() function.
Another way to calculate SEM in Python is by using the NumPy module. But there is no direct sem() function there. Thus you need to use the standard deviation and the equation of SEM.
The laborious approach to find the SEM is to implement the sem() function yourself. To do this, you need to implement the functionality to calculate the standard deviation first. Then the rest is simple.
Thanks for reading. Happy coding!
Further Reading
Python Tricks
How to Write to a File in Python
The with Statement in Python
About the Author
- I’m an entrepreneur and a blogger from Finland. My goal is to make coding and tech easier for you with comprehensive guides and reviews.
Recent Posts
Стандартное отклонение – это мера, на которую элементы набора отклоняются или расходятся от среднего значения.
В Numpy вы можете найти стандартное отклонение массива Numpy, используя функцию numpy.std().
Мы рассмотрим примеры, охватывающие различные скрипты, чтобы понять использование функции numpy std().
Пример 1
В этом примере мы возьмем массив Numpy 1D с тремя элементами и найдем стандартное отклонение массива.
import numpy as np

#initialize array
A = np.array([2, 1, 6])

#compute standard deviation
output = np.std(A)

print(output)
Вывод:
2.160246899469287
Математическое доказательство:
Mean = (2 + 1 + 6)/3
     = 3

Standard Deviation = sqrt( ((2-3)^2 + (1-3)^2 + (6-3)^2)/3 )
                   = sqrt( (1+4+9)/3 )
                   = sqrt(14/3)
                   = sqrt(4.666666666666667)
                   = 2.160246899469287
Пример 2: 2D-массив
В этом примере мы возьмем 2D-массив размером 2Ã – 2 и найдем стандартное отклонение массива.
import numpy as np

#initialize array
A = np.array([[2, 3], [6, 5]])

#compute standard deviation
output = np.std(A)

print(output)
Вывод:
1.5811388300841898
Математическое доказательство:
Mean = (2 + 3 + 6 + 5)/4
     = 4

Standard Deviation = sqrt( ((2-4)^2 + (3-4)^2 + (6-4)^2 + (5-4)^2)/4 )
                   = sqrt( (4+1+4+1)/4 )
                   = sqrt(10/4)
                   = sqrt(2.5)
                   = 1.5811388300841898
Пример 3: вдоль оси
Вы также можете найти стандартное отклонение массива Numpy по оси.
В этом примере мы возьмем Numpy 2D-массив размером 2Ã – 2 и найдем стандартное отклонение массива вдоль оси.
import numpy as np

#initialize array
A = np.array([[2, 3], [6, 5]])

#compute standard deviation
output = np.std(A, axis=0)

print(output)
Вывод:
[2. 1.]
Математическое доказательство:
1st element
======================

mean = (2+6)/2 = 4

standard deviation = sqrt( ( (2-4)^2 + (6-4)^2 )/2 )
                   = sqrt( 4 )
                   = 2.0

2nd element
======================

mean = (3+5)/2 = 4

standard deviation = sqrt( ( (3-4)^2 + (5-4)^2 )/2 )
                   = sqrt( 1 )
                   = 1.0
This div height required for enabling the sticky sidebar
Introduction
In this tutorial, We will learn how to find the standard deviation of the numpy array. we can find the standard deviation of the numpy array using numpy.std() function. we will learn the calculation of this in a deep, thorough explanation of every part of the code with examples.
Numpy is a toolkit that helps us in working with numeric data. It contains a set of tools for creating a data structure called a Numpy array. It is basically a row and column grid of numbers.
Standard Deviation: A standard deviation is a statistic that measures the amount of variation in a dataset relative to its mean and is calculated as the square root of the variance. It is calculated by determining each data point’s deviation relative to the mean.
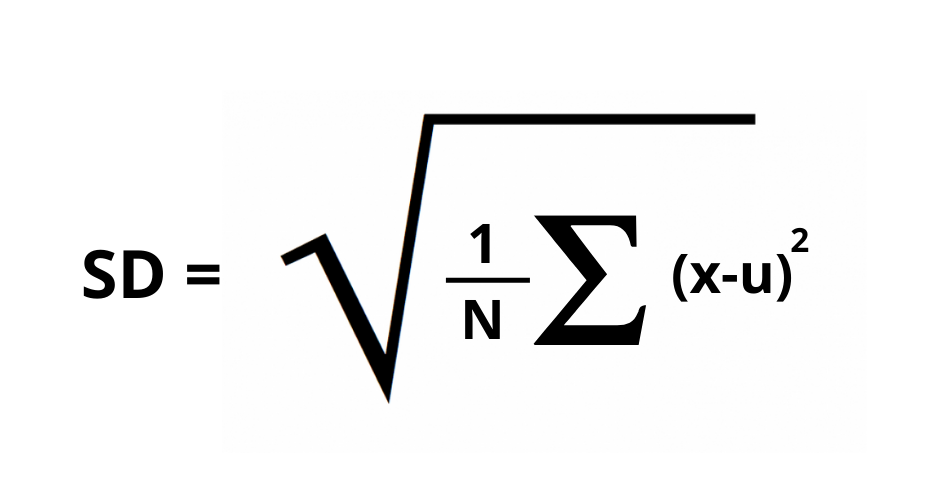
Where,
- SD = standard Deviation
- x = Each value of array
- u = total mean
- N = numbers of values
The numpy module in python provides various functions in which one is numpy.std(). It is used to compute the standard deviation along the specified axis. This function returns the standard deviation of the numpy array elements. The square root of the average square deviation (known as variance) is called the standard deviation.
Standard Deviation = sqrt(mean(abs(x-x.mean( ))**2
Syntax of Numpy Standard Deviation
numpy.std(a, axis=None, dtype=None, out=None, ddof=0, keepdims=<class numpy._globals._NoValue>) Parameters of Numpy Standard Deviation
- a: array_like – this parameter is used to calculate the standard deviation of the array elements.
- axis: None, int, or tuple of ints – It is optional to calculate the standard deviation. In this, we define the axis along which the standard deviation is calculated. By default, it calculates the standard deviation of the flattened array. If we have a tuple of ints, a standard deviation is performed over multiple axes, instead of a single axis or all the axes as before.
- dtype: data_type – It is also optional in the calculation of standard deviation. By default, the data type is float64 for integer type arrays, and the float type array will be just the same as the array type.
- out: ndarray – It is also optional in the calculation of standard deviation. This parameter is used as the alternative output array in which the result is to be placed. It must have the same shape as the expected output, but we can typecast if necessary.
- ddof: int – It is also optional in the calculation of standard deviation. This defines the delta degree of freedom. The divisor which is used in calculations is N-ddof, where N represents the no. of elements. By default, ddof is zero.
- keepdims: bool – It is optional. When the value is true, it will leave the reduced axis as dimensions with size one in the resultant. When the default value is passed, it will allow the non-default values to pass via the mean method of sub-classes of ndarray, but the keepdims will not pass.
Returns
It will return the new array that contains the standard deviation. If the ‘out’ parameter is not set to ‘None,’ then it will return the output array’s reference.
Examples of Numpy Standard Deviation
1. Numpy.std() – 1D array
import numpy as np

Arr = np.array([2, 1, 7])
result = np.std(Arr)

print("arr : ",Arr)
print("SD : ",result)
Output:
arr :  [2 1 7]
SD : 2.6246692913372702
Explanation:
Here firstly, we have imported numpy with alias name as np. Secondly, We have created an array ‘arr’ via array() function. Thirdly, We have declared the variable ‘result’ and assigned the std() function’s returned value. We have passed the array ‘arr‘ in the function. Lastly, we have printed the value of the result.
2. Numpy.std() using dtype=float32
import numpy as np

Arr = [8,9,8,2,8,2]
result = np.std(Arr)
print("Arr : ", Arr)
print("SD: ", result)

print ("More precision value with float32")
print("SD: ", np.std(Arr, dtype = np.float32))
Output:
Arr :  [8, 9, 8, 2, 8, 2]
SD:  2.9674156357941426
More precision value with float32
SD:  2.9674158
Explanation:
Here firstly, we have imported numpy with alias name as np. Secondly, We have created an array ‘arr’ via array() function. Thirdly, We have declared the variable ‘result’ and assigned the std() function’s returned value. We have passed the array ‘arr’ in the function. Fourthly, we have printed the value of the result. Then we have used the type parameter for the more precise value of standard deviation, which is set to dtype = np.float32. And lastly, we have printed the output.
3. Numpy.std() using dtype=float64
import numpy as np

Arr = [8,9,8,2,8,2]
result = np.std(Arr)

print("Arr : ", Arr)
print("SD: ", result)

print ("More accurate value with float64")
print("SD: ", np.std(Arr, dtype = np.float64))
Output:
Arr :  [8, 9, 8, 2, 8, 2]
SD:  2.9674156357941426
More accurate value with float64
SD:  2.9674156357941426
Explanation:
Here firstly, we have imported numpy with alias name as np. Secondly, We have created an array ‘arr’ via array() function. Thirdly, We have declared the variable ‘result’ and assigned the std() function’s returned value. We have passed the array ‘arr’ in the function. Fourthly, we have printed the value of the result. Then we have used the type parameter for the more accurate value of standard deviation, which is set to dtype = np.float64. And lastly, we have printed the output.
4. Numpy.std() – 2D Array
import numpy as np

arr = np.array([[2,4,6,8],[2,6,9,7]])
print("Array : ",arr)

result = np.std(arr)
print("SD : ",result)
Output:
Array :  [[2 4 6 8]
 [2 6 9 7]]
SD :  2.449489742783178
Explanation:
Here firstly, we have imported numpy with alias name as np. Secondly, We have created a 2D-array ‘arr’ via array() function. Thirdly, We have declared the variable ‘result’ and assigned the std() function’s returned value. We have passed the array ‘arr’ in the function. Lastly, we have printed the value of the result.
5. Using axis=0 on 2D-array to find Numpy Standard Deviation
import numpy as np

arr = np.array([[2,4,6,8],[2,6,9,7]])
print("Array : ",arr)

result = np.std(arr, axis=0)
print("SD : ",result)
Output:
Array :  [[2 4 6 8]
 [2 6 9 7]]
SD :  [0.  1.  1.5 0.5]
Explanation:
Here firstly, we have imported numpy with alias name as np. Secondly, We have created a 2D-array ‘arr’ via array() function. Thirdly, We have declared the variable ‘result’ and assigned the std() function’s returned value. We have passed the array ‘arr’ in the function in which we have used one more parameter, i.e., axis=0. Lastly, we have printed the value of the result.
6. using axis=1 in 2D-array to find Numpy Standard Deviation
import numpy as np

arr = np.array([[2,4,6,8],[2,6,9,7]])
print("Array : ",arr)

result = np.std(arr, axis=1)
print("SD : ",result)
Output:
Array :  [[2 4 6 8]
 [2 6 9 7]]
SD :  [2.23606798 2.54950976]
Explanation:
Here firstly, we have imported numpy with alias name as np. Secondly, We have created a 2D-array ‘arr’ via array() function. Thirdly, We have declared the variable ‘result’ and assigned the returned value of the std() function. we have passed the array ‘arr’ in the function in which we have used one more parameter i.e., axis=1. Lastly, we have printed the value of the result.
Must Read
Conclusion: Numpy Standard Deviation
In this tutorial, we have learned in detail about the calculation of standard deviation using the numpy.std() function. We have also seen all the examples in details to understand the concept better.
However, if you have any doubts or questions, do let me know in the comment section below. I will try to help you as soon as possible.
Happy Pythoning!
Сегодня мы представим стандартное отклонение с помощью метода stdev() в Python. Стандартное отклонение – это статистическая единица, которая представляет собой вариацию данных, то есть отображает отклонение значений данных от центрального значения (среднего значения данных).
Обычно стандартное отклонение рассчитывается по следующей формуле:
Стандартное отклонение = (Дисперсия) ^ 1/2
Теперь давайте начнем с реализации и расчета стандартного отклонения с использованием встроенной функции в Python.
Содержание
- Начало работы с функцией
- Стандартное отклонение с модулем NumPy
- Стандартное отклонение с модулем Pandas
- Заключение
Начало работы с функцией
Модуль содержит различные встроенные функции для выполнения анализа данных и других статистических функций. Функция statistics.stdev() используется для вычисления стандартного отклонения значений данных, переданных функции в качестве аргумента.
Синтаксис:
statistics.stdev(data)
Пример:
import statistics
data = range(1,10)

res_std = statistics.stdev(data)
print(res_std)
В приведенном выше примере мы создали данные чисел от 1 до 10 с помощью функции range(). Далее мы применяем функцию stdev() для оценки стандартного отклонения значений данных.
Вывод:
2.7386127875258306
Стандартное отклонение с модулем NumPy
Модуль NumPy преобразует элементы данных в форму массива для выполнения числовых манипуляций с ними.
Кроме того, функцию numpy.std() можно использовать для вычисления стандартного отклонения всех значений данных, присутствующих в массиве NumPy.
Синтаксис:
numpy.std(data)
Нам нужно импортировать модуль NumPy в среду Python, чтобы получить доступ к его встроенным функциям, используя приведенный ниже код:
import numpy
Пример:
import numpy as np
import pandas as pd
data = np.arange(1,30)
res_std = np.std(data)
print(res_std)
В приведенном выше примере мы сгенерировали массив элементов от 1 до 30 с помощью функции numpy.arange(). После этого мы передаем массив в функцию numpy.std() для вычисления стандартного отклонения элементов массива.
Вывод:
8.366600265340756
Стандартное отклонение с модулем Pandas
Модуль Pandas преобразует значения данных в DataFrame и помогает нам анализировать огромные наборы данных и работать с ними. Функция pandas.DataFrame.std() используется для вычисления стандартного отклонения значений столбца данных определенного DataFrame.
Синтаксис:
pandas.DataFrame.std()
Пример 1:
import numpy as np
import pandas as pd
data = np.arange(1,10)
df = pd.DataFrame(data)
res_std = df.std()
print(res_std)
В приведенном выше примере мы преобразовали массив NumPy в DataFrame и применили функцию DataFrame.std(), чтобы получить стандартное отклонение значений данных.
Вывод:
0    2.738613
dtype: float64
Пример 2:
import pandas as pd
import seaborn as sns
import matplotlib.pyplot as plt

data = pd.read_csv("C:/mtcars.csv")
res_std = data['qsec'].std()
print(res_std)
В приведенном выше примере мы использовали набор данных и рассчитали стандартное отклонение столбца данных qsec с помощью функции DataFrame.std().
Входной набор данных:

Вывод:
1.7869432360968431
Заключение
Таким образом, в этой статье мы поняли, как работает функция Python stdev() вместе с модулем NumPy и Pandas.
( 4 оценки, среднее 3 из 5 )

Помогаю в изучении Питона на примерах. Автор практических задач с детальным разбором их решений.