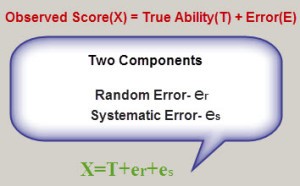
Two Types of Experimental Error
No matter how careful you are, there is always error in a measurement. Error is not a «mistake»—it’s part of the measuring process. In science, measurement error is called experimental error or observational error.
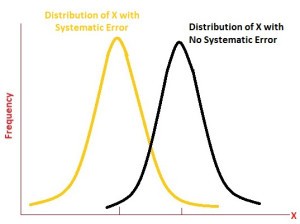
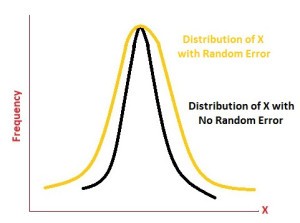
There are two broad classes of observational errors: random error and systematic error. Random error varies unpredictably from one measurement to another, while systematic error has the same value or proportion for every measurement. Random errors are unavoidable, but cluster around the true value. Systematic error can often be avoided by calibrating equipment, but if left uncorrected, can lead to measurements far from the true value.
Key Takeaways
- Random error causes one measurement to differ slightly from the next. It comes from unpredictable changes during an experiment.
- Systematic error always affects measurements the same amount or by the same proportion, provided that a reading is taken the same way each time. It is predictable.
- Random errors cannot be eliminated from an experiment, but most systematic errors can be reduced.
Random Error Example and Causes
If you take multiple measurements, the values cluster around the true value. Thus, random error primarily affects precision. Typically, random error affects the last significant digit of a measurement.
The main reasons for random error are limitations of instruments, environmental factors, and slight variations in procedure. For example:
- When weighing yourself on a scale, you position yourself slightly differently each time.
- When taking a volume reading in a flask, you may read the value from a different angle each time.
- Measuring the mass of a sample on an analytical balance may produce different values as air currents affect the balance or as water enters and leaves the specimen.
- Measuring your height is affected by minor posture changes.
- Measuring wind velocity depends on the height and time at which a measurement is taken. Multiple readings must be taken and averaged because gusts and changes in direction affect the value.
- Readings must be estimated when they fall between marks on a scale or when the thickness of a measurement marking is taken into account.
Because random error always occurs and cannot be predicted, it’s important to take multiple data points and average them to get a sense of the amount of variation and estimate the true value.
Systematic Error Example and Causes
Systematic error is predictable and either constant or else proportional to the measurement. Systematic errors primarily influence a measurement’s accuracy.
Typical causes of systematic error include observational error, imperfect instrument calibration, and environmental interference. For example:
- Forgetting to tare or zero a balance produces mass measurements that are always «off» by the same amount. An error caused by not setting an instrument to zero prior to its use is called an offset error.
- Not reading the meniscus at eye level for a volume measurement will always result in an inaccurate reading. The value will be consistently low or high, depending on whether the reading is taken from above or below the mark.
- Measuring length with a metal ruler will give a different result at a cold temperature than at a hot temperature, due to thermal expansion of the material.
- An improperly calibrated thermometer may give accurate readings within a certain temperature range, but become inaccurate at higher or lower temperatures.
- Measured distance is different using a new cloth measuring tape versus an older, stretched one. Proportional errors of this type are called scale factor errors.
- Drift occurs when successive readings become consistently lower or higher over time. Electronic equipment tends to be susceptible to drift. Many other instruments are affected by (usually positive) drift, as the device warms up.
Once its cause is identified, systematic error may be reduced to an extent. Systematic error can be minimized by routinely calibrating equipment, using controls in experiments, warming up instruments prior to taking readings, and comparing values against standards.
While random errors can be minimized by increasing sample size and averaging data, it’s harder to compensate for systematic error. The best way to avoid systematic error is to be familiar with the limitations of instruments and experienced with their correct use.
Key Takeaways: Random Error vs. Systematic Error
- The two main types of measurement error are random error and systematic error.
- Random error causes one measurement to differ slightly from the next. It comes from unpredictable changes during an experiment.
- Systematic error always affects measurements the same amount or by the same proportion, provided that a reading is taken the same way each time. It is predictable.
- Random errors cannot be eliminated from an experiment, but most systematic errors may be reduced.
Sources
- Bland, J. Martin, and Douglas G. Altman (1996). «Statistics Notes: Measurement Error.» BMJ 313.7059: 744.
- Cochran, W. G. (1968). «Errors of Measurement in Statistics». Technometrics. Taylor & Francis, Ltd. on behalf of American Statistical Association and American Society for Quality. 10: 637–666. doi:10.2307/1267450
- Dodge, Y. (2003). The Oxford Dictionary of Statistical Terms. OUP. ISBN 0-19-920613-9.
- Taylor, J. R. (1999). An Introduction to Error Analysis: The Study of Uncertainties in Physical Measurements. University Science Books. p. 94. ISBN 0-935702-75-X.
«Systematic bias» redirects here. For the sociological and organizational phenomenon, see Systemic bias.
Observational error (or measurement error) is the difference between a measured value of a quantity and its true value.[1] In statistics, an error is not necessarily a «mistake». Variability is an inherent part of the results of measurements and of the measurement process.
Measurement errors can be divided into two components: random and systematic.[2]Random errors are errors in measurement that lead to measurable values being inconsistent when repeated measurements of a constant attribute or quantity are taken. Systematic errors are errors that are not determined by chance but are introduced by repeatable processes inherent to the system.[3] Systematic error may also refer to an error with a non-zero mean, the effect of which is not reduced when observations are averaged.[citation needed]
Measurement errors can be summarized in terms of accuracy and precision.
Measurement error should not be confused with measurement uncertainty.
Science and experimentsEdit
When either randomness or uncertainty modeled by probability theory is attributed to such errors, they are «errors» in the sense in which that term is used in statistics; see errors and residuals in statistics.
Every time we repeat a measurement with a sensitive instrument, we obtain slightly different results. The common statistical model used is that the error has two additive parts:
- Systematic error which always occurs, with the same value, when we use the instrument in the same way and in the same case.
- Random error which may vary from observation to another.
Systematic error is sometimes called statistical bias. It may often be reduced with standardized procedures. Part of the learning process in the various sciences is learning how to use standard instruments and protocols so as to minimize systematic error.
Random error (or random variation) is due to factors that cannot or will not be controlled. One possible reason to forgo controlling for these random errors is that it may be too expensive to control them each time the experiment is conducted or the measurements are made. Other reasons may be that whatever we are trying to measure is changing in time (see dynamic models), or is fundamentally probabilistic (as is the case in quantum mechanics — see Measurement in quantum mechanics). Random error often occurs when instruments are pushed to the extremes of their operating limits. For example, it is common for digital balances to exhibit random error in their least significant digit. Three measurements of a single object might read something like 0.9111g, 0.9110g, and 0.9112g.
CharacterizationEdit
Measurement errors can be divided into two components: random error and systematic error.[2]
Random error is always present in a measurement. It is caused by inherently unpredictable fluctuations in the readings of a measurement apparatus or in the experimenter’s interpretation of the instrumental reading. Random errors show up as different results for ostensibly the same repeated measurement. They can be estimated by comparing multiple measurements and reduced by averaging multiple measurements.
Systematic error is predictable and typically constant or proportional to the true value. If the cause of the systematic error can be identified, then it usually can be eliminated. Systematic errors are caused by imperfect calibration of measurement instruments or imperfect methods of observation, or interference of the environment with the measurement process, and always affect the results of an experiment in a predictable direction. Incorrect zeroing of an instrument leading to a zero error is an example of systematic error in instrumentation.
The Performance Test Standard PTC 19.1-2005 “Test Uncertainty”, published by the American Society of Mechanical Engineers (ASME), discusses systematic and random errors in considerable detail. In fact, it conceptualizes its basic uncertainty categories in these terms.
Random error can be caused by unpredictable fluctuations in the readings of a measurement apparatus, or in the experimenter’s interpretation of the instrumental reading; these fluctuations may be in part due to interference of the environment with the measurement process. The concept of random error is closely related to the concept of precision. The higher the precision of a measurement instrument, the smaller the variability (standard deviation) of the fluctuations in its readings.
SourcesEdit
Sources of systematic errorEdit
Imperfect calibrationEdit
Sources of systematic error may be imperfect calibration of measurement instruments (zero error), changes in the environment which interfere with the measurement process and sometimes imperfect methods of observation can be either zero error or percentage error. If you consider an experimenter taking a reading of the time period of a pendulum swinging past a fiducial marker: If their stop-watch or timer starts with 1 second on the clock then all of their results will be off by 1 second (zero error). If the experimenter repeats this experiment twenty times (starting at 1 second each time), then there will be a percentage error in the calculated average of their results; the final result will be slightly larger than the true period.
Distance measured by radar will be systematically overestimated if the slight slowing down of the waves in air is not accounted for. Incorrect zeroing of an instrument leading to a zero error is an example of systematic error in instrumentation.
Systematic errors may also be present in the result of an estimate based upon a mathematical model or physical law. For instance, the estimated oscillation frequency of a pendulum will be systematically in error if slight movement of the support is not accounted for.
QuantityEdit
Systematic errors can be either constant, or related (e.g. proportional or a percentage) to the actual value of the measured quantity, or even to the value of a different quantity (the reading of a ruler can be affected by environmental temperature). When it is constant, it is simply due to incorrect zeroing of the instrument. When it is not constant, it can change its sign. For instance, if a thermometer is affected by a proportional systematic error equal to 2% of the actual temperature, and the actual temperature is 200°, 0°, or −100°, the measured temperature will be 204° (systematic error = +4°), 0° (null systematic error) or −102° (systematic error = −2°), respectively. Thus the temperature will be overestimated when it will be above zero and underestimated when it will be below zero.
DriftEdit
Systematic errors which change during an experiment (drift) are easier to detect. Measurements indicate trends with time rather than varying randomly about a mean. Drift is evident if a measurement of a constant quantity is repeated several times and the measurements drift one way during the experiment. If the next measurement is higher than the previous measurement as may occur if an instrument becomes warmer during the experiment then the measured quantity is variable and it is possible to detect a drift by checking the zero reading during the experiment as well as at the start of the experiment (indeed, the zero reading is a measurement of a constant quantity). If the zero reading is consistently above or below zero, a systematic error is present. If this cannot be eliminated, potentially by resetting the instrument immediately before the experiment then it needs to be allowed by subtracting its (possibly time-varying) value from the readings, and by taking it into account while assessing the accuracy of the measurement.
If no pattern in a series of repeated measurements is evident, the presence of fixed systematic errors can only be found if the measurements are checked, either by measuring a known quantity or by comparing the readings with readings made using a different apparatus, known to be more accurate. For example, if you think of the timing of a pendulum using an accurate stopwatch several times you are given readings randomly distributed about the mean. Hopings systematic error is present if the stopwatch is checked against the ‘speaking clock’ of the telephone system and found to be running slow or fast. Clearly, the pendulum timings need to be corrected according to how fast or slow the stopwatch was found to be running.
Measuring instruments such as ammeters and voltmeters need to be checked periodically against known standards.
Systematic errors can also be detected by measuring already known quantities. For example, a spectrometer fitted with a diffraction grating may be checked by using it to measure the wavelength of the D-lines of the sodium electromagnetic spectrum which are at 600 nm and 589.6 nm. The measurements may be used to determine the number of lines per millimetre of the diffraction grating, which can then be used to measure the wavelength of any other spectral line.
Constant systematic errors are very difficult to deal with as their effects are only observable if they can be removed. Such errors cannot be removed by repeating measurements or averaging large numbers of results. A common method to remove systematic error is through calibration of the measurement instrument.
Sources of random errorEdit
The random or stochastic error in a measurement is the error that is random from one measurement to the next. Stochastic errors tend to be normally distributed when the stochastic error is the sum of many independent random errors because of the central limit theorem. Stochastic errors added to a regression equation account for the variation in Y that cannot be explained by the included Xs.
SurveysEdit
The term «observational error» is also sometimes used to refer to response errors and some other types of non-sampling error.[1] In survey-type situations, these errors can be mistakes in the collection of data, including both the incorrect recording of a response and the correct recording of a respondent’s inaccurate response. These sources of non-sampling error are discussed in Salant and Dillman (1994) and Bland and Altman (1996).[4][5]
These errors can be random or systematic. Random errors are caused by unintended mistakes by respondents, interviewers and/or coders. Systematic error can occur if there is a systematic reaction of the respondents to the method used to formulate the survey question. Thus, the exact formulation of a survey question is crucial, since it affects the level of measurement error.[6] Different tools are available for the researchers to help them decide about this exact formulation of their questions, for instance estimating the quality of a question using MTMM experiments. This information about the quality can also be used in order to correct for measurement error.[7][8]
Effect on regression analysisEdit
If the dependent variable in a regression is measured with error, regression analysis and associated hypothesis testing are unaffected, except that the R2 will be lower than it would be with perfect measurement.
However, if one or more independent variables is measured with error, then the regression coefficients and standard hypothesis tests are invalid.[9]: p. 187 This is known as attenuation bias.[10]
See alsoEdit
- Bias (statistics)
- Cognitive bias
- Correction for measurement error (for Pearson correlations)
- Errors and residuals in statistics
- Error
- Replication (statistics)
- Statistical theory
- Metrology
- Regression dilution
- Test method
- Propagation of uncertainty
- Instrument error
- Measurement uncertainty
- Errors-in-variables models
- Systemic bias
ReferencesEdit
- ^ a b Dodge, Y. (2003) The Oxford Dictionary of Statistical Terms, OUP. ISBN 978-0-19-920613-1
- ^ a b John Robert Taylor (1999). An Introduction to Error Analysis: The Study of Uncertainties in Physical Measurements. University Science Books. p. 94, §4.1. ISBN 978-0-935702-75-0.
- ^ «Systematic error». Merriam-webster.com. Retrieved 2016-09-10.
- ^ Salant, P.; Dillman, D. A. (1994). How to conduct your survey. New York: John Wiley & Sons. ISBN 0-471-01273-4.
- ^ Bland, J. Martin; Altman, Douglas G. (1996). «Statistics Notes: Measurement Error». BMJ. 313 (7059): 744. doi:10.1136/bmj.313.7059.744. PMC 2352101. PMID 8819450.
- ^ Saris, W. E.; Gallhofer, I. N. (2014). Design, Evaluation and Analysis of Questionnaires for Survey Research (Second ed.). Hoboken: Wiley. ISBN 978-1-118-63461-5.
- ^ DeCastellarnau, A. and Saris, W. E. (2014). A simple procedure to correct for measurement errors in survey research. European Social Survey Education Net (ESS EduNet). Available at: http://essedunet.nsd.uib.no/cms/topics/measurement Archived 2019-09-15 at the Wayback Machine
- ^ Saris, W. E.; Revilla, M. (2015). «Correction for measurement errors in survey research: necessary and possible» (PDF). Social Indicators Research. 127 (3): 1005–1020. doi:10.1007/s11205-015-1002-x. hdl:10230/28341. S2CID 146550566.
- ^ Hayashi, Fumio (2000). Econometrics. Princeton University Press. ISBN 978-0-691-01018-2.
- ^ Angrist, Joshua David; Pischke, Jörn-Steffen (2015). Mastering ‘metrics : the path from cause to effect. Princeton, New Jersey. p. 221. ISBN 978-0-691-15283-7. OCLC 877846199.
The bias generated by this sort of measurement error in regressors is called attenuation bias.
Further readingEdit
- Cochran, W. G. (1968). «Errors of Measurement in Statistics». Technometrics. 10 (4): 637–666. doi:10.2307/1267450. JSTOR 1267450.
You are here: Home / Basics / Different Types of Errors in Measurement and Measurement Error Calculation
Measurement Errors
The measurement of an amount is based on some international standards which are completely accurate compared with others. Generally, measurement of any quantity is done by comparing it with derived standards with which they are not completely accurate. Thus, the errors in measurement are not only due to error in methods, but are also due to derivation being not done perfectly well. So, 100% measurement error is not possible with any methods.
It is very important for the operator to take proper care of the experiment while performing on industrial instruments so that the error in measurement can be reduced. Some of the errors are constant in nature due to the unknown reasons, some will be random in nature, and the other will be due to gross blunder on the part of the experimenter.
An error may be defined as the difference between the measured value and the actual value. For example, if the two operators use the same device or instrument for finding the errors in measurement, it is not necessary that they may get similar results. There may be a difference between both measurements. The difference that occurs between both the measurements is referred to as an ERROR.
Sequentially, to understand the concept of errors in measurement, you should know the two terms that define the error. They are true value and the measured value. The true value is impossible to find out the truth of quantity by experimental means. It may be defined as the average value of an infinite number of measured values. Measured value can be defined as the estimated value of true value that can be found by taking several measured values during an experiment.
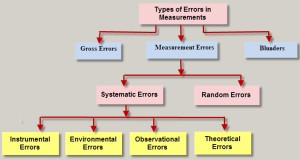
Types of Errors in Measurement System
Generally errors are classified into three types: systematic errors, random errors and blunders.
Types of Errors in Measurement System
1) Gross Errors
2) Blunders
3) Measurement Errors
Systematic Errors
- Instrumental Errors
- Environmental Errors
- Observational Errors
- Theoretical Errors
Random Errors
1) Gross Errors
Gross errors are caused by mistake in using instruments or meters, calculating measurement and recording data results. The best example of these errors is a person or operator reading pressure gage 1.01N/m2 as 1.10N/m2. It may be due to the person’s bad habit of not properly remembering data at the time of taking down reading, writing and calculating, and then presenting the wrong data at a later time. This may be the reason for gross errors in the reported data, and such errors may end up in calculation of the final results, thus deviating results.
2) Blunders
Blunders are final source of errors and these errors are caused by faulty recording or due to a wrong value while recording a measurement, or misreading a scale or forgetting a digit while reading a scale. These blunders should stick out like sore thumbs if one person checks the work of another person. It should not be comprised in the analysis of data.
3) Measurement Error
The measurement error is the result of the variation of a measurement of the true value. Usually, Measurement error consists of a random error and systematic error. The best example of the measurement error is, if electronic scales are loaded with 1kg standard weight and the reading is 10002 grams, then
The measurement error is = (1002 grams-1000 grams) = 2 grams
Measurement Errors are classified into two types: systematic error and random errors
Systematic Errors
The Systematic errors that occur due to fault in the measuring device are known as systematic errors. Usually they are called as Zero Error – a positive or negative error. These errors can be detached by correcting the measurement device. These errors may be classified into different categories.
Systematic Errors
In order to understand the concept of systematic errors, let us classify the errors as:
- Instrumental Errors
- Environmental Errors
- Observational Errors
- Theoritical
Instrumental Errors
Instrumental errors occur due to wrong construction of the measuring instruments. These errors may occur due to hysteresis or friction. These types of errors include loading effect and misuse of the instruments. In order to reduce the gross errors in measurement, different correction factors must be applied and in the extreme condition instrument must be recalibrated carefully.
Environmental Errors
The environmental errors occur due to some external conditions of the instrument. External conditions mainly include pressure, temperature, humidity or due to magnetic fields. In order to reduce the environmental errors
- Try to maintain the humidity and temperature constant in the laboratory by making some arrangements.
- Ensure that there shall not be any external electrostatic or magnetic field around the instrument.
Observational Errors
As the name suggests, these types of errors occurs due to wrong observations or reading in the instruments particularly in case of energy meter reading. The wrong observations may be due to PARALLAX. In order to reduce the PARALLAX error highly accurate meters are needed: meters provided with mirror scales.
Theoretical Errors
Theoretical errors are caused by simplification of the model system. For example, a theory states that the temperature of the system surrounding will not change the readings taken when it actually does, then this factor will begin a source of error in measurement.
Random Errors
Random errors are caused by the sudden change in experimental conditions and noise and tiredness in the working persons. These errors are either positive or negative. An example of the random errors is during changes in humidity, unexpected change in temperature and fluctuation in voltage. These errors may be reduced by taking the average of a large number of readings.
Random Errors
Measurement Error Calculation
There are several ways to make a reasonable measurement error calculation such as estimating random errors and estimating systematic errors.
Estimating Random Errors
There are a number of ways to make a reasonable estimate of the random error in a particular measurement. The best way is to make a series of measurements of a given quantity (say, x) and calculate the mean and standard deviation (x ̅ & σ_x ) from this data.
The mean x ̅ is defined as
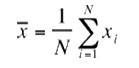
Where, Xi is the result of the i th measurements
‘N’ is the number of measurements
The standard variation is given by
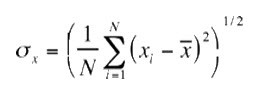
If a measurement is repeated many times, then 68% of the measured valves will drop in the range x ̅ ± σ_x
We become more positive that , is an accurate representation of the true value of the quantity x ̅ . The standard deviation of the mean σ_x is defined as
σ_(x ̅ )=σ_x⁄√N
The quantity σ_x is a good estimate of our uncertainty in x ̅. Notice that the measurement precision increases in proportion to √N as we increase the number of measurements. The following example will clarify these ideas. Assume you made the following five measurements of a length:
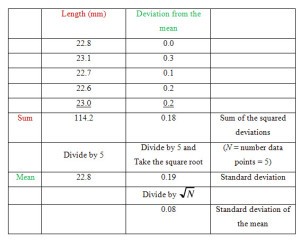
Error Calculation
Therefore, the result is 22.84±.08mm
In some cases, it is hardly useful to repeat a measurement many times. In that situation, you can estimate frequently the error by taking account of the smallest division of the measuring instrument.
For example, when using a meter stick, one can measure, perhaps a half or sometimes even a fifth of a millimeter. So, the absolute error would be estimated to be around 0.5 mm or 0.2 mm.
Thus, this is all about the various types of errors in measurement and error measurement calculation. We hope you are satisfied with this article. We express our gratitude to all the readers. Please share your suggestions and comments in the comment section below.
Systematic error is a type of error that deviates by a fixed amount from the true value of measurement.
Discover 24 more articles on this topic
As opposed to random errors, systematic errors are easier to correct. There are many types of systematic errors and a researcher needs to be aware of these in order to offset their influence.
Systematic error in physical sciences commonly occurs with the measuring instrument having a zero error. A zero error is when the initial value shown by the measuring instrument is a non-zero value when it should be zero.
For example, a voltmeter might show a reading of 1 volt even when it is disconnected from any electromagnetic influence. This means the systematic error is 1 volt and all measurements shown by this voltmeter will be a volt higher than the true value.
This type of error can be offset by simply deducing the value of the zero error. In this case, if the voltmeter shows a reading of 53 volt, then the actual value would be 52 volt. In this case, the systematic error is a constant value.
Sometime the measuring instrument itself is faulty, which leads to a systematic error. For example, if your stopwatch shows 100 seconds for an actual time of 99 seconds, everything you measure with this stopwatch will be dilated, and a systematic error is induced in your measurements. In this case, the systematic error is proportional to the measurement.
In many experiments, there are inherent systematic errors in the experiment itself, which means even if all the instruments were 100% perfect there would still be an error.
For example, in an experiment to calculate acceleration due to gravity using the length and time period of a simple pendulum, the size of the pendulum bob, the air friction, the slight movement of support, etc. all affect the calculated value. These systematic errors are inherent to the experiment and need to be accounted for in an approximate manner.
Many systematic errors cannot be gotten rid of by simply taking a large number of readings and averaging them out.
For example, in the case of our faulty voltmeter, even if a hundred readings are taken, they will all be near 53 volt instead of the actual 52 volt.
Therefore in such cases, calibration of the measuring instrument prior to starting the experiment is required, which will reveal if there is any systematic error or zero error in the measuring instrument.
Systematic errors can also be produced by faulty human observations or changes in environment during the experiment, which are difficult to get rid of.