
Содержание:
- Важные логи сайта
- Расположение логов
- Чтение записей в логах
- Просмотр с помощью команды tail
- Просмотр с помощью ISPManager
- Программы для анализа логов
- Ведение логов медленных запросов сервера
- Ведение логов с помощью Logrotate
Логи сайта — это системные журналы, позволяющие получить информацию о посещении сайта ботами и пользователями, а также выявить скрытые проблемы на сервере — ошибки, битые ссылки, медленные запросы от сервера и многое другое.
Важные логи сайта
- Access.log — логи посещений пользователей и ботов. Позволяет составить более точную и подробную статистику, нежели сторонние ресурсы, выполняющие внешнее сканирование сайта и отправляющие ряд ненужных запросов серверу. Благодаря данному логу можно получить информацию об используемом браузере и IP-адрес посетителя, данные о местонахождении клиента (страна и город) и многое другое. Стоит обратить внимание, если сайт имеет высокую посещаемость, то анализ логов сервера потребует больше времени. Поэтому для составления статистики стоит использовать специализированные программы (анализаторы).
- Error.log — программные ошибки сервера. Стоит внимательно отнестись к анализу данного лога, ведь боты поисковиков, сканируя, получают все данные о работе сайта. При обнаружении большого количества ошибок, сайт может попасть под санкции поисковых систем. В свою очередь из записей данного журнала можно узнать точную дату и время ошибки, IP-адрес получателя, тип и описание ошибки.
- Slow.log (название зависит от используемой оболочки сервера) — в данный журнал записываются медленные запросы сервера. Так принято обозначать запросы с повышенным порогом задержки, выданные пользователю. Этот журнал позволяет выявить слабые места сервера и исправить проблему. Ниже будет рассмотрен способ включить ведение данного лога на разных типах серверов, а также настройка задержки, с которой записи будут заноситься в файл.
Расположение логов
Важно обратить внимание, что местоположение логов сайта по умолчанию зависит от используемого типа оболочки и может быть изменено администратором.
Стандартные пути до Error.log
Nginx
/var/log/nginx/error.log
Php-Fpm
/var/log/php-fpm/error.log
Apache (CentOS)
/var/log/httpd/error_log
Apache (Ubuntu, Debian)
/var/log/apache2/error_log
Стандартные пути до Access.log
Nginx
/var/log/nginx/access.log
Php-Fpm
/var/log/php-fpm/access.log
Apache (CentOS)
/var/log/httpd/access_log
Apache (Ubuntu, Debian)
/var/log/apache2/access_log
Чтение записей в логах
Записи в логах имеют структуру: одно событие – одна строка.
Записи в разных логах имеют общие черты, но количество подробностей отличается. Далее будут приведены примеры строк из разных системных журналов.
Примеры записей
Error.log
[Sat Sep 1 15:33:40.719615 2019] [:error] [pid 10706] [client 66.249.66.61:60699] PHP Notice: Undefined variable: moduleclass_sfx in /var/data/www/site.ru/modules/contacts/default.php on line 14
В приведенном примере:
- [Sat Sep 1 15:33:40.719615 2019] — дата и время события.
- [:error] [pid 10706] — ошибка и её тип.
- [client 66.249.66.61:60699] — IP-адрес подключившегося клиента.
- PHP Notice: Undefined variable: moduleclass_sfx in — событие PHP Notice. В данной ситуации — обнаружена неизвестная переменная.
- /var/data/www/site.ru/modules/contacts/default.php on line 14 — путь и номер строки в проблемном файле.
Access.log
194.61.0.6 – alex [10/Oct/2019:15:32:22 -0700] "GET /apache_pb.gif HTTP/1.0" 200 5396 "http://www.mysite/myserver.html" "Mozilla/4.08 [en] (Win98; I ;Nav)"
В приведенном примере:
- 194.61.0.6 — IP-адрес пользователя.
- alex — если пользователь зарегистрирован в системе, то в логах будет указан идентификатор.
- [10/Oct/2019:15:32:22 -0700]— дата и время записи.
- «GET /apache_pb.gif HTTP/1.0» — «GET» означает, что определённый документ со страницы сайта был отправлен пользователю. Существует команда «POST», наоборот отправляет конкретные данные (комментарий или любое другое сообщение) на сервер . Далее указан извлечённый документ «Apache_pb.gif», а также использованный протокол «HTTP/1.0».
- 200 5396 — код и количество байтов документа, которые были возвращены сервером.
- «http://www. www.mysite/myserver.html»— страница, с которой был произведён запрос на извлечение документа «Apache_pb.gif».
- «Mozilla/4.08 [en] (Win98; I ;Nav)» — данные о пользователе, которой произвёл запрос (используемый браузер и операционная система).
Просмотр логов сервера с помощью команды tail
Выполнить просмотр логов в Linux можно с помощью команды tail. Данный инструмент позволяет смотреть записи в логах, выводя последние строки из файла. По умолчанию tail выводит 10 строк.
Первый вариант использования Tail
tail -f /var/log/syslog
Аргумент «-f» позволяет команде делать просмотр событий в режиме реального времени, в ожидании новых записей в лог файлах. Для прерывания процесса следует нажать сочетание клавиш «Ctrl+C».
На место переменной «/var/log/syslog» в примере следует подставить актуальный адрес до нужных системных журналов.
Второй вариант использования Tail
tail -F /var/log/syslog
В Linux логи веб-сервера не ведутся до бесконечности, поскольку это усложняет их дальнейший анализ. При преодолении лимита записей, система переименует переполненный строками файл журнала и отправит в «архив». Вместо старого файла создастся новый, но с прежним названием.
Если будет использоваться аргумент «-f», команда продолжит отслеживание старого, переименованного журнала. Данный метод делает невозможным просмотр логов в реальном времени, поскольку файл более не актуален.
При использовании аргумента «-F», команда, после окончания записи старого журнала, перейдёт к чтению нового файла с логами. В таком случае просмотр логов в режиме реального времени продолжится.
Аналог команды Tail
tailf /var/log/syslog
Отличие команды tailf от предыдущей заключается в том, что она не обращается к файлу и файловой системе в период, когда запись логов не происходит. Это экономит ресурсы системы и заряд, если используется нестационарное устройство — ноутбук, смартфон или планшет.
Недостаток данного способа — проблема с чтением больших файлов. Если системный журнал достаточно большой, возникает вероятность отказа в работе программы.
Изменение стандартного количества строк для вывода
Как и отмечалось выше, по умолчанию выводится 10 строк. Если требуется увеличить или уменьшить их количество, в команду добавляется аргумент «-n» и необходимое число строк.
Пример:
tail -f -n 100 /var/log/syslog
При использовании данной команды будут показаны последние 100 строк журнала.
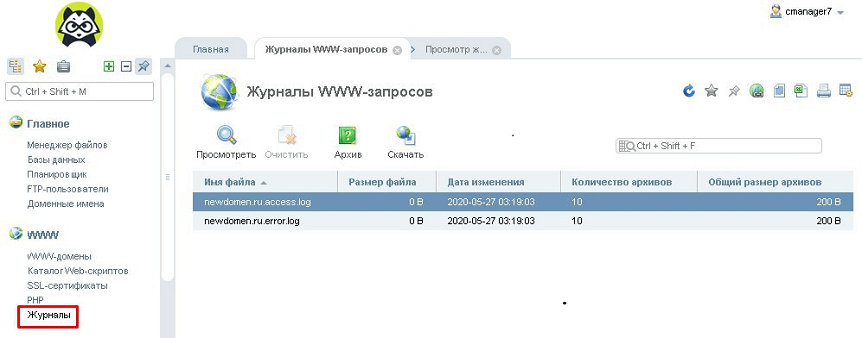
Просмотр логов с помощью ISPManager
Если на сервере установлен ISPManager, логи можно легко читать, используя приведенный ниже алгоритм.
- На главной странице, в панели инструментов «WWW» нужно нажать на вкладку «Журналы».

- ISPManager выдаст журналы посещений и серверных ошибок в виде:
- ru.access.log;
- ru.error.log.*
* Вместо «newdomen.ru» из примера в выдаче будет название актуального домена.
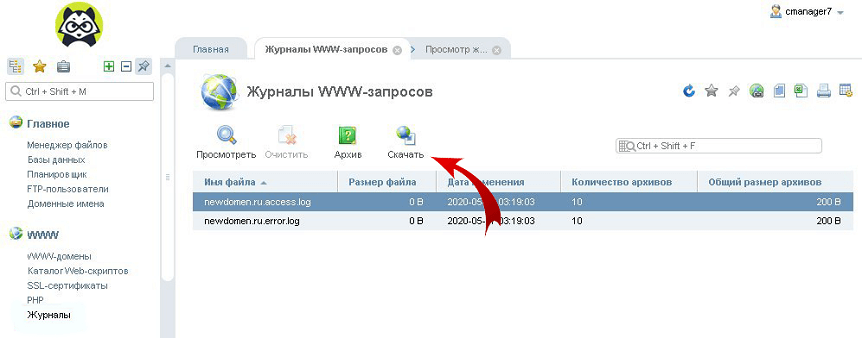
Открыть файл лога можно, нажав на «Посмотреть» в верхнем меню.
- Для просмотра всех записей журнала, необходимо нажать на «Скачать» и сохранить файл на локальный носитель.
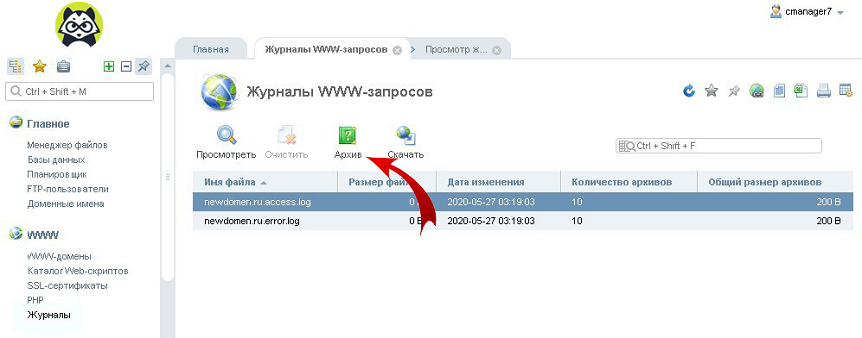
- Более старые версии логов можно найти во вкладке «Архив».
Программы для анализа логов
Анализировать журналы с большим количеством данных вручную не только сложно, но и чревато ошибками. Для упрощения работы с лог файлами было создано большое количество сервисов и утилит.
Инструменты для анализа логов делятся на два основных типа — статические и работающие в режиме реального времени.
Статические программы
Данный тип выполняет работу только с извлеченными логами, но обеспечивает быструю сортировку данных.
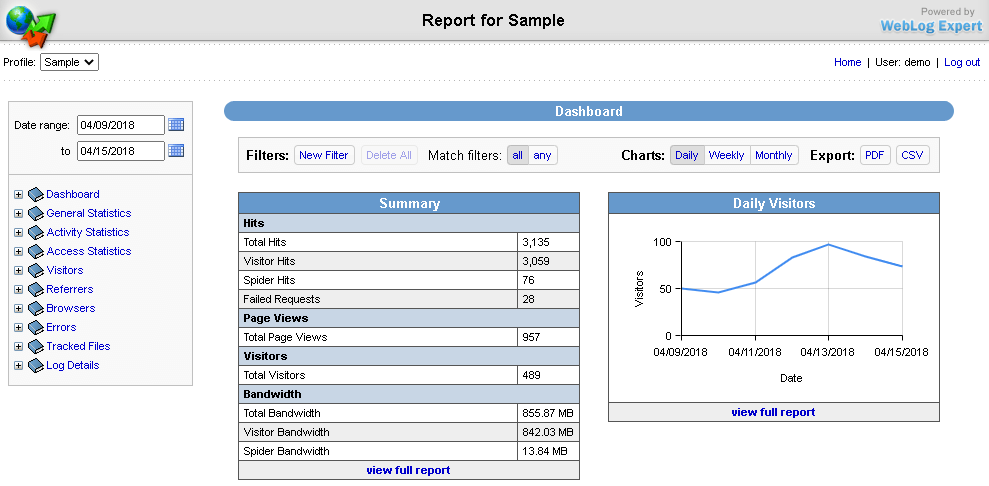
WebLog Expert
Возможности
- Предоставление информации об активность сайта, количестве посетителей, доступ к файлам, URL страницы, ссылающиеся страницы, информацию о пользователе (браузер и операционная система).
- Создание отчётов в формате HTML (.html), PDF (.pdf), CSV (.csv).
- Поддерживает анализ логов Nginx, Apache, ISS.
- Чтение файлов даже в архивах ZIP (.zip), GZ (.gz).
Web Log Explorer
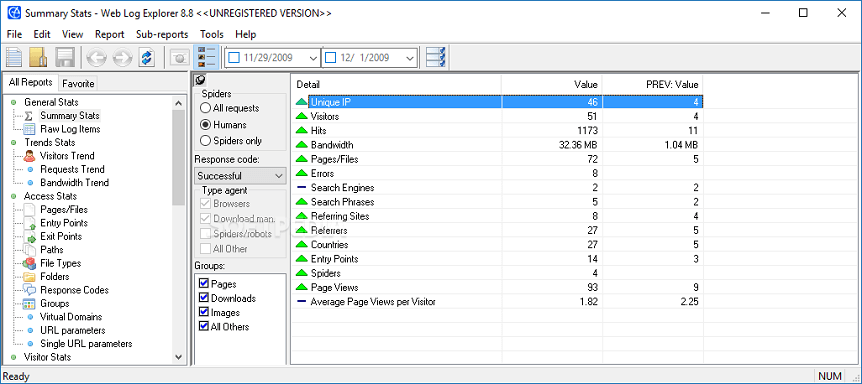
Возможности
- Создание многоуровневых отчётов, включающих количество посетителей, маршруты пользователей по сайту, местоположение хостов (страна и город), указанные в поисковике ключевые слова.
- Поддержка более 43 форматов логов.
- Возможность прямой загрузки логов с FTP, HTTP сервера.
- Чтение архивированных журналов.
Программы для анализа в режиме реального времени
Эти инструменты встраиваются в программную среду сервера, анализируют данные в реальном времени и записывают непрерывный отчёт.
GoAccess
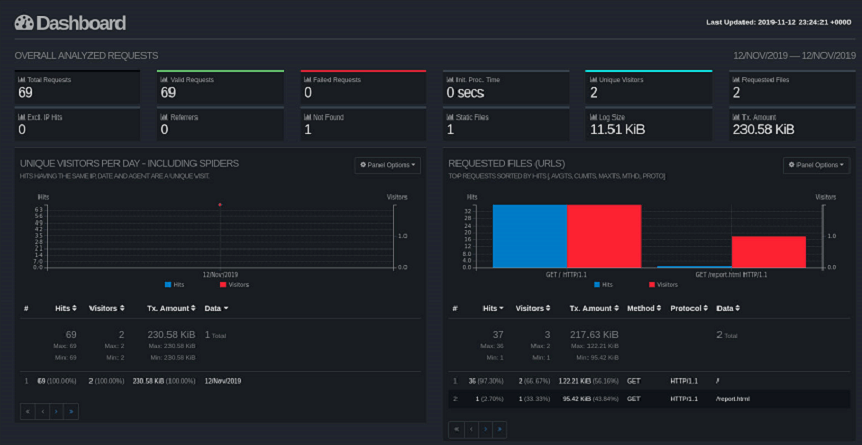
Возможности
- Автоматическая генерация отчёта в формате HTML (.html), JSON (.json), CSV (.csv).
- При подключении к серверу через SSH, возможен анализ в браузере и в терминале
- Поддержка почти всех форматов (Apache, Nginx, Amazon S3, Elastic Load Balancing, CloudFront и др.).
Logstash
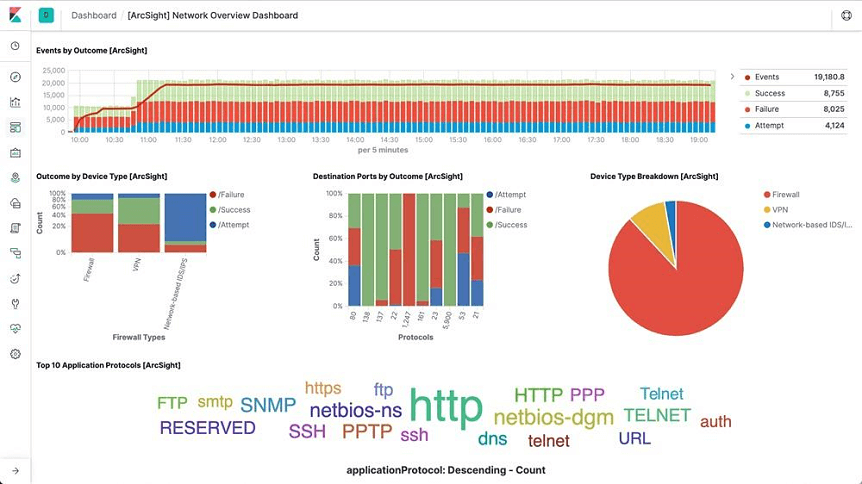
Возможности
- Постоянная генерация отчёта в файл JSON (.json).
- Получение и анализ информации из нескольких источников.
- Возможность пересылать журналы с помощью Filebeat.
- Поддержка анализа системных журналов.
- Поддерживается большое количество форматов: от Apache до Log4j (Java).
Ведения логов медленных запросов сервера
Анализ данного лога позволяет определить на какие типы запросов сервер отвечает долго. В идеале задержка должна составлять не более 1 секунды.
На некоторых типах оболочек (MySQL, PHP-FPM) ведение данного лога по умолчанию отключено. Процесс запуска и ведения зависит от сервера.
MySQL
Если сервер управляется с помощью MySQL, то необходимо создать каталог и сам файл для ведения журнала с помощью команд:
mkdir /var/log/mysql
touch /var/log/mysql/mysql-slow.log
Стоит изменить владельца файла, чтобы избежать дальнейших проблем с записью логов. Делается это командой:
chown mysql:mysql /var/log/mysql/mysql-slow.log
После выполнения предыдущих действий, нужно совершить вход в командную строку MySQL под учётной записью суперпользователя:
mysql -uroot -p
Для запуска и настройки ведения логов нужно последовательно ввести в терминале следующие команды:
> SET GLOBAL slow_query_log = 'ON';

> SET GLOBAL slow_launch_time = 2;

> SET GLOBAL slow_query_log_file = '/var/log/mysql/mysql-slow.log';

> FLUSH LOGS;
В примере:
- slow_query_log — запускает ведение журналов медленных запросов.
- slow_launch_time — указывает максимальную задержку отклика, после которой статистика запроса попадёт в журнал. В данном случае запись в логи происходит при преодолении откликом порога 2 секунды.
- slow_query_log_file — задаёт путь до используемого журнала.
Проверить статус и параметры ведения лога медленных запросов можно командой:
> SHOW VARIABLES LIKE '%slow%';
Выход из консоли MySQL выполняется командой:
> exit
После выполнения всех предыдущих действий, можно просмотреть логи сервера. Для этого в терминале вводится:
tail -f /var/log/mysql/mysql-slow.log
PHP-FPM
Для ведения журнала на данной оболочке, необходимо отредактировать параметры в конфигурационном файле. Для этого в терминале вводится команда:
vi /etc/php-fpm.d/www.conf
Далее нужно найти строки:
- request_slowlog_timeout = 10s — параметр, позволяющий указать задержку, с которой запись о длительном запросе попадёт в журнал.
- slowlog = /var/log/php-fpm/www-slow.log — параметр, указывающий путь до актуального файла логирования (.log).
После применения изменений, необходимо перезагрузить сервер PHP-FPM. Для этого в консоль вводится команда:
systemctl restart php-fpm
Просмотр логов запускается командой:
tail -f /var/log/php-fpm/www-slow.log
Анализ логов медленных запросов
Логи медленных запросов могут за незначительное время вырасти до огромных размеров. Для сортировки и отображения повторяющихся запросов рекомендуется использовать программу MySQLDumpSlow.
Для запуска просмотра логов с помощью этой утилиты, нужно составить команду по приведенному ниже алгоритму:
mysqldumpslow местонахождение/файла
Ведение логов в Logrotate
На больших ресурсах журналы могут достигать огромных размеров, поэтому нужно своевременно архивировать или очищать логи. С помощью утилиты Logrotate можно управлять ведением журналов: настроить период ротации (архивирование старого журнала и создание нового), период и количество хранения журналов и многое другое.
Изначально программа отсутствует в системе. Ниже приведены команды для инсталляции Logrotate из официальных репозиториев.
Ubuntu, Debian:
sudo apt install logrotate
CentOS:
sudo yum install logrotate
После установки необходимо проверить путь для будущих конфигурационных файлов. Для правильной работы они должны находится в папке «logrotate.d». Проверить данный параметр можно открыв конфигурационный файл командой:
nano /etc/logrotate.conf
В директории «RPM packages drop log rotation information into this directory» должна присутствовать строка:
include /etc/logrotate.d
Теперь создаётся конфигурационный файл «rsyslog.conf». В нём будет находиться конфигурацию по работе с логами. Для создания файла в терминале вводится команда:
sudo nano /etc/logrotate.d/rsyslog.conf
В окне терминала откроется текстовой редактор. Теперь нужно внести конфигурацию, как указано в образце. В качестве примера будет использоваться журнал посещений «Access.log» (Nginx).
/var/log/nginx/access.log {
daily
rotate 3
size 500M
compress
delaycompress
}
Теперь остаётся только запустить Logrotate. Для этого вводится команда:
sudo logrotate -d /etc/logrotate.d/rsyslog.conf
Для проверки правильности работы программы в терминале можно ввести команду:
ls /var/cron.daily/
NGINX is one of the most widely used reverse proxy servers, web servers, and load balancers. It has capabilities like TLS offloading, can do health checks for backends, and offers support for HTTP2, gRPC, WebSocket, and most TCP-based protocols.
When running a tool like NGINX, which generally sits in front of your applications, it’s important to understand how to debug issues. And because you need to see the logs, you have to understand the different NGINX logging mechanisms. In addition to the errors in your application or web server, you need to look into NGINX performance issues, as they can lead to SLA breaches, negative user experience, and more.
In this article, we’ll explore the types of logs that NGINX provides and how to properly configure them to make troubleshooting easier.
What Are NGINX Logs?
NGINX logs are the files that contain information related to the tasks performed by the NGINX server, such as who tried to access which resources and whether there were any errors or issues that occured.
NGINX provides two types of logs: access logs and error logs. Before we show you how to configure them, let’s look at the possible log types and different log levels.
Here is the most basic NGINX configuration:
http{
    server {
        listen       80;
        server_name  example.com www.example.com;
        access_log   /var/log/nginx/access.log  combined;
        root         /var/www/virtual/big.server.com/htdocs;
    }
}
For this server, we opened port 80. The server name is “example.com www.example.com.” You can see the access and error log configurations, as well as the root of the directive, which defines from where to serve the files.
What Are NGINX Access Logs?
NGINX access logs are files that have the information of all the resources that a client is accessing on the NGINX server, such as details about what is being accessed and how it responded to the requests, including client IP address, response status code, user agent, and more. All requests sent to NGINX are logged into NGINX logs just after the requests are processed.
Here are some important NGINX access log fields you should be aware of:
- remote_addr: The IP address of the client that requested the resource
- http_user_agent: The user agent in use that sent the request
- time_local: The local time zone of the server
- request: What resource was requested by the client (an API path or any file)
- status: The status code of the response
- body_bytes_sent: The size of the response in bytes
- request_time: The total time spent processing the request
- remote_user: Information about the user making the request
- http_referer: The IP address of the HTTP referer
- gzip_ratio: The compression ratio of gzip, if gzip is enabled
NGINX Access Log Location
You can find the access logs in the logs/access.log file and change their location by using the access_log directive in the NGINX configuration file.
access_log path [format [buffer=size] [gzip[=level]] [flush=time] [if=condition]];
access_log /var/log/nginx/access.log combined
By changing the path field in the access_log directive, you can also change where you want to save your access logs.
An NGINX access log configuration can be overridden by another configuration at a lower level. For example:
http {
  access_log  /var/log/nginx/access.log  main;
  server {
    listen 8000;
    location /health {
      access_log off; # <----- this WILL work
      proxy_pass http://app1server;
    }
  }
}
Here, any calls to /health will not be logged, as the access logs are disabled for this path. All the other calls will be logged to the access log. There is a global config, as well as different local configs. The same goes for the other configurations that are in the NGINX config files.
How to Enable NGINX Access Logs
Most of the time, NGINX access logs are enabled by default. To enable them manually, you can use the access_log directive as follows:
access_log /var/log/nginx/access.log combined
The first parameter is the location of the file, and the second is the log format. If you put the access_log directive in any of the server directories, it will start the access logging.
Setting Up NGINX Custom Log Format
To easily predefine the NGINX access log format and use it along with the access_log directive, use the log_format directive:
log_format upstream_time '$remote_addr - $remote_user [$time_local] '
    '"$request" $status $body_bytes_sent '
    '"$http_referer" "$http_user_agent"'
    'rt=$request_time uct="$upstream_connect_time" uht="$upstream_header_time" urt="$upstream_response_time"';
Most of the fields here are self explanatory, but if you want to learn more, look up NGINX configurations for logging. You can specify the log formats in an HTTP context in the /etc/nginx/nginx.conf file and then use them in a server context.
By default, NGINX access logs are written in a combined format, which looks something like this:
log_format combined '$remote_addr - $remote_user [$time_local] '
                    '"$request" $status $body_bytes_sent '
                    '"$http_referer" "$http_user_agent"';
Once you have defined the log formats, you can use them with the access_log directive, like in the following examples:
server {
    access_log /var/log/nginx/access.log combined
    access_log /var/log/nginx/access.log upstream_time #defined in the first format
    …
}
Formatting the Logs as JSON
Logging to JSON is useful when you want to ship the NGINX logs, as JSON makes log parsing very easy. Since you have key-value information, it will be simpler for the consumer to understand. Otherwise, the parse has to understand the format NGINX is logging.
NGINX 1.11.8 comes with an escape=json setting, which helps you define the NGINX JSON log format. For example:
log_format json_combined escape=json
  '{'
    '"time_local":"$time_local",'
    '"remote_addr":"$remote_addr",'
    '"remote_user":"$remote_user",'
    '"request":"$request",'
    '"status": "$status",'
    '"body_bytes_sent":"$body_bytes_sent",'
    '"http_referrer":"$http_referer",'
    '"http_user_agent":"$http_user_agent",'
    '"request_time":"$request_time"'
  '}';
You can now use this predefined log format in JSON with the access_log directive to get the logs in JSON.
You can also use an open-source NGINX module, like https://github.com/jiaz/nginx-http-json-log, to do the JSON logging.
Configuring NGINX Conditional Logging
Sometimes, you want to write logs only when a certain condition is met. NGINX calls this conditional logging. For example:
map $remote_addr $log_enable {
    "192.168.4.1" 0;
    "192.168.4.2" 0;
    "192.168.4.3" 0;
    "192.168.4.4" 0;
    default 1;
}
access_log /var/log/nginx/access.log combined if=$log_enable
This means that whenever the request comes from the IPs 192.168.4.1 to 192.168.4.4, the access logs will not be populated. For every other IP, the logs will be recorded.
You can use conditional logging with NGINX in multiple scenarios. For example, if you are under attack and can identify the IPs of the attacker, you can log the requests to a different file. This allows you to process the file and get relevant information about the attack later.
How to View NGINX Access Logs
Linux utilities, like LESS or TAIL, allow you to view NGINX logs easily. You can also see the NGINX access logs’ location from the configuration files. With newer systems that are running systemd, the journalctl feature can tail the logs. To see the logs, use this command:
journalctl -fu nginx.service
You can also tail the log locations, as shown here:
tail -f /var/log/nginx/access.log
It’s also possible to use journalctl, but this will show all the logs together, which can be a bit confusing.
How to Disable Access Logs
To disable an NGINX access log, pass the off argument to the access_log directive:
access_log off;
This can be useful when there are too many logs, which can overload the disk IO and, in rare cases, impact the performance of your NGINX server. However, disabling NGINX access logs is not usually recommended, as it can make troubleshooting difficult.
What Are NGINX Error Logs?
NGINX error logs are the files where all information about errors will be logged, including permission errors or any NGINX configuration-related access errors. While access logs are used to see the HTTP requests received by the server, error logs bring more value, as when there is an issue, they will show exactly what happened and provide detailed information about the issue.
Whenever there is an error with the requests, or when there are NGINX glitches, these issues will be recorded in the error log files configured in the NGINX configuration file.
Where Are the NGINX Error Logs Stored?
The location of NGINX error logs can be configured in the error_log directive in the NGINX configuration. By default, these logs are in the /var/log/nginx directory. You can configure the location separately for different server components that you can run in the NGINX configuration.
The default location is:
/var/log/nginx/error.log
NGINX Error Logs Configuration
NGINX error logs configuration is in the same place as access_log. You can use the error_log directive to enable and configure the log levels and the location of the log file. Here is the configuration line to enable the error_log:
error_log log_file_location log_level;
NGINX Error Log Levels
NGINX has eight log levels for different degrees of severity and verbosity:
- emerg: These are the emergency logs. They mean that the system is unusable.
- alert: An immediate action is required.
- crit: A critical condition occurred.
- error: An error or failure occurred while processing a request.
- warn: There was an unexpected event, or something needs to be fixed, but NGINX fulfilled the request as expected.
- notice: Something normal, but important, has happened, and it needs to be noted.
- info: These are messages that give you information about the process.
- debug: These are messages that help with debugging and troubleshooting. They are generally not enabled unless needed because they create a lot of noise.
Note that the log_level parameter is a threshold, as every log level includes the previous log levels as well. For example, if your log level is 6 (notice), your logs will contain entries from levels 1 through 6.
Enable Debug Logging and Other Levels
You can specify the log level with the error_log directive using the log_level argument. As the log level number increases, the logs will contain more information. If the application misbehaves, you can enable the debug logs to aid you in the troubleshooting process. With the extra information they provide, you will be able to pinpoint the issue more easily. You can read about this more in the NGINX documentation.
Keeping NGINX debug logs enabled continuously is not recommended, as it will make logs very noisy and large by printing information that is generally unnecessary. If you see an issue, you can change the log level on the fly, solve the problem, then revert it back to a stricter severity.
Logging to Multiple Files
You can forward NGINX error logs to separate files based on the different log levels. In the configuration below, you send logs to all the specified log directives based on the log severity level.
error_log /var/log/nginx/error.info info;
error_log /var/log/nginx/error.crit crit;
This configuration can be very useful when looking at the different log levels separately or if you want your logging agent to label these logs based on filenames. You can selectively discard the error logs based on their severity.
How to Check NGINX Error Logs
You can view NGINX error logs the same way as access logs: for example, by using TAIL, LESS, or other utilities. Below is an example of how to do it with TAIL using the location of the error_logs that you have set. These logs are also present in journalctl logs, but there, they will be a combination of access_log and error_logs.
tail -f /var/log/nginx/error.log
How to Disable Error Logs
Disabling NGINX error logs can be tricky, as there is no off option in error_log. Similar to access_log in the lower configuration levels, you can use error_log false at the higher level configurations.
error_log off;
For the lower levels, you can forward the logs to /dev/null:
error_log /dev/null;
How to Send NGINX Logs to Syslog
NGINX can also ship your logs to log aggregators using syslog. This can be useful when you are logging other system/service logs in syslog or using syslog to export the logs. You can implement this with the syslog: prefix, which can be used with both access_log and error_logs. You can also use this prefix instead of the file path in the access_log and error_log directives.
Syslog can help you concentrate your NGINX logs in one place by forwarding them to a centralized logging solution:
error_log syslog:unix/var/log/nginx.sock debug
You can also send the logs to different syslog servers by defining the syslog server parameter to point to the IP or hostname and port of the syslog server.
error_log syslog:server=192.168.100.1 debug
access_log syslog:server=[127.0.0.1]:9992, facility=local1,tag=nginx,severity=debug;
In the above configuration for access_log, the logs are forwarded to the local syslog server, with the service name as local1, since syslog doesn’t have an option for NGINX.
Syslog has various options for keeping the forwarded logs segregated:
- Facility: Identifies who is logging to syslog.
- Severity: Specifies the log levels.
- Tag: Identifies the message sender or any other information that you want to send; default is NGINX.
NGINX Logging in Kubernetes Environments
In Kubernetes, NGINX Ingress runs as a pod. All the logs for the NGINX Ingress pods are sent to standard output and error logs. However, if you want to see the logs, you have to log in to the pod or use the kubectl commands, which is not a very practical solution.
You also have to find a way to ship the logs from the containers. You can do this with any logging agent that is running in the Kubernetes environment. These agents run as pods and mount the file system that NGINX runs on, reading the logs from there.
How to See the NGINX Ingress Logs
Use the kubectl logs command to see the NGINX logs as streams:
$ kubectl logs -f nginx-ingress-pod-name -n namespace.
It’s important to understand that pods can come and go, so the approach to debugging issues in the Kubernetes environment is a bit different than in VM or baremetal-based environments. In Kubernetes, the logging agent should be able to discover the NGINX Ingress pods, then scrape the logs from there. Also, the log aggregator should show the logs of the pods that were killed and discover any new pod that comes online.
NGINX Logging and Analysis with Sematext
NGINX log integration with Sematext
Sematext Logs is a log aggregation and management tool with great support for NGINX logs. Its auto-discovery feature is helpful, particularly when you have multiple machines. Simply create an account with Sematext, create the NGINX Logs App and install the Sematext Agent. Once you’re set up, you get pre-built, out-of-the-box dashboards and the option to build your own custom dashboards.
Sematext Logs is part of Sematext Cloud, a full-stack monitoring solution that gives you all you need when it comes to observability. By correlating NGINX logs and metrics, you’ll get a more holistic view of your infrastructure, which helps you identify and solve issues quickly.
Using anomaly-detection algorithms, Sematext Cloud informs you in advance of any potential issues. These insights into your infrastructure help you prevent issues and troubleshoot more efficiently. With Sematext Cloud, you can also collect logs and metrics from a wide variety of tools, including HAProxy, Apache Tomcat, JVM, and Kubernetes. By integrating with other components of your infrastructure, this tool is a one-stop solution for all your logging and monitoring needs.
If you’d like to learn more about Sematext Logs, and how they can help you manage your NGINX logs, then check out this short video below:
If you’re interested in how Sematext compares to other log management tools, read our review of the top NGINX log analyzers.
Conclusion
Managing, troubleshooting, and debugging large-scale NGINX infrastructures can be challenging, especially if you don’t have a proper way of looking into logs and metrics. It’s important to understand NGINX access and error logs, but if you have hundreds of machines, this will take a substantial amount of time. You need to be able to see the logs aggregated in one place.
Performance issues are also more common than you think. For example, you may not see anything in the error logs, but your APIs continue to degrade. To look into this properly, you need effective dashboarding around NGINX performance metrics, like response code and response time.
Sematext Logs can help you tackle these problems so you can troubleshoot more quickly. Sign up for our free trial today.
Author Bio

Gaurav Yadav
Gaurav has been involved with systems and infrastructure for almost 6 years now. He has expertise in designing underlying infrastructure and observability for large-scale software. He has worked on Docker, Kubernetes, Prometheus, Mesos, Marathon, Redis, Chef, and many more infrastructure tools. He is currently working on Kubernetes operators for running and monitoring stateful services on Kubernetes. He also likes to write about and guide people in DevOps and SRE space through his initiatives Learnsteps and Letusdevops.
(britespanbuildings)
In this tutorial, you will learn everything you need to know about logging in
NGINX and how it can help you troubleshoot and quickly resolve any problem you
may encounter on your web server. We will discuss where the logs are stored and
how to access them, how to customize their format, and how to centralize them in
one place with Syslog or a log management service.
Here’s an outline of what you will learn by following through with this tutorial:
- Where NGINX logs are stored and how to access them.
- How to customize the NGINX log format and storage location to fit your needs.
- How to utilize a structured format (such as JSON) for your NGINX logs.
- How to centralize NGINX logs through Syslog or a managed cloud-based service.
Prerequisites
To follow through with this tutorial, you need the following:
- A Linux server that includes a non-root user with
sudoprivileges. We tested
the commands shown in this guide on an Ubuntu 20.04 server. - The
NGINX web server installed
and enabled on your server.
🔭 Want to centralize and monitor your NGINX logs?
Head over to Logtail and start ingesting your logs in 5 minutes.
Step 1 — Locating the NGINX log files
NGINX writes logs of all its events in two different log files:
- Access log: this file contains information about incoming requests and
user visits. - Error log: this file contains information about errors encountered while
processing requests, or other diagnostic messages about the web server.
The location of both log files is dependent on the host operating system of the
NGINX web server and the mode of installation. On most Linux distributions, both
files will be found in the /var/log/nginx/ directory as access.log and
error.log, respectively.
A typical access log entry might look like the one shown below. It describes an
HTTP GET request to the server for a favicon.ico file.
Output
217.138.222.101 - - [11/Feb/2022:13:22:11 +0000] "GET /favicon.ico HTTP/1.1" 404 3650 "http://135.181.110.245/" "Mozilla/5.0 (Windows NT 10.0; Win64; x64) AppleWebKit/537.36 (KHTML, like Gecko) Chrome/98.0.4758.87 Safari/537.36" "-"
Similarly, an error log entry might look like the one below, which was generated
due to the inability of the server to locate the favicon.ico file that was
requested above.
Output
2022/02/11 13:12:24 [error] 37839#37839: *7 open() "/usr/share/nginx/html/favicon.ico" failed (2: No such file or directory), client: 113.31.102.176, server: _, request: "GET /favicon.ico HTTP/1.1", host: "192.168.110.245:80"
In the next section, you’ll see how to view both NGINX log files from the
command line.
Step 2 — Viewing the NGINX log files
Examining the NGINX logs can be done in a variety of ways. One of the most
common methods involves using the tail command to view logs entries in
real-time:
sudo tail -f /var/log/nginx/access.log
You will observe the following output:
Output
107.189.10.196 - - [14/Feb/2022:03:48:55 +0000] "POST /HNAP1/ HTTP/1.1" 404 134 "-" "Mozila/5.0"
35.162.122.225 - - [14/Feb/2022:04:11:57 +0000] "GET /.env HTTP/1.1" 404 162 "-" "Mozilla/5.0 (Windows NT 10.0; Win64; x64; rv:58.0) Gecko/20100101 Firefox/58.0"
45.61.172.7 - - [14/Feb/2022:04:16:54 +0000] "GET /.env HTTP/1.1" 404 197 "-" "Mozilla/5.0 (X11; Linux x86_64) AppleWebKit/537.36 (KHTML, like Gecko) Chrome/81.0.4044.129 Safari/537.36"
45.61.172.7 - - [14/Feb/2022:04:16:55 +0000] "POST / HTTP/1.1" 405 568 "-" "Mozilla/5.0 (X11; Linux x86_64) AppleWebKit/537.36 (KHTML, like Gecko) Chrome/81.0.4044.129 Safari/537.36"
45.137.21.134 - - [14/Feb/2022:04:18:57 +0000] "GET /dispatch.asp HTTP/1.1" 404 134 "-" "Mozilla/5.0 (iPad; CPU OS 7_1_2 like Mac OS X; en-US) AppleWebKit/531.5.2 (KHTML, like Gecko) Version/4.0.5 Mobile/8B116 Safari/6531.5.2"
23.95.100.141 - - [14/Feb/2022:04:42:23 +0000] "HEAD / HTTP/1.0" 200 0 "-" "-"
217.138.222.101 - - [14/Feb/2022:07:38:40 +0000] "GET /icons/ubuntu-logo.png HTTP/1.1" 404 197 "http://168.119.119.25/" "Mozilla/5.0 (Windows NT 10.0; Win64; x64) AppleWebKit/537.36 (KHTML, like Gecko) Chrome/98.0.4758.87 Safari/537.36"
217.138.222.101 - - [14/Feb/2022:07:38:42 +0000] "GET /favicon.ico HTTP/1.1" 404 197 "http://168.119.119.25/" "Mozilla/5.0 (Windows NT 10.0; Win64; x64) AppleWebKit/537.36 (KHTML, like Gecko) Chrome/98.0.4758.87 Safari/537.36"
217.138.222.101 - - [14/Feb/2022:07:44:02 +0000] "GET / HTTP/1.1" 304 0 "-" "Mozilla/5.0 (Windows NT 10.0; Win64; x64) AppleWebKit/537.36 (KHTML, like Gecko) Chrome/98.0.4758.87 Safari/537.36"
217.138.222.101 - - [14/Feb/2022:07:44:02 +0000] "GET /icons/ubuntu-logo.png HTTP/1.1" 404 197 "http://168.119.119.25/" "Mozilla/5.0 (Windows NT 10.0; Win64; x64) AppleWebKit/537.36 (KHTML, like Gecko) Chrome/98.0.4758.87 Safari/537.36"
The tail command prints the last 10 lines from the selected file. The -f
option causes it to continue displaying subsequent lines that are added to the
file in real-time.
To examine the entire contents of an NGINX log file, you can use the cat
command or open it in your text editor:
sudo cat /var/log/nginx/error.log
If you want to filter the lines that contain a specific term, you can use the
grep command as shown below:
sudo grep "GET /favicon.ico" /var/log/nginx/access.log
The command above will print all the lines that contain GET /favicon.ico so we
can see how many requests were made for that resource.
Step 3 — Configuring NGINX access logs
The NGINX access log stores data about incoming client requests to the server
which is beneficial when deciphering what users are doing in the application,
and what resources are being requested. In this section, you will learn how to
configure what data is stored in the access log.
One thing to keep in mind while following through with the instructions below is
that you’ll need to restart the nginx service after modifying the config file
so that the changes can take effect.
sudo systemctl restart nginx
Enabling the access log
The NGINX access Log should be enabled by default. However, if this is not the
case, you can enable it manually in the Nginx configuration file
(/etc/nginx/nginx.conf) using the access_log directive within the http
block.
Output
http {
  access_log /var/log/nginx/access.log;
}
This directive is also applicable in the server and location configuration
blocks for a specific website:
Output
server {
   access_log /var/log/nginx/app1.access.log;

  location /app2 {
    access_log /var/log/nginx/app2.access.log;
  }
}
Disabling the access log
In cases where you’d like to disable the NGINX access log, you can use the
special off value:
You can also disable the access log on a virtual server or specific URIs by
editing its server or location block configuration in the
/etc/nginx/sites-available/ directory:
Output
server {
  listen 80;

  access_log off;

  location ~* .(woff|jpg|jpeg|png|gif|ico|css|js)$ {
    access_log off;
  }
}
Logging to multiple access log files
If you’d like to duplicate the access log entries in separate files, you can do
so by repeating the access_log directive in the main config file or in a
server block as shown below:
Output
access_log /var/log/nginx/access.log;
access_log /var/log/nginx/combined.log;
Don’t forget to restart the nginx service afterward:
sudo systemctl restart nginx
Explanation of the default access log format
The access log entries produced using the default configuration will look like
this:
Output
127.0.0.1 alice Alice [07/May/2021:10:44:53 +0200] "GET / HTTP/1.1" 200 396 "-" "Mozilla/5.0 (Windows NT 10.0; Win64; x64) AppleWebKit/537.36 (KHTML, like Gecko) Chrome/90.0.4531.93 Safari/537.36"
Here’s a breakdown of the log message above:
127.0.0.1: the IP address of the client that made the request.alice: remote log name (name used to log in a user).Alice: remote username (username of logged-in user).[07/May/2021:10:44:53 +0200]: date and time of the request."GET / HTTP/1.1": request method, path and protocol.200: the HTTP response code.396: the size of the response in bytes."-": the IP address of the referrer (-is used when the it is not
available)."Mozilla/5.0 (Windows NT 10.0; Win64; x64) AppleWebKit/537.36 (KHTML, like Gecko) Chrome/90.0.4531.93 Safari/537.36"—
detailed user agent information.
Step 4 — Creating a custom log format
Customizing the format of the entries in the access log can be done using the
log_format directive, and it can be placed in the http, server or
location blocks as needed. Here’s an example of what it could look like:
Output
log_format custom '$remote_addr - $remote_user [$time_local] ' '"$request" $status $body_bytes_sent ' '"$http_referer" "$http_user_agent"';
This yields a log entry in the following format:
Output
217.138.222.109 - - [14/Feb/2022:10:38:35 +0000] "GET /favicon.ico HTTP/1.1" 404 197 "http://192.168.100.1/" "Mozilla/5.0 (Windows NT 10.0; Win64; x64) AppleWebKit/537.36 (KHTML, like Gecko) Chrome/98.0.4758.87 Safari/537.36"
The syntax for configuring an access log format is shown below. First, you need
to specify a nickname for the format that will be used as its identifier, and
then the log format string that represents the details and formatting for each
log message.
Output
log_format <nickname> '<formatting_variables>';
Here’s an explanation of each variable used in the custom log format shown
above:
$remote_addr: the IP address of the client$remote_user: information about the user making the request$time_local: the server’s date and time.$request: actual request details like path, method, and protocol.$status: the response code.$body_bytes_sent: the size of the response in bytes.$http_referer: the IP address of the HTTP referrer.$http_user_agent: detailed user agent information.
You may also use the following variables in your custom log format
(see here for the complete list):
$upstream_connect_time: the time spent establishing a connection with an
upstream server.$upstream_header_time: the time between establishing a connection and
receiving the first byte of the response header from the upstream server.$upstream_response_time: the time between establishing a connection and
receiving the last byte of the response body from the upstream server.$request_time: the total time spent processing a request.$gzip_ratio: ration of gzip compression (if gzip is enabled).
After you create a custom log format, you can apply it to a log file by
providing a second parameter to the access_log directive:
Output
access_log /var/log/nginx/access.log custom;
You can use this feature to log different information in to separate log files.
Create the log formats first:
Output
log_format custom '$remote_addr - $remote_user [$time_local] ' '"$request" $status $body_bytes_sent ' '"$http_referer"';
log_format agent "$http_user_agent";
Then, apply them as shown below:
Output
access_log /var/log/nginx/access.log custom;
access_log /var/log/nginx/agent_access.log agent;
This configuration ensures that user agent information for all incoming requests
are logged into a separate access log file.
Step 5 — Formatting your access logs as JSON
A common way to customize NGINX access logs is to format them as JSON. This is
quite straightforward to achieve by combining the log_format directive with
the escape=json parameter introduced in Nginx 1.11.8 to escape characters that
are not valid in JSON:
Output
log_format custom_json escape=json
  '{'
    '"time_local":"$time_local",'
    '"remote_addr":"$remote_addr",'
    '"remote_user":"$remote_user",'
    '"request":"$request",'
    '"status": "$status",'
    '"body_bytes_sent":"$body_bytes_sent",'
    '"request_time":"$request_time",'
    '"http_referrer":"$http_referer",'
    '"http_user_agent":"$http_user_agent"'
  '}';
After applying the custom_json format to a log file and restarting the nginx
service, you will observe log entries in the following format:
{
  "time_local": "14/Feb/2022:11:25:44 +0000",
  "remote_addr": "217.138.222.109",
  "remote_user": "",
  "request": "GET /icons/ubuntu-logo.png HTTP/1.1",
  "status": "404",
  "body_bytes_sent": "197",
  "request_time": "0.000",
  "http_referrer": "http://192.168.100.1/",
  "http_user_agent": "Mozilla/5.0 (Windows NT 10.0; Win64; x64) AppleWebKit/537.36 (KHTML, like Gecko) Chrome/98.0.4758.87 Safari/537.36"
}
Step 6 — Configuring NGINX error logs
Whenever NGINX encounters an error, it stores the event data in the error log so
that it can be referred to later by a system administrator. This section will
describe how to enable and customize the error logs as you see fit.
Enabling the error log
The NGINX error log should be enabled by default. However, if this is not the
case, you can enable it manually in the relevant NGINX configuration file
(either at the http, server, or location levels) using the error_log
directive.
Output
error_log /var/log/nginx/error.log;
The error_log directive can take two parameters. The first one is the location
of the log file (as shown above), while the second one is optional and sets the
severity level of the log. Events with a lower severity level than set one will
not be logged.
Output
error_log /var/log/nginx/error.log info;
These are the possible levels of severity (from lowest to highest) and their
meaning:
debug: messages used for debugging.info: informational messages.notice: a notable event occurred.warn: something unexpected happened.error: something failed.crit: critical conditions.alert: errors that require immediate action.emerg: the system is unusable.
Disabling the error log
The NGINX error log can be disabled by setting the error_log directive to
off or by redirecting it to /dev/null:
Output
error_log off;
error_log /dev/null;
Logging errors into multiple files
As is the case with access logs, you can log errors into multiple files, and you
can use different severity levels too:
Output
error_log /var/log/nginx/error.log info;
error_log /var/log/nginx/emerg_error.log emerg;
This configuration will log every event except those at the debug level event
to the error.log file, while emergency events are placed in a separate
emerg_error.log file.
Step 7 — Sending NGINX logs to Syslog
Apart from logging to a file, it’s also possible to set up NGINX to transport
its logs to the syslog service especially if you’re already using it for other
system logs. Logging to syslog is done by specifying the syslog: prefix to
either the access_log or error_log directive:
Output
error_log  syslog:server=unix:/var/log/nginx.sock debug;
access_log syslog:server=[127.0.0.1]:1234,facility=local7,tag=nginx,severity=info;
Log messages are sent to a server which can be specified in terms of a domain
name, IPv4 or IPv6 address or a UNIX-domain socket path.
In the example above, error log messages are sent to a UNIX domain socket at the
debug logging level, while the access log is written to a syslog server with
an IPv4 address and port 1234. The facility= parameter specifies the type of
program that is logging the message, the tag= parameter applies a custom tag
to syslog messages, and the severity= parameter sets the severity level of
the syslog entry for access log messages.
For more information on using Syslog to manage your logs, you can check out our
tutorial on viewing and configuring system logs on
Linux.
Step 8 — Centralizing your NGINX logs
In this section, we’ll describe how you can centralize your NGINX logs in a log
management service through Vector, a
high-performance tool for building observability pipelines. This is a crucial
step when administrating multiple servers so that you can monitor all your logs
in one place (you can also centralize your logs with an Rsyslog
server).
The following instructions assume that you’ve signed up for a free
Logtail account and retrieved your source
token. Go ahead and follow the relevant
installation instructions for Vector
for your operating system. For example, on Ubuntu, you may run the following
commands to install the Vector CLI:
curl -1sLf  'https://repositories.timber.io/public/vector/cfg/setup/bash.deb.sh'  | sudo -E bash
$ sudo apt install vector
After Vector is installed, confirm that it is up and running through
systemctl:
You should observe that it is active and running:
Output
● vector.service - Vector
     Loaded: loaded (/lib/systemd/system/vector.service; enabled; vendor preset: enabled)
     Active: active (running) since Tue 2022-02-08 10:52:59 UTC; 48s ago
       Docs: https://vector.dev
    Process: 18586 ExecStartPre=/usr/bin/vector validate (code=exited, status=0/SUCCESS)
   Main PID: 18599 (vector)
      Tasks: 3 (limit: 2275)
     Memory: 6.8M
     CGroup: /system.slice/vector.service
             └─18599 /usr/bin/vector
Otherwise, go ahead and start it with the command below.
sudo systemctl start vector
Afterward, change into a root shell and append your Logtail vector configuration
for NGINX into the /etc/vector/vector.toml file using the command below. Don’t
forget to replace the <your_logtail_source_token> placeholder below with your
source token.
sudo -s
$ wget -O ->> /etc/vector/vector.toml
    https://logtail.com/vector-toml/nginx/<your_logtail_source_token>
Then restart the vector service:
sudo systemctl restart vector
You will observe that your NGINX logs will start coming through in Logtail:
Conclusion
In this tutorial, you learned about the different types of logs that the NGINX
web server keeps, where you can find them, how to understand their formatting.
We also discussed how to create your own custom log formats (including a
structured JSON format), and how to log into multiple files at once. Finally, we
demonstrated the process of sending your logs to Syslog or a log management
service so that you can monitor them all in one place.
Thanks for reading, and happy logging!
Centralize all your logs into one place.
Analyze, correlate and filter logs with SQL.
Create actionable
dashboards.
Share and comment with built-in collaboration.
Got an article suggestion?
Let us know
![]()
![]()
![]()
Next article
How to Get Started with Logging in Node.js
Learn how to start logging with Node.js and go from basics to best practices in no time.
→
![]()
This work is licensed under a Creative Commons Attribution-NonCommercial-ShareAlike 4.0 International License.
Содержание
- Support
- Configuring the Nginx Error Log and Access Log
- What is an Nginx error log?
- Nginx error log severity levels
- What is an Nginx access log?
- Parsing logs examples
- Supercharge your content delivery рџљЂ
- Команда Tail в Linux
- Linux Tail Command
- В этом уроке мы покажем вам, как использовать хвостовую команду Linux, на практических примерах и подробных объяснениях наиболее распространенных опций хвоста.
- Синтаксис хвостовой команды
- Как использовать команду Tail
- Как отобразить определенное количество строк
- Как отобразить определенное количество байтов
- Как посмотреть файл на предмет изменений
- Как отобразить несколько файлов
- Как использовать хвост с другими командами
- Вывод
- Просмотр и анализ логов сайта на Linux сервере
- Сейчас читают:
- Важные логи сайта
- Расположение логов
- Стандартные пути до Error.log
- Nginx
- Php-Fpm
- Apache (CentOS)
- Apache (Ubuntu, Debian)
- Стандартные пути до Access.log
- Nginx
- Php-Fpm
- Apache (CentOS)
- Apache (Ubuntu, Debian)
- Чтение записей в логах
- Примеры записей
- Error.log
- Access.log
- Просмотр логов сервера с помощью команды tail
- Первый вариант использования Tail
- Второй вариант использования Tail
- Аналог команды Tail
- Изменение стандартного количества строк для вывода
- Просмотр логов с помощью ISPManager
- Программы для анализа логов
- Статические программы
- WebLog Expert
- Web Log Explorer
- Программы для анализа в режиме реального времени
- GoAccess
- Logstash
- Ведения логов медленных запросов сервера
- MySQL
- PHP-FPM
- Анализ логов медленных запросов
- Ведение логов в Logrotate
Support
Find answers, guides, and tutorials to supercharge your content delivery.
Configuring the Nginx Error Log and Access Log
Logs are a very useful aspect of web server administration and web development as they provide useful debugging information and allow you to analyze other aspects of your web server. This article will go through the process of configuring both your Nginx error log and access log files as well as display a few ways to read each file directly from the terminal.
What is an Nginx error log?
Nginx error logs are used to log general error messages. If you experience an error in your web application, it is always good practice to check the Nginx error log file to see if there is any additional information as to why the error occurred. The error_log directive can be defined in your nginx.conf file. The directive will be in the following format and can be specified within an http, server, or location block:
The error_log portion defines the directive, the log_file portion defines the absolute path of your log file, and the log_level portion defines the severity level for which you want error messages to be logged. Therefore, an example of what the directive looks like when each portion is populated will resemble:
When defining the severity level, Nginx will log all errors that are equal to or above the defined level.
Nginx error log severity levels
The are various severity levels that can be defined in the error_log directive. The following is a list of all severity levels (from low to high) you may use along with a short description of each.
- debug — Useful debugging information to help determine where the problem lies.
- info — Informational messages that aren’t necessary to read but may be good to know.
- notice — Something normal happened that is worth noting.
- warn — Something unexpected happened, however is not a cause for concern.
- error — Something was unsuccessful.
- crit — There are problems that need to be critically addressed.
- alert — Prompt action is required.
- emerg — The system is in an unusable state and requires immediate attention.
As mentioned above, once you define the severity level in the error_log directive, Nginx will include all errors corresponding to said severity level as well as everything higher. For instance, in the example above we defined the severity level as warn. Therefore, Nginx would include all warn , error , crit , alert , and emerg errors in the error log.
What is an Nginx access log?
The Nginx access log is similar to the error log in that it logs information, however the type of information that it logs is what differentiates it. Nginx writes information in the access log regarding each request made by a client. The access_log directive uses the following syntax:
The access_log portion defines the directive, the log_file portion defines the location of the access.log file, the log_format portion can be defined using variables (default format is combined). Read the Nginx logging and monitoring article for more information regarding log_format . The following shows an example of what the combined log_format looks like:
Therefore, when defining each portion of the access log directive, it may resemble the following:
Parsing logs examples
There are various ways you can use to display or parse the error/access logs. Using the cat command will display the complete access or error log file in your terminal window. For example you could use the following to display the contents of each file:
- cat /var/log/nginx/error.log
- cat /var/log/nginx/access.log
Alternatively, you could use the tail -f command to display the 10 most recent lines of the file and monitor the file for any additional changes.
- tail -f /var/log/nginx/error.log
- tail -f /var/log/nginx/access.log
Additionally, you may use an awk command to display the number of responses that returned a particular status code. For example:
We can then display the URLs which are returning a particular status code.
Checking your web server’s logs is a great way to help debug a particular problem or analyze a particular pattern. As shown above, this can be one manually however you can also use tools such as GoAccess to also monitor and analyze your Nginx logs.
Now that you have more information regarding what the Nginx error log and access logs are for, try using them the next time you need certain information regarding your web server.
Supercharge your content delivery рџљЂ
Try KeyCDN with a free 14 day trial, no credit card required.
Источник
Команда Tail в Linux
Linux Tail Command
В этом уроке мы покажем вам, как использовать хвостовую команду Linux, на практических примерах и подробных объяснениях наиболее распространенных опций хвоста.

Команда tail отображает последнюю часть (по умолчанию 10 строк) одного или нескольких файлов или переданных данных. Он также может быть использован для мониторинга изменений файла в режиме реального времени.
Одним из наиболее распространенных применений команды tail является просмотр и анализ журналов и других файлов, которые со временем меняются, обычно в сочетании с другими инструментами, такими как grep .
Синтаксис хвостовой команды
Прежде чем перейти к использованию команды tail, давайте начнем с рассмотрения основного синтаксиса.
Выражения команды tail принимают следующую форму:
- OPTION — хвостовые варианты . Мы рассмотрим наиболее распространенные варианты в следующих разделах.
- FILE — Ноль или более имен входных файлов. Если FILE не указан или если FILE установлен — , tail будет читать стандартный ввод.
Как использовать команду Tail
В простейшем виде, когда используется без какой-либо опции, команда tail отображает последние 10 строк.
Как отобразить определенное количество строк
Используйте опцию -n ( —lines ), чтобы указать количество отображаемых строк:
Вы также можете опустить букву n и использовать только дефис ( — ) и число (без пробелов между ними).
Для отображения последних 50 строк имени файла filename.txt вы должны использовать:
В следующем примере будет показан тот же результат, что и в приведенных выше командах:
Как отобразить определенное количество байтов
Для отображения определенного количества байтов используйте опцию -c ( —bytes ).
Например, для отображения последних 500 байтов данных из названного файла filename.txt вы должны использовать:
Вы также можете использовать суффикс множителя после числа, чтобы указать количество отображаемых байтов. b умножает его на 512, kB умножает на 1000, K умножает на 1024, MB умножает на 1000000, M умножает на 1048576 и т. д.
Следующая команда отобразит последние два килобайта (2048) файла filename.txt :
Как посмотреть файл на предмет изменений
Чтобы отслеживать файл на наличие изменений, используйте параметр -f ( —follow ):
Эта опция особенно полезна для мониторинга файлов журнала. Например, чтобы отобразить последние 10 строк /var/log/nginx/error.log файла и отслеживать файл на наличие обновлений, вы будете использовать:
Чтобы прервать команду tail во время просмотра файла, нажмите Ctrl+C .
Чтобы продолжить мониторинг файла при его воссоздании, используйте -F опцию.
Эта опция полезна в ситуациях, когда команда tail следит за вращающимся файлом журнала. При использовании с -F опцией команда tail снова откроет файл, как только он снова станет доступным.
Как отобразить несколько файлов
Если несколько файлов предоставлены в качестве входных данных для команды tail, она будет отображать последние десять строк из каждого файла.
Вы можете использовать те же параметры, что и при отображении одного файла.
Этот пример показывает последние 20 строк файлов filename1.txt и filename2.txt :
Как использовать хвост с другими командами
Команда tail может использоваться в сочетании с другими командами, перенаправляя стандартный вывод из / в другие утилиты, используя каналы.
Например, чтобы отслеживать файл журнала доступа apache и отображать только те строки, которые содержат IP-адрес, который 192.168.42.12 вы используете:
Следующая ps команда отобразит десятку запущенных процессов, отсортированных по загрузке процессора:
Вывод
К настоящему времени вы должны хорошо понимать, как использовать хвостовую команду Linux. Он дополняет команду head, которая печатает первые строки файла на терминал.
Источник
Просмотр и анализ логов сайта на Linux сервере
Сейчас читают:
Содержание:
Логи сайта — это системные журналы, позволяющие получить информацию о посещении сайта ботами и пользователями, а также выявить скрытые проблемы на сервере — ошибки, битые ссылки, медленные запросы от сервера и многое другое.
Важные логи сайта
- Access.log — логи посещений пользователей и ботов. Позволяет составить более точную и подробную статистику, нежели сторонние ресурсы, выполняющие внешнее сканирование сайта и отправляющие ряд ненужных запросов серверу. Благодаря данному логу можно получить информацию об используемом браузере и IP-адрес посетителя, данные о местонахождении клиента (страна и город) и многое другое. Стоит обратить внимание, если сайт имеет высокую посещаемость, то анализ логов сервера потребует больше времени. Поэтому для составления статистики стоит использовать специализированные программы (анализаторы).
- Error.log — программные ошибки сервера. Стоит внимательно отнестись к анализу данного лога, ведь боты поисковиков, сканируя, получают все данные о работе сайта. При обнаружении большого количества ошибок, сайт может попасть под санкции поисковых систем. В свою очередь из записей данного журнала можно узнать точную дату и время ошибки, IP-адрес получателя, тип и описание ошибки.
- Slow.log (название зависит от используемой оболочки сервера) — в данный журнал записываются медленные запросы сервера. Так принято обозначать запросы с повышенным порогом задержки, выданные пользователю. Этот журнал позволяет выявить слабые места сервера и исправить проблему. Ниже будет рассмотрен способ включить ведение данного лога на разных типах серверов, а также настройка задержки, с которой записи будут заноситься в файл.
Расположение логов
Важно обратить внимание, что местоположение логов сайта по умолчанию зависит от используемого типа оболочки и может быть изменено администратором.
Стандартные пути до Error.log
Nginx
Php-Fpm
Apache (CentOS)
Apache (Ubuntu, Debian)
Стандартные пути до Access.log
Nginx
Php-Fpm
Apache (CentOS)
Apache (Ubuntu, Debian)
Чтение записей в логах
Записи в логах имеют структуру: одно событие – одна строка .
Записи в разных логах имеют общие черты, но количество подробностей отличается. Далее будут приведены примеры строк из разных системных журналов.
Примеры записей
Error.log
В приведенном примере:
- [Sat Sep 1 15:33:40.719615 2019] — дата и время события.
- [:error] [pid 10706] — ошибка и её тип.
- [client 66.249.66.61:60699] — IP-адрес подключившегося клиента.
- PHP Notice: Undefined variable: moduleclass_sfx in — событие PHP Notice. В данной ситуации — обнаружена неизвестная переменная.
- /var/data/www/site.ru/modules/contacts/default.php on line 14 — путь и номер строки в проблемном файле.
Access.log
В приведенном примере:
- 194.61.0.6 — IP-адрес пользователя.
- alex — если пользователь зарегистрирован в системе, то в логах будет указан идентификатор.
- [10/Oct/2019:15:32:22 -0700]— дата и время записи.
- «GET /apache_pb.gif HTTP/1.0» — «GET» означает, что определённый документ со страницы сайта был отправлен пользователю. Существует команда «POST», наоборот отправляет конкретные данные (комментарий или любое другое сообщение) на сервер . Далее указан извлечённый документ «Apache_pb.gif», а также использованный протокол «HTTP/1.0».
- 200 5396 — код и количество байтов документа, которые были возвращены сервером.
- «http://www. www.mysite/myserver.html»— страница, с которой был произведён запрос на извлечение документа «Apache_pb.gif».
- «Mozilla/4.08 [en] (Win98; I ;Nav)» — данные о пользователе, которой произвёл запрос (используемый браузер и операционная система).
Просмотр логов сервера с помощью команды tail
Выполнить просмотр логов в Linux можно с помощью команды tail . Данный инструмент позволяет смотреть записи в логах, выводя последние строки из файла. По умолчанию tail выводит 10 строк.
Первый вариант использования Tail
Аргумент «-f» позволяет команде делать просмотр событий в режиме реального времени, в ожидании новых записей в лог файлах. Для прерывания процесса следует нажать сочетание клавиш «Ctrl+C».
На место переменной «/var/log/syslog» в примере следует подставить актуальный адрес до нужных системных журналов.
Второй вариант использования Tail
В Linux логи веб-сервера не ведутся до бесконечности, поскольку это усложняет их дальнейший анализ. При преодолении лимита записей, система переименует переполненный строками файл журнала и отправит в «архив». Вместо старого файла создастся новый, но с прежним названием.
Если будет использоваться аргумент «-f», команда продолжит отслеживание старого, переименованного журнала. Данный метод делает невозможным просмотр логов в реальном времени, поскольку файл более не актуален.
При использовании аргумента «-F», команда, после окончания записи старого журнала, перейдёт к чтению нового файла с логами. В таком случае просмотр логов в режиме реального времени продолжится.
Аналог команды Tail
Отличие команды tailf от предыдущей заключается в том, что она не обращается к файлу и файловой системе в период, когда запись логов не происходит. Это экономит ресурсы системы и заряд, если используется нестационарное устройство — ноутбук, смартфон или планшет.
Недостаток данного способа — проблема с чтением больших файлов. Если системный журнал достаточно большой, возникает вероятность отказа в работе программы.
Изменение стандартного количества строк для вывода
Как и отмечалось выше, по умолчанию выводится 10 строк. Если требуется увеличить или уменьшить их количество, в команду добавляется аргумент «-n» и необходимое число строк.
При использовании данной команды будут показаны последние 100 строк журнала.
Просмотр логов с помощью ISPManager
Если на сервере установлен ISPManager, логи можно легко читать, используя приведенный ниже алгоритм.
- На главной странице, в панели инструментов «WWW» нужно нажать на вкладку «Журналы».
- ISPManager выдаст журналы посещений и серверных ошибок в виде:
- ru.access.log;
- ru.error.log.*
* Вместо «newdomen.ru» из примера в выдаче будет название актуального домена.
Открыть файл лога можно, нажав на «Посмотреть» в верхнем меню.
Программы для анализа логов
Анализировать журналы с большим количеством данных вручную не только сложно, но и чревато ошибками. Для упрощения работы с лог файлами было создано большое количество сервисов и утилит.
Инструменты для анализа логов делятся на два основных типа — статические и работающие в режиме реального времени.
Статические программы
Данный тип выполняет работу только с извлеченными логами, но обеспечивает быструю сортировку данных.
WebLog Expert
Возможности
- Предоставление информации об активность сайта, количестве посетителей, доступ к файлам, URL страницы, ссылающиеся страницы, информацию о пользователе (браузер и операционная система).
- Создание отчётов в формате HTML (.html), PDF (.pdf), CSV (.csv).
- Поддерживает анализ логов Nginx, Apache, ISS.
- Чтение файлов даже в архивах ZIP (.zip), GZ (.gz).
Web Log Explorer
Возможности
- Создание многоуровневых отчётов, включающих количество посетителей, маршруты пользователей по сайту, местоположение хостов (страна и город), указанные в поисковике ключевые слова.
- Поддержка более 43 форматов логов.
- Возможность прямой загрузки логов с FTP, HTTP сервера.
- Чтение архивированных журналов.
Программы для анализа в режиме реального времени
Эти инструменты встраиваются в программную среду сервера, анализируют данные в реальном времени и записывают непрерывный отчёт.
GoAccess
Возможности
- Автоматическая генерация отчёта в формате HTML (.html), JSON (.json), CSV (.csv).
- При подключении к серверу через SSH, возможен анализ в браузере и в терминале
- Поддержка почти всех форматов (Apache, Nginx, Amazon S3, Elastic Load Balancing, CloudFront и др.).
Logstash
Возможности
- Постоянная генерация отчёта в файл JSON (.json).
- Получение и анализ информации из нескольких источников.
- Возможность пересылать журналы с помощью Filebeat.
- Поддержка анализа системных журналов.
- Поддерживается большое количество форматов: от Apache до Log4j (Java).
Ведения логов медленных запросов сервера
Анализ данного лога позволяет определить на какие типы запросов сервер отвечает долго. В идеале задержка должна составлять не более 1 секунды.
На некоторых типах оболочек (MySQL, PHP-FPM) ведение данного лога по умолчанию отключено. Процесс запуска и ведения зависит от сервера.
MySQL
Если сервер управляется с помощью MySQL, то необходимо создать каталог и сам файл для ведения журнала с помощью команд:
Стоит изменить владельца файла, чтобы избежать дальнейших проблем с записью логов. Делается это командой:
После выполнения предыдущих действий, нужно совершить вход в командную строку MySQL под учётной записью суперпользователя:
Для запуска и настройки ведения логов нужно последовательно ввести в терминале следующие команды:
- slow_query_log — запускает ведение журналов медленных запросов.
- slow_launch_time — указывает максимальную задержку отклика, после которой статистика запроса попадёт в журнал. В данном случае запись в логи происходит при преодолении откликом порога 2 секунды.
- slow_query_log_file — задаёт путь до используемого журнала.
Проверить статус и параметры ведения лога медленных запросов можно командой:
Выход из консоли MySQL выполняется командой:
После выполнения всех предыдущих действий, можно просмотреть логи сервера. Для этого в терминале вводится:
PHP-FPM
Для ведения журнала на данной оболочке, необходимо отредактировать параметры в конфигурационном файле. Для этого в терминале вводится команда:
Далее нужно найти строки:
- request_slowlog_timeout = 10s — параметр, позволяющий указать задержку, с которой запись о длительном запросе попадёт в журнал.
- slowlog = /var/log/php-fpm/www-slow.log — параметр, указывающий путь до актуального файла логирования (.log).
После применения изменений, необходимо перезагрузить сервер PHP-FPM. Для этого в консоль вводится команда:
Просмотр логов запускается командой:
Анализ логов медленных запросов
Логи медленных запросов могут за незначительное время вырасти до огромных размеров. Для сортировки и отображения повторяющихся запросов рекомендуется использовать программу MySQLDumpSlow.
Для запуска просмотра логов с помощью этой утилиты, нужно составить команду по приведенному ниже алгоритму:
Ведение логов в Logrotate
На больших ресурсах журналы могут достигать огромных размеров, поэтому нужно своевременно архивировать или очищать логи. С помощью утилиты Logrotate можно управлять ведением журналов: настроить период ротации (архивирование старого журнала и создание нового), период и количество хранения журналов и многое другое.
Изначально программа отсутствует в системе. Ниже приведены команды для инсталляции Logrotate из официальных репозиториев.
Ubuntu, Debian:
CentOS:
После установки необходимо проверить путь для будущих конфигурационных файлов. Для правильной работы они должны находится в папке «logrotate.d». Проверить данный параметр можно открыв конфигурационный файл командой:
В директории «RPM packages drop log rotation information into this directory» должна присутствовать строка:
Теперь создаётся конфигурационный файл «rsyslog.conf». В нём будет находиться конфигурацию по работе с логами. Для создания файла в терминале вводится команда:
В окне терминала откроется текстовой редактор. Теперь нужно внести конфигурацию, как указано в образце. В качестве примера будет использоваться журнал посещений «Access.log» (Nginx).
Теперь остаётся только запустить Logrotate. Для этого вводится команда:
Для проверки правильности работы программы в терминале можно ввести команду:
Надежный хостинг для сайта. 14 дней — бесплатно!
Источник
Команда tail отображает последнюю часть (по умолчанию 10 строк) одного или нескольких файлов или переданных данных. Он также может быть использован для мониторинга изменений файла в режиме реального времени.
Одним из наиболее распространенных применений команды tail является просмотр и анализ журналов и других файлов, которые со временем меняются, обычно в сочетании с другими инструментами, такими как grep .
Синтаксис хвостовой команды
Прежде чем перейти к использованию команды tail, давайте начнем с рассмотрения основного синтаксиса.
Выражения команды tail принимают следующую форму:
tail [OPTION]... [FILE]...
OPTION— хвостовые варианты . Мы рассмотрим наиболее распространенные варианты в следующих разделах.FILE— Ноль или более имен входных файлов. Если FILE не указан или если FILE установлен-, tail будет читать стандартный ввод.
Как использовать команду Tail
В простейшем виде, когда используется без какой-либо опции, команда tail отображает последние 10 строк.
tail filename.txt Как отобразить определенное количество строк
Используйте опцию -n ( --lines ), чтобы указать количество отображаемых строк:
tail -n <NUMBER> filename.txt
Вы также можете опустить букву n и использовать только дефис ( - ) и число (без пробелов между ними).
Для отображения последних 50 строк имени файла filename.txt вы должны использовать:
tail -n 50 filename.txt В следующем примере будет показан тот же результат, что и в приведенных выше командах:
tail -50 filename.txt Как отобразить определенное количество байтов
Для отображения определенного количества байтов используйте опцию -c ( --bytes ).
tail -c <NUMBER> filename.txt
Например, для отображения последних 500 байтов данных из названного файла filename.txt вы должны использовать:
tail -c 500 filename.txt
Вы также можете использовать суффикс множителя после числа, чтобы указать количество отображаемых байтов. b умножает его на 512, kB умножает на 1000, K умножает на 1024, MB умножает на 1000000, M умножает на 1048576 и т. д.
Следующая команда отобразит последние два килобайта (2048) файла filename.txt :
tail -c 2k filename.txt Как посмотреть файл на предмет изменений
Чтобы отслеживать файл на наличие изменений, используйте параметр -f ( --follow ):
tail -f filename.txt
Эта опция особенно полезна для мониторинга файлов журнала. Например, чтобы отобразить последние 10 строк /var/log/nginx/error.log файла и отслеживать файл на наличие обновлений, вы будете использовать:
tail -f /var/log/nginx/error.log
Чтобы прервать команду tail во время просмотра файла, нажмите Ctrl+C .
Чтобы продолжить мониторинг файла при его воссоздании, используйте -F опцию.
tail -F filename.txt
Эта опция полезна в ситуациях, когда команда tail следит за вращающимся файлом журнала. При использовании с -F опцией команда tail снова откроет файл, как только он снова станет доступным.
Как отобразить несколько файлов
Если несколько файлов предоставлены в качестве входных данных для команды tail, она будет отображать последние десять строк из каждого файла.
tail filename1.txt filename2.txt Вы можете использовать те же параметры, что и при отображении одного файла.
Этот пример показывает последние 20 строк файлов filename1.txt и filename2.txt :
tail -n 20 filename1.txt filename2.txt Как использовать хвост с другими командами
Команда tail может использоваться в сочетании с другими командами, перенаправляя стандартный вывод из / в другие утилиты, используя каналы.
Например, чтобы отслеживать файл журнала доступа apache и отображать только те строки, которые содержат IP-адрес, который 192.168.42.12 вы используете:
tail -f /var/log/apache2/access.log | grep 192.168.42.12
Следующая ps команда отобразит десятку запущенных процессов, отсортированных по загрузке процессора:
ps aux | sort -nk +3 | tail -5 Вывод
К настоящему времени вы должны хорошо понимать, как использовать хвостовую команду Linux. Он дополняет команду head, которая печатает первые строки файла на терминал.
Команда tail отображает последнюю часть (по умолчанию 10 строк) одного или нескольких файлов или передаваемых данных. Его также можно использовать для отслеживания изменений файлов в реальном времени.
Одним из наиболее распространенных способов использования команды tail является просмотр и анализ журналов и других файлов, которые меняются со временем, обычно в сочетании с другими инструментами, такими как grep .
В этом руководстве мы покажем вам, как использовать команду хвоста Linux на практических примерах и подробных объяснениях наиболее распространенных параметров хвоста.
Синтаксис команды tail
Прежде чем перейти к использованию команды tail, давайте начнем с обзора основного синтаксиса.
Выражения команды tail принимают следующую форму:
tail [OPTION]... [FILE]...
OPTION— варианты хвоста . Мы рассмотрим наиболее распространенные варианты в следующих разделах.FILE— Ноль или более имен входных файлов. Если ФАЙЛ не указан или если ФАЙЛ равен-, tail будет читать стандартный ввод.
Как использовать команду tail
В простейшей форме при использовании без какой-либо опции команда tail отобразит последние 10 строк.
tail filename.txtКак отобразить определенное количество строк
Используйте параметр -n ( --lines ), чтобы указать количество отображаемых строк:
tail -n <NUMBER> filename.txtВы также можете опустить букву n и использовать только дефис ( - ) и цифру (без пробелов между ними).
Чтобы отобразить последние 50 строк файла с именем filename.txt вы должны использовать:
tail -n 50 filename.txtВ следующем примере будет отображаться тот же результат, что и для приведенных выше команд:
tail -50 filename.txtКак отобразить определенное количество байтов
Чтобы показать определенное количество байтов, используйте параметр -c ( --bytes ).
tail -c <NUMBER> filename.txtНапример, чтобы отобразить последние 500 байтов данных из файла с именем filename.txt вы должны использовать:
tail -c 500 filename.txtВы также можете использовать суффикс множителя после числа, чтобы указать количество отображаемых байтов. b умножает его на 512, kB умножает на 1000, K умножает на 1024, MB умножает на 1000000, M умножает на 1048576 и так далее.
Следующая команда отобразит последние два килобайта (2048) файла filename.txt :
tail -c 2k filename.txtКак отслеживать изменения в файле
Чтобы отслеживать изменения в файле, используйте параметр -f ( --follow ):
tail -f filename.txtЭта опция особенно полезна для мониторинга файлов журналов. Например, чтобы отобразить последние 10 строк файла /var/log/nginx/error.log и отслеживать обновления файла, вы должны использовать:
tail -f /var/log/nginx/error.logЧтобы прервать команду tail во время просмотра файла, нажмите Ctrl+C
Чтобы продолжить наблюдение за файлом при его воссоздании, используйте параметр -F .
tail -F filename.txtЭта опция полезна в ситуациях, когда хвостовая команда следует за вращающимся файлом журнала. При использовании с параметром -F команда tail повторно откроет файл, как только он снова станет доступен.
Как отображать несколько файлов
Если в качестве входных данных для команды tail указано несколько файлов, она отобразит последние десять строк из каждого файла.
tail filename1.txt filename2.txtВы можете использовать те же параметры, что и при отображении одного файла.
В этом примере показаны последние 20 строк файлов filename1.txt и filename2.txt :
tail -n 20 filename1.txt filename2.txtКак использовать tail с другими командами
Команда tail может использоваться в сочетании с другими командами путем перенаправления стандартного вывода из / в другие утилиты с помощью каналов.
Например, для отслеживания файла журнала доступа к apache и отображения только тех строк, которые содержат IP-адрес 192.168.42.12 вы должны использовать:
tail -f /var/log/apache2/access.log | grep 192.168.42.12Следующая команда ps отобразит десять наиболее запущенных процессов, отсортированных по загрузке ЦП:
ps aux | sort -nk +3 | tail -5Выводы
К настоящему времени вы должны хорошо понимать, как использовать хвостовую команду Linux. Он является дополнением к команде head, которая выводит первые строки файла на терминал.
NGINX logging is often overlooked as a critical part of the web service and is commonly referenced only when an error occurs. But it’s important to understand from the beginning how to configure NGINX logs and what information is considered most important.
Within NGINX there are two types of logs available, the error log and the access log. How then would you configure the error and access logs and in what format should be used? Read on to learn all about how NGINX logging works!
Prerequisites
To follow along with this tutorial, it is necessary to have a recent working NGINX installation, ideally version 1.21.1 or higher. In this tutorial, Ubuntu is used to host the NGINX installation. To view formatted JSON log file output in the terminal you may want to install the jq utility
Learning the NGINX Logging System
The NGINX logging system has quite a few moving parts. Logging is made up of log formats (how logs are stored) and an NGNIX configuration file (nginx.conf) to enable and tune how logs are generated.
First, let’s cover the NGINX configuration file. An NGNIX configuration file defines a hierarchy of sections that are referred to as contexts within the NGINX documentation. These contexts are made up of a combination of the following, although not all available contexts are listed below.
- The “main” context is the root of the nginx.conf file
- The
httpcontext - Multiple
servercontexts - Multiple
locationcontexts
Inside one or more of these contexts is where you can define access_log and error_log configuration items, or directives. A logging directive defines how NGINX is supposed to record logs under each context.
NGINX Logs Logging Directive Structure
Logging directives are defined under each context with the log name, the location to store the log, and the level of log data to store.
<log name> <log location> <logging level>;- Log Location – You can store logs in three different areas; a file e.g.
/var/log/nginx/error.log, syslog e.g.syslog:server=unix:/var/log/nginx.sockor cyclic memory buffer e.g.memory:32m. - Logging Levels – The available levels are
debug,info,notice,warn,error,crit,alert, oremergwith the default beingerror. Thedebuglevel may not be available unless NGINX was compiled with the--with-debugflag.
Allowed Logging Directive Contexts
Both the error_log and access_log directives are allowed in only certain contexts. error_log is allowed in the main, http, mail, stream, server, and location contexts. While the access_log directive is allowed in http, server, location, if in location, and limit_exept contexts.
Logging directives override higher-up directives. For example, the
error_logdirective specified in alocationcontext will override the same directive specified in thehttpcontext.
You can see an example configuration below that contains various defined directives below.
# Log to a file on disk with all errors of the level warn and higher
error_log /var/log/nginx/error.log warn;

http {
  access_log /var/log/nginx/access.log combined;

  server {
		access_log /var/log/nginx/domain1.access.log combined;

		location {
			# Log to a local syslog server as a local7 facility, tagged as nginx, and with the level of notice and higher
		error_log syslog:server=unix:/var/log/nginx.sock,facility=local7,tag=nginx notice;
		}
  }

  server {
		access_log /var/log/nginx/domain2.access.log combined;

		location {
			# Log all info and higher error messages directly into memory, but max out at 32 Mb
			error_log memory:32m info;
		}
  }
}
Log Formats and the Access Log Directive
Beyond just NGINX error logs, each access request to NGINX is logged. An access request could be anything from requesting a web page to a specific image. As you might surmise, there is a lot of data that can be included in the logged requests.
To record general NGINX request activity, NGNIX relies on access logs using the access_log directive. Unlike the error_log directive which has a standard format, you can configure NGINX access logs to store in a particular format.
The Default access_log Log Format
NGNIX can record access log data in many different ways through log formats. By default, that log format is called combined. When you don’t specify a log format in the NGINX configuration file, NGNIX will log all requested according to the following schema.
'$remote_addr - $remote_user [$time_local] '
'"$request" $status $body_bytes_sent '
'"$http_referer" "$http_user_agent"'
Below, you can see an example of the combined format in practice.
127.0.0.1 - - [10/Oct/2020:15:10:20 -0600] "HEAD / HTTP/1.1" 200 0 "<https://example.com>" "Mozilla/5.0..."Defining Custom access_log Formats via log_format Directive
The default combined NGINX log format may work perfectly well for your needs, but what if you would like to add additional data, such as upstream service information, or use this in JSON format instead? You’ll need to define a custom log format using the log_format directive.
The log_format directive allows you to define multiple different access_log formats to be used across the various contexts in the configuration file.
An example of defining a log format is below which specifies many different fields and variables. This example defines a JSON logging format, you may choose to display various fields.
Check out all available variables via the NGINX documentation.
The json text displayed after the log_format directive is merely the name that is referenced by any access_log directive that wishes to use this format. By using log_format, multiple logging output formats may be defined and used by any combination of access_log directives throughout the NGINX configuration file.
log_format json escape=json '{ "time": "$time_iso8601", '
	'"remote_addr": "$remote_addr", '
	'"remote_user": "$remote_user", '
	'"ssl_protocol_cipher": "$ssl_protocol/$ssl_cipher", '
	'"body_bytes_sent": "$body_bytes_sent", '
	'"request_time": "$request_time", '
	'"status": "$status", '
	'"request": "$request", '
	'"request_method": "$request_method", '
	'"http_referrer": "$http_referer", '
	'"http_x_forwarded_for": "$http_x_forwarded_for", '
	'"http_cf_ray": "$http_cf_ray", '
	'"host": "$host", '
	'"server_name": "$server_name", '
	'"upstream_address": "$upstream_addr", '
	'"upstream_status": "$upstream_status", '
	'"upstream_response_time": "$upstream_response_time", '
	'"upstream_response_length": "$upstream_response_length", '
	'"upstream_cache_status": "$upstream_cache_status", '
	'"http_user_agent": "$http_user_agent" }';
The
log_formatmay only be used in thehttpcontext, but referenced by anyaccess_logdirective regardless of location.
Escaping Log Output
When you define log format via JSON, for example, you’ll sometimes need to escape variables defined in JSON to be treated as literal elements in the NGNIX configuration file. To do that, you can use various escape formats such as default, json, and none. If the escape command is omitted, the default format is used.
default– Double-quotes, “”, and all characters with ISO values less than 32 and greater than 126 will be escaped as “x##”. If no variable value is found, then a hyphen (-) will be logged.json– All disallowed characters in the JSON string format will be escaped.none– All escaping of values is disabled.
You’ll see a great example of NGNIX escaping all JSON variables in the example above using the json escape format (escape=json).
Configuring access_log Directives
For NGNIX to become recording access activity using the fancy log format you defined earlier, you must enable it using the access_log directive
Once you’ve defined the log format, you must enable the log inside of the NGINX configuration file much like the error_log directive.
An example of a typical access_log directive is shown below where it sends access logs in the json log_format, as previously defined, and to a file (/var/log/nginx/access.log). Then the special off parameter disables access logging in a specific context where the directive is included.
access_log /var/log/nginx/domain.access.log json;
access_log off;
Perhaps you have defined an access_log for a domain. How would you go about seeing the output from the below directive?
access_log /var/log/nginx/domain.access.log json;To demonstrate NGINX sending log output as defined by the access_log directive, first run the Linux cat command to grab the file contents and pipe the output to the tail command to show only a single line. Then finally, pass the single line to the jq utility to nicely format the JSON output.
cat /var/log/nginx/domain.access.log | tail -n 1 | jqLike the
error_log, both thememoryandsyslogformats work in addition to the standard file output.
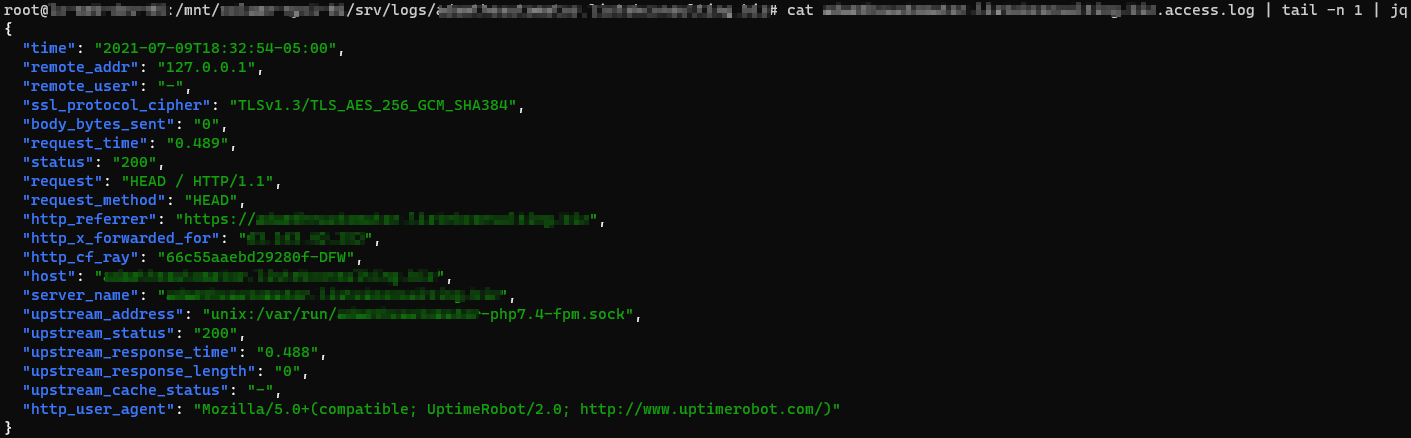
Configuring NGINX to Buffer Disk Writes
Since there is typically far more information output from access logging than error logging, additional abilities for compression and buffering of the log data to disk writes are included, but enabled by default. To avoid constant disk writes and potential request blocking of the webserver while waiting for disk IO, tell NGINX to buffer disk writes.
An example of an access_log directive defining the gzip, buffer, and flush parameters is shown below.
access_log /var/log/nginx/domain.access.log gzip=7 buffer=64k flush=3m;buffer– A buffer temporarily stores data, before sending it elsewhere. The default buffer size is64kwhich you can redefine by specifying a size along with the directive, i.e.buffer=32kinstead of justbuffer.gzip– Defines a level of GZIP compression to use from1to9, with 9 being the slowest but highest level of compression. For example,gzipdefaults to1but you will set (gzip=9) the compression to the highest.
If you use
gzipbut notbuffer, you’ll buffer the writes by default. Since the nature of GZIP compression means log entries cannot be streamed to disk, disk buffering is required.
flush– To avoid holding on to in-memory logs indefinitely for infrequently accessed sites, you’ll specify aflushtime to write any logging data to disk after that time threshold is met. For example, withflush=5myou force all logged data to be written to disk, even if the buffer has not filled.
Logging Access Entries Conditionally
There are times when you will only want to log a particular access request. For example, instead of logging all requests including HTTP/200 (successful requests), perhaps you’d like to only log HTTP/404 (file not found requests). If so, you can define a logging condition in the access_log directive using the if parameter.
The if= parameter of the access_log directive looks for values passed in by the associated variable that are not “0” or an empty string to continue with logging.
As an example, perhaps you’d like to force NGNIX to only log only HTTP access requests starting with a 4 for the HTTP code.
In the NGINX configuration file:
Define a map directive to assign a variable with the value of either 0 or 1 depending n the evaluated condition. The first regular expression looks for all HTTP statuses that do not start with 4. The default condition is the fallback for all values that do not meet that requirement.
map $status $logged {
    ~^[1235] 0;
    default  1;
}
The
mapdirective must be defined at thehttpcontext level. You may use themapdirective output variable, shown below as$logged, further in the configuration file and not confined to thehttpcontext level.
Once you have defined the map directive which will assign a value of 0 or 1 to the $logged variable, you can then use this variable in conditions as shown below. Here, using the if parameter, you’re telling NGINX to only log activity to the access_404.log file if it sees a request starting with 4.
access_log /var/log/nginx/access_404.log json if=$logged;Conclusion
Now that you know how to log errors and access requests in a variety of ways, you can start monitoring your NGINX installation for issues and also for user-facing problems.
What’s next? Try taking the results of the logs and ingesting those into a SIEM application for analysis!