-- Logs begin at Sat 2019-08-31 17:13:20 PDT, end at Sat 2019-08-31 18:13:38 PDT. --
Aug 31 17:13:24 cl-01 systemd[1]: Started Ceph metadata server daemon.
Aug 31 17:13:24 cl-01 ceph-mds[1221]: starting mds.cl-01 at
Aug 31 17:14:59 cl-01 systemd[1]: Stopping Ceph metadata server daemon...
Aug 31 17:14:59 cl-01 ceph-mds[1221]: 2019-08-31 17:14:59.308 7feaabff0700 -1 received  signal: Terminated from /sbin/init nofb  (PID: 1) UID: 0
Aug 31 17:14:59 cl-01 ceph-mds[1221]: 2019-08-31 17:14:59.308 7feaabff0700 -1 mds.cl-01 *** got signal Terminated ***
Aug 31 17:15:00 cl-01 ceph-mds[1221]: /root/sources/pve/ceph/ceph-14.2.2/src/include/elist.h: In function 'elist<T>::~elist() [with T = MDSIOContextBase*]' thread 7feaaf241340 time 2019-08-31 17:15:00.966856
Aug 31 17:15:00 cl-01 ceph-mds[1221]: /root/sources/pve/ceph/ceph-14.2.2/src/include/elist.h: 91: FAILED ceph_assert(_head.empty())
Aug 31 17:15:00 cl-01 ceph-mds[1221]:  ceph version 14.2.2 (a887fe9a5d3d97fe349065d3c1c9dbd7b8870855) nautilus (stable)
Aug 31 17:15:00 cl-01 ceph-mds[1221]:  1: (ceph::__ceph_assert_fail(char const*, char const*, int, char const*)+0x152) [0x7feab0ae65c6]
Aug 31 17:15:00 cl-01 ceph-mds[1221]:  2: (()+0x28079e) [0x7feab0ae679e]
Aug 31 17:15:00 cl-01 ceph-mds[1221]:  3: (()+0x3dcfb3) [0x55d7907dffb3]
Aug 31 17:15:00 cl-01 ceph-mds[1221]:  4: (()+0x39d8c) [0x7feaaf776d8c]
Aug 31 17:15:00 cl-01 ceph-mds[1221]:  5: (()+0x39eba) [0x7feaaf776eba]
Aug 31 17:15:00 cl-01 ceph-mds[1221]:  6: (__libc_start_main()+0xf2) [0x7feaaf7610a2]
Aug 31 17:15:00 cl-01 ceph-mds[1221]:  7: (_start()+0x2a) [0x55d79053f8ca]
Aug 31 17:15:00 cl-01 ceph-mds[1221]: *** Caught signal (Segmentation fault) **
Aug 31 17:15:00 cl-01 ceph-mds[1221]:  in thread 7feaaf241340 thread_name:ceph-mds
Aug 31 17:15:00 cl-01 ceph-mds[1221]:  ceph version 14.2.2 (a887fe9a5d3d97fe349065d3c1c9dbd7b8870855) nautilus (stable)
Aug 31 17:15:00 cl-01 ceph-mds[1221]:  1: (()+0x12730) [0x7feaafeaf730]
Aug 31 17:15:00 cl-01 ceph-mds[1221]:  2: (__pthread_mutex_lock()+0) [0x7feaafea76c0]
Aug 31 17:15:00 cl-01 ceph-mds[1221]:  3: (ceph::logging::Log::submit_entry(ceph::logging::Entry&&)+0x41) [0x7feab0e590b1]
Aug 31 17:15:00 cl-01 ceph-mds[1221]:  4: (ceph::__ceph_assert_fail(char const*, char const*, int, char const*)+0x24c) [0x7feab0ae66c0]
Aug 31 17:15:00 cl-01 ceph-mds[1221]:  5: (()+0x28079e) [0x7feab0ae679e]
Aug 31 17:15:00 cl-01 ceph-mds[1221]:  6: (()+0x3dcfb3) [0x55d7907dffb3]
Aug 31 17:15:00 cl-01 ceph-mds[1221]:  7: (()+0x39d8c) [0x7feaaf776d8c]
Aug 31 17:15:00 cl-01 ceph-mds[1221]:  8: (()+0x39eba) [0x7feaaf776eba]
Aug 31 17:15:00 cl-01 ceph-mds[1221]:  9: (__libc_start_main()+0xf2) [0x7feaaf7610a2]
Aug 31 17:15:00 cl-01 ceph-mds[1221]:  10: (_start()+0x2a) [0x55d79053f8ca]
Aug 31 17:15:00 cl-01 systemd[1]: ceph-mds@cl-01.service: Main process exited, code=killed, status=11/SEGV
Aug 31 17:15:00 cl-01 systemd[1]: ceph-mds@cl-01.service: Failed with result 'signal'.
Aug 31 17:15:00 cl-01 systemd[1]: Stopped Ceph metadata server daemon.
Aug 31 17:16:18 cl-01 systemd[1]: Started Ceph metadata server daemon.
Aug 31 17:16:18 cl-01 ceph-mds[3972]: starting mds.cl-01 at
Aug 31 18:01:23 cl-01 systemd[1]: Stopping Ceph metadata server daemon...
Aug 31 18:01:23 cl-01 ceph-mds[3972]: 2019-08-31 18:01:23.847 7fdb81da6700 -1 received  signal: Terminated from /sbin/init nofb  (PID: 1) UID: 0
Aug 31 18:01:23 cl-01 ceph-mds[3972]: 2019-08-31 18:01:23.847 7fdb81da6700 -1 mds.cl-01 *** got signal Terminated ***
Aug 31 18:01:26 cl-01 ceph-mds[3972]: /root/sources/pve/ceph/ceph-14.2.2/src/include/elist.h: In function 'elist<T>::~elist() [with T = MDSIOContextBase*]' thread 7fdb84ff7340 time 2019-08-31 18:01:26.522080
Aug 31 18:01:26 cl-01 ceph-mds[3972]: /root/sources/pve/ceph/ceph-14.2.2/src/include/elist.h: 91: FAILED ceph_assert(_head.empty())
Aug 31 18:01:26 cl-01 ceph-mds[3972]:  ceph version 14.2.2 (a887fe9a5d3d97fe349065d3c1c9dbd7b8870855) nautilus (stable)
Aug 31 18:01:26 cl-01 ceph-mds[3972]:  1: (ceph::__ceph_assert_fail(char const*, char const*, int, char const*)+0x152) [0x7fdb8689c5c6]
Aug 31 18:01:26 cl-01 ceph-mds[3972]:  2: (()+0x28079e) [0x7fdb8689c79e]
Aug 31 18:01:26 cl-01 ceph-mds[3972]:  3: (()+0x3dcfb3) [0x557cfc66bfb3]
Aug 31 18:01:26 cl-01 ceph-mds[3972]:  4: (()+0x39d8c) [0x7fdb8552cd8c]
Aug 31 18:01:26 cl-01 ceph-mds[3972]:  5: (()+0x39eba) [0x7fdb8552ceba]
Aug 31 18:01:26 cl-01 ceph-mds[3972]:  6: (__libc_start_main()+0xf2) [0x7fdb855170a2]
Aug 31 18:01:26 cl-01 ceph-mds[3972]:  7: (_start()+0x2a) [0x557cfc3cb8ca]
Aug 31 18:01:26 cl-01 ceph-mds[3972]: *** Caught signal (Segmentation fault) **
Aug 31 18:01:26 cl-01 ceph-mds[3972]:  in thread 7fdb84ff7340 thread_name:ceph-mds
Aug 31 18:01:26 cl-01 ceph-mds[3972]:  ceph version 14.2.2 (a887fe9a5d3d97fe349065d3c1c9dbd7b8870855) nautilus (stable)
Aug 31 18:01:26 cl-01 ceph-mds[3972]:  1: (()+0x12730) [0x7fdb85c65730]
Aug 31 18:01:26 cl-01 ceph-mds[3972]:  2: (__pthread_mutex_lock()+0) [0x7fdb85c5d6c0]
Aug 31 18:01:26 cl-01 ceph-mds[3972]:  3: (ceph::logging::Log::submit_entry(ceph::logging::Entry&&)+0x41) [0x7fdb86c0f0b1]
Aug 31 18:01:26 cl-01 ceph-mds[3972]:  4: (ceph::__ceph_assert_fail(char const*, char const*, int, char const*)+0x24c) [0x7fdb8689c6c0]
Aug 31 18:01:26 cl-01 ceph-mds[3972]:  5: (()+0x28079e) [0x7fdb8689c79e]
Aug 31 18:01:26 cl-01 ceph-mds[3972]:  6: (()+0x3dcfb3) [0x557cfc66bfb3]
Aug 31 18:01:26 cl-01 ceph-mds[3972]:  7: (()+0x39d8c) [0x7fdb8552cd8c]
Aug 31 18:01:26 cl-01 ceph-mds[3972]:  8: (()+0x39eba) [0x7fdb8552ceba]
Aug 31 18:01:26 cl-01 ceph-mds[3972]:  9: (__libc_start_main()+0xf2) [0x7fdb855170a2]
Aug 31 18:01:26 cl-01 ceph-mds[3972]:  10: (_start()+0x2a) [0x557cfc3cb8ca]
Aug 31 18:01:26 cl-01 systemd[1]: ceph-mds@cl-01.service: Main process exited, code=killed, status=11/SEGV
Aug 31 18:01:26 cl-01 systemd[1]: ceph-mds@cl-01.service: Failed with result 'signal'.
Aug 31 18:01:26 cl-01 systemd[1]: Stopped Ceph metadata server daemon.
Aug 31 18:10:15 cl-01 systemd[1]: Started Ceph metadata server daemon.
Aug 31 18:10:15 cl-01 ceph-mds[17838]: starting mds.cl-01 at
Aug 31 18:10:38 cl-01 systemd[1]: Stopping Ceph metadata server daemon...
Aug 31 18:10:38 cl-01 ceph-mds[17838]: 2019-08-31 18:10:38.908 7f2ec5ded700 -1 received  signal: Terminated from /sbin/init nofb  (PID: 1) UID: 0
Aug 31 18:10:38 cl-01 ceph-mds[17838]: 2019-08-31 18:10:38.908 7f2ec5ded700 -1 mds.cl-01 *** got signal Terminated ***
Aug 31 18:10:39 cl-01 ceph-mds[17838]: /root/sources/pve/ceph/ceph-14.2.2/src/include/elist.h: In function 'elist<T>::~elist() [with T = MDSIOContextBase*]' thread 7f2ec903e340 time 2019-08-31 18:10:39.383807
Aug 31 18:10:39 cl-01 ceph-mds[17838]: /root/sources/pve/ceph/ceph-14.2.2/src/include/elist.h: 91: FAILED ceph_assert(_head.empty())
Aug 31 18:10:39 cl-01 ceph-mds[17838]:  ceph version 14.2.2 (a887fe9a5d3d97fe349065d3c1c9dbd7b8870855) nautilus (stable)
Aug 31 18:10:39 cl-01 ceph-mds[17838]:  1: (ceph::__ceph_assert_fail(char const*, char const*, int, char const*)+0x152) [0x7f2eca8e35c6]
Aug 31 18:10:39 cl-01 ceph-mds[17838]:  2: (()+0x28079e) [0x7f2eca8e379e]
Aug 31 18:10:39 cl-01 ceph-mds[17838]:  3: (()+0x3dcfb3) [0x557766e45fb3]
Aug 31 18:10:39 cl-01 ceph-mds[17838]:  4: (()+0x39d8c) [0x7f2ec9573d8c]
Aug 31 18:10:39 cl-01 ceph-mds[17838]:  5: (()+0x39eba) [0x7f2ec9573eba]
Aug 31 18:10:39 cl-01 ceph-mds[17838]:  6: (__libc_start_main()+0xf2) [0x7f2ec955e0a2]
Aug 31 18:10:39 cl-01 ceph-mds[17838]:  7: (_start()+0x2a) [0x557766ba58ca]
Aug 31 18:10:39 cl-01 ceph-mds[17838]: *** Caught signal (Segmentation fault) **
Aug 31 18:10:39 cl-01 ceph-mds[17838]:  in thread 7f2ec903e340 thread_name:ceph-mds
Aug 31 18:10:39 cl-01 ceph-mds[17838]:  ceph version 14.2.2 (a887fe9a5d3d97fe349065d3c1c9dbd7b8870855) nautilus (stable)
Aug 31 18:10:39 cl-01 ceph-mds[17838]:  1: (()+0x12730) [0x7f2ec9cac730]
Aug 31 18:10:39 cl-01 ceph-mds[17838]:  2: (__pthread_mutex_lock()+0) [0x7f2ec9ca46c0]
Aug 31 18:10:39 cl-01 ceph-mds[17838]:  3: (ceph::logging::Log::submit_entry(ceph::logging::Entry&&)+0x41) [0x7f2ecac560b1]
Aug 31 18:10:39 cl-01 ceph-mds[17838]:  4: (ceph::__ceph_assert_fail(char const*, char const*, int, char const*)+0x24c) [0x7f2eca8e36c0]
Aug 31 18:10:39 cl-01 ceph-mds[17838]:  5: (()+0x28079e) [0x7f2eca8e379e]
Aug 31 18:10:39 cl-01 ceph-mds[17838]:  6: (()+0x3dcfb3) [0x557766e45fb3]
Aug 31 18:10:39 cl-01 ceph-mds[17838]:  7: (()+0x39d8c) [0x7f2ec9573d8c]
Aug 31 18:10:39 cl-01 ceph-mds[17838]:  8: (()+0x39eba) [0x7f2ec9573eba]
Aug 31 18:10:39 cl-01 ceph-mds[17838]:  9: (__libc_start_main()+0xf2) [0x7f2ec955e0a2]
Aug 31 18:10:39 cl-01 ceph-mds[17838]:  10: (_start()+0x2a) [0x557766ba58ca]
Aug 31 18:10:39 cl-01 systemd[1]: ceph-mds@cl-01.service: Main process exited, code=killed, status=11/SEGV
Aug 31 18:10:39 cl-01 systemd[1]: ceph-mds@cl-01.service: Failed with result 'signal'.
Aug 31 18:10:39 cl-01 systemd[1]: Stopped Ceph metadata server daemon.
Aug 31 18:11:39 cl-01 systemd[1]: Started Ceph metadata server daemon.
Aug 31 18:11:39 cl-01 ceph-mds[20064]: starting mds.cl-01 at
-
#1
One minor but important observation to please fix in the documentation.
on https://pve.proxmox.com/wiki/Manage_Ceph_Services_on_Proxmox_VE_Nodes
at
Destroy CephFS
the command
ceph rm fs NAME —yes-i-really-mean-it
should be
ceph fs rm NAME —yes-i-really-mean-it
However,
I have an up and running ceph but creating a cephfs doesn’t work.
pveversion
pve-manager/5.3-5/97ae681d (running kernel: 4.15.18-9-pve)
MDS is created
root@proxmox:~# ceph mds stat
, 1 up:standby
creating a cephfs
root@proxmox:~# pveceph fs create —pg_num 128 —add-storage
creating data pool ‘cephfs_data’…
creating metadata pool ‘cephfs_metadata’…
configuring new CephFS ‘cephfs’
Successfully create CephFS ‘cephfs’
Adding ‘cephfs’ to storage configuration…
Waiting for an MDS to become active
Waiting for an MDS to become active
Waiting for an MDS to become active
Waiting for an MDS to become active
Waiting for an MDS to become active
Waiting for an MDS to become active
Waiting for an MDS to become active
Waiting for an MDS to become active
Waiting for an MDS to become active
Waiting for an MDS to become active
Need MDS to add storage, but none got active!
root@proxmox:~# ceph mds stat
cephfs-1/1/1 up {0=proxmox=up:creating}
Anyone with any idea, please ?
![]()
Alwin
Proxmox Retired Staff
-
#2
ceph fs rm NAME —yes-i-really-mean-it
Correction is on the way, thanks for spotting.
root@proxmox:~# ceph mds stat
cephfs-1/1/1 up {0=proxmox=up:creating}
Is the cephfs now up? What does a ‘ceph fs status’ say?
-
#3
Unchanged since yesterday
root@proxmox:~# ceph mds stat
cephfs-1/1/1 up {0=proxmox=up:creating}
root@proxmox:~# ceph fs status
cephfs — 0 clients
======
+——+———-+———+———-+——-+——-+
| Rank | State | MDS | Activity | dns | inos |
+——+———-+———+———-+——-+——-+
| 0 | creating | proxmox | | 0 | 0 |
+——+———-+———+———-+——-+——-+
+——————+———-+——-+——-+
| Pool | type | used | avail |
+——————+———-+——-+——-+
| cephfs_metadata | metadata | 0 | 589G |
| cephfs_data | data | 0 | 589G |
+——————+———-+——-+——-+
+————-+
| Standby MDS |
+————-+
+————-+
MDS version: ceph version 12.2.8 (6f01265ca03a6b9d7f3b7f759d8894bb9dbb6840) luminous (stable)
I’m trying to get my head around the correct pgs counts. can this be an issue?
cluster [WRN] Health check update: Degraded data redundancy: 108 pgs undersized (PG_DEGRADED)
![]()
Alwin
Proxmox Retired Staff
-
#4
I’m trying to get my head around the correct pgs counts. can this be an issue?
cluster [WRN] Health check update: Degraded data redundancy: 108 pgs undersized (PG_DEGRADED)
That may be why the MDS isn’t starting up, you will find more information in the ceph logs or in the journal. Anyway the pool replication needs to be solved. I guess, there are not enough domains (default host level) for the replication available.
-
#5
I’m using 5.3-9 and i’m also trying to create a cephfs. I have 1 ceph mds and cephs health is OK .. 3 monitors as instructed across 8 nodes with 2 osds each.
root@blah:~# ceph mds stat
, 1 up:standby
root@blah:~# pveceph fs create —pg_num 128 —add-storage
creating data pool ‘cephfs_data’…
mon_command failed — error parsing integer value »: Expected option value to be integer, got »in»}
Any suggestions on how to win this battle?
Thanks
![]()
Alwin
Proxmox Retired Staff
-
#6
What package version are you on (pveversion -v)? What pools do exist on your cluster?
-
#7
I can confirm the error wylde is getting on a new cluster I’m building, a previous installation did not give this error, we update the machine every week and for today many ceph packages are about to be updated.
cephfs_data pool is created however the metadata pool is not.
pveversion -v output is:
Code:
proxmox-ve: 5.3-1 (running kernel: 4.15.18-11-pve)
pve-manager: 5.3-9 (running version: 5.3-9/ba817b29)
pve-kernel-4.15: 5.3-2
pve-kernel-4.15.18-11-pve: 4.15.18-33
ceph: 12.2.11-pve1
corosync: 2.4.4-pve1
criu: 2.11.1-1~bpo90
glusterfs-client: 3.8.8-1
ksm-control-daemon: not correctly installed
libjs-extjs: 6.0.1-2
libpve-access-control: 5.1-3
libpve-apiclient-perl: 2.0-5
libpve-common-perl: 5.0-46
libpve-guest-common-perl: 2.0-20
libpve-http-server-perl: 2.0-11
libpve-storage-perl: 5.0-38
libqb0: 1.0.3-1~bpo9
lvm2: 2.02.168-pve6
lxc-pve: 3.1.0-3
lxcfs: 3.0.3-pve1
novnc-pve: 1.0.0-2
openvswitch-switch: 2.7.0-3
proxmox-widget-toolkit: 1.0-22
pve-cluster: 5.0-33
pve-container: 2.0-34
pve-docs: 5.3-2
pve-edk2-firmware: 1.20181023-1
pve-firewall: 3.0-17
pve-firmware: 2.0-6
pve-ha-manager: 2.0-6
pve-i18n: 1.0-9
pve-libspice-server1: 0.14.1-2
pve-qemu-kvm: 2.12.1-1
pve-xtermjs: 3.10.1-1
qemu-server: 5.0-46
smartmontools: 6.5+svn4324-1
spiceterm: 3.0-5
vncterm: 1.5-3
![]()
Alwin
Proxmox Retired Staff
![]()
-
#10
FYI: this was be fixed in pve-manager with version 5.3-11, at the time of writing already publicly available through our pvetest repo.
As a storage administrator, you can troubleshoot the most common issues that can occur when using the Ceph Metadata Server (MDS). Some of the common errors that you might encounter:
- An MDS node failure requiring a new MDS deployment.
- An MDS node issue requiring redeployment of an MDS node.
6.1. Redeploying a Ceph MDS
Ceph Metadata Server (MDS) daemons are necessary for deploying a Ceph File System. If an MDS node in your cluster fails, you can redeploy a Ceph Metadata Server by removing an MDS server and adding a new or existing server. You can use the command-line interface or Ansible playbook to add or remove an MDS server.
6.1.1. Prerequisites
- A running Red Hat Ceph Storage cluster.
6.1.2. Removing a Ceph MDS using Ansible
To remove a Ceph Metadata Server (MDS) using Ansible, use the shrink-mds playbook.
If there is no replacement MDS to take over once the MDS is removed, the file system will become unavailable to clients. If that is not desirable, consider adding an additional MDS before removing the MDS you would like to take offline.
Prerequisites
- At least one MDS node.
- A running Red Hat Ceph Storage cluster deployed by Ansible.
-
Rootorsudoaccess to an Ansible administration node.
Procedure
- Log in to the Ansible administration node.
-
Change to the
/usr/share/ceph-ansibledirectory:Example
[ansible@admin ~]$ cd /usr/share/ceph-ansible
-
Run the Ansible
shrink-mds.ymlplaybook, and when prompted, typeyesto confirm shrinking the cluster:Syntax
ansible-playbook infrastructure-playbooks/shrink-mds.yml -e mds_to_kill=ID -i hostsReplace ID with the ID of the MDS node you want to remove. You can remove only one Ceph MDS each time the playbook runs.
Example
[ansible @admin ceph-ansible]$ ansible-playbook infrastructure-playbooks/shrink-mds.yml -e mds_to_kill=node02 -i hosts
-
As
rootor withsudoaccess, open and edit the/usr/share/ceph-ansible/hostsinventory file and remove the MDS node under the[mdss]section:Syntax
[mdss]
MDS_NODE_NAME
MDS_NODE_NAME
Example
[mdss]
node01
node03
In this example,
node02was removed from the[mdss]list.
Verification
-
Check the status of the MDS daemons:
Example
[ansible@admin ceph-ansible]$ ceph fs dump

[mds.node01 {0:115304} state up:active seq 5 addr [v2:172.25.250.10:6800/695510951,v1:172.25.250.10:6801/695510951]]

Standby daemons:
[mds.node03 {-1:144437} state up:standby seq 2 addr [v2:172.25.250.11:6800/172950087,v1:172.25.250.11:6801/172950087]]
Additional Resources
- For more information on installing Red Hat Ceph Storage, see the Red Hat Ceph Storage Installation Guide.
- See the Adding a Ceph MDS using Ansible section in the Red Hat Ceph Storage Troubleshooting Guide for more details on adding an MDS using Ansible.
6.1.3. Removing a Ceph MDS using the command-line interface
You can manually remove a Ceph Metadata Server (MDS) using the command-line interface.
If there is no replacement MDS to take over once the current MDS is removed, the file system will become unavailable to clients. If that is not desirable, consider adding an MDS before removing the existing MDS.
Prerequisites
-
The
ceph-commonpackage is installed. - A running Red Hat Ceph Storage cluster.
-
Rootorsudoaccess to the MDS nodes.
Procedure
- Log into the Ceph MDS node that you want to remove the MDS daemon from.
-
Stop the Ceph MDS service:
Syntax
sudo systemctl stop ceph-mds@HOST_NAMEReplace HOST_NAME with the short name of the host where the daemon is running.
Example
[admin@node02 ~]$ sudo systemctl stop ceph-mds@node02
-
Disable the MDS service if you are not redeploying MDS to this node:
Syntax
sudo systemctl disable ceph-mds@HOST_NAMEReplace HOST_NAME with the short name of the host to disable the daemon.
Example
[admin@node02 ~]$ sudo systemctl disable ceph-mds@node02
-
Remove the
/var/lib/ceph/mds/ceph-MDS_IDdirectory on the MDS node:Syntax
sudo rm -fr /var/lib/ceph/mds/ceph-MDS_IDReplace MDS_ID with the ID of the MDS node that you want to remove the MDS daemon from.
Example
[admin@node02 ~]$ sudo rm -fr /var/lib/ceph/mds/ceph-node02
Verification
-
Check the status of the MDS daemons:
Example
[ansible@admin ceph-ansible]$ ceph fs dump

[mds.node01 {0:115304} state up:active seq 5 addr [v2:172.25.250.10:6800/695510951,v1:172.25.250.10:6801/695510951]]

Standby daemons:
[mds.node03 {-1:144437} state up:standby seq 2 addr [v2:172.25.250.11:6800/172950087,v1:172.25.250.11:6801/172950087]]
Additional Resources
- For more information on installing Red Hat Ceph Storage, see the Red Hat Ceph Storage Installation Guide.
- See the Adding a Ceph MDS using the command line interface section in the Red Hat Ceph Storage Troubleshooting Guide for more details on adding an MDS using the command line interface.
6.1.4. Adding a Ceph MDS using Ansible
Use the Ansible playbook to add a Ceph Metadata Server (MDS).
Prerequisites
- A running Red Hat Ceph Storage cluster deployed by Ansible.
-
Rootorsudoaccess to an Ansible administration node. - New or existing servers that can be provisioned as MDS nodes.
Procedure
- Log in to the Ansible administration node
-
Change to the
/usr/share/ceph-ansibledirectory:Example
[ansible@admin ~]$ cd /usr/share/ceph-ansible
-
As
rootor withsudoaccess, open and edit the/usr/share/ceph-ansible/hostsinventory file and add the MDS node under the[mdss]section:Syntax
[mdss]
MDS_NODE_NAME
NEW_MDS_NODE_NAME
Replace NEW_MDS_NODE_NAME with the host name of the node where you want to install the MDS server.
Alternatively, you can colocate the MDS daemon with the OSD daemon on one node by adding the same node under the
[osds]and[mdss]sections.Example
[mdss]
node01
node03
-
As the
ansibleuser, run the Ansible playbook to provision the MDS node:-
Bare-metal deployments:
[ansible@admin ceph-ansible]$ ansible-playbook site.yml --limit mdss -i hosts
-
Container deployments:
[ansible@admin ceph-ansible]$ ansible-playbook site-container.yml --limit mdss -i hosts
After the Ansible playbook has finished running, the new Ceph MDS node appears in the storage cluster.
-
Verification
-
Check the status of the MDS daemons:
Example
[ansible@admin ceph-ansible]$ ceph fs dump [mds.node01 {0:115304} state up:active seq 5 addr [v2:172.25.250.10:6800/695510951,v1:172.25.250.10:6801/695510951]] Standby daemons: [mds.node03 {-1:144437} state up:standby seq 2 addr [v2:172.25.250.11:6800/172950087,v1:172.25.250.11:6801/172950087]] -
Alternatively, you can use the
ceph mds statcommand to check if the MDS is in an active state:Example
[ansible@admin ceph-ansible]$ ceph mds stat
cephfs:1 {0=node01=up:active} 1 up:standby
Additional Resources
- For more information on installing Red Hat Ceph Storage, see the Red Hat Ceph Storage Installation Guide.
- See the Removing a Ceph MDS using Ansible section in the Red Hat Ceph Storage Troubleshooting Guide for more details on removing an MDS using Ansible.
6.1.5. Adding a Ceph MDS using the command-line interface
You can manually add a Ceph Metadata Server (MDS) using the command-line interface.
Prerequisites
-
The
ceph-commonpackage is installed. - A running Red Hat Ceph Storage cluster.
-
Rootorsudoaccess to the MDS nodes. - New or existing servers that can be provisioned as MDS nodes.
Procedure
-
Add a new MDS node by logging into the node and creating an MDS mount point:
Syntax
sudo mkdir /var/lib/ceph/mds/ceph-MDS_IDReplace MDS_ID with the ID of the MDS node that you want to add the MDS daemon to.
Example
[admin@node03 ~]$ sudo mkdir /var/lib/ceph/mds/ceph-node03
-
If this is a new MDS node, create the authentication key if you are using Cephx authentication:
Syntax
sudo ceph auth get-or-create mds.MDS_ID mon 'profile mds' mgr 'profile mds' mds 'allow *' osd 'allow *' > /var/lib/ceph/mds/ceph-MDS_ID/keyring
Replace MDS_ID with the ID of the MDS node to deploy the MDS daemon on.
Example
[admin@node03 ~]$ sudo ceph auth get-or-create mds.node03 mon 'profile mds' mgr 'profile mds' mds 'allow *' osd 'allow *' > /var/lib/ceph/mds/ceph-node03/keyring
Cephx authentication is enabled by default. See the Cephx authentication link in the Additional Resources section for more information about Cephx authentication.
-
Start the MDS daemon:
Syntax
sudo systemctl start ceph-mds@HOST_NAMEReplace HOST_NAME with the short name of the host to start the daemon.
Example
[admin@node03 ~]$ sudo systemctl start ceph-mds@node03
-
Enable the MDS service:
Syntax
systemctl enable ceph-mds@HOST_NAMEReplace HOST_NAME with the short name of the host to enable the service.
Example
[admin@node03 ~]$ sudo systemctl enable ceph-mds@node03
Verification
-
Check the status of the MDS daemons:
Example
[admin@mon]$ ceph fs dump [mds.node01 {0:115304} state up:active seq 5 addr [v2:172.25.250.10:6800/695510951,v1:172.25.250.10:6801/695510951]] Standby daemons: [mds.node03 {-1:144437} state up:standby seq 2 addr [v2:172.25.250.11:6800/172950087,v1:172.25.250.11:6801/172950087]] -
Alternatively, you can use the
ceph mds statcommand to check if the MDS is in an active state:Example
[ansible@admin ceph-ansible]$ ceph mds stat
cephfs:1 {0=node01=up:active} 1 up:standby
Additional Resources
- For more information on installing Red Hat Ceph Storage, see the Red Hat Ceph Storage Installation Guide.
- For more information on Cephx authentication, see the Red Hat Ceph Storage Configuration Guide.
- See the Removing a Ceph MDS using the command line interface section in the Red Hat Ceph Storage Troubleshooting Guide for more details on removing an MDS using the command line interface.
I am Graduate student at University of Texas at Dallas.
Currently I am working on one of my cloud project which requires installation of the ceph cluster.
Our group is in bit of a bind and will require your expertise regarding this project. We already followed the official documentation for installing the ceph cluster with Monitor nodes and OSDs but we are really struggling while adding the metadata server.
It will be great if you can help us in this task. we tried adding MDS using ceph-deploy mds create but we are getting the following error:
> [root@ceph-mon1 ceph]# ceph-deploy --overwrite-conf mds create ceph-mds2
> [ceph_deploy.conf][DEBUG ] found configuration file at: /root/.cephdeploy.conf
> [ceph_deploy.cli][INFO  ] Invoked (1.5.28): /usr/bin/ceph-deploy --overwrite-conf mds create ceph-mds2
> [ceph_deploy.cli][INFO  ] ceph-deploy options:
> [ceph_deploy.cli][INFO  ]  username                      : None
> [ceph_deploy.cli][INFO  ]  verbose                       : False
> [ceph_deploy.cli][INFO  ]  overwrite_conf                : True
> [ceph_deploy.cli][INFO  ]  subcommand                    : create
> [ceph_deploy.cli][INFO  ]  quiet                         : False
> [ceph_deploy.cli][INFO  ]  cd_conf                       : <ceph_deploy.conf.cephdeploy.Conf instance at 0x7f226df6a170>
> [ceph_deploy.cli][INFO  ]  cluster                       : ceph
> [ceph_deploy.cli][INFO  ]  func                          : <function mds at 0x7f226e7f88c0>
> [ceph_deploy.cli][INFO  ]  ceph_conf                     : None
> [ceph_deploy.cli][INFO  ]  mds                           : [('ceph-mds2', 'ceph-mds2')]
> [ceph_deploy.cli][INFO  ]  default_release               : False
> [ceph_deploy.mds][DEBUG ] Deploying mds, cluster ceph hosts ceph-mds2:ceph-mds2
> [ceph-mds2][DEBUG ] connected to host: ceph-mds2
> [ceph-mds2][DEBUG ] detect platform information from remote host
> [ceph-mds2][DEBUG ] detect machine type
> [ceph_deploy.mds][INFO  ] Distro info: CentOS Linux 7.1.1503 Core
> [ceph_deploy.mds][DEBUG ] remote host will use sysvinit
> [ceph_deploy.mds][DEBUG ] deploying mds bootstrap to ceph-mds2
> [ceph-mds2][DEBUG ] write cluster configuration to /etc/ceph/{cluster}.conf
> [ceph-mds2][DEBUG ] create path if it doesn't exist
> [ceph-mds2][INFO  ] Running command: ceph --cluster ceph --name client.bootstrap-mds --keyring /var/lib/ceph/bootstrap-mds/ceph.keyring auth get-or-create mds.ceph-mds2 osd allow rwx mds allow mon allow profile mds -o /var/lib/ceph/mds/ceph-ceph-mds2/keyring
> [ceph-mds2][ERROR ] 2015-11-14 16:35:13.599807 7fc8dfea5700  0 librados: client.bootstrap-mds authentication error (1) Operation not permitted
> [ceph-mds2][ERROR ] Error connecting to cluster: PermissionError
> [ceph-mds2][ERROR ] exit code from command was: 1
> [ceph_deploy.mds][ERROR ] could not create mds
> [ceph_deploy][ERROR ] GenericError: Failed to create 1 MDSs
I’m also attaching our ceph.conf for the reference.
ceph.conf:
> [global]
> fsid = f1fccdcf-f53f-4a6d-93f2-002f392e98da
> mon_initial_members = ceph-mon1
> mon_host = 192.168.122.213
> auth_cluster_required = cephx
> auth_service_required = cephx
> auth_client_required = cephx
> filestore_xattr_use_omap = true
> public network = 192.168.122.0/256
>
> #[global]
> #auth_service_required = cephx
> #auth_client_required = cephx
> #auth_cluster_required = cephx
>
> [mon.ceph-mon1]
> mon_addr = 192.168.122.213:6789
> host = ceph-mon1
>
> [osd]
> filestore_xattr_use_omap = true
> osd_data = /var/lib/ceph/osd/$cluster-$id
> osd_journal_size = 1024
>
> [mds]
> #mds data = /var/lib/ceph/mds/mds.$id
> #keyring = /etc/ceph/keyring.$id
> debug mon = 20
> debug paxos = 20
> debug auth = 20
>
> [mds.ceph-mds2]
> host = ceph-mds2
I will be really grateful to you if you can help us in resolving this isssue
Best Regards
UTDCloudgroupB
Bug Report
What happened:
After deploying, I tried to mount cephfs using ceph-fuse, but it complained about not having a MDS. The MDS appears to be stuck in the ‘creating’ state. After wiping everything and deploying again, it appears that the MDS can’t complete its creating task.
The status reports that there is reduced availability, but I suspect that this is due to the issue with the MDS:
cluster:
id: 43847e46-e422-478f-8c92-ba68e9b30b8b
health: HEALTH_WARN
mon ubuntu is low on available space
Reduced data availability: 65 pgs inactive
Degraded data redundancy: 65 pgs undersized
services:
mon: 1 daemons, quorum ubuntu (age 40m)
mgr: ubuntu(active, since 40m)
mds: cephfs:1 {0=ubuntu=up:creating}
osd: 9 osds: 9 up (since 39m), 9 in (since 39m)
data:
pools: 3 pools, 65 pgs
objects: 0 objects, 0 B
usage: 9.5 GiB used, 98 GiB / 108 GiB avail
pgs: 100.000% pgs not active
65 undersized+peered
The health detail reports similarly:
HEALTH_WARN mon ubuntu is low on available space; Reduced data availability: 65 pgs inactive; Degraded data redundancy: 65 pgs undersized
[WRN] MON_DISK_LOW: mon ubuntu is low on available space
mon.ubuntu has 23% avail
[WRN] PG_AVAILABILITY: Reduced data availability: 65 pgs inactive
pg 1.0 is stuck inactive for 42m, current state undersized+peered, last acting [8]
pg 2.0 is stuck inactive for 41m, current state undersized+peered, last acting [3]
pg 2.1 is stuck inactive for 41m, current state undersized+peered, last acting [7]
pg 2.2 is stuck inactive for 41m, current state undersized+peered, last acting [5]
pg 2.3 is stuck inactive for 41m, current state undersized+peered, last acting [5]
pg 2.4 is stuck inactive for 41m, current state undersized+peered, last acting [1]
pg 2.5 is stuck inactive for 41m, current state undersized+peered, last acting [8]
pg 2.6 is stuck inactive for 41m, current state undersized+peered, last acting [8]
pg 2.7 is stuck inactive for 41m, current state undersized+peered, last acting [6]
pg 2.8 is stuck inactive for 41m, current state undersized+peered, last acting [0]
pg 2.9 is stuck inactive for 41m, current state undersized+peered, last acting [4]
pg 2.a is stuck inactive for 41m, current state undersized+peered, last acting [1]
pg 2.b is stuck inactive for 41m, current state undersized+peered, last acting [8]
pg 2.c is stuck inactive for 41m, current state undersized+peered, last acting [2]
pg 2.d is stuck inactive for 41m, current state undersized+peered, last acting [5]
pg 2.e is stuck inactive for 41m, current state undersized+peered, last acting [8]
pg 2.f is stuck inactive for 41m, current state undersized+peered, last acting [8]
pg 2.10 is stuck inactive for 41m, current state undersized+peered, last acting [8]
pg 2.11 is stuck inactive for 41m, current state undersized+peered, last acting [0]
pg 2.12 is stuck inactive for 41m, current state undersized+peered, last acting [3]
pg 2.13 is stuck inactive for 41m, current state undersized+peered, last acting [0]
pg 2.14 is stuck inactive for 41m, current state undersized+peered, last acting [2]
pg 2.15 is stuck inactive for 41m, current state undersized+peered, last acting [1]
pg 2.16 is stuck inactive for 41m, current state undersized+peered, last acting [8]
pg 2.17 is stuck inactive for 41m, current state undersized+peered, last acting [6]
pg 2.18 is stuck inactive for 41m, current state undersized+peered, last acting [5]
pg 3.0 is stuck inactive for 41m, current state undersized+peered, last acting [1]
pg 3.1 is stuck inactive for 41m, current state undersized+peered, last acting [6]
pg 3.2 is stuck inactive for 41m, current state undersized+peered, last acting [3]
pg 3.3 is stuck inactive for 41m, current state undersized+peered, last acting [4]
pg 3.4 is stuck inactive for 41m, current state undersized+peered, last acting [8]
pg 3.5 is stuck inactive for 41m, current state undersized+peered, last acting [5]
pg 3.6 is stuck inactive for 41m, current state undersized+peered, last acting [0]
pg 3.7 is stuck inactive for 41m, current state undersized+peered, last acting [4]
pg 3.8 is stuck inactive for 41m, current state undersized+peered, last acting [4]
pg 3.9 is stuck inactive for 41m, current state undersized+peered, last acting [4]
pg 3.a is stuck inactive for 41m, current state undersized+peered, last acting [6]
pg 3.b is stuck inactive for 41m, current state undersized+peered, last acting [7]
pg 3.c is stuck inactive for 41m, current state undersized+peered, last acting [5]
pg 3.d is stuck inactive for 41m, current state undersized+peered, last acting [7]
pg 3.e is stuck inactive for 41m, current state undersized+peered, last acting [7]
pg 3.f is stuck inactive for 41m, current state undersized+peered, last acting [7]
pg 3.10 is stuck inactive for 41m, current state undersized+peered, last acting [6]
pg 3.11 is stuck inactive for 41m, current state undersized+peered, last acting [3]
pg 3.12 is stuck inactive for 41m, current state undersized+peered, last acting [6]
pg 3.13 is stuck inactive for 41m, current state undersized+peered, last acting [8]
pg 3.14 is stuck inactive for 41m, current state undersized+peered, last acting [3]
pg 3.15 is stuck inactive for 41m, current state undersized+peered, last acting [8]
pg 3.16 is stuck inactive for 41m, current state undersized+peered, last acting [2]
pg 3.17 is stuck inactive for 41m, current state undersized+peered, last acting [0]
pg 3.19 is stuck inactive for 41m, current state undersized+peered, last acting [8]
[WRN] PG_DEGRADED: Degraded data redundancy: 65 pgs undersized
pg 1.0 is stuck undersized for 41m, current state undersized+peered, last acting [8]
pg 2.0 is stuck undersized for 41m, current state undersized+peered, last acting [3]
pg 2.1 is stuck undersized for 41m, current state undersized+peered, last acting [7]
pg 2.2 is stuck undersized for 41m, current state undersized+peered, last acting [5]
pg 2.3 is stuck undersized for 41m, current state undersized+peered, last acting [5]
pg 2.4 is stuck undersized for 41m, current state undersized+peered, last acting [1]
pg 2.5 is stuck undersized for 41m, current state undersized+peered, last acting [8]
pg 2.6 is stuck undersized for 41m, current state undersized+peered, last acting [8]
pg 2.7 is stuck undersized for 41m, current state undersized+peered, last acting [6]
pg 2.8 is stuck undersized for 41m, current state undersized+peered, last acting [0]
pg 2.9 is stuck undersized for 41m, current state undersized+peered, last acting [4]
pg 2.a is stuck undersized for 41m, current state undersized+peered, last acting [1]
pg 2.b is stuck undersized for 41m, current state undersized+peered, last acting [8]
pg 2.c is stuck undersized for 41m, current state undersized+peered, last acting [2]
pg 2.d is stuck undersized for 41m, current state undersized+peered, last acting [5]
pg 2.e is stuck undersized for 41m, current state undersized+peered, last acting [8]
pg 2.f is stuck undersized for 41m, current state undersized+peered, last acting [8]
pg 2.10 is stuck undersized for 41m, current state undersized+peered, last acting [8]
pg 2.11 is stuck undersized for 41m, current state undersized+peered, last acting [0]
pg 2.12 is stuck undersized for 41m, current state undersized+peered, last acting [3]
pg 2.13 is stuck undersized for 41m, current state undersized+peered, last acting [0]
pg 2.14 is stuck undersized for 41m, current state undersized+peered, last acting [2]
pg 2.15 is stuck undersized for 41m, current state undersized+peered, last acting [1]
pg 2.16 is stuck undersized for 41m, current state undersized+peered, last acting [8]
pg 2.17 is stuck undersized for 41m, current state undersized+peered, last acting [6]
pg 2.18 is stuck undersized for 41m, current state undersized+peered, last acting [5]
pg 3.0 is stuck undersized for 41m, current state undersized+peered, last acting [1]
pg 3.1 is stuck undersized for 41m, current state undersized+peered, last acting [6]
pg 3.2 is stuck undersized for 41m, current state undersized+peered, last acting [3]
pg 3.3 is stuck undersized for 41m, current state undersized+peered, last acting [4]
pg 3.4 is stuck undersized for 41m, current state undersized+peered, last acting [8]
pg 3.5 is stuck undersized for 41m, current state undersized+peered, last acting [5]
pg 3.6 is stuck undersized for 41m, current state undersized+peered, last acting [0]
pg 3.7 is stuck undersized for 41m, current state undersized+peered, last acting [4]
pg 3.8 is stuck undersized for 41m, current state undersized+peered, last acting [4]
pg 3.9 is stuck undersized for 41m, current state undersized+peered, last acting [4]
pg 3.a is stuck undersized for 41m, current state undersized+peered, last acting [6]
pg 3.b is stuck undersized for 41m, current state undersized+peered, last acting [7]
pg 3.c is stuck undersized for 41m, current state undersized+peered, last acting [5]
pg 3.d is stuck undersized for 41m, current state undersized+peered, last acting [7]
pg 3.e is stuck undersized for 41m, current state undersized+peered, last acting [7]
pg 3.f is stuck undersized for 41m, current state undersized+peered, last acting [7]
pg 3.10 is stuck undersized for 41m, current state undersized+peered, last acting [6]
pg 3.11 is stuck undersized for 41m, current state undersized+peered, last acting [3]
pg 3.12 is stuck undersized for 41m, current state undersized+peered, last acting [6]
pg 3.13 is stuck undersized for 41m, current state undersized+peered, last acting [8]
pg 3.14 is stuck undersized for 41m, current state undersized+peered, last acting [3]
pg 3.15 is stuck undersized for 41m, current state undersized+peered, last acting [8]
pg 3.16 is stuck undersized for 41m, current state undersized+peered, last acting [2]
pg 3.17 is stuck undersized for 41m, current state undersized+peered, last acting [0]
pg 3.19 is stuck undersized for 41m, current state undersized+peered, last acting [8]
What you expected to happen:
I expect the MDSs to complete, or issue some warning as to why they cannot make forward progress
How to reproduce it (minimal and precise):
all.yml:
mon_group_name: mons
osd_group_name: osds
mds_group_name: mdss
mgr_group_name: mgrs
monitoring_group_name: monitoring
ceph_origin: repository
ceph_stable_release: octopus
generate_fsid: true
ceph_conf_key_directory: /etc/ceph
ceph_keyring_permissions: ‘0600’
cephx: true
monitor_interface: ens192
journal_size: 512
public_network: 192.168.0.0/16
dashboard_enabled: False
osds.yml:
copy_admin_key: true
devices:
- /dev/sdb
- /dev/sdc
- /dev/sdd
mdss.yml:
copy_admin_key: true
mons.yml:
mon_group_name: mons
clients.yml:
copy_admin_key: true
inventory:
[clients]
Client_0 ansible_host=192.168.19.15 ansible_python_interpreter=/usr/bin/python3
[mdss]
MDS_0 ansible_host=192.168.13.15 ansible_python_interpreter=/usr/bin/python3
MDS_1 ansible_host=192.168.14.15 ansible_python_interpreter=/usr/bin/python3
MDS_2 ansible_host=192.168.15.15 ansible_python_interpreter=/usr/bin/python3
[monitoring]
Mon_0 ansible_host=192.168.16.15 ansible_python_interpreter=/usr/bin/python3
Mon_1 ansible_host=192.168.17.15 ansible_python_interpreter=/usr/bin/python3
Mon_2 ansible_host=192.168.18.15 ansible_python_interpreter=/usr/bin/python3
[mons]
Mon_0 ansible_host=192.168.16.15 ansible_python_interpreter=/usr/bin/python3
Mon_1 ansible_host=192.168.17.15 ansible_python_interpreter=/usr/bin/python3
Mon_2 ansible_host=192.168.18.15 ansible_python_interpreter=/usr/bin/python3
[osds]
OSD_0 ansible_host=192.168.10.15 ansible_python_interpreter=/usr/bin/python3
OSD_1 ansible_host=192.168.11.15 ansible_python_interpreter=/usr/bin/python3
OSD_2 ansible_host=192.168.12.15 ansible_python_interpreter=/usr/bin/python3
ansible.log
Environment:
- OS (e.g. from /etc/os-release): Ubuntu 18.04.5 LTS
- Kernel (e.g.
uname -a): Linux ubuntu 4.15.0-112-generic Add developement packages support #113-Ubuntu SMP Thu Jul 9 23:41:39 UTC 2020 x86_64 x86_64 x86_64 GNU/Linux - Ansible version (e.g.
ansible-playbook --version): ansible-playbook 2.9.0
config file = /etc/ansible/ansible.cfg
configured module search path = [‘/home/blue/.ansible/plugins/modules’, ‘/usr/share/ansible/plugins/modules’]
ansible python module location = /home/blue/.local/lib/python3.6/site-packages/ansible
executable location = /home/blue/.local/bin/ansible-playbook
python version = 3.6.9 (default, Jul 17 2020, 12:50:27) [GCC 8.4.0] - ceph-ansible version (e.g.
git head or tag or stable branch): master, 54ba38e - Ceph version (e.g.
ceph -v): ceph version 15.2.5 octopus stable
We all love it when our computers are running seamlessly with little or no annoying issue. However, like every other technology product, we sometimes encounter these problems that often get us sad.
These issues range from our hardware to the software. On rare occasions, we encounter software problems that affect the hardware, such as the mds_stores on Mac and high CPU consumption.
When this error occurs, that seamless surfing that you enjoyed ceases, and your machine severely slows down. Most times, your system overheats and places more pressure on your cooling fan.
If you are at this juncture, don’t fret, this article will show you how to solve that annoying problem, but first, let’s get to know more about it.
What is the mds_stores process?
The mds stand for MetaData Server; it is a background process that is often associated with Mac’s Spotlight. No doubt, the mds_stores was created for good, but sometimes it does more than is expected, resulting in 90% – 100% consumption of the CPU process, which makes your Mac slow down unnecessarily.
How this happens is, Spotlight by default, makes searching on your Mac computer easy; what it does is, with the help of the mds, mds_stores, and mdworker process, it indexes all the data that are in your hard drive. Hence, you easily find whatever you want with a simple search on Spotlight.
Why does it take long to index?
We can agree that Spotlight is a unique and essential feature of Mac, so allowing it to do its job is ideal. However, it’s annoying when a supposed background process stops you from doing anything, so will we let it stop us from using our computer? No.
By default, the indexing process should take between 15 to 45 minutes; its duration depends on a few factors, which you will see below. You can confirm if MDS and Spotlight are indexing by checking the Spotlight icon, often located at the menu bar’s upper right corner. A magnifying glass represents Spotlight.
If you find a dot at the center of the Spotlight icon, you know indexing is going on. When you click on it, Mac will show you the index duration.
What makes the mds_stores on Mac to consume a high CPU?
You can configure the Spotlight index to start manually or automatically. However, it usually comes on when you restart your computer. The spike is often due to large deletion or addition of data on your hard drive.
You could be having this considerable spike when Spotlight is indexing locations and folders you likely won’t need, such as your TimeMachine’s backup. It could also increase CPU usage when an app or multiple apps are continually changing some folder contents.
Other factors like;
- Hard disk size
- Size of your directories
- Last date Spotlight indexed your device
- Your Mac’s speed
You can confirm the high CPU usage by launching your Activity Monitor. You should see the amount of resources mds_stores on mac uses, now proceed to the part for solutions.
How to fix the mds_stores process error
The earlier you tackle the issue, the better; when your CPU resources are overly consumed, your computer might become unusable, it might freeze, deteriorate, malfunction, hang and fail to respond to commands. If it persists, your Mac then overheats, and the fan keeps running, which isn’t advisable. You can either;
- Reboot your Mac
- Disable Spotlight
- Temporarily stop and restart Spotlight
- Reduce Spotlight indexing data
Most of the solutions here may need Administrator permission by requesting your Admin Password. If you are currently signed in with a guest account, you should switch to the Administrator account.
1. Reboot your Mac
Rebooting has been known to fix many issues, including the mds_stores process on Mac. Suppose you notice any of the signs of the mds_process error and can confirm from the Activity Monitor, your first resolution should be to reboot your computer.
Follow the usual steps you take to restart your machine. When you are back in, check the Activity Monitor if the huge resource consumption has reduced; if the error persists, go-to solution two.
2. Disable Spotlight
Since mds, mds_stores, and mdworker process are all background processes orchestrated by Spotlight, simply disabling Spotlight should solve the issue.
- Locate and open the Finder app from your computer’s Desktop
- Select the Applications folder to expand it.
- Go to Utilities to access the apps in the utility category.
- Click on the Terminal app to launch it.
- Input the following command in the terminal sudo mdutil -a -I off and strike the Enter/Return key.
- When prompted, input your Admin Password.
- Hit the Enter/Return key again to proceed.
- Check if the error persists.
To Enable Spotlight, follow steps 1 to 5 above but this time input sudo mdutil -a -I on, then follow all on-screen instructions.
3. Temporarily Stop and Restart Spotlight
You can temporarily stop Spotlight from running, this is different from the method above, but it still involves Spotlight.
- Launch your Finder app and expand the Applications section.
- Access the Utility apps and select Terminal.
- Input the following command sudo launchctl unload -w/System/Library/LaunchDaemons/com.apple.metadata.mds.plist and hit Enter.
- Input your Admin password in the field provided and strike Enter.
- Restart your Mac and confirm if the error persists.
To restart Spotlight
- Launch Finder app > Applications > Utilities and select Terminal.
- Type in sudo launchctl -w/System/Library/LaunchDaemons/com.apple.metadata.mds.plist then hit Enter.
- Input your Admin Password in the field provided.
- Go ahead and restart your machine and check the Activity Monitor if there’s an improvement.
4. Reduce Spotlight indexing data
If, after trying all the solutions above, the error persists, we should reduce Spotlight indexing data. What we will do here is remove some folders and locations from Spotlight indexing, but first, we will;
- Delete Spotlight database
- Re-index the Spotlight database
- Prevent Spotlight from indexing some locations and folders
This may take some time, but it will prevent any future issues.
I. Delete Spotlight Database
1. Open your Finder app and expand the Applications section.
2. Select Utilities and launch Terminal
3. Input the command sudo rm -rf /.Spotlight-V100/ and hit Enter.
4. When asked, type in your Admin password, then hit Enter to proceed. That command deletes the Spotlight database.
II. Re-index the Spotlight Database
After deleting your Spotlight database, you should restart your Mac and allow Spotlight to reindex the data in your hard drive.
III. Prevent Spotlight from Indexing Some Locations and Folders
As we noted, the massive consumption of resources could also be due to mds_stores searching locations and folders irrelevant to you.
- Go to Desktop, then select System Preferences.
- Search for Spotlight, navigate to Privacy
- In the Privacy tab, drag and drop the folders and add the locations you’ll love Spotlight to avoid.
A few folders you should consider are
- CrashPlan
- Dropbox
- CrashReporter
- MobileSync
- Timemachine backups
- Viber PC
When you do this, Spotlight won’t consume unnecessary resources indexing these folders and locations again. Due to this, the CPU workload will reduce.
Conclusion
Though we don’t plan for any of these errors we encounter, we can often solve them ourselves without taking our Mac to an Apple shop. The mds_store on Mac is essential to our devices.
However, when it starts consuming too much CPU resources, we may need to either Reboot our Mac, Disable Spotlight, Temporarily stop and restart Spotlight or Reduce Spotlight index data. Please ensure you follow the instructions verbatim and share with us how you solved the error. Thank you for stopping by.
More Mac Troubleshooting Guides
- 10 Quick Fixes For the “Apple iTunes Error 9006” on Mac
- 5 Practical Ways to Recover Unsaved Word Documents on Mac
- How to fix the MacBook trackpad not clicking Error (Solved)
Содержание
- TASK ERROR: start failed
- Mellgood
- How to Unlock a Proxmox VM
- Proxmox Locked VM Errors
- Error: VM is locked
- can’t lock file ‘/var/lock/qemu-server/lock- .conf’ – got timeout
- Proxmox Unlock VM Methods
- qm unlock
- Manually Deleting the Lock
- TASK ERROR: VM is locked (backup)
- jmjosebest
- jmjosebest
- PC Rescue
- RollMops
- fabian
- RollMops
- fabian
- RollMops
- TASK ERROR: VM is locked (backup)
- Can’t unlock vm
- mmohamed2
- t.lamprecht
- mmohamed2
TASK ERROR: start failed
Mellgood
New Member
Hi, after a failed clone and proxmox + host restart I got this error:
TASK ERROR: VM is locked (clone)
I tried:
qm unlock 106
but now i got another error:
kvm: -drive file=/var/lib/vz/images/106/vm-106-disk-1.qcow2,if=none,id=drive-scsi0,format=qcow2,cache=none,aio=native,detect-zeroes=on: qcow2: Image is corrupt; cannot be opened read/write
TASK ERROR: start failed: command ‘/usr/bin/kvm -id 106 -chardev ‘socket,id=qmp,path=/var/run/qemu-server/106.qmp,server,nowait’ -mon ‘chardev=qmp,mode=control’ -pidfile /var/run/qemu-server/106.pid -daemonize -smbios ‘type=1,uuid=24d6521e-95c7-463e-97fe-e79e16051387’ -name TMP -smp ‘4,sockets=2,cores=2,maxcpus=4’ -nodefaults -boot ‘menu=on,strict=on,reboot-timeout=1000,splash=/usr/share/qemu-server/bootsplash.jpg’ -vga std -vnc unix:/var/run/qemu-server/106.vnc,x509,password -cpu kvm64,+lahf_lm,+sep,+kvm_pv_unhalt,+kvm_pv_eoi,enforce -m 10000 -k it -device ‘pci-bridge,id=pci.1,chassis_nr=1,bus=pci.0,addr=0x1e’ -device ‘pci-bridge,id=pci.2,chassis_nr=2,bus=pci.0,addr=0x1f’ -device ‘piix3-usb-uhci,id=uhci,bus=pci.0,addr=0x1.0x2’ -device ‘usb-tablet,id=tablet,bus=uhci.0,port=1’ -chardev ‘socket,path=/var/run/qemu-server/106.qga,server,nowait,id=qga0’ -device ‘virtio-serial,id=qga0,bus=pci.0,addr=0x8’ -device ‘virtserialport,chardev=qga0,name=org.qemu.guest_agent.0’ -device ‘virtio-balloon-pci,id=balloon0,bus=pci.0,addr=0x3’ -iscsi ‘initiator-name=iqn.1993-08.org.debian:01:3681fcbb6821’ -drive ‘file=/var/lib/vz/template/iso/debian-9.4.0-amd64-netinst.iso,if=none,id=drive-ide2,media=cdrom,aio=threads’ -device ‘ide-cd,bus=ide.1,unit=0,drive=drive-ide2,id=ide2,bootindex=200’ -device ‘virtio-scsi-pci,id=scsihw0,bus=pci.0,addr=0x5’ -drive ‘file=/var/lib/vz/images/106/vm-106-disk-1.qcow2,if=none,id=drive-scsi0,format=qcow2,cache=none,aio=native,detect-zeroes=on’ -device ‘scsi-hd,bus=scsihw0.0,channel=0,scsi-id=0,lun=0,drive=drive-scsi0,id=scsi0,bootindex=100’ -netdev ‘type=tap,id=net0,ifname=tap106i0,script=/var/lib/qemu-server/pve-bridge,downscript=/var/lib/qemu-server/pve-bridgedown’ -device ‘e1000,mac=86:CA:F0:6E:FB:EB,netdev=net0,bus=pci.0,addr=0x12,id=net0,bootindex=300» failed: exit code 1
Is it possible to recover the corrupted img?
ty in advice
Источник
How to Unlock a Proxmox VM

From time to time, you’ll come across the need to kill a lock on your Proxmox server. Fear not, in today’s guide we’ll discuss the various lock errors you may face and how to unlock a Proxmox VM.
Proxmox Locked VM Errors
Error: VM is locked
The «VM is locked» error is the most common circumstance in which you may want to kill a VM lock. This error has a lot of variants including:
- Error: VM is locked (backup)
- Error: VM is locked (snapshot)
- Error: VM is locked (clone)
 Error: VM is locked in Proxmox
As you can see, they all share the same «Error: VM is locked» root, but with a suffix that indicates the task that initiated the lock, whether that task be a backup, a snapshot, or clone. This can be useful for determining IF you should clear the lock. (i.e. if the backup job is still running, you probably shouldn’t clear the lock and just let the backup process complete).
can’t lock file ‘/var/lock/qemu-server/lock- .conf’ – got timeout
This is another common error, often seen when you’re trying to shutdown/stop a virtual machine or when qm unlock fails (see below).
Proxmox Unlock VM Methods
There are two main ways of clearing a lock on a Proxmox VM: 1) using the qm unlock command and 2) manually deleting the lock.
qm unlock
qm unlock should be your first choice for unlocking a Proxmox VM.
First, find your VM ID (it’s the number next to your VM in the Proxmox GUI). If you’re not using the WebGUI, you can obtain a list of your VM IDs with:
Unlock the VM/kill the lock with:
Now, this may not always work, and the command may fail with:
In that case, let’s move on to plan B: manually deleting the lock.
Manually Deleting the Lock
If you received the error message, «can’t lock file ‘/var/lock/qemu-server/lock- .conf’ — got timeout», you can fix this by manually deleting the lock at that location. Simply put, you can just run the following command:
Obviously, this should be a last resort. It’s generally not a great practice to go around killing locks, but sometimes you have no choice.
I hope this guide helped you out. Let me know if you have any questions or feel I left something out in the comments/forums below!
Источник
TASK ERROR: VM is locked (backup)
jmjosebest
Active Member
Hi, after a full host restart I get this error starting a virtual machine KVM.
TASK ERROR: VM is locked (backup)
/var/lib/vz/lock is empty.
How can I unlock?
Thanks
jmjosebest
Active Member
PC Rescue
New Member
RollMops
Active Member

fabian
Proxmox Staff Member
Best regards,
Fabian
Do you already have a Commercial Support Subscription? — If not, Buy now and read the documentation
RollMops
Active Member
fabian
Proxmox Staff Member
check the system logs around the time of the failed backup, try manually backing up the VM a couple of times and check for failure.
it might have been a one time fluke.
Best regards,
Fabian
Do you already have a Commercial Support Subscription? — If not, Buy now and read the documentation
RollMops
Active Member
I can provoke a system crash by manually starting a backup of the VE that I use to find in a locked state.
After 1 or 2 mins., process z_wr_iss takes 97% CPU and subsequently the server fails. It then automatically reboots, but the VE is still locked from the pending/failed backup process and does not automatically recover.
I attach a screenshot of the last state seen in «top».
Could this be prevented by adding some RAM to the box?
Источник
TASK ERROR: VM is locked (backup)
Active Member
Occasionally, usually every 2-3 days (I have nightly backups setup), my lxc containers freeze and ‘pct unlock’ won’t unlock them and I have to reboot the nodes.
This appears to be a common problem with lxc (I wish I would have stayed with openvz). Is there any solution to this? I’m backing up to a LVM storage
root@rovio:/media# pvdisplay ; lvdisplay ; mount
— Physical volume —
PV Name /dev/sdb3
VG Name pve
PV Size 447.00 GiB / not usable 3.84 MiB
Allocatable yes
PE Size 4.00 MiB
Total PE 114432
Free PE 4095
Allocated PE 110337
PV UUID mK0CnO-c5LV-kPJs-E6aw-Fupo-G0qg-OaPfHE
— Physical volume —
PV Name /dev/md0
VG Name store
PV Size 931.39 GiB / not usable 4.69 MiB
Allocatable yes (but full)
PE Size 4.00 MiB
Total PE 238434
Free PE 0
Allocated PE 238434
PV UUID fU89Zd-gihP-B5ta-Wzk5-7UsT-Uju0-C2AExy
— Logical volume —
LV Path /dev/pve/swap
LV Name swap
VG Name pve
LV UUID GGcRZ9-Q12y-FLsv-n0ds-ZEO9-9yaU-60A2i8
LV Write Access read/write
LV Creation host, time proxmox, 2016-01-11 06:53:53 -0500
LV Status available
# open 2
LV Size 31.00 GiB
Current LE 7936
Segments 1
Allocation inherit
Read ahead sectors auto
— currently set to 256
Block device 252:1
— Logical volume —
LV Path /dev/pve/root
LV Name root
VG Name pve
LV UUID mw530S-A1SO-BCIR-Taad-ORid-1nL7-wJaIEC
LV Write Access read/write
LV Creation host, time proxmox, 2016-01-11 06:53:53 -0500
LV Status available
# open 1
LV Size 96.00 GiB
Current LE 24576
Segments 1
Allocation inherit
Read ahead sectors auto
— currently set to 256
Block device 252:0
— Logical volume —
LV Path /dev/pve/data
LV Name data
VG Name pve
LV UUID I7NH4F-e3VY-7z0R-RuVK-kOos-1WB3-QOWH7C
LV Write Access read/write
LV Creation host, time proxmox, 2016-01-11 06:53:53 -0500
LV Status available
# open 1
LV Size 304.00 GiB
Current LE 77825
Segments 1
Allocation inherit
Read ahead sectors auto
— currently set to 256
Block device 252:2
— Logical volume —
LV Path /dev/store/store
LV Name store
VG Name store
LV UUID ixRcPS-6wIf-k58J-ubbx-ksJx-ABdi-giLfKe
LV Write Access read/write
LV Creation host, time rovio, 2016-01-29 19:07:14 -0500
LV Status available
# open 1
LV Size 931.38 GiB
Current LE 238434
Segments 1
Allocation inherit
Read ahead sectors auto
— currently set to 256
Block device 252:3
Источник
Can’t unlock vm
mmohamed2
New Member
i have errors when i try to backup 
I tried
- qm unlock 129
but i got
- unable to open file ‘/etc/pve/nodes/proxmoxtiebosch/qemu-server/129.conf.tmp.22475’ — Input/output error
Also i can’t create folder 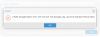

How can i fix it please ?
Thank you !

t.lamprecht
Proxmox Staff Member
First: you’re on a pretty outdated version of Proxmox VE, the current version of the old 5.x release is 5.4, and 6.1 would be available already..
That said, it seems like the cluster file system hangs, this could be due to two things:
* some bug / situation which made the pmxcfs lock up
* Real hardware error, e.g., a faulty disk where the database of the pmxcfs is, or some thing similar.
Please post some additional info:
Best regards,
Thomas
Do you already have a Commercial Support Subscription? — If not, Buy now and read the documentation
mmohamed2
New Member
Thank you for reply,
Can you guide me how to upgrade Proxmox VE please ?
# ps aux|grep pmxcfs
root 4361 0.1 0.1 1136680 59048 ? Ssl Apr08 4:14 /usr/bin/pmxcfs
root 7465 0.0 0.0 12784 852 pts/1 S+ 09:52 0:00 grep pmxcfs
# systemctl status pve-cluster
● pve-cluster.service — The Proxmox VE cluster filesystem
Loaded: loaded (/lib/systemd/system/pve-cluster.service; enabled; vendor preset: enabled)
Active: active (running) since Wed 2020-04-08 12:18:11 CEST; 2 days ago
Main PID: 4361 (pmxcfs)
Tasks: 13 (limit: 4915)
Memory: 59.2M
CPU: 4min 15.268s
CGroup: /system.slice/pve-cluster.service
└─4361 /usr/bin/pmxcfs
Apr 09 01:32:46 proxmoxtiebosch pmxcfs[4361]: [status] notice: RRDC update error /var/lib/rrdcached/db/pve2-storage/proxmoxtiebosch/local: -1
Apr 09 01:32:46 proxmoxtiebosch pmxcfs[4361]: [status] notice: RRDC update error /var/lib/rrdcached/db/pve2-storage/proxmoxtiebosch/local-zfs: -1
Apr 09 01:35:48 proxmoxtiebosch pmxcfs[4361]: [status] notice: RRDC update error /var/lib/rrdcached/db/pve2-storage/proxmoxtiebosch/rpool2: -1
Apr 09 01:35:48 proxmoxtiebosch pmxcfs[4361]: [status] notice: RRDC update error /var/lib/rrdcached/db/pve2-storage/proxmoxtiebosch/local: -1
Apr 09 01:35:48 proxmoxtiebosch pmxcfs[4361]: [status] notice: RRDC update error /var/lib/rrdcached/db/pve2-storage/proxmoxtiebosch/local-zfs: -1
Apr 09 01:36:38 proxmoxtiebosch pmxcfs[4361]: [status] notice: RRDC update error /var/lib/rrdcached/db/pve2-storage/proxmoxtiebosch/local-zfs: -1
Apr 09 01:36:38 proxmoxtiebosch pmxcfs[4361]: [status] notice: RRDC update error /var/lib/rrdcached/db/pve2-storage/proxmoxtiebosch/local: -1
Apr 09 01:36:38 proxmoxtiebosch pmxcfs[4361]: [status] notice: RRDC update error /var/lib/rrdcached/db/pve2-storage/proxmoxtiebosch/rpool2: -1
Apr 09 01:46:26 proxmoxtiebosch pmxcfs[4361]: [database] crit: commit transaction failed: database or disk is full#010
Apr 09 01:46:26 proxmoxtiebosch pmxcfs[4361]: [database] crit: rollback transaction failed: cannot rollback — no transaction is active#010
Disk spaces 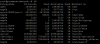
Источник