Ошибки VMware vCenter и срабатывание аларма PostgreSQL Archiver Service Health Alarm. Как вести себя, когда что-то не запускается?
Реклама:
Интересная проблема появилась у автора блога nerdynate.life — в один из моментов на сервере VMware vCenter появились вот такие алармы:

Самая настораживающая ошибка тут — это PostgreSQL Archiver Service Health Alarm на сервере vCenter. Автор пошел в лог vCenter для сервиса PostgreSQL Archiver:
/var/log/vmware/vpostgres/pg_archiver.log-[n].stderr
В логе было примерно следующее:
Погуглив статьи KB, автор понял, что проблема связана с тем, что сервис Watchdog не стартовал. Догадка подкрепилась вот этим постом. Результатом запуска команды:
/etc/init.d/sfcbd-watchdog status
sfcbd is not running
То есть сервис sfcbd-watchdog не запустился. А запустить его можно командой:
/etc/init.d/sfcbd-watchdog start
Если запуск не удался, то нужно выполнить следующую команду:
esxcli system wbem set –-enable true
Это должно было помочь, но автору не особо помогло (а точнее помогло лишь временно). Погуглив еще, он нашел статью базы знаний, где говорилось, что причина незапуска сервиса заключается в некорректно настроенной синхронизации времени сервера vCenter и хоста ESXi, где он исполнялся в виртуальной машине. При этом как на vCenter, так и на ESXi, где он находился, синхронизация времени была настроена через внешний NTP.
В итоге автору помогло отключение синхронизации через NTP и включение синхронизации времени с хостом через VMware Tools. После этого алармы перестали появляться.
Казалось бы, это очень частная ситуация, и что о ней рассказывать у нас на сайте? А это просто очень хорошая иллюстрация к простому факту: если у вас что-то сломалось, что раньше работало, или не логинится туда, куда раньше логинилось, проверьте следующие вещи в первую очередь:
Источник
vElements.net
Daily Posts of Cloud Computing Evangelist!
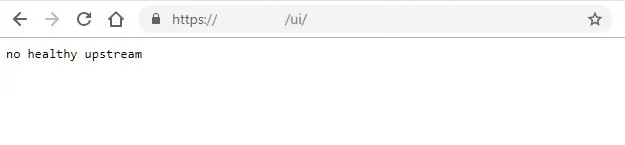
vCenter Server 7.0 HTML5 UI error “no healthy upstream”
After upgrading to vCenter 7 Update 1 , when I tried to browse vCenter HTML5 UI, I faced “no healthy upstream” error. I could access to vCenter Management Interface (VAMI) https://vCenter-IPaddress:5480 without any issues. I could also connect to vCenter Server through SSH but I realized couple of vCenter Server services could not start.
You can also check the details status of services by connecting to vCenter through SSH and run the following command:
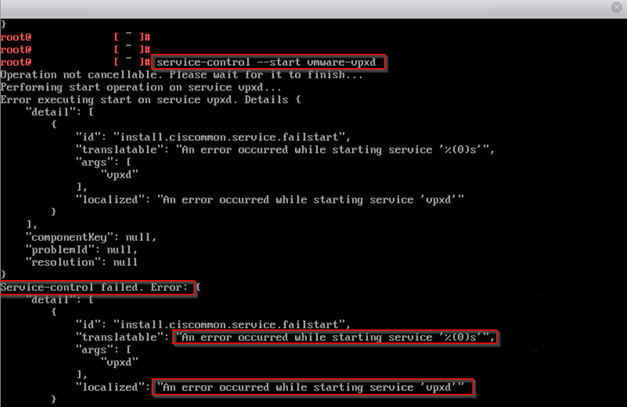
Then I tried to force to start services by below commands:
After waiting for a while, I got the underneath error.
After spending couple of hours reading logs and a bit of googling, I have been pointed towards different answers. First of all I went through all DNS, NTP and IP checks and in my case everything was working as it should.
In my scenario, vCenter’s SSL certificate were replaced with a valid signed certificate and it was one of the reason that points me to check certification validity. Beside this SSL certificate, there are couple of other certificates that vCenter server uses. To get familiar with vSphere certificates you can read the following vSphere documentation:
In my case “Trusted root certificate, Machine SSL Certificate and SMS” were still valid . But ” Machine, vpxd, vpxd-extension and vsphere-webclient” were expired.
You can check the validity of each certificate by running below commands in vCenter server:
Below you can find the expired certificate screen shot:

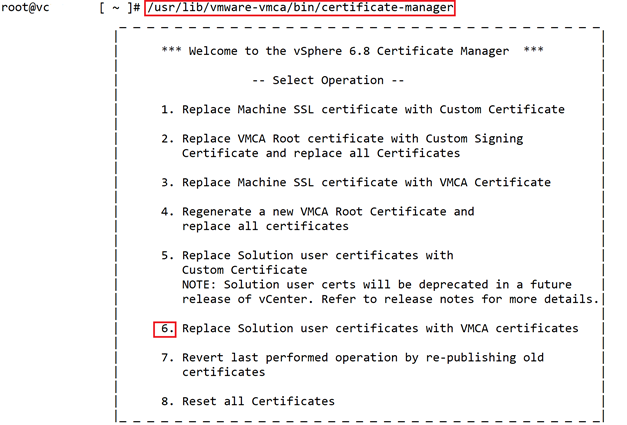
In this case you need to update the expired certificates with use of vCenter certificate manager through running following command on vCenter CLI.
choose number 6 to replace Solution User certificates.
Then you need to answer the required information
- Do you wish to generate all certificates using configuration file : Option[Y/N] ? : Y
- Please provide valid SSO and VC privileged user credential to perform certificate operations.Enter username [Administrator@vsphere.local]:
Note: this is an example how to address each question you need to fill it out based on your environment.
- Enter proper value for ‘Country’ [Default value : US] :US
- Enter proper value for ‘Name’ [Default value : CA] : CA
- Enter proper value for ‘Organization’ [Default value : VMware] : “ vElements lab”
- Enter proper value for ‘OrgUnit’ [Default value : VMware Engineering] : VELEMENTSIT
- Enter proper value for ‘State’ [Default value : California]: California
- Enter proper value for ‘Locality’ [Default value : Palo Alto] : Palo Alto
- Enter proper value for ‘IPAddress’ (Provide comma separated values for multiple IP addresses) [optional] : you can press Enter or provide the required information
- Enter proper value for ‘Email’ [Default value : email@acme.com] : Press Enter
- Enter proper value for ‘Hostname’ (Provide comma separated values for multiple Hostname entries) [Enter valid Fully Qualified DomainName(FQDN), For Example : example.domain.com] : vc.velements.net
- Enter proper value for VMCA ‘Name’ : vc.velements.net You are going to regenerate Solution User Certificates using VMCA
- Continue operation : Option[Y/N] ? : Y
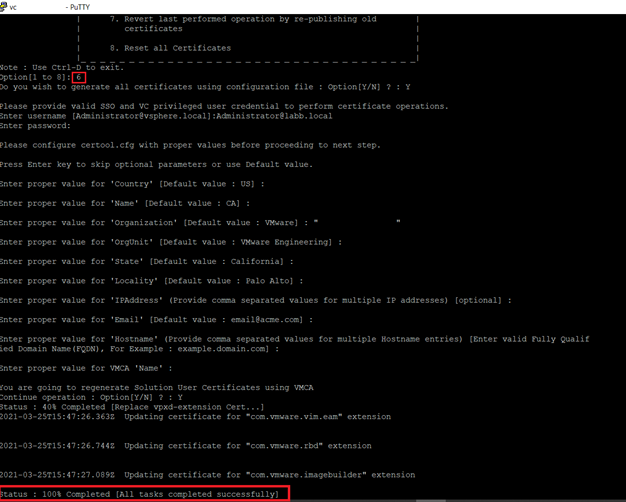
After I successfully updated the certificates , vCenter services got started and I could reach the vCenter UI.
Below you can also find other solutions I found when I was googling
Suggested answers to check
- Upgrade VMware Hardware version and choose the correct OS for vCenter
Note: Take a snapshot from vCenter Server VM before hardware version upgrade, as it’s none reversible task to previous versions.
- Shutdown the vCenter > right click on the VM > Compatibility > Upgrade VM Compatibility.
- Right click on the vCenter and choose Edit settings > VM Options > General Options > Select VMware Photon OS
- Check DNS (you should be able to resolve FQDN names from vCenter)
- Check NTP (Time should be synced and correct between ESXi hosts and vCenter Server)
- vCenter Server IP address should be set Static
All of the services which are set to Automatic start are running without any errors or warnings. Hopefully this will help you to solve your issue.
22 thoughts on “ vCenter Server 7.0 HTML5 UI error “no healthy upstream” ”
This was a really helpful post. Thanks so much for sharing!
Источник
Vcenter server health is green vc health error dbjob2

- Mark as New
- Bookmark
- Subscribe
- Mute
- Subscribe to RSS Feed
- Permalink
- Report Inappropriate Content
I am going to test the vm(autoinfo) with linked clones in Horizon 7.12.
and I have taken several steps, including reviewing the dns and all the settings and installing a new upper vm.
However, in a linked clone desktop pool, the vm does not proceed with customizing.
I installed all the programs related to Horizon in the latest version.
I have been suffering from this problem for two weeks.

- Mark as New
- Bookmark
- Subscribe
- Mute
- Subscribe to RSS Feed
- Permalink
- Report Inappropriate Content
A- Lunch the VCSA Web Console on the vCenter GUI and see what (STATIC) IP was configured.
B- Open the DNS server and only keep that (STATIC) VCSA IP, then delete the other 2 records. Assuming you don’t have vCenter HA enabled.
C- Verify that the right A records for the VCSA are created for forward & reverse look up zones.
D- Make sure that the VCSA FQDN match your DNS records. From the appliance & DNS server.
E- PING both VCSA IP/FQDN Back-and-forth from VCSA to Connection server & Connection server to VCSA.
E- Finally, try to access the VCSA by the FQDN. Use different machine and locations. If you got it properly showing once then check that end point device not showing it.
You need to integrate your AD domain with vSphere «Identity Source» option on the vCenter.
You need to create a service account for VDI.
If possible set up a Certificate Authority (CA) server.
If you don’t have the proper Microsoft Windows License for the master image. You will not be able to recompose and create clones.
Источник
Vcenter server health is green vc health error dbjob2
Today i realized i have this warning on my vCenter:
Anyone has any idea what it might be?

- Mark as New
- Bookmark
- Subscribe
- Mute
- Subscribe to RSS Feed
- Permalink
- Report Inappropriate Content
Absolutely no idea with just one screenshot and no logs or other info.
- Mark as New
- Bookmark
- Subscribe
- Mute
- Subscribe to RSS Feed
- Permalink
- Report Inappropriate Content
you can provide us with log files. I provide you with a link that tells you where to find them.
- Mark as New
- Bookmark
- Subscribe
- Mute
- Subscribe to RSS Feed
- Permalink
- Report Inappropriate Content
Which one(s) you need?
- Mark as New
- Bookmark
- Subscribe
- Mute
- Subscribe to RSS Feed
- Permalink
- Report Inappropriate Content
- Mark as New
- Bookmark
- Subscribe
- Mute
- Subscribe to RSS Feed
- Permalink
- Report Inappropriate Content
Here are the logs.

- Mark as New
- Bookmark
- Subscribe
- Mute
- Subscribe to RSS Feed
- Permalink
- Report Inappropriate Content
vc.health.error.dbjob3 = «Performance statistics rollup from Past Month to Past Year is not occurring in the database»
Check if below partition are highly utilized. If yes ; try to cut down on some old events/tasks. Also perform a shutdown of the VCSA/PSC and then power them up.
If you think your queries have been answered
Mark this response as «Correct» or «Helpful».
- Mark as New
- Bookmark
- Subscribe
- Mute
- Subscribe to RSS Feed
- Permalink
- Report Inappropriate Content
vc.health.error.dbjob3 = «Performance statistics rollup from Past Month to Past Year is not occurring in the database»
Oh, in that case, i already had this issue on 6.5 and 6.0, it started when i upgraded from 5.5 to 6.0 and i was never able to fix it (https://communities.vmware.com/thread/581857)
It seems it just shows in different way in 6.7.
Check if below partition are highly utilized. If yes ; try to cut down on some old events/tasks. Also perform a shutdown of the VCSA/PSC and then power them up.
I already rebooted several times, and still have the same warning.

- Mark as New
- Bookmark
- Subscribe
- Mute
- Subscribe to RSS Feed
- Permalink
- Report Inappropriate Content
I got the same error after I made an upgrade from 6.7.0.43000 to 6.7.0.44000.
I found a work around by uncheck parameter for 1 day in Statistics:
. but in my case, as result of the upgrade I found more damages on vCenter level: vSphere Client (HTML).
- You cannot Acknowledge or Reset to Green vCenter Alarms
- Errors if you want to check «Configuration» (Administration -> Single Sign On -> Configuration-> Active Directory Domain)
- Suddenly is disconnecting the user from vCenter Client UI
Luckily the old vSphere Web Client (flash version) is still working . so I’m still digging .
Источник
vCenter Health Status degraded
by Manfred Hofer · 18. January 2012
Just make a nice vCenter Health Status Problem my first post on my Blog.
I have moved my vCenter Database from a local installed SQL Express 2008 R2 Instance to a SQL 2008 R2 SP1 Instance. So nothing special about that, but after I reconnected to my vCenter and checked the Health Status and the Performance Overview Tab i got this Errors: 


VMware vCenter Storage Monitoring Service – Service initialization failed
Perf Charts service experienced an internal error
After some research and analysing the log files from the VMware vCenter Storage Monitoring Service (C:ProgramDataVMwareVMware VirtualCenterLogssms.log), I found this:
Caused by: com.microsoft.sqlserver.jdbc.SQLServerException: Fehler beim Herstellen der Verbindung mit dem Host ‘VCENTER’, benannte Instanz ‘sqlexpress’. Fehler: ‘java.net.SocketTimeoutException: Receive timed out’.
Caused by: com.microsoft.sqlserver.jdbc.SQLServerException: The connection to the host ‘VCENTER’, named instance ‘sqlexpress’ has failed. Error: ‘java.net.SocketTimeoutException: Receive timed out’.
It seemed that the vCenter tries to reach the old local SQL Express Instance. But how did vCenter get this configuration? In C:ProgramDataVMwareVMware VirtualCenter you will find a file called vcdb.properties. When I opened the file I got this content:
# For Windows, just deduce the JDBC URL and user/password from the
# data source information in the VC registry
usevcdb=true
url=jdbc:sqlserver://VCENTER\SQLEXPRESS;databaseName=vCenter;integratedSecurity=true
dbtype=mssql
driver=com.microsoft.sqlserver.jdbc.SQLServerDriver
To fix this problem I have to change the file content like this:
# For Windows, just deduce the JDBC URL and user/password from the
# data source information in the VC registry
usevcdb=true
url=jdbc:sqlserver:// ;databaseName=vCenter
dbtype=mssql
driver=com.microsoft.sqlserver.jdbc.SQLServerDriver
After this change you have to restart the VMware VirtualCenter Management Webservices and reconnect to the vCenter.
After the Fix: 

Related posts:
3 Responses
Manfred,
Thanks very much for this information. Following some problems installing vCenter 5.5, we created a new SQL Server database (old DB was VCDB and new is VCDB55), changed the ODBC settings for vCenter and reinstalled vCenter. Everything seemed to work fine, but the SQL Server log files were filling with “Login failed for user ‘vpxuser’. Reason: Failed to open the explicitly database. [CLIENT: >”. For whatever reason, the vcdb.properties file was still referencing VCDB. I edited the file and restarted services and no more errors. Thank you! Your post was just what I needed to solve the problem.
Andy
Andy,
really appreciate your feedback and that you found the post useful! 🙂
Cheers,
Fred
Thank you , It was explained clearly and simply and got solved my problem. Thank you.
Источник
Adblock
detector
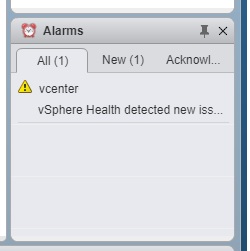
Symptom: You start seeing the alarm “vSphere Health detected new issues in your environment” and it won’t go away.
I wrote about this alarm with one cause: Memory Exhaustion with a Tiny deployment in my other blog. If you navigate to your vCenter appliance website (https://vcenter.company.com:5480) and see memory warnings, check the fix in that blog first.
Symptom: You recently upgraded to vCenter or vSphere ESXi 6.7 U2 (Update 2, April 2019, May 2019)
Symptom: Warning in event logs “Alarm ‘vSphere Health detected new issues in your environment’ on Datacenters changed from Green to Yellow”
Symptom: Warning in event logs: “event.vsphere.online.health.alarm.event.fullFormat (vsphere.online.health.alarm.event)
Symptom: You don’t see anything to explain the issue in the logs. Looks like a false positive?
Symptom: When you navigate to vCenter > Monitor > Health, there is no health tab.
This is the main symptom for this particular issue. Read on!
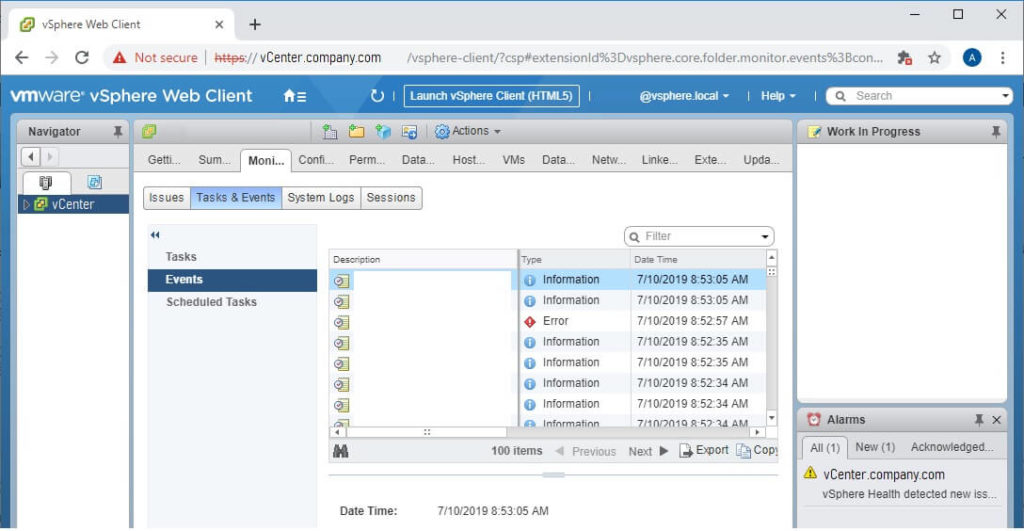
Root Cause #1: You are still using the Flash vSphere client from version 6.0 and 6.5.
You need to change the URL you are using for vSphere and vCenter: https://vCenter.company.com/ui
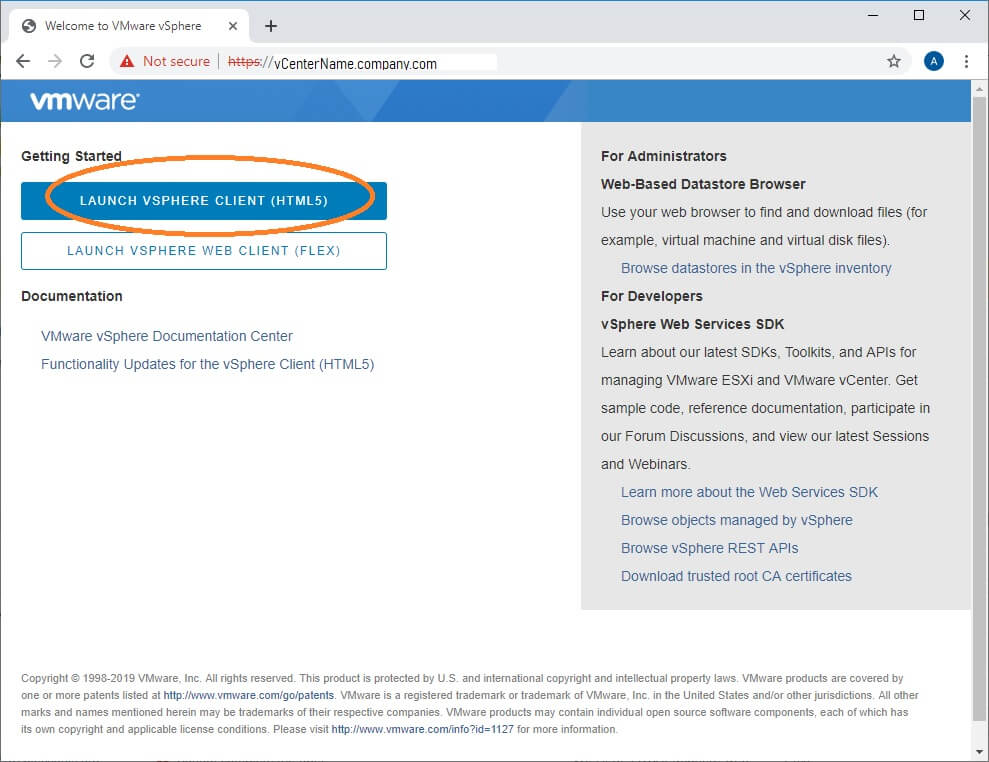
You can find this URL from scratch by navigating directly to your vCenter: https://vCenter.company.com and clicking the HTML5 button
You can also find it right at the top of your vSphere website – Look for a button that says “Launch vSphere Client (HTML5)”
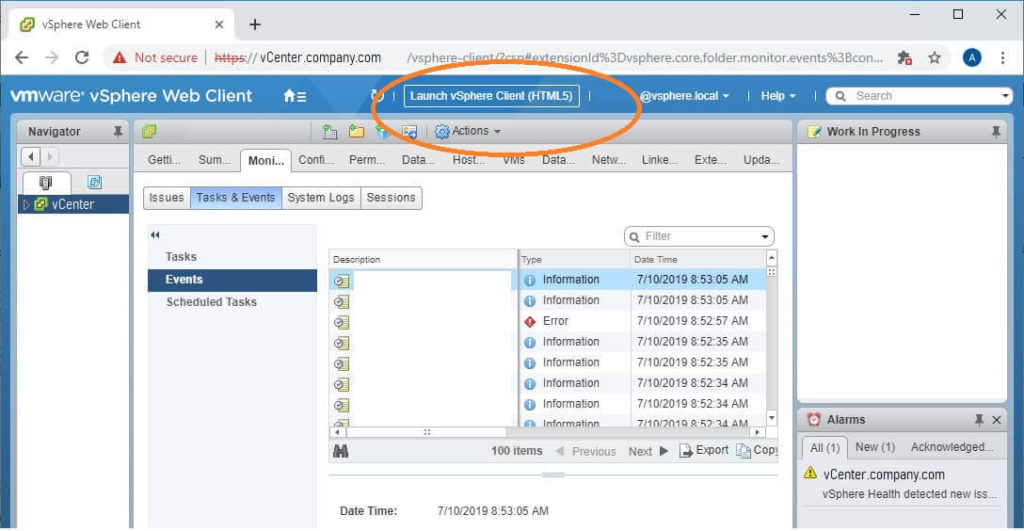
Now that you’ve launched the HTML5 site, you will notice that it looks way different!
Root Cause #2: The latest updates for vCenter and vSphere include new checks for common issues.
The April 2019 and May 2019 release of 6.7 Update 2 include new health checks. Your vCenter will now warn you about things like problematic drivers and known memory leaks.
These checks are only visible in the HTML5 client. This is why you couldn’t find the cause of the alert before. Read on for how to find them.
These checks are also handled by the Customer Experience Improvement Program (VMware CEIP). If you are a typical business (not at high risk from cyber-attack), the CEIP program is highly recommended. If you are at risk from cyber-attack, there are ways to secure the CEIP connection so you can still use it.
How to troubleshoot the cause of vSphere Health detected new issue in VMware 6.7
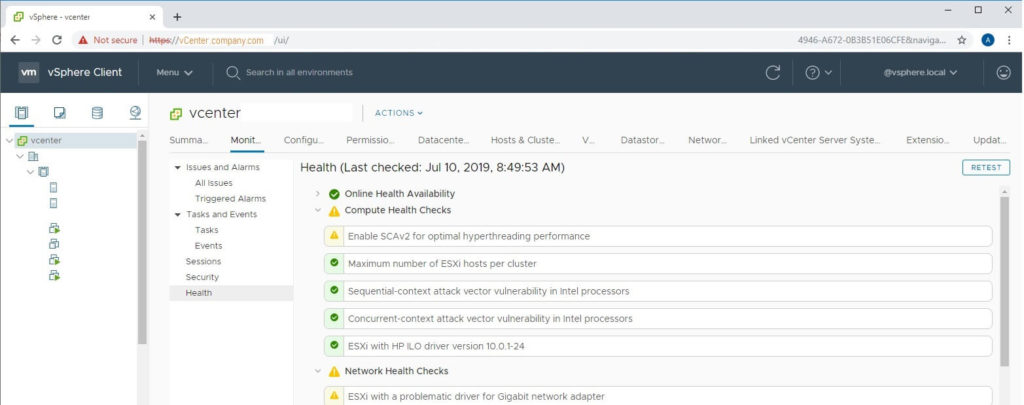
Using the instructions above, open your HTML5 vSphere client by navigating to https://vcenter.company.com/ui
- Select your vCenter object in Hosts & Clusters view. (This is the top level object in your tree)
- Click the Monitor button from the middle menu.
- Click the Health button from the middle-middle menu.
- Identify warnings that have yellow exclamation marks next to them. These are causing your health alarm.
- You can click each item to view information about them. If you select the Info tab for that problem, you will see a button for “Ask VMware” which gives additional help.
- Click the RETEST button on the top-right of the window to see if the issue still exists.
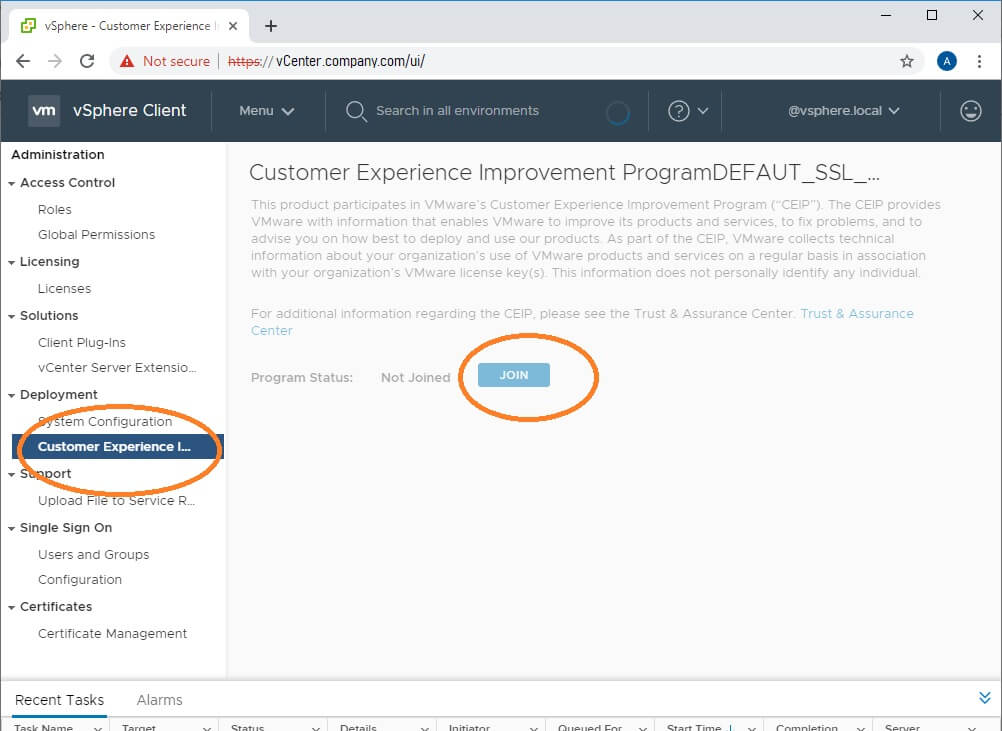
How do I enable CEIP for VMware?
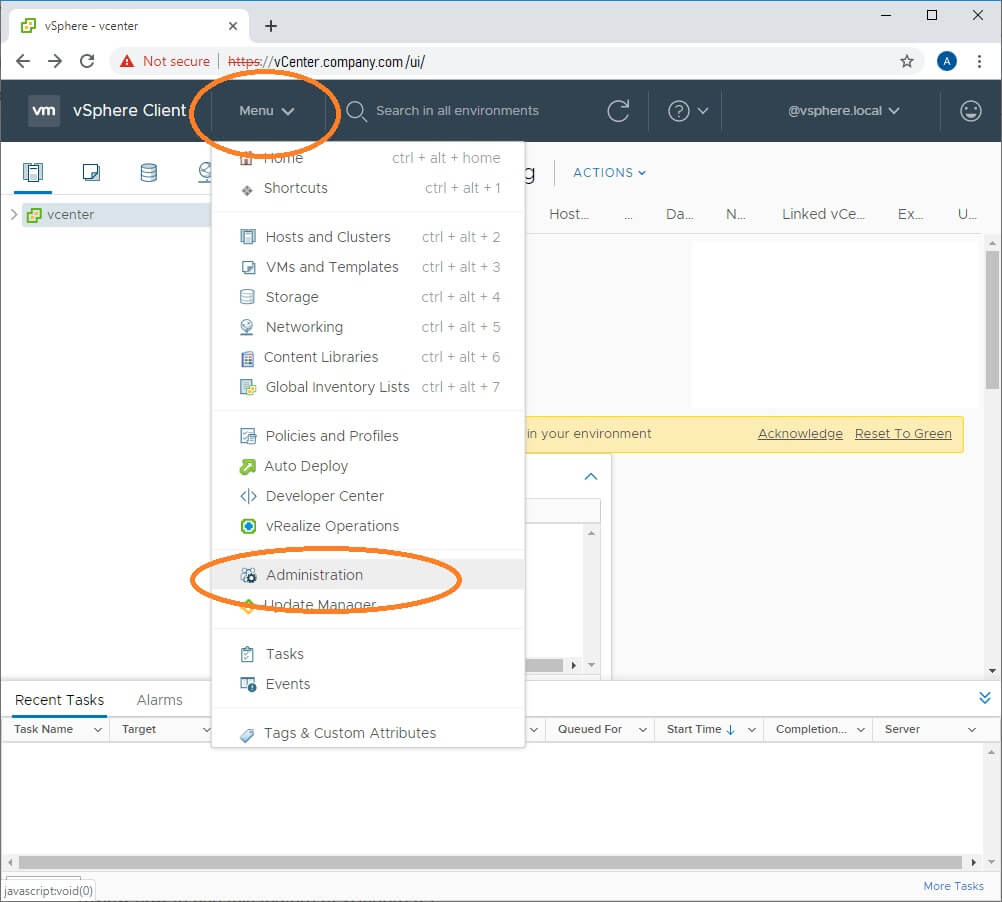
- From the vSphere HTML5 Client, click the Menu drop-down button
- Navigate to Deployment > Customer Experience Improvement Program
- Click Join…
This VMware blog has a nice video of how to click through and enable CEIP if you are having trouble.
How do I fix “Enable SCAv2 for optimal hyperthreading performance”?
This VMware paper describes the issue at great length.
My summary:
This is a continuation of the SPECTRE/MELTDOWN or “L1 Terminal Fault” issue that you’ve heard about.
WARNING: VMware default settings are for highest performance. If you make changes to increase security against SPECTRE / MELTDOWN, your performance may be impacted significantly! In other words, if your virtual environment is using more than 20% CPU at any given time, you should probably NOT enable these changes without a lot of research.
You probably have already applied the fix for previous versions of vSphere. The fix was to edit Advanced System Settings for each host and change the value of VMkernel.Boot.hyperthreadingMitigation = true
In 6.7 Update 2 and later, VMware added VMkernel.Boot.hyperthreadingMitigationIntraVM which defaults to true.
To enable SCAv2, you would verify that VMkernel.Boot.hyperthreadingMitigation = true and change the VMkernel.Boot.hyperthreadingMitigationIntraVM = false and reboot each host.
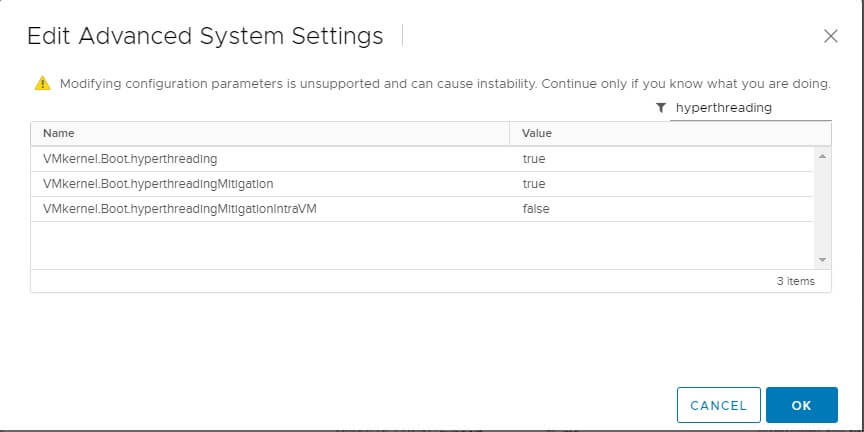
This setting can be reached by opening vSphere Client website (https://vcenter.company.com/ui) then select Hosts & Clusters view, then select a host. Click the Configure tab and select Advanced System Settings from the middle menu. Repeat for each host.
How do I fix “ESXi with a problematic driver for Gigabit network adapter”?
Follow the Ask VMware link on the alert to find specific information about your problematic network card.
It will open a VMware KB article and probably recommend installing an updated driver.
To update to a new driver, here are the basic steps… please use caution and common sense!
- Download the VIB file from VMware
- While you are at it, download the README and review it. If it has instructions, follow those.
- If it is in a .zip format, unzip it and find the .vib file
- Move your VMs to a different host if possible.
- Put your ESXi host into maintenance mode (this procedure could cause impact to any running VMs)
- Back up your ESXi host configuration if you still have any VMs on it (in other words, you can’t afford to rebuild it if something goes wrong).
- Start SSH service in your host > Configuration > Security Profile menu.
- Using WinSCP or another reliable SCP client, connect to your host using IP and root / (root password)
- Navigate to the /tmp/ directory and upload the VIB file to that directory.
- Using Putty or another reliable SSH / console client, connect to your host using IP and root / (root password)
- If your VIB doesn’t say “offline bundle”, type esxcli software vib update -v tmpNameOfVIBFile.vib
- If your VIB says “offline bundle”, type esxcli software vib update -d tmpNameOfVIBFile-offline_bundle.vib
- Read the results.
- If the the result says “Reboot required: true” , then type reboot (this will reboot your host)
- Make sure to test your host with a non-critical VM before moving important VMs to it.
How do I fix “Concurrent-context attack vector vulnerability in Intel processors”?
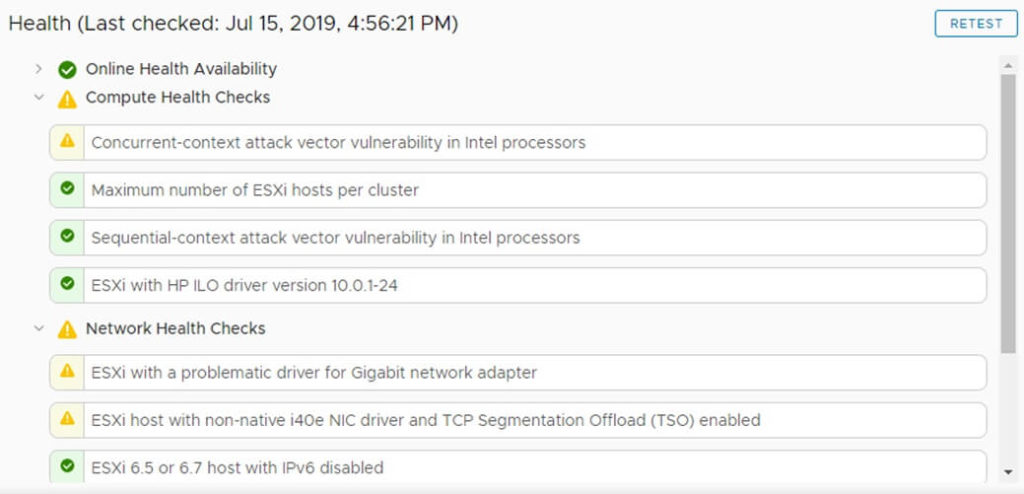
This error is referring to the “L1 Terminal Fault” which is widely known as SPECTRE / MELTDOWN.
Basically, there is a flaw in all Intel Processors (at least as of late 2018) which allows processes running in the operating system to observe what the CPU is doing with other processes. This is a critical vulnerability for cloud hosts or any servers that allow untrusted users to access them.
L1 Terminal Fault a major concern for cloud hosting companies, not on-premises companies
For example, if you have an account on AWS, your virtual servers are running on the same physical hardware as other people’s virtual servers. If this vulnerability isn’t mitigated, then you could potentially write code to steal data from the other customers, or vice-versa.
To my knowledge, the vulnerability cannot be exploited without running a process on the system, and most of the people who run processes on servers have no need to snoop on the CPU. In other words, if all the other admins on your server work at your company, you should be fine.
What is the fix?
For now, while the physical processors have this flaw, the fix is to logically reduce the hyper-threading capability of Intel CPUs so they can’t be snooped on. This removes 5-20% of the performance capacity of the CPU.
If your VMware environment isn’t really using the CPU (peak CPU on your hosts is less than 30%), go ahead and implement the fix!
If your servers ARE using the CPU intensively (peak CPU is greater than 30%), then think hard before making a change.
To implement this fix, edit Advanced System Settings for each host and change the value of VMkernel.Boot.hyperthreadingMitigation = true , then reboot the host. Since you are already at 6.7 Update 2, your health alarm will probably change to “Enable SCAv2 for optimal hyperthreading performance” which is addressed a few sections above this one.
What if I don’t want to fix concurrent context?
Some environments cannot afford to lose the CPU performance. For example, I have a client that runs a lab environment with extremely high processing requirements. The hosts are running 70%+ CPU constantly.
So how can you remove the vSphere health warning about concurrent-context attack vector?
At this time, there is no way to disable the warning without changing the settings. I’m monitoring this thread on the topic: https://communities.vmware.com/thread/609376
How do I fix “External Platform Services Controller” deprecated?
Check our other article about this recent (July 2020) issue, which seems to be a false positive.
Event: “Alarm ‘vSphere Health detected new issues in your environment’ on Datacenters changed from Green to Yellow
Even on healthy vCenters, you will see this event appear about once a week. In my environments it lasts for about one hour (green to yellow, then yellow to green). It doesn’t appear to be an actual issue.
Selfish plug time – Need help?
I am a consultant in the Maryland/DC area in the USA. My specialties are Windows migrations (to 2016 and to Office 365 / Azure), VMware migrations, Netapp and SAN, and high availability / disaster recovery planning. If you would like help with your complex project, training, or would like a architectural review to improve your availability, please reach out! More information and contact can be found on the About page. – Amira Armond
After upgrading to vCenter 7 Update 1 , when I tried to browse vCenter HTML5 UI, I faced “no healthy upstream” error. I could access to vCenter Management Interface (VAMI) https://vCenter-IPaddress:5480 without any issues. I could also connect to vCenter Server through SSH but I realized couple of vCenter Server services could not start.
You can also check the details status of services by connecting to vCenter through SSH and run the following command:
#service-control --list Then I tried to force to start services by below commands:
#service-control --start --all
#service-control –-start {service-name}
After waiting for a while, I got the underneath error.
After spending couple of hours reading logs and a bit of googling, I have been pointed towards different answers. First of all I went through all DNS, NTP and IP checks and in my case everything was working as it should.
In my scenario, vCenter’s SSL certificate were
replaced with a valid signed certificate and it was one of the reason that
points me to check certification validity. Beside this SSL certificate, there
are couple of other certificates that vCenter server uses. To get familiar with
vSphere certificates you can read the following vSphere documentation:
https://docs.vmware.com/en/VMware-vSphere/7.0/com.vmware.vsphere.authentication.doc/GUID-3AF7757E-A30E-4EEC-8A41-28DA72102520.html
In my case “Trusted root certificate, Machine SSL Certificate and SMS” were still valid . But ” Machine, vpxd, vpxd-extension and vsphere-webclient” were expired.
You can check the validity of each certificate by running below commands in vCenter server:
# /usr/lib/vmware-vmafd/bin/vecs-cli entry list --store TRUSTED_ROOTS --text | less
# /usr/lib/vmware-vmafd/bin/vecs-cli entry list --store MACHINE_SSL_CERT --text | less
# /usr/lib/vmware-vmafd/bin/vecs-cli entry list --store SMS --text | less
# /usr/lib/vmware-vmafd/bin/vecs-cli entry list --store machine --text | less
# /usr/lib/vmware-vmafd/bin/vecs-cli entry list --store vpxd --text | less
# /usr/lib/vmware-vmafd/bin/vecs-cli entry list --store vpxd-extension --text | less
# /usr/lib/vmware-vmafd/bin/vecs-cli entry list --store vsphere-webclient --text | less
Below you can find the expired certificate screen shot:
In this case you need to update the expired certificates with use of vCenter certificate manager through running following command on vCenter CLI.
#/usr/lib/vmware-vmca/bin/certificate-managerchoose number 6 to replace Solution User certificates.
Then you need to answer the required information
- Do you wish to generate all certificates using configuration file : Option[Y/N] ? : Y
- Please provide valid SSO and VC privileged user credential to perform certificate operations.Enter username [Administrator@vsphere.local]:
Note: this is an example how to address each question you need to fill it out based on your environment.
- Enter proper value for ‘Country’ [Default value : US] :US
- Enter proper value for ‘Name’ [Default value : CA] : CA
- Enter proper value for ‘Organization’ [Default value : VMware] : “ vElements lab”
- Enter proper value for ‘OrgUnit’ [Default value : VMware Engineering] : VELEMENTSIT
- Enter proper value for ‘State’ [Default value : California]: California
- Enter proper value for ‘Locality’ [Default value : Palo Alto] : Palo Alto
- Enter proper value for ‘IPAddress’ (Provide comma separated values for multiple IP addresses) [optional] : you can press Enter or provide the required information
- Enter proper value for ‘Email’ [Default value : email@acme.com] : Press Enter
- Enter proper value for ‘Hostname’ (Provide comma separated values for multiple Hostname entries) [Enter valid Fully Qualified DomainName(FQDN), For Example : example.domain.com] : vc.velements.net
- Enter proper value for VMCA ‘Name’ : vc.velements.net You are going to regenerate Solution User Certificates using VMCA
- Continue operation : Option[Y/N] ? : Y
After I successfully updated the certificates , vCenter
services got started and I could reach the vCenter UI.
Below you can also find other solutions I found
when I was googling
Suggested answers to check
- Upgrade VMware Hardware version and choose the
correct OS for vCenter
Note: Take a snapshot from
vCenter Server VM before hardware version upgrade, as it’s none reversible task to previous versions.
- Shutdown the vCenter > right click on the VM
> Compatibility > Upgrade VM Compatibility. - Right click on the vCenter and choose Edit
settings > VM Options > General Options > Select VMware Photon OS - Check DNS (you should be able to resolve FQDN
names from vCenter) - Check NTP (Time should be synced and correct
between ESXi hosts and vCenter Server) - vCenter Server IP address should be set Static
All of the services which are set to Automatic start are running without any errors or warnings. Hopefully this will help you to solve your issue.
vmware.vmware_rest.appliance_vmon_service
Lists details of services managed by vMon.
Version added: 2.3.0
- Synopsis
- Requirements
- Parameters
- Notes
- Examples
- Return Values
- Status
Synopsis
- Lists details of services managed by vMon.
Requirements
The below requirements are needed on the host that executes this module.
- vSphere 7.0.2 or greater
- python >= 3.6
- aiohttp
Parameters
| Parameter | Choices/Defaults | Comments |
|---|---|---|
|
service string |
identifier of the service whose properties are being updated. The parameter must be the id of a resource returned by vmware.vmware_rest.appliance_vmon_service. Required with state=[‘restart’, ‘start’, ‘stop’] |
|
|
session_timeout float added in 2.1.0 |
Timeout settings for client session. The maximal number of seconds for the whole operation including connection establishment, request sending and response. The default value is 300s. |
|
|
startup_type string |
|
The startup_type enumerated type defines valid Startup Type for services managed by vMon. |
|
state string |
|
|
|
vcenter_hostname string |
The hostname or IP address of the vSphere vCenter If the value is not specified in the task, the value of environment variable |
|
|
vcenter_password string |
The vSphere vCenter password If the value is not specified in the task, the value of environment variable |
|
|
vcenter_rest_log_file string |
You can use this optional parameter to set the location of a log file. This file will be used to record the HTTP REST interaction. The file will be stored on the host that run the module. If the value is not specified in the task, the value of environment variable |
|
|
vcenter_username string |
The vSphere vCenter username If the value is not specified in the task, the value of environment variable |
|
|
vcenter_validate_certs boolean |
|
Allows connection when SSL certificates are not valid. Set to If the value is not specified in the task, the value of environment variable |
Notes
Note
- Tested on vSphere 7.0.2
Examples
- name: Adjust vpxd configuration
  vmware.vmware_rest.appliance_vmon_service:
    service: vpxd
    startup_type: AUTOMATIC
  register: result
Return Values
Common return values are documented here, the following are the fields unique to this module:
| Key | Returned | Description |
|---|---|---|
|
id string |
On success |
moid of the resource Sample: vpxd |
|
value dictionary |
On success |
Adjust vpxd configuration
|
Status
Authors
- Ansible Cloud Team (@ansible-collections)