4.7.1. Вероятность появления ошибочного бита при когерентном обнаружении сигнала BPSK
4.7.2. Вероятность появления ошибочного бита при когерентном обнаружении сигнала в дифференциальной модуляции BPSK
4.7.3. Вероятность появления ошибочного бита при когерентном обнаружении сигнала в бинарной ортогональной модуляции FSK
4.7.4. Вероятность появления ошибочного бита при некогерентном обнаружении сигнала в бинарной ортогональной модуляции FSK
4.7.5. Вероятность появления ошибочного бита для бинарной модуляции DPSK
4.7.6. Вероятность ошибки для различных модуляций
4.7.1. Вероятность появления ошибочного бита при когерентном обнаружении сигнала BPSK
Важной мерой производительности, используемой для сравнения цифровых схем модуляции, является вероятность ошибки, РЕ Для коррелятора или согласованного фильтра вычисление РЕ можно представить геометрически (см. рис. 4.6). Расчет РЕ включает нахождение вероятности того, что при данном векторе переданного сигнала, скажем si вектор шума n выведет сигнал из области 1. Вероятность принятия детектором неверного решения называется вероятностью символьной ошибки, рE. Несмотря на то что решения принимаются на символьном уровне, производительность системы часто удобнее задавать через вероятность битовой ошибки (Ps). Связь РВ и РЕ рассмотрена в разделе 4.9.3 для ортогональной передачи сигналов и в разделе 4.9.4 для многофазной передачи сигналов.
Для удобства изложения в данном разделе мы ограничимся когерентным обнаружением сигналов BPSK. В этом случае вероятность символьной ошибки — это то же самое, что и вероятность битовой ошибки. Предположим, что сигналы равновероятны. Допустим также, что при передаче сигнала принятый сигнал r(t) равен
, где n(t) — процесс AWGN; кроме того, мы пренебрегаем ухудшением качества вследствие введенной каналом или схемой межсимвольной интерференции. Как показывалось в разделе 4.4.1, антиподные сигналы
и
можно описать в одномерном сигнальном пространстве, где

Детектор выбирает с наибольшим выходом коррелятора
; или, в нашем случае антиподных сигналов с равными энергиями, детектор, используя формулу (4.20), принимает решение следующего вида.
(4.74)
Как видно из рис. 4.9, возможны ошибки двух типов: шум так искажает переданный сигнал , что измерения в детекторе дают отрицательную величину z(T), и детектор выбирает гипотезу H2, что был послан сигнал s2(t). Возможна также обратная ситуация: шум искажает переданный сигнал
, измерения в детекторе дают положительную величину z(T), и детектор выбирает гипотезу Н1, соответствующую предположению о передаче сигнала
.
В разделе 3.2.1.1 была выведена формула (3.42), описывающая вероятность битовой ошибки РB для детектора, работающего по принципу минимальной вероятности ошибки.

Здесь σ0 — среднеквадратическое отклонение шума вне коррелятора. Функция Q(x), называемая гауссовым интегралом ошибок, определяется следующим образом.

Эта функция подробно описывается в разделах 3.2 и Б.3.2.
Для передачи антиподных сигналов с равными энергиями, таких как сигналы в формате BPSK, приведенные в выражении (4.74), на выход приемника поступают следующие компоненты: , при переданном сигнале
, и
, при переданном сигнале s2(t), где Еь — энергия сигнала, приходящаяся на двоичный символ. Для процесса AWGN дисперсию шума
вне коррелятора можно заменить N0/2 (см. приложение В), так что формулу (4.76) можно переписать следующим образом.


Данный результат для полосовой передачи антиподных сигналов BPSK совпадает с полученными ранее формулами для обнаружения антиподных сигналов с использованием согласованного фильтра (формула (3.70)) и обнаружения узкополосных антиподных сигналов с применением согласованного фильтра (формула (3.76)). Это является примером описанной ранее теоремы эквивалентности. Для линейных систем теорема эквивалентности утверждает, что на математическое описание процесса обнаружения не влияет сдвиг частоты. Как следствие, использование согласованных фильтров или корреляторов для обнаружения полосовых сигналов (рассмотренное в данной главе) дает те же соотношения, что были выведены ранее для сопоставимых узкополосных сигналов.
4.7.2. Вероятность появления ошибочного бита при когерентном обнаружении сигнала в дифференциальной модуляции BPSK
Сигналы в канале иногда инвертируются; например, при использовании когерентного опорного сигнала, генерируемого контуром ФАПЧ, фаза может быть неоднозначной. Если фаза несущей была инвертирована при использовании схемы DPSK, как это скажется на сообщении? Поскольку информация сообщения кодируется подобием или отличием соседних символов, единственным следствием может быть ошибка в бите, который инвертируется, или в бите, непосредственно следующим за инвертированным. Точность определения подобия или отличия символов не меняется при инвертировании несущей. Иногда сообщения (и кодирующие их сигналы) дифференциально кодируются и когерентно обнаруживаются, чтобы просто избежать неопределенности в определении фазы.
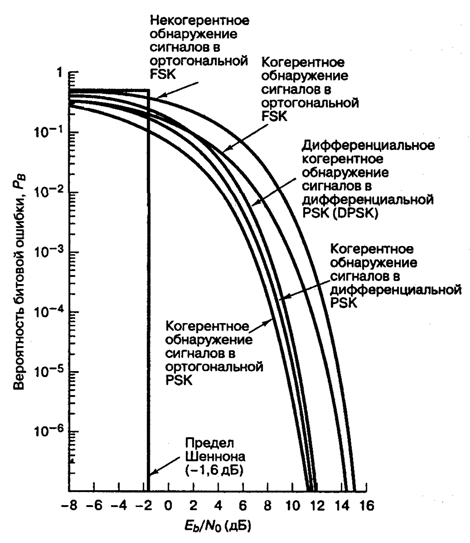
Вероятность появления ошибочного бита при когерентном обнаружении сигналов в дифференциальной модуляции PSK (DPSK) дается выражением [5].

Это соотношение изображено на рис. 4.25. Отметим, что существует незначительное ухудшение достоверности обнаружения по сравнению с когерентным обнаружением сигналов в модуляции PSK. Это вызвано дифференциальным кодированием, поскольку любая отдельная ошибка обнаружения обычно приводит к принятию двух ошибочных решений. Подробно вероятность ошибки при использовании наиболее популярной схемы — когерентного обнаружения сигналов в модуляции DPSK — рассмотрена в разделе 4.7.5.
Рис. 4.25. Вероятность появления ошибочного бита для бинарных систем нескольких типов
4.7.3. Вероятность появления ошибочного бита при когерентном обнаружении сигнала в бинарной ортогональной модуляции FSK
Формулы (4.78) и (4.79) описывают вероятность появления ошибочного бита для когерентного обнаружения антиподных сигналов. Более общую трактовку для когерентного обнаружения бинарных сигналов (не ограничивающихся антиподными сигналами) дает следующее выражение для РВ [6].

Из формулы (3.64,б) — временной коэффициент взаимной корреляций между
и
, где θ — угол между векторами сигналов
и s2 (см. рис. 4.6). Для антиподных сигналов, таких как сигналы BPSK, θ = π, поэтому ρ = -1.
Для ортогональных сигналов, таких как сигналы бинарной FSK (BFSK), θ = π/2, поскольку векторы и s2 перпендикулярны; следовательно, ρ = 0, что можно доказать с помощью формулы (3.64,а), поэтому выражение (4.81) можно переписать следующим образом.

Здесь Q(x) — дополнительная функция ошибок, подробно описанная в разделах 3.2 и Б.3.2. Зависимость (4.82) для когерентного обнаружения ортогональных сигналов BFSK, показанная на рис. 4.25, аналогична зависимости, полученной для обнаружения ортогональных сигналов с помощью согласованного фильтра (формула (3.71)) и узкополосных ортогональных сигналов (униполярных импульсов) с использованием согласованного фильтра (формула (3.73)). В данной книге мы не рассматриваем амплитудную манипуляцию ООК (on-off keying), но соотношение (4.82 применимо к обнаружению с помощью согласованного фильтра сигналов ООК, так же как и к когерентному обнаружению любых ортогональных сигналов.
Справедливость соотношения (4.82) подтверждает и то, что разность энергий между ортогональными векторами сигналов и s2 с амплитудой
, как показано на рис. 3.10, б, равна квадрату расстояния между концами ортогональных векторов Ed = 2Eb. Подстановка этого результата в формулу (3.63) также дает формулу (4.82). Сравнивая формулы (4.82) и (4.79), видим, что, по сравнению со схемой BPSK, схема BFSK требует на 3 дБ большего отношения E/N0 для обеспечения аналогичной достоверности передачи. Этот результат не должен быть неожиданным, поскольку при данной мощности сигнала квадрат расстояния между ортогональными векторами вдвое (на 3 дБ) больше квадрата расстояния между антиподными векторами.
4.7.4. Вероятность появления ошибочного бита при некогерентном обнаружении сигнала в бинарной ортогональной модуляции FSK
Рассмотрим бинарное ортогональное множество равновероятных сигналов FSK , определенное формулой (4.8).
Фаза φ неизвестна и предполагается постоянной. Детектор описывается М = 2 каналами, состоящими, как показано на рис. 4.19, из полосовых фильтров и детекторов огибающей. На вход детектора поступает принятый сигнал r(t) = si(t) + n(t), где n(i) — гауссов шум с двусторонней спектральной плотностью мощности No/2. Предположим, что и
достаточно разнесены по частоте, чтобы их перекрытием можно было пренебречь. Вычисление вероятности появления ошибочного бита для равновероятных сигналов
и
начнем, как и в случае узкополосной передачи, с уравнения (3.38).

Для бинарного случая тестовая статистика z(T) определена как . Предположим, что полоса фильтра Wf равна 1/T, так что огибающая сигнала FSK (приблизительно) сохраняется на выходе фильтра. При отсутствии шума в приемнике значение z(T) равно
при передаче s1(t) и —
— при передаче s2(t). Вследствие такой симметрии оптимальный порог γ0=0. Плотность вероятности
подобна плотности вероятности
.
(4.84)
Таким образом, можем записать

или
(4.86)
где z1 и z2 обозначают выходы z1(T) и z2(T) детекторов огибающей, показанных на рис.4.19. При передаче тона , т.е. когда r(t) = s2(t) + n(t), выход z1(T) состоит исключительно из случайной переменной гауссового шума; он не содержит сигнального компонента. Распределение Гаусса в нелинейном детекторе огибающей дает распределение Релея на выходе [6], так что

где — шум на выходе фильтра. С другой стороны, z2(T) имеет распределение Раиса, поскольку на вход нижнего детектора огибающей подается синусоида плюс шум [6]. Плотность вероятности p(z2s2) записывается как

где и, как и ранее,
— шум на выходе фильтра. Функция 10(х), известная как модифицированная функция Бесселя первого рода нулевого порядка [7], определяется следующим образом.

Ошибка при передаче s2(t) происходит, если выборка огибающей z1(T), полученная из верхнего канала (по которому проходит шум), больше выборки огибающей z2(T), полученной из нижнего канала (по которому проходит сигнал и шум). Таким образом, вероятность этой ошибки можно получить, проинтегрировав до бесконечности с последующим усреднением результата по всем возможным z2.

Здесь , внутренний интеграл — условная вероятность ошибки, при фиксированном значении z2, если был передан сигнал s2(1), а внешний интеграл усредняет условную вероятность по всем возможным значениям z2. Данный интеграл можно вычислить аналитически [8], и его значение равно следующему.

С помощью формулы (1.19) шум на выходе фильтра можно выразить как
(4.93)
где a Wf — ширина полосы фильтра. Таким образом, формула (4.92) приобретает следующий вид.

Выражение (4.94) показывает, что вероятность ошибки зависит от ширины полосы полосового фильтра и РB уменьшается при снижении Wf. Результат справедлив только при пренебрежении межсимвольной интерференцией (intersymbol interference — ISI). Минимальная разрешенная Wf (т.е. не дающая межсимвольной интерференции) получается из уравнения (3.81) при коэффициенте сглаживания г = 0. Следовательно, Wf= R бит/с =1/T, и выражение (4.94) можно переписать следующим образом.


Здесь Еь= (1/2)А2Т — энергия одного бита. Если сравнить вероятность ошибки схем некогерентной и когерентной FSK (см. рис. 4.25), можно заметить, что при равных РB некогерентная FSK требует приблизительно на 1 дБ большего отношения Eb/N0, чем когерентная FSK (для РB < 10-4). При этом некогерентный приемник легче реализуется, поскольку не требуется генерировать когерентные опорные сигналы. По этой причине практически все приемники FSK используют некогерентное обнаружение. В следующем разделе будет показано, что при сравнении когерентной ортогональной схемы FSK с нёкогерентной схемой DPSK имеет место та же разница в 3 дБ, что и при сравнении когерентной ортогональной FSK и когерентной PSK. Как указывалось ранее, в данной книге не рассматривается амплитудная манипуляция ООК (on-off keying). Все же отметим, что вероятность появления ошибочного бита РB, выраженная в формуле (4.96), идентична РB для некогерентного обнаружения сигналов ООК.
4.7.5. Вероятность появления ошибочного бита для бинарной модуляции DPSK
Определим набор сигналов BPSK следующим образом.

Особенностью схемы DPSK является отсутствие в сигнальном пространстве четко определенных областей решений. В данном случае решение основывается на разности фаз между принятыми сигналами. Таким образом, при передаче сигналов DPSK каждый бит в действительности передается парой двоичных сигналов.

Здесь обозначает сигнал
, за которым следует сигнал
. Первые Т секунд каждого сигнала — это в действительности последние Т секунд предыдущего. Отметим, что оба сигнала s1(t) и s2(t) могут принимать любую из возможных форм и что
и
— это антиподные сигналы. Таким образом, корреляцию между
и s2(t) для любой комбинации сигналов можно записать следующим образом.

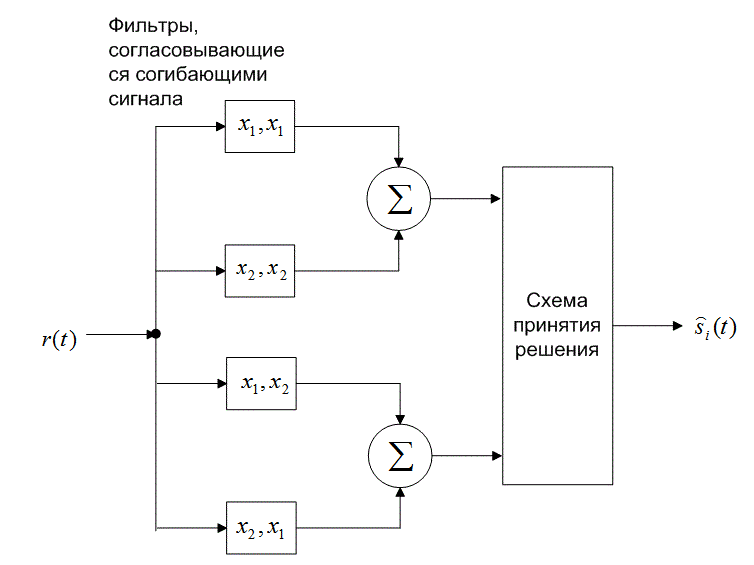
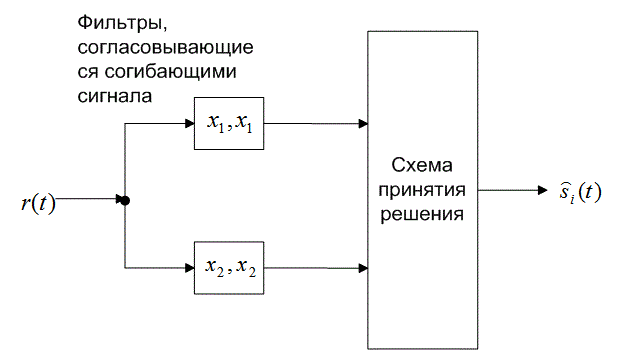
Следовательно, каждую пару сигналов DPSK можно представить как ортогональный сигнал длительностью 2Т секунд. Обнаружение может соответствовать некогерентному обнаружению огибающей с помощью четырех каналов, согласованных с каждым возможным выходом огибающей, как показано на рис. 4.26. Поскольку два детектора огибающей, представляющих каждый символ, обратны друг другу, выборки их огибающих будут совпадать. Значит, мы можем реализовать детектор как один канал для , согласовывающегося с
или
, и один канал для
, согласовывающегося с
или
, как показано на рис. 4.26. Следовательно, детектор DPSK сокращается до стандартного двухканального некогерентного детектора. В действительности фильтр может согласовываться с разностным сигналом; так что необходимым является всего один канал. На рис. 4.26 показаны фильтры, которые согласовываются с огибающими сигнала (в течение двух периодов передачи символа). Что это означает, если вспомнить, что DPSK — это схема передачи сигналов с постоянной огибающей? Это означает, что нам требуется реализовать детектор энергии, подобный квадратурному приемнику на рис. 4.18, где каждый сигнал в течение периода
представляется синфазным и квадратурным опорными сигналами.
синфазный опорный сигнал квадратурный опорный сигнал
синфазный опорный сигнал
квадратурный опорный сигнал
Поскольку пары сигналов DPSK ортогональны, вероятность ошибки при подобном некогерентном обнаружении дается выражением (4.96). Впрочем, поскольку сигналы DPSK длятся 2Т секунд, энергия сигналов , определенных в формуле (4.98), равна удвоенной энергии сигнала, определенного в течение одного периода передачи символа.
а)
б)
Рис. 4.26. Обнаружение в схеме DPSK: а) четырехканальное дифференциально-когерентное обнаружение сигналов в бинарной модуляции DPSK; б) эквивалентный двухканальный детектор сигналов в бинарной модуляции DPSK
Таким образом, РВможно записать в следующем виде.

Зависимость (4.100), изображенная на рис. 4.25, представляет собой дифференциальное когерентное обнаружение сигналов в дифференциальной модуляции PSK, или просто DPSK. Выражение справедливо для оптимального детектора DPSK (рис. 4.17, в). Для детектора, показанного на рис. 4.17, б, вероятность ошибки будет несколько выше приведенной в выражении (4.100) [3]. Если сравнить вероятность ошибки, приведенную в формуле (4.100), с вероятностью ошибки когерентной схемы PSK (см. рис. 4.25), видно, что при равных РB схема DPSK требует приблизительно на 1 дБ большего отношения E^N0, чем схема BPSK (для ). Систему DPSK реализовать легче, чем систему PSK, поскольку приемник DPSK не требует фазовой синхронизации. По этой причине иногда предпочтительнее использовать менее эффективную схему DPSK, чем более сложную схему PSK.
4.7.6. Вероятность ошибки для различных модуляций
В табл. 4.1 и на рис. 4.25 приведены аналитические выражения и графики РB для наиболее распространенных схем модуляции, описанных выше. Для РB = 10-4 можно видеть, что разница между лучшей (когерентной PSK) и худшей (некогерентной ортогональной FSK) из рассмотренных схем равна приблизительно 4 дБ. В некоторых случаях 4 дБ — это небольшая цена за простоту реализации, увеличивающуюся от когерентной схемы PSK до некогерентной FSK (рис. 4.25); впрочем, в других случаях ценным является даже выигрыш в 1 дБ. Помимо сложности реализации и вероятности РB существуют и другие факторы, влияющие на выбор модуляции; например, в некоторых случаях (в каналах со случайным затуханием) желательными являются некогерентные системы, поскольку иногда когерентные опорные сигналы затруднительно определять и использовать. В военных и космических приложениях весьма желательны сигналы, которые могут противостоять значительному ухудшению качества, сохраняя возможность обнаружения.
Таблица 4.1. Вероятность ошибки для различных бинарных модуляций
|
Модуляция |
PB |
|
PSK (когерентное обнаружение) |
|
|
DPSK (дифференциальное когерентное обнаружение) |
|
|
Ортогональная FSK (когерентное обнаружение) |
|
|
Ортогональная FSK (некогерентное обнаружение) |
|
Основные показатели эффективности цифровой системы связи
Спектральная
эффективность Rb/П
– отношение скорости передачи (бит/c)
к ширине полосы (Гц).
Rb=log2M/Ts
(M
– объем алфавита символов, Ts
– длительность символа), полоса П =1/Ts
при амплитудно-фазовой манипуляции и
П =M/Ts
при частотной манипуляции, следовательно,
спектральная эффективность:
Удельные
энергетические затраты Eb
/ N0
при заданной вероятности ошибки –
отношение энергии Eb,
затраченной на передачу одного бита, к
односторонней спектральной плотности
аддитивного белого гауссова шума N0.
Вероятность битовой ошибки рb
Функция Q
табулирована, значение (a2
— a1)/(2
)
зависит от способа формирования сигнала.
Чтобы сравнивать различные способы
формирования сигналов по вероятности
ошибок, безразмерную величину (a2
— a1)/(2
)
выражают через удельные энергетические
затраты.
–вероятность принять
сигнал х
при переданном символе s.
Максимальная пропускная способность канала
Максимальной
спектральной эффективностью Rbm/П
= log2
M
обладает система с амплитудно-фазовой
модуляцией.
Максимальное
значение Mмакс=
(S+N)/N
= 1+S/N
– числу различимых, при наличии шума,
градаций сигнала.
Соотношение
между максимально возможной спектральной
эффективностью и энергетическими
затратами дает теорема Шеннона – Хартли:
максимальная
скорость передачи информации Rbm
(бит/с)
по каналу с белым гауссовым шумом
(пропускная способность канала) равна
S
и N
– средняя мощность сигнала и шума,
П
– полоса
пропускания.
Минимально
допустимое значение Eb/N0
можно найти при предельном переходе
Rb/П→0:
Значение Eb/N0
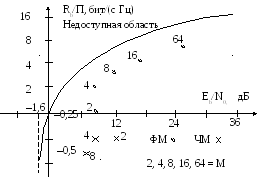
= 0,693 = -1,6 дБ называют пределом Шеннона.
На рисунке указано
соотношение параметров Rb/П
и Eb/N0
при разных способах модуляции без
помехоустойчивого кодирования
(демодуляция сигналов с АФМ когерентная,
ортогональных сигналов с ЧМ –
некогерентная).
Расширение спектра прямой последовательностью
Расширение
спектра прямой последовательностью –
это модуляция сигнала двоичной
псевдослучайной последовательностью
(ПСП), выполняемая независимо от вида
информационного сигнала. Такая модуляция
может проводиться на разных этапах
формирования сигнала.
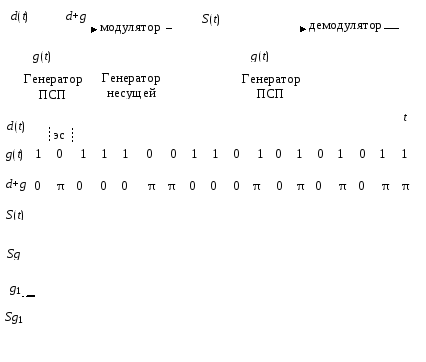
Исходная
информационная последовательность
данных суммируется с ПСП:
Расширение
спектра S(f)
сигнала и N(f)
помехи
Преимущества
систем с расширением спектра:
— высокая
помехоустойчивость,
— конфиденциальность
связи,
— возможность
многоканальной связи на одной несущей
частоте,
— возможность
передачи маломощного сигнала,
—
высокая
разрешающая способность по времени
Расширение
спектра скачкообразным изменением
несущей частоты
Расширение
спектра
сигналов в
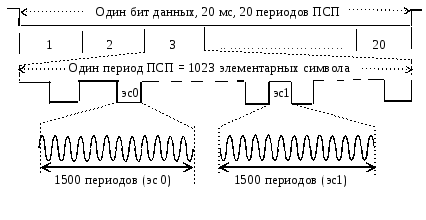
системе GPS
Основные понятия
помехоустойчивого (канального) кодирования
Выявление и
устранение ошибок в принятом сообщении
основано на введении избыточности в
сообщение путем:
– многократной
передачи сообщения,
– повторной
передачи по запросу приемника,
–применения
корректирующих кодов для обнаружения
и исправления ошибки.
При блочном
кодировании
к каждому блоку данных из k
символов добавляют (n
– k)
избыточных (контрольных) символов,
зависящих от содержания k
«информационных» символов данного
блока. Набор из всех таких n
– разрядных блоков составляет блоковый
(n,
k)
код (block
code).
В «систематическом»
коде
проверочные символы приписываются к
концу информационной последовательности.
При непрерывном
кодировании
исходная информационная последовательность
символов полностью преобразуется в
процессе введения избыточности.
Разделения на информационные и проверочные
символы нет.
Примерами
непрерывного кодирования являются
сверточные коды
и турбокоды
– Кодовое
(хемминговое)
расстояние
d
между
двумя словами – это число одноименных
разрядов с разными символами. Оно равно
числу единиц в кодовой комбинации,
образованной суммированием по модулю
2 сравниваемых слов.
10111001
d
= 5
10001110
– Минимальное
кодовое расстояние –
минимальное
расстояние, взятое по всем парам
разрешенных кодовых комбинаций.
– Кратность
ошибки –
число искаженных символов кодовой
комбинации.
Исходное
слово 10111001,
принятое
слово 10001011 – ошибка кратности 3.
– Вес
кодовой комбинации
– число
единиц в двоичной кодовой комбинации.
10111001–
вес 5
– Вектор
ошибки –
кодовая комбинация с единицами в
искаженных разрядах и нулями в остальных
разрядах.
–
Скорость
кодирования – k/n.
–
Относительная
избыточность – (n—k)/n.
Соседние файлы в предмете [НЕСОРТИРОВАННОЕ]
- #
- #
- #
- #
- #
- #
- #
- #
- #
- #
- #
From Wikipedia, the free encyclopedia
In digital transmission, the number of bit errors is the number of received bits of a data stream over a communication channel that have been altered due to noise, interference, distortion or bit synchronization errors.
The bit error rate (BER) is the number of bit errors per unit time. The bit error ratio (also BER) is the number of bit errors divided by the total number of transferred bits during a studied time interval. Bit error ratio is a unitless performance measure, often expressed as a percentage.[1]
The bit error probability pe is the expected value of the bit error ratio. The bit error ratio can be considered as an approximate estimate of the bit error probability. This estimate is accurate for a long time interval and a high number of bit errors.
Example[edit]
As an example, assume this transmitted bit sequence:
1 1 0 0 0 1 0 1 1
and the following received bit sequence:
0 1 0 1 0 1 0 0 1,
The number of bit errors (the underlined bits) is, in this case, 3. The BER is 3 incorrect bits divided by 9 transferred bits, resulting in a BER of 0.333 or 33.3%.
Packet error ratio[edit]
The packet error ratio (PER) is the number of incorrectly received data packets divided by the total number of received packets. A packet is declared incorrect if at least one bit is erroneous. The expectation value of the PER is denoted packet error probability pp, which for a data packet length of N bits can be expressed as
,
assuming that the bit errors are independent of each other. For small bit error probabilities and large data packets, this is approximately
Similar measurements can be carried out for the transmission of frames, blocks, or symbols.
The above expression can be rearranged to express the corresponding BER (pe) as a function of the PER (pp) and the data packet length N in bits:
Factors affecting the BER[edit]
In a communication system, the receiver side BER may be affected by transmission channel noise, interference, distortion, bit synchronization problems, attenuation, wireless multipath fading, etc.
The BER may be improved by choosing a strong signal strength (unless this causes cross-talk and more bit errors), by choosing a slow and robust modulation scheme or line coding scheme, and by applying channel coding schemes such as redundant forward error correction codes.
The transmission BER is the number of detected bits that are incorrect before error correction, divided by the total number of transferred bits (including redundant error codes). The information BER, approximately equal to the decoding error probability, is the number of decoded bits that remain incorrect after the error correction, divided by the total number of decoded bits (the useful information). Normally the transmission BER is larger than the information BER. The information BER is affected by the strength of the forward error correction code.
Analysis of the BER[edit]
The BER may be evaluated using stochastic (Monte Carlo) computer simulations. If a simple transmission channel model and data source model is assumed, the BER may also be calculated analytically. An example of such a data source model is the Bernoulli source.
Examples of simple channel models used in information theory are:
- Binary symmetric channel (used in analysis of decoding error probability in case of non-bursty bit errors on the transmission channel)
- Additive white Gaussian noise (AWGN) channel without fading.
A worst-case scenario is a completely random channel, where noise totally dominates over the useful signal. This results in a transmission BER of 50% (provided that a Bernoulli binary data source and a binary symmetrical channel are assumed, see below).
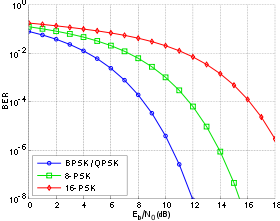
Bit-error rate curves for BPSK, QPSK, 8-PSK and 16-PSK, AWGN channel.
In a noisy channel, the BER is often expressed as a function of the normalized carrier-to-noise ratio measure denoted Eb/N0, (energy per bit to noise power spectral density ratio), or Es/N0 (energy per modulation symbol to noise spectral density).
For example, in the case of QPSK modulation and AWGN channel, the BER as function of the Eb/N0 is given by:

People usually plot the BER curves to describe the performance of a digital communication system. In optical communication, BER(dB) vs. Received Power(dBm) is usually used; while in wireless communication, BER(dB) vs. SNR(dB) is used.
Measuring the bit error ratio helps people choose the appropriate forward error correction codes. Since most such codes correct only bit-flips, but not bit-insertions or bit-deletions, the Hamming distance metric is the appropriate way to measure the number of bit errors. Many FEC coders also continuously measure the current BER.
A more general way of measuring the number of bit errors is the Levenshtein distance.
The Levenshtein distance measurement is more appropriate for measuring raw channel performance before frame synchronization, and when using error correction codes designed to correct bit-insertions and bit-deletions, such as Marker Codes and Watermark Codes.[3]
Mathematical draft[edit]
The BER is the likelihood of a bit misinterpretation due to electrical noise 


Knowing that the noise has a bilateral spectral density 


and 

Returning to BER, we have the likelihood of a bit misinterpretation 


where 

We can use the average energy of the signal 
±§
Bit error rate test[edit]
BERT or bit error rate test is a testing method for digital communication circuits that uses predetermined stress patterns consisting of a sequence of logical ones and zeros generated by a test pattern generator.
A BERT typically consists of a test pattern generator and a receiver that can be set to the same pattern. They can be used in pairs, with one at either end of a transmission link, or singularly at one end with a loopback at the remote end. BERTs are typically stand-alone specialised instruments, but can be personal computer–based. In use, the number of errors, if any, are counted and presented as a ratio such as 1 in 1,000,000, or 1 in 1e06.
Common types of BERT stress patterns[edit]
- PRBS (pseudorandom binary sequence) – A pseudorandom binary sequencer of N Bits. These pattern sequences are used to measure jitter and eye mask of TX-Data in electrical and optical data links.
- QRSS (quasi random signal source) – A pseudorandom binary sequencer which generates every combination of a 20-bit word, repeats every 1,048,575 words, and suppresses consecutive zeros to no more than 14. It contains high-density sequences, low-density sequences, and sequences that change from low to high and vice versa. This pattern is also the standard pattern used to measure jitter.
- 3 in 24 – Pattern contains the longest string of consecutive zeros (15) with the lowest ones density (12.5%). This pattern simultaneously stresses minimum ones density and the maximum number of consecutive zeros. The D4 frame format of 3 in 24 may cause a D4 yellow alarm for frame circuits depending on the alignment of one bits to a frame.
- 1:7 – Also referred to as 1 in 8. It has only a single one in an eight-bit repeating sequence. This pattern stresses the minimum ones density of 12.5% and should be used when testing facilities set for B8ZS coding as the 3 in 24 pattern increases to 29.5% when converted to B8ZS.
- Min/max – Pattern rapid sequence changes from low density to high density. Most useful when stressing the repeater’s ALBO feature.
- All ones (or mark) – A pattern composed of ones only. This pattern causes the repeater to consume the maximum amount of power. If DC to the repeater is regulated properly, the repeater will have no trouble transmitting the long ones sequence. This pattern should be used when measuring span power regulation. An unframed all ones pattern is used to indicate an AIS (also known as a blue alarm).
- All zeros – A pattern composed of zeros only. It is effective in finding equipment misoptioned for AMI, such as fiber/radio multiplex low-speed inputs.
- Alternating 0s and 1s — A pattern composed of alternating ones and zeroes.
- 2 in 8 – Pattern contains a maximum of four consecutive zeros. It will not invoke a B8ZS sequence because eight consecutive zeros are required to cause a B8ZS substitution. The pattern is effective in finding equipment misoptioned for B8ZS.
- Bridgetap — Bridge taps within a span can be detected by employing a number of test patterns with a variety of ones and zeros densities. This test generates 21 test patterns and runs for 15 minutes. If a signal error occurs, the span may have one or more bridge taps. This pattern is only effective for T1 spans that transmit the signal raw. Modulation used in HDSL spans negates the bridgetap patterns’ ability to uncover bridge taps.
- Multipat — This test generates five commonly used test patterns to allow DS1 span testing without having to select each test pattern individually. Patterns are: all ones, 1:7, 2 in 8, 3 in 24, and QRSS.
- T1-DALY and 55 OCTET — Each of these patterns contain fifty-five (55), eight bit octets of data in a sequence that changes rapidly between low and high density. These patterns are used primarily to stress the ALBO and equalizer circuitry but they will also stress timing recovery. 55 OCTET has fifteen (15) consecutive zeroes and can only be used unframed without violating one’s density requirements. For framed signals, the T1-DALY pattern should be used. Both patterns will force a B8ZS code in circuits optioned for B8ZS.
Bit error rate tester[edit]
A bit error rate tester (BERT), also known as a «bit error ratio tester»[4] or bit error rate test solution (BERTs) is electronic test equipment used to test the quality of signal transmission of single components or complete systems.
The main building blocks of a BERT are:
- Pattern generator, which transmits a defined test pattern to the DUT or test system
- Error detector connected to the DUT or test system, to count the errors generated by the DUT or test system
- Clock signal generator to synchronize the pattern generator and the error detector
- Digital communication analyser is optional to display the transmitted or received signal
- Electrical-optical converter and optical-electrical converter for testing optical communication signals
See also[edit]
- Burst error
- Error correction code
- Errored second
- Pseudo bit error ratio
- Viterbi Error Rate
References[edit]
- ^ Jit Lim (14 December 2010). «Is BER the bit error ratio or the bit error rate?». EDN. Retrieved 2015-02-16.
- ^
Digital Communications, John Proakis, Massoud Salehi, McGraw-Hill Education, Nov 6, 2007 - ^
«Keyboards and Covert Channels»
by Gaurav Shah, Andres Molina, and Matt Blaze (2006?) - ^ «Bit Error Rate Testing: BER Test BERT » Electronics Notes». www.electronics-notes.com. Retrieved 2020-04-11.
This article incorporates public domain material from Federal Standard 1037C. General Services Administration. (in support of MIL-STD-188).
External links[edit]
- QPSK BER for AWGN channel – online experiment
From Wikipedia, the free encyclopedia
In digital transmission, the number of bit errors is the number of received bits of a data stream over a communication channel that have been altered due to noise, interference, distortion or bit synchronization errors.
The bit error rate (BER) is the number of bit errors per unit time. The bit error ratio (also BER) is the number of bit errors divided by the total number of transferred bits during a studied time interval. Bit error ratio is a unitless performance measure, often expressed as a percentage.[1]
The bit error probability pe is the expected value of the bit error ratio. The bit error ratio can be considered as an approximate estimate of the bit error probability. This estimate is accurate for a long time interval and a high number of bit errors.
Example[edit]
As an example, assume this transmitted bit sequence:
1 1 0 0 0 1 0 1 1
and the following received bit sequence:
0 1 0 1 0 1 0 0 1,
The number of bit errors (the underlined bits) is, in this case, 3. The BER is 3 incorrect bits divided by 9 transferred bits, resulting in a BER of 0.333 or 33.3%.
Packet error ratio[edit]
The packet error ratio (PER) is the number of incorrectly received data packets divided by the total number of received packets. A packet is declared incorrect if at least one bit is erroneous. The expectation value of the PER is denoted packet error probability pp, which for a data packet length of N bits can be expressed as
,
assuming that the bit errors are independent of each other. For small bit error probabilities and large data packets, this is approximately
Similar measurements can be carried out for the transmission of frames, blocks, or symbols.
The above expression can be rearranged to express the corresponding BER (pe) as a function of the PER (pp) and the data packet length N in bits:
Factors affecting the BER[edit]
In a communication system, the receiver side BER may be affected by transmission channel noise, interference, distortion, bit synchronization problems, attenuation, wireless multipath fading, etc.
The BER may be improved by choosing a strong signal strength (unless this causes cross-talk and more bit errors), by choosing a slow and robust modulation scheme or line coding scheme, and by applying channel coding schemes such as redundant forward error correction codes.
The transmission BER is the number of detected bits that are incorrect before error correction, divided by the total number of transferred bits (including redundant error codes). The information BER, approximately equal to the decoding error probability, is the number of decoded bits that remain incorrect after the error correction, divided by the total number of decoded bits (the useful information). Normally the transmission BER is larger than the information BER. The information BER is affected by the strength of the forward error correction code.
Analysis of the BER[edit]
The BER may be evaluated using stochastic (Monte Carlo) computer simulations. If a simple transmission channel model and data source model is assumed, the BER may also be calculated analytically. An example of such a data source model is the Bernoulli source.
Examples of simple channel models used in information theory are:
- Binary symmetric channel (used in analysis of decoding error probability in case of non-bursty bit errors on the transmission channel)
- Additive white Gaussian noise (AWGN) channel without fading.
A worst-case scenario is a completely random channel, where noise totally dominates over the useful signal. This results in a transmission BER of 50% (provided that a Bernoulli binary data source and a binary symmetrical channel are assumed, see below).
Bit-error rate curves for BPSK, QPSK, 8-PSK and 16-PSK, AWGN channel.
In a noisy channel, the BER is often expressed as a function of the normalized carrier-to-noise ratio measure denoted Eb/N0, (energy per bit to noise power spectral density ratio), or Es/N0 (energy per modulation symbol to noise spectral density).
For example, in the case of QPSK modulation and AWGN channel, the BER as function of the Eb/N0 is given by:

People usually plot the BER curves to describe the performance of a digital communication system. In optical communication, BER(dB) vs. Received Power(dBm) is usually used; while in wireless communication, BER(dB) vs. SNR(dB) is used.
Measuring the bit error ratio helps people choose the appropriate forward error correction codes. Since most such codes correct only bit-flips, but not bit-insertions or bit-deletions, the Hamming distance metric is the appropriate way to measure the number of bit errors. Many FEC coders also continuously measure the current BER.
A more general way of measuring the number of bit errors is the Levenshtein distance.
The Levenshtein distance measurement is more appropriate for measuring raw channel performance before frame synchronization, and when using error correction codes designed to correct bit-insertions and bit-deletions, such as Marker Codes and Watermark Codes.[3]
Mathematical draft[edit]
The BER is the likelihood of a bit misinterpretation due to electrical noise 


Knowing that the noise has a bilateral spectral density 


and 

Returning to BER, we have the likelihood of a bit misinterpretation 


where 

We can use the average energy of the signal 
±§
Bit error rate test[edit]
BERT or bit error rate test is a testing method for digital communication circuits that uses predetermined stress patterns consisting of a sequence of logical ones and zeros generated by a test pattern generator.
A BERT typically consists of a test pattern generator and a receiver that can be set to the same pattern. They can be used in pairs, with one at either end of a transmission link, or singularly at one end with a loopback at the remote end. BERTs are typically stand-alone specialised instruments, but can be personal computer–based. In use, the number of errors, if any, are counted and presented as a ratio such as 1 in 1,000,000, or 1 in 1e06.
Common types of BERT stress patterns[edit]
- PRBS (pseudorandom binary sequence) – A pseudorandom binary sequencer of N Bits. These pattern sequences are used to measure jitter and eye mask of TX-Data in electrical and optical data links.
- QRSS (quasi random signal source) – A pseudorandom binary sequencer which generates every combination of a 20-bit word, repeats every 1,048,575 words, and suppresses consecutive zeros to no more than 14. It contains high-density sequences, low-density sequences, and sequences that change from low to high and vice versa. This pattern is also the standard pattern used to measure jitter.
- 3 in 24 – Pattern contains the longest string of consecutive zeros (15) with the lowest ones density (12.5%). This pattern simultaneously stresses minimum ones density and the maximum number of consecutive zeros. The D4 frame format of 3 in 24 may cause a D4 yellow alarm for frame circuits depending on the alignment of one bits to a frame.
- 1:7 – Also referred to as 1 in 8. It has only a single one in an eight-bit repeating sequence. This pattern stresses the minimum ones density of 12.5% and should be used when testing facilities set for B8ZS coding as the 3 in 24 pattern increases to 29.5% when converted to B8ZS.
- Min/max – Pattern rapid sequence changes from low density to high density. Most useful when stressing the repeater’s ALBO feature.
- All ones (or mark) – A pattern composed of ones only. This pattern causes the repeater to consume the maximum amount of power. If DC to the repeater is regulated properly, the repeater will have no trouble transmitting the long ones sequence. This pattern should be used when measuring span power regulation. An unframed all ones pattern is used to indicate an AIS (also known as a blue alarm).
- All zeros – A pattern composed of zeros only. It is effective in finding equipment misoptioned for AMI, such as fiber/radio multiplex low-speed inputs.
- Alternating 0s and 1s — A pattern composed of alternating ones and zeroes.
- 2 in 8 – Pattern contains a maximum of four consecutive zeros. It will not invoke a B8ZS sequence because eight consecutive zeros are required to cause a B8ZS substitution. The pattern is effective in finding equipment misoptioned for B8ZS.
- Bridgetap — Bridge taps within a span can be detected by employing a number of test patterns with a variety of ones and zeros densities. This test generates 21 test patterns and runs for 15 minutes. If a signal error occurs, the span may have one or more bridge taps. This pattern is only effective for T1 spans that transmit the signal raw. Modulation used in HDSL spans negates the bridgetap patterns’ ability to uncover bridge taps.
- Multipat — This test generates five commonly used test patterns to allow DS1 span testing without having to select each test pattern individually. Patterns are: all ones, 1:7, 2 in 8, 3 in 24, and QRSS.
- T1-DALY and 55 OCTET — Each of these patterns contain fifty-five (55), eight bit octets of data in a sequence that changes rapidly between low and high density. These patterns are used primarily to stress the ALBO and equalizer circuitry but they will also stress timing recovery. 55 OCTET has fifteen (15) consecutive zeroes and can only be used unframed without violating one’s density requirements. For framed signals, the T1-DALY pattern should be used. Both patterns will force a B8ZS code in circuits optioned for B8ZS.
Bit error rate tester[edit]
A bit error rate tester (BERT), also known as a «bit error ratio tester»[4] or bit error rate test solution (BERTs) is electronic test equipment used to test the quality of signal transmission of single components or complete systems.
The main building blocks of a BERT are:
- Pattern generator, which transmits a defined test pattern to the DUT or test system
- Error detector connected to the DUT or test system, to count the errors generated by the DUT or test system
- Clock signal generator to synchronize the pattern generator and the error detector
- Digital communication analyser is optional to display the transmitted or received signal
- Electrical-optical converter and optical-electrical converter for testing optical communication signals
See also[edit]
- Burst error
- Error correction code
- Errored second
- Pseudo bit error ratio
- Viterbi Error Rate
References[edit]
- ^ Jit Lim (14 December 2010). «Is BER the bit error ratio or the bit error rate?». EDN. Retrieved 2015-02-16.
- ^
Digital Communications, John Proakis, Massoud Salehi, McGraw-Hill Education, Nov 6, 2007 - ^
«Keyboards and Covert Channels»
by Gaurav Shah, Andres Molina, and Matt Blaze (2006?) - ^ «Bit Error Rate Testing: BER Test BERT » Electronics Notes». www.electronics-notes.com. Retrieved 2020-04-11.
This article incorporates public domain material from Federal Standard 1037C. General Services Administration. (in support of MIL-STD-188).
External links[edit]
- QPSK BER for AWGN channel – online experiment







![{displaystyle p_{e}=1-{sqrt[{N}]{(1-p_{p})}}}](https://wikimedia.org/api/rest_v1/media/math/render/svg/f5d380e45b0451c45265e199221fae5bd5b84bf9)
