| title | description | ms.date | ms.topic | helpviewer_keywords | author | ms.author | manager | ms.technology | ms.workload | ||
|---|---|---|---|---|---|---|---|---|---|---|---|
|
Debug using the Just-In-Time Debugger | Microsoft Docs |
Debug using the Just-In-Time Debugger in Visual Studio. Just-In-Time debugging can launch Visual Studio automatically when an app errors or crashes. |
12/13/2022 |
how-to |
|
mikejo5000 |
mikejo |
jmartens |
vs-ide-debug |
multiple |
Debug using the Just-In-Time Debugger in Visual Studio
[!INCLUDE Visual Studio]
Just-In-Time debugging can launch Visual Studio automatically when an app running outside Visual Studio errors or crashes. With Just-In-Time debugging, you can test apps outside of Visual Studio, and open Visual Studio to begin debugging when a problem occurs.
Just-In-Time debugging works for Windows desktop apps. It does not work for Universal Windows Apps, or for managed code that is hosted in a native application, such as Visualizers.
[!TIP]
If you just want to stop the Just-In-Time Debugger dialog box from appearing, but don’t have Visual Studio installed, see Disable the Just-In-Time Debugger. If you once had Visual Studio installed, you may need to disable Just-In-Time debugging from the Windows registry.
Enable or disable Just-In-Time debugging in Visual Studio
[!NOTE]
To enable or disable Just-In-Time debugging, you must be running Visual Studio as an administrator. Enabling or disabling Just-In-Time debugging sets a registry key, and administrator privileges may be required to change that key. To open Visual Studio as an administrator, right-click the Visual Studio app and choose Run as administrator.
You can configure Just-In-Time debugging from the Visual Studio Tools > Options (or Debug > Options) dialog box.
To enable or disable Just-In-Time debugging:
-
On the Tools or Debug menu, select Options > Debugging > Just-In-Time.


[!NOTE]
If the Just-In-Time menu option is not shown, make sure the Just-In-Time debugger is installed using the Visual Studio Installer.
-
In the Enable Just-In-Time debugging for these types of code box, select the types of code you want Just-In-Time debugging to debug: Managed, Native, and/or Script.
-
Select OK.
If you enable the Just-In-Time debugger, but it doesn’t open when an app crashes or errors, see Troubleshoot Just-In-Time debugging.
Disable Just-In-Time debugging from the Windows registry
Just-In-Time debugging may still be enabled even if Visual Studio is no longer installed on your computer. If Visual Studio is no longer installed, you can disable Just-In-Time debugging by editing the Windows registry.
To disable Just-In-Time debugging by editing the registry:
-
From the Windows Start menu, run the Registry Editor (regedit.exe).
-
In the Registry Editor window, locate and delete the following registry entries if they exist:
-
HKEY_LOCAL_MACHINESOFTWAREWow6432NodeMicrosoft.NETFrameworkDbgManagedDebugger
-
HKEY_LOCAL_MACHINESOFTWAREWow6432NodeMicrosoftWindows NTCurrentVersionAeDebugDebugger
:::image type=»content» source=»../debugger/media/dbg-jit-registry.png» alt-text=»JIT registry key» border=»true»:::
-
-
Also delete the following registry entries if they exist:
-
HKEY_LOCAL_MACHINESOFTWAREMicrosoft.NETFrameworkDbgManagedDebugger
-
HKEY_LOCAL_MACHINESOFTWAREMicrosoftWindows NTCurrentVersionAeDebugDebugger
Make sure not to delete or change any other registry keys.
-
-
Close the Registry Editor window.
Enable Just-In-Time debugging of a Windows Form
By default, Windows Form apps have a top-level exception handler that lets the app keep running if it can recover. If a Windows Forms app throws an unhandled exception, it shows the following dialog:

To enable Just-In-Time debugging instead of standard Windows Form error handling, add these settings:
-
In the
system.windows.formssection of the machine.config or <app name>.exe.config file, set thejitDebuggingvalue totrue:<configuration> <system.windows.forms jitDebugging="true" /> </configuration>
-
In a C++ Windows Form application, also set
DebuggableAttributetotruein a .config file or in your code. If you compile with /Zi and without /Og, the compiler sets this attribute for you. If you want to debug a non-optimized release build, however, you must setDebuggableAttributeby adding the following line in your app’s AssemblyInfo.cpp file:[assembly:System::Diagnostics::DebuggableAttribute(true, true)];
For more information, see xref:System.Diagnostics.DebuggableAttribute.
Use Just-In-Time debugging
This example walks you through Just-In-Time debugging when an app throws an error.
-
You must have Visual Studio installed to follow these steps. If you don’t have Visual Studio, you can download the free Visual Studio Community Edition.
-
Make sure Just-In-Time debugging is enabled in Tools > Options > Debugging > Just-In-Time.
For this example, you’ll make a C# console app in Visual Studio that throws a NullReferenceException.
-
In Visual Studio, create a C# console app (File > New > Project > Visual C# > Console Application) named ThrowsNullException. For more information about creating projects in Visual Studio, see Walkthrough: Create a simple application.
-
When the project opens in Visual Studio, open the Program.cs file. Replace the Main() method with the following code, which prints a line to the console and then throws a NullReferenceException:
static void Main(string[] args)
{
    Console.WriteLine("we will now throw a NullReferenceException");
    throw new NullReferenceException("this is the exception thrown by the console app");
}
-
To build the solution, choose either the Debug (default) or Release configuration, and then select Build > Rebuild Solution.
[!NOTE]
- Choose Debug configuration for the full debugging experience.
- If you select Release configuration, you must turn off Just My Code for this procedure to work. Under Tools > Options > Debugging, deselect Enable Just My Code.
For more information about build configurations, see Understanding build configurations.
-
Open the built app ThrowsNullException.exe in your C# project folder (…ThrowsNullExceptionThrowsNullExceptionbinDebug or …ThrowsNullExceptionThrowsNullExceptionbinRelease).
You should see the following command window:
-
The Choose Just-In-Time Debugger dialog opens.
Under Available Debuggers, select New instance of <your preferred Visual Studio version/edition>, if not already selected.
-
Select OK.
The ThrowsNullException project opens in a new instance of Visual Studio, with execution stopped at the line that threw the exception:


You can start debugging at this point. If you were debugging a real app, you would need to find out why the code is throwing the exception.
[!CAUTION]
If your app contains untrusted code, a security warning dialog box appears, enabling you to decide whether to proceed with debugging. Before you continue debugging, decide whether you trust the code. Did you write the code yourself? If the application is running on a remote machine, do you recognize the name of the process? If the app is running locally, consider the possibility of malicious code running on your computer. If you decide the code is trustworthy, select OK. Otherwise, select Cancel.
Troubleshoot Just-In-Time debugging
If Just-In-Time debugging doesn’t start when an app crashes, even though it is enabled in Visual Studio:
-
Windows Error Reporting could be taking over the error handling on your computer.
To fix this issue, use Registry Editor to add a DWORD Value of Disabled, with Value data of 1, to the following registry keys:
-
HKEY_LOCAL_MACHINESoftwareWOW6432NodeMicrosoftWindowsWindows Error Reporting
-
(For 32-bit machines) HKEY_LOCAL_MACHINESoftwareMicrosoftWindowsWindows Error Reporting
For more information, see .WER settings.
-
-
A known Windows issue may be causing the Just-In-Time debugger to fail.
The fix is to add a DWORD Value of Auto, with Value data of 1, to the following registry keys:
-
HKEY_LOCAL_MACHINESoftwareWOW6432NodeMicrosoftWindows NTCurrentVersionAeDebug
-
(For 32-bit machines) HKEY_LOCAL_MACHINESOFTWAREMicrosoftWindows NTCurrentVersionAeDebug
-
You might see the following error messages during Just-In-Time debugging:
-
Unable to attach to the crashing process. The specified program is not a Windows or MS-DOS program.
The debugger tried to attach to a process running under another user.
To work around this problem, in Visual Studio, open Debug > Attach to Process (or press Ctrl + Alt + P), and find the process you want to debug in the Available Processes list. If you do not know the name of the process, find the Process ID in the Visual Studio Just-In-Time Debugger dialog. Select the process in the Available Processes list, and select Attach. Select No to dismiss the Just-In-Time debugger dialog.
-
Debugger could not be started because no user is logged on.
There is no user logged onto the console, so there is no user session to display the Just-In-Time debugging dialog.
To fix this problem, log onto the machine.
-
Class not registered.
The debugger tried to create a COM class that is not registered, probably due to an installation problem.
To fix this problem, use the Visual Studio Installer to reinstall or repair your Visual Studio installation.
See also
- Debugger security
- First look at the debugger
- Options, Debugging, Just-In-Time dialog box
- Security Warning: Attaching to a process owned by an untrusted user can be dangerous. If the following information looks suspicious or you are unsure, do not attach to this process
Hi Muhammad Kashan Khan,
According to the description, please refer to the following steps to troubleshoot this issue:
1). Based on the error message, please make sure that the application platform is the same as the server. If we run 32 bit applications on 64 bit server, we could encounter this issue.
2). Just-In-Time debugging launches Visual Studio automatically when an exception or crash occurs in an application that is running outside Visual Studio. This enables you to test your application when Visual Studio is not running, and begin debugging with
Visual Studio when a problem occurs. Please enable or disable Just-In-Time debugging, refer to this steps:
Run Visual Studio in Administrator->Click Tools menu->Click Options->Select the Debugging folder->select the Just-In-Time page->In the Enable Just-In-Time debugging of these types of code box, select or clear the relevant program types: Managed,
Native, or Script->Click OK.
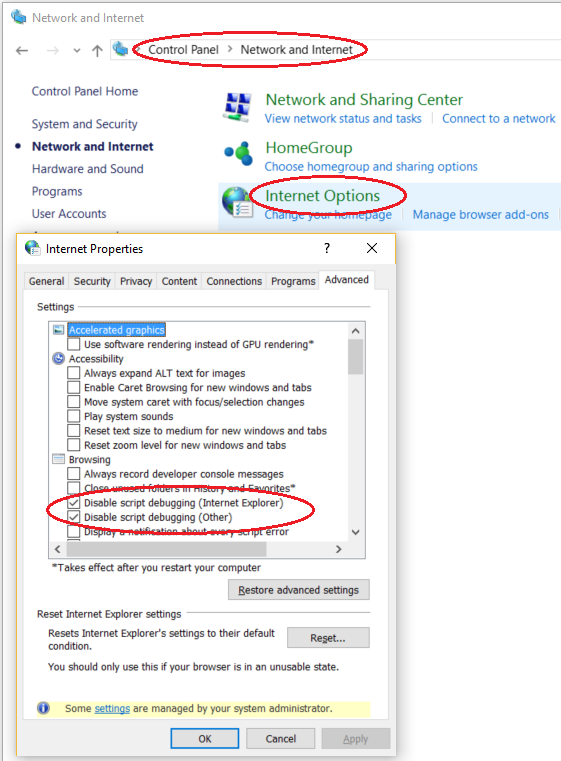
3). We could disable script debugging in Microsoft Internet Explorer and check if the pop-up eliminates. Please refer to the following steps:
Open Internet Explorer->Click on Tools->Click internet options> Choose advanced tab->Under browsing section-> Uncheck «disable script debugging (both others and Internet Explorer) » and «display a notification about every script
error», please refer to the following screenshot:
4). A similar issue appeared in the following link, please refer to Emerick Rogul’s reply to delete certain registry keys in your machine.
http://stackoverflow.com/questions/1893567/how-to-stop-just-in-time-debugging-messages-blocking-a-buildserver
Sincerely,
Oscar
We are trying to better understand customer views on social support experience, so your participation in this interview project would be greatly appreciated if you have time. Thanks for helping make community forums a great place. Click HERE to participate
the survey.
-
Marked as answer by
Sunday, September 11, 2016 5:24 AM
11-09-2010
#1

Registered User
Visual Studio Just-In-Time Debugger Error
Hello everybody I’m in the middle of programming a basic console application that is supposed to be a stock market game for my programming class in c++. I have run into this weird error involving a Visual Studio Just-In-Time Debugger window popping up saying I have a Win 32 unhandled exception even though I am using Code::Blocks 10.05 as my IDE, not Visual C++.
Attachment 10148
Now my whole project is rather long(at least from my point of view) so far but basically what happens is that I have a main function, a class named CStock(which is what the stocks in my game are made from) and then a bunch of other functions that make up different parts of the program (generating a random number, publishing the prices to the console, and some others).
I had started out declaring the different stocks after the Class using their names (Gold, Silver, Beef, etc), but then I wanted to declare them as an array instead so that it would be easier to add or change the amount of stocks I had in the game.
Once I changed to declaring the stocks after the class as an array, however, I got the error. I do not receive the error if I declare the array of stocks during a seperate function (not directly after the class), but then I cannot access the array of stocks in all the functions of my program.
Here Is my code so far and I would greatly appreciate any help/ advice anyone has to offer.
Code:
//This class creates a stock with the initial name and value inputted
class CStock
{
        public:
            int iPrice, iTrend, iChange, iAmountOwned;
            string sStockName;
            CStock();                      //constructor

            void ChangePrice()
            //changes this stock's price
            {
                int iRanNum;
                iRanNum = RandomNumber(-50, 50);
                //iRanNum = (rand() % 101) - 50;
                iPrice+=iRanNum;
                iChange=iRanNum;
                iTrend+=iRanNum;
            };

            void PublishPrice()
            //publishes the current info for this stock
            {
                cout<<sStockName<<" Price: "<<iPrice<<" Change: "<<iChange<<" Trend: "<<iTrend<<endl;
            };

            void Buy(int iAmountToBuy)
            //Buys an amount of stocks for the user
            {
                int iTotalCost;
                //calculates total price
                iTotalCost=iAmountToBuy*iPrice;
                //only buys the stocks if you have enough money too
                if(iUserMoney>=iTotalCost)
                {
                iUserMoney=iUserMoney-iTotalCost;
                iAmountOwned+=iAmountToBuy;
                cout<<endl<<"Money: "<<iUserMoney<<" "<<sStockName<<" Owned: "<<iAmountOwned<<endl;
                }
                else{cout<<endl<<"Get more money you hobo!"<<endl;};
            };

            void Sell(int iAmountToSell)
            //Sells an amount of stocks for the user
            {   //only sells if you input a valid amount to sell
                if(iAmountOwned>0 && iAmountToSell<=iAmountOwned)
                {
                    int iMoneyEarned;
                    //calculates how much money you will earn and adds it to user's total money
                    iMoneyEarned=iAmountToSell*iPrice;
                    //as well as subtracting the amount of stocks that were sold
                    iAmountOwned-=iAmountToSell;
                    iUserMoney+=iMoneyEarned;
                    cout<<endl<<"Money: "<<iUserMoney<<" "<<sStockName<<" Owned: "<<iAmountOwned<<endl;
                }
                else{cout<<endl<<"You cannot sell that many!"<<endl;}   //outputs this message if an invalid amount is tried to be sold

            }

            void SetValues(string InpStockName, int InpPrice, int InpAmountOwned)
            //this function sets the values for the stock
                {
                    sStockName = InpStockName;
                    iPrice = InpPrice;
                    iAmountOwned = InpAmountOwned;
                }
}Stock[4]; //this causes the error when declared here******************************************************************
//CGold("Gold", 1000), CSteel("Steel", 1000), CBeef("Beef", 1000), CWheat("Wheat", 1000), CSilver("Silver", 1000);


//Stock class constructor that sets the values to default before they are specified
CStock::CStock()
        {
            sStockName = "unnamed";
            iPrice = 1000;
            iTrend = 0;
            iChange = 0;
            iAmountOwned = 0;
        };
void SetStockValues()
//this sets the values for all the declared stocks
{
    //CStock Stock[4]; no error when declared here, but only usable within this function**************************************************
    Stock[0].SetValues("Gold", 1000, 0);
    Stock[1].SetValues("Silver", 1000, 0);
    Stock[2].SetValues("Beef", 1000, 0);
    Stock[3].SetValues("Wheat", 1000, 0);
    Stock[4].SetValues("Steel", 1000, 0);
}
edited for linesize and readability. -nv
In this tutorial you ‘ll find instructions to stop the Just-In-Time Debugger dialog box from appearing. The dialog box «Just-In-Time Debugger: An unhandled win32 exception occurred in Outlook.exe» (or at any other program), appears because the reported application in the dialog box, cannot start.

The ‘Choose Just-In-Time Debugger» dialog box, gives you the option to launch Visual Studio to debug the error. But, if the Visual Studio is not installed or it cannot debug the error, the reported application crashes and closes.
If you want to prevent the «Choose Just-In-Time Debugger» dialog from appearing, then you have to disable the Just-In-Time Debugger, by following the instructions below.
How to Stop the Just-In-Time Debugger. *
* Note: If the «Just-In-Time Debugger – An unhandled win32 exception occurred…» dialog box appears when launching Outlook, then, before proceeding to the methods below, apply the following actions:
1. Repair the Outlook PST data file and then open Outlook.
2. Repair the Office installation.
Method 1. Modify the Data Execution Prevention (DEP) to Default Settings.
1. Right click on My PC and select Properties.
2. Click Advanced system settings on the left.

3. At ‘Advanced’ tab click Settings at ‘Performance’ section.

4. At ‘Performance Options’ select the Data Execution Prevention tab.
5. Choose Turn On DEP for Essentials for Essentials Windows programs and services only and click OK.

6. Restart your PC and check if the Just-In-Time Debugger dialog box has stopped appearing.
Method 2. Disable Just-In-Time Debugger in Visual Studio.
If you have the Visual Studio installed, then proceed and disable the Just-In-Time Debugger in Visual Studio. To do that:
1. navigate to Control Panel -> Programs and features.
2. Highlight the Visual Studio and click Change.

3. On a new opened window choose the Individual Components tab.
4. Uncheck the Just in Time Debugger and click Modify.

Method 3. Disable the Just-In-Time Debugger from Registry.
1. Open Registry editor. To do that:
1. Press Windows
+ R keys to open the run command box.
2. In the «Open» box, type: regedit & click OK.

2. Find and Delete the following registry entries (in bold letters):
- HKEY_LOCAL_MACHINESOFTWAREMicrosoft.NETFrameworkDbgManagedDebugger
- HKEY_LOCAL_MACHINESOFTWAREMicrosoftWindows NTCurrentVersionAeDebugDebugger

3. If you have 64-bit Operating System, delete also the following registry entries (in bold letters):
- HKEY_LOCAL_MACHINESOFTWAREWow6432NodeMicrosoft.NETFrameworkDbgManagedDebugger
- HKEY_LOCAL_MACHINESOFTWAREWow6432NodeMicrosoftWindows NTCurrentVersionAeDebugDebugger
4. Close Registry Editor and restart the computer.
5. After restart the «Just-In-Time Debugger – An unhandled win32 exception occurred…» will disappear.
* Note: If the Just-In-Time Debugger dialog box, still appears, navigate to Control Panel -> Programs and features and uninstall the Microsoft Visual Studion 2010 Shell (Isolated).
That’s all folks! Did it work for you?
Please leave a comment in the comment section below or even better: like and share this blog post in the social networks to help spread the word about this solution.
If this article was useful for you, please consider supporting us by making a donation. Even $1 can a make a huge difference for us.

Issue:
When launching an AutoCAD product, it freezes and generates the error:
Application does not support just-in-time (JIT) debugging. Contact the application author for more information.
Causes:
Just-In-Time debugging is a feature that launches the Visual Studio debugger automatically when a program, running outside Visual Studio, encounters a fatal error. Just-In-Time debugging allows you to examine the error before the application is terminated by the operating system. The Visual Studio debugger does not need to be running when the error occurs.
Solution:
Microsoft offers a solution to resolve this issue on Microsoft Community
- Enable/disable Just-In-Time debugging in Microsoft Visual Studio:
- Go to ‘Tools’ then ‘Options’.
- In the ‘Options’ dialog box, select the ‘Debugging’ folder.
- In the ‘Debugging’ folder, select the «Just-In-Time» page.
- In the ‘Enable Just-In-Time’ debugging of these types of code box, select or clear the relevant program types: ‘Managed’, ‘Native’, or ‘Script’.
Note: To enable or disable Just-In-Time debugging, you must be running running Administrator privileges. Enabling or disabling Just-In-Time debugging utilizes the registry key, and Administrator privileges are required to change that key.
- Click ‘OK’.
- In the event Visual Studio is not installed, disable script debugging in Microsoft Internet Explorer then check if the pop-up is eliminated:
- Open ‘Internet Explorer’.
- Click on ‘Tools’ then ‘Internet Options’ then the ‘Advanced’ tab.
- Under the ‘Browsing’ section, uncheck the following:
- Disable script debugging (Internet Explorer).
- Disable script debugging (Other).
- Display a notification about every script error.
If disabling Just-In-Time Debugging does not resolve the issue:
- Examine the exception error more closely to discover which application the exception is being thrown and the troubleshooting directions the error gives.
- If an error of «Fatal Error: Unhandled e0434352h Exception at… » occurs with the JIT error, do the following troubleshooting steps (see: «FATAL ERROR: Unhandled e0434352h Exception at…» when starting AutoCAD products).
- Uninstall then reinstall the application (for AutoCAD products, (see Recommended uninstall and reinstall procedures for AutoCAD).
- For non-Autodesk (third party) components or add-ons, contact the author of that application for further assistance. For example, the exception may be seen with Microsoft .NET or third party add-ins installed in the AutoCAD product.
See Also:
- Unhandled exception JIT-debugger error comes up when AutoCAD is launched or when opening Layer Properties Manager
- WSCommCntr4.exe causes AutoCAD to become unresponsive
- Dual monitor and video configurations for AutoCAD
Products:
AutoCAD Products;
Scott Hanselman
How to turn off/disable the .NET JIT Debugging Dialog
A day may come when you want to turn off the Debug dialog that appears when a .NET program has an unhandled exception.
Option 1: Registry key from Enabling JIT Debugging
- If value = 0, prompt the user by means of a message box. The choices are:
- Continue. This results in a stack dump and process termination.
- Attach a debugger. In this case, the runtime spawns the debugger listed in the DbgManagedDebugger registry key. If none, control is returned, and the process is terminated.
Option 2: If you want to disable the JIT debug dialog, but still want an error dialog:
Visual Studio.NET|Tools|Options|Debugging|Just-In-Time and deselect «Common Language Runtime» and now you’ll get an OK/Cancel dialog instead of the select a Debugger Dialog. Note: The registry entry from Option 1 above will need to be 0 for the dialog to show up.
Thanks to Eric Deslauriers of Corillian QA for these tips!
About Scott
Scott Hanselman is a former professor, former Chief Architect in finance, now speaker, consultant, father, diabetic, and Microsoft employee. He is a failed stand-up comic, a cornrower, and a book author.
Hosting By

Как остановить сообщения «Just In Time Debugging», блокирующие buildserver
наш buildserver (TeamCity, очень рекомендуется) запускает целую кучу тестов на нашей готовой программе c++.
один раз в целом тест вызывает сбой нашей программы, часто вызывая диалог VisualStudio, предлагающий мне justintime отладить сбой. Диалог останавливает продвижение buildserver. Вместо сборки, отмеченной как failed, она просто зависает. Я отключил функцию отладки Just In Time в VisualStudio, но когда она отключена, вы все равно получаете сообщение «не удалось Justintime отладить это, вы можете включить его в настройках».
кто-нибудь знает способ гарантировать, что любое необработанное исключение в программе не приведет к модальному диалогу?
5 ответов
-
HKEY_LOCAL_MACHINESOFTWAREMicrosoftWindows NTCurrentVersionAeDebugDebugger
-
HKEY_LOCAL_MACHINESOFTWAREMicrosoft.NETFrameworkDbgManagedDebugger
-
HKEY_LOCAL_MACHINESOFTWAREWow6432NodeMicrosoftWindows NTCurrentVersionAeDebugDebugger
-
HKEY_LOCAL_MACHINESOFTWAREWow6432NodeMicrosoft.NETFrameworkDbgManagedDebugger
удалить (или переименовать) c:windowssystem32vsjitdebugger.исполняемый.
Я попытался удалить ключи реестра, и я попытался снять все флажки в параметрах Visual Studio, но ни один из них не работал.
чтобы быть ясным, моя ситуация не была C++. Я использовал Micro Focus COBOL для Visual Studio 2010, и с помощью предложений реестра и параметров VS мне удалось избавиться от «хотите отлаживать?»диалог, но это привело к другому диалогу, чтобы задержать мой автоматический процесс:
Visual Studio Just-In-Time Debugger
необработанное исключение (‘COBOL runtime: обнаружена ошибка’) произошло в CASDBC.exe [3564]. Отладка Just-In-Time это исключение завершилось со следующей ошибкой: не установлен отладчик только в режиме отладки. В Visual Studio, Просто-В-Время отладка может быть включена из Tools/Options/Debugging / Just-In-Time.
Проверьте индекс документации для » Just-in-time отладки, ошибки для подробная информация.
в моем случае, на сервере win2012, я попробовал:
- удаление ключей реестра
- удаление exe для отладчика jit из c:windowssystem32
и он все-таки подошел!
Я перезагрузился и т. д. Делал мой веб-сайт в IIS stall, пока диалог не был подтвержден!
окончательное решение, которое действительно работало: в панели управления, в программах: удален «Microsoft Visual Studion 2010 Shell (Isolated)» удалил это, и проблема разрешенный.
(работает ли среда SQL Management Studio. Я не знаю!)
в окне для вопроса
вы хотите отлаживать с помощью выбранного отладчика?
клик да (откроется в новом окне) > опции (Меню верхнего ряда)> DEBUG
затем в новом окне удалить ТИК который показывает ВКЛЮЧИТЬ КАК РАЗ ВОВРЕМЯ ОТЛАДЧИК. После отключения как раз вовремя отладчик закройте окно или нажмите OK Ваш проблема будет решена. Я пробовал это и избавился от КАК РАЗ ВОВРЕМЯ ВСПЛЫВАЮТ сообщения.
лучшее решение этой проблемы настолько просто 2 шага, чтобы сделать это откройте командную строку введите : regedit перейдите к пути—>HKEY_LOCAL_MACHINE—>программное обеспечение—>Microsoft—>Windows NT—>CurrentVersion—>AeDebug Теперь вы можете найти файл : отладчик щелкните правой кнопкой мыши , изменить скопируйте и вставьте этот текст в нем:
Диалоговое окно JIT-отладки может открываться при возникновении ошибок в используемом приложении, препятствуя его работе.
JIT-отладчик позволяет быстро запустить Visual Studio для устранения ошибки. Для просмотра подробных сведений об ошибке или попытки отладки нужно установить среду Visual Studio или другой отладчик.
Если вы уже являетесь пользователем Visual Studio и после возникновения ошибки намерены выполнить отладку с помощью JIT-отладчика, перейдите к этой статье. Если вам не удается исправить ошибку или вы хотите запретить открытие JIT-отладчика, вы можете отключить JIT-отладку из Visual Studio.
Если набор средств Visual Studio был ранее установлен, но теперь его нет, придется нужно будет JIT-отладку через реестр Windows.
Если набор средств Visual Studio не установлен, для отключения JIT-отладки можно отключить отладку скриптов или отладку на стороне сервера.
Если вы пытаетесь запустить веб-приложение, отключите отладку скриптов.
Для этого откройте раздел Панель управления Windows > Сети и Интернет > Свойства обозревателя, а затем выберите элементы Отключить отладку скриптов (Internet Explorer) и Отключить отладку скриптов (другие) . Конкретные действия и параметры зависят от используемых версий Windows и браузера.
Если вы размещаете веб-приложение ASP.NET в IIS, отключите отладку на стороне сервера, выполнив следующие действия:
- В режиме просмотра компонентов диспетчера IIS в разделе ASP.NET дважды щелкните Компиляция .NET или выберите этот элемент и щелкните команду Открыть компонент в области Действия.
- В разделе Поведение > Отладка выберите значение False. В более ранних версиях IIS используется другой процесс.
Возможно, отключение JIT-отладки позволит приложению преодолеть ошибку и работать нормально.
Если необработанная ошибка в приложении сохранится, может отобразиться сообщение об ошибке либо приложение может перестать отвечать или аварийно завершить работу. В этом случае нормальная работа приложения будет невозможна без исправления ошибки. Попробуйте связаться с теми, кто отвечает за это приложение, и попросить исправить ошибку.